
Abstract
The feature extraction of Gaofen-2 Remote Sensing Image (RSI) has problems such as poor extraction accuracy and large noise reduction error. Therefore, this paper designs an RSI feature extraction method based on high score 2 wavelet transform (WT). The RSI is collected with the help of Gaofen-2 satellite and high-resolution remote sensing technology, the key points of the image are determined through the Gaussian difference scale space, and the key points of the edge are judged by the peak curvature value of the difference function at the edge junction, so as to complete the RSI acquisition. Specific filtering and spatial domain transformations are used to remove image noise and improve the quality of RSI. The mean shift (MS) algorithm is used to iteratively find the area with the most dense sample points in the RSI space, complete the image analysis, and realize the preprocessing of the high score 2 RSI. The linear features of the RSI are determined by the WT algorithm, and the image threshold is set for feature extraction of the high score 2 RSI. The experimental results show that in the RSI noise reduction error analysis of different methods, the noise reduction error curve of the sample RSI of the method proposed in this paper has the lowest trend, which is always lower than 2%. Compared with the two methods proposed before, the error is higher. At the same time, in the accuracy analysis of key point feature extraction, the proposed scheme has better accuracy. Therefore, it can be seen that this method has better comprehensive performance, and the proposed method can effectively improve the feature extraction accuracy of RSI and reduce the noise in RSI.
Keywords
Introduction
Remote sensing technology is a science and technology that collects data of target objects through remote sensors, and obtains information on ground objects, regions or phenomena through data analysis [1]. Numerous studies have shown that all ground objects are constantly emitting, reflecting and absorbing electromagnetic waves, and different objects have different electromagnetic wave properties. Remote sensing technology uses this feature to detect ground objects, and obtain its information in a long-distance and non-contact way for processing, so as to realize the positioning, qualitative and quantitative description of ground objects. Due to the wide coverage of remote sensing technology, the periodicity of data collection and the abundance of data, it has become an important means of national information research. How to classify RSI effectively is an important part of obtaining geographic information [2]. Today’s Earth observation system has the characteristics of multi-platform, multi-angle and multi-sensor [3]. The obtained Earth observation data has the characteristics of high spatial resolution, high spectral resolution and high temporal resolution. Take the spatial resolution as an example, increasing from 30 meters for Landsat series satellites and 10 meters for point satellites to 0.61 meters for Q ouickbird satellites and 0.31 meters for Worldview
Gaofen2 RSI has brought many conveniences to the fields of ground object extraction and classification, target recognition and detection, change detection, etc., there are still some defects such as the same guiding spectrum, the same foreign matter spectrum, relatively lower spectral resolution and temporal resolution, spatial and temporal resolution. The improvement of resolution leads to the sharp increase of image data, which reduces the efficiency of data processing and storage, etc. [6]. During RSI analysis, not every feature can well discriminate and predict the object to be classified. Redundant or irrelevant features are not only useless for classification, but may also reduce the classification accuracy and computational efficiency of learning algorithms. It is necessary to filter out a representative subset of features from the original feature set for classification. This process can be called feature selection. Therefore, feature selection aims to extract relevant features and remove redundant and irrelevant features, so as to improve the learning efficiency and classification accuracy of the classification model. The research of feature selection mainly starts from the following two aspects. One is the generation of feature subsets, which refers to searching the complete feature set through a specific search strategy to obtain the subset to be selected. The second is the evaluation of feature subsets, that is, to evaluate the performance of feature subsets through certain evaluation criteria [7]. Therefore, in order to improve the quality of High Score 2 RSI, many researchers have studied the characteristics of its RSI and designed many feature extraction methods.
Hao et al. [8] proposed a method to automatically extract control points from the Gaofen-2 satellite RSI. Considering that neither traditional manual methods nor semi-automatic methods can achieve fast and effective control point extraction, an efficient and automatic control point extraction method for Gaofen-2 satellite imagery is proposed. The feature points are solved by Harris algorithm and location-based matching algorithm. Error elimination is performed using the RANSAC (Random Sampling Consistency) algorithm. The optimal solution is obtained by applying least squares matching (LSM), and the geometric correction of the Gaofen-2 satellite image is performed to achieve a better correction effect. The experimental results show that the algorithm can achieve fast and effective control point extraction, which can be used to control point extraction and geometric correction of high-resolution satellite data. Shi et al. [9] designed a method to automatically extract and optimize pseudo-invariant features in relative radiometric correction of high-scoring RSIs. In view of the requirements of relative radiometric correction in high-score RSI change detection, this study proposes a process and method for automatic extraction and optimization of PIF (Path-Inference-Filter, PIF): First, calculate the brightness, spectral characteristics and spatial characteristics of the two change vector. Then, the pixel values of each change vector are sorted from low to high, and the PIF is extracted after majority voting, and finally – the final PIF is selected by the method of “removing outliers by iterative linear regression”.
Aiming at the shortcomings of RSI feature extraction of gaofen-2 satellite, such as low accuracy, high cost and long time consumption, a new RSI feature extraction method based on WT algorithm is designed. The main technical routes of this research are as follows:
Step 1: Collect RSI with the help of Gaofen-2 satellite and high-resolution remote sensing technology, determine image key points through Gaussian difference scale space, and use the curvature value of the difference function peak to determine edge key points. edge junction, thus completing the RSI acquisition. Step 2: Use specific filtering and transforming to spatial domain methods to remove image noise, enhance the quality of RSI, and use MS algorithm to iteratively find the area with the most dense sample points in RSI space, complete image analysis, and achieve high score 2 RSI prediction. deal with. Step 3: Determine the linear features of RSI with the help of the WT algorithm, and set the image threshold for high score 2 RSI feature extraction. The fourth step: experimental analysis. Step 5: Conclusion.
RSI acquisition and preprocessing of high score 2
High score 2RSI acquisition
High-resolution remote sensing is a remote sensing technology that requires high quality and quantity of remote sensing data. Only high-quality data can achieve high-precision extraction. In recent years, the quality and accuracy of high-scoring series images in my country have been continuously improved. The high score 2 image can provide a more comprehensive data source for government management, land economy, land management, cultivated land remediation, traffic management, ecological environmental protection, etc., and provide timely technical support for the adjustment of land use structure [10, 11]. The acquisition of the Gaofen-2 RSI is mainly carried out through the Gaofen-2 satellite. Among them, the technical indicators of the payload of the Gaofen-2 satellite are shown in Table 1.
Gaofen-2 payload technical specifications
Gaofen-2 payload technical specifications
The Gaofen-2 satellite is my country’s first high-quality meter-level civilian optical satellite. The multispectral image resolution is 4 m, and the satellite panchromatic image resolution is 1 m. The wide-spectrum multispectral camera of the Gaofen-2 satellite has a width of 45 kilometers [12]. Making full use of high-resolution RSI is of great significance to land use planning, land resource management, and structural adjustment. Based on the RSI collected by the Gaofen-2 satellite, the Gaofen-2 RSI was obtained by scanning and collecting image information using the Gaofen remote sensing technology. The collection process is shown in Fig. 1.
Framework diagram of Gaofen 2 RSI acquisition process.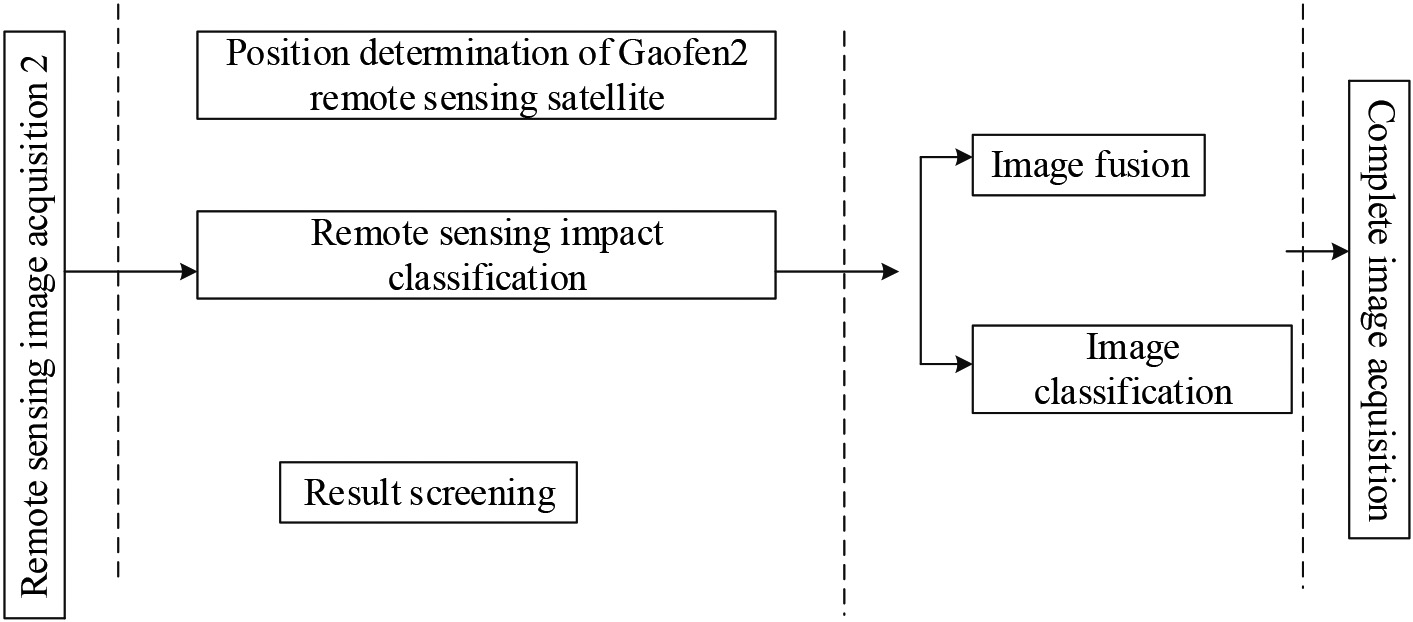
According to the RSI collected by high-resolution remote sensing technology, under normal lighting conditions, the distribution of RSI feature points is stable, and under complex lighting conditions, the feature points show unstable changes. In order to ensure the accuracy of the feature extraction results, the local key points of the high score 2 RSI should be determined, and the local extreme points or attribute mutation points in the image should be used as the key points of the image, and the Gaussian difference scale should be used to extract the point space [13], the extraction process is shown in Fig. 2.
Determination of local key points of high score 2 RSI.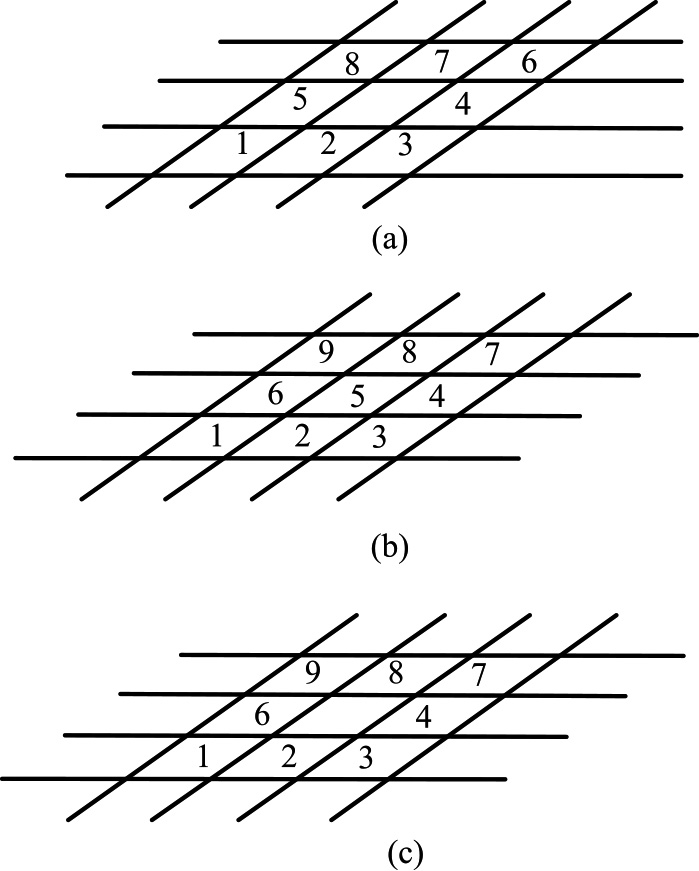
Taking the lowest layer as an example, the Gaussian difference scale space compares the adjacent points in the non-outer layer with points 2 and 6 in the figure respectively, and calculates the difference scale value of this point in the Gaofen2 RSI. The calculation formula is:
where
Compute points 2 and 6 that are adjacent to this point. When the value of the point is maximum or minimum, it is a local key point. If the adjacent points of the point have larger values, the calculation point is reselected until a stable extremum that meets the requirements is extracted. In order to avoid the instability of edge feature points caused by Gaussian processing, when determining the key points of the image, the unstable edge feature points are eliminated, and the curvature value of the peak value of the difference function is used to determine the edge connection points of the edge key points [14], and calculate the curvature.
where
According to the above calculations, the local keypoints in the high score 2 RSI are determined. In the acquisition of Gaofen-2 RSI, RSI was collected with the help of Gaofen-2 satellite and high-resolution remote sensing technology. The key points of the image are determined by the Gaussian difference scale space, and the edge key points are judged by the curvature value of the peak value of the difference function at the edge connection, so as to complete the RSI acquisition.
In order to improve the effectiveness of Gaofen2 RSI feature extraction, there is a lot of noise in the Gaofen2 RSI acquisition process, which affects the effective extraction of subsequent features. Therefore, this chapter needs to preprocess the RSI, effectively enhance and segment the RSI, and provide data support for the subsequent key feature extraction.
Image denoising algorithms are not only based on the spatial domain, but also on the frequency domain. Since the noise is mainly concentrated in the higher frequency part, the noise removal in the frequency domain is mainly to remove the high frequency signal. Compared with the spatial domain, the frequency domain denoising algorithm utilizes the corresponding relationship between the frequency components and the outside world, and can solve tasks that are difficult to express in the spatial domain. Second, filtering is more intuitive in the frequency domain than in the spatial domain. Mainly, image processing in the frequency domain can be transformed into effects in the spatial domain through specific filters and transforms [15]. The low-pass filter
where
where
According to the denoised image above, the quality of the RSI suffers in terms of noise reduction. Therefore, the denoised RSI should be enhanced. Assuming that the original image is
In the formula,
For color RSI, the image gradient should be the sum of the gradients of the three RGB channels.
In the formula,
In the formula, the
RSI segmentation is a key link in the information extraction process. The accuracy of the segmentation results will directly affect the process of feature extraction and subsequent image classification. In the RSI imaging process, the random noise generated by the spectrometer is relatively large, which will be disturbed by random factors such as terrain. In order to avoid the problems caused by these interferences, this paper uses the MS algorithm to iteratively find the area with the most dense sample points in the RSI space, and effectively segment the RSI. The segmentation result is expressed as follows:
where
According to the above calculation results, the dimension of RSI and the color distribution and spatial distribution of eigenvectors are obtained to complete the accurate segmentation of RSI. Figure 3 shows the segmentation map.
RSI segmentation process.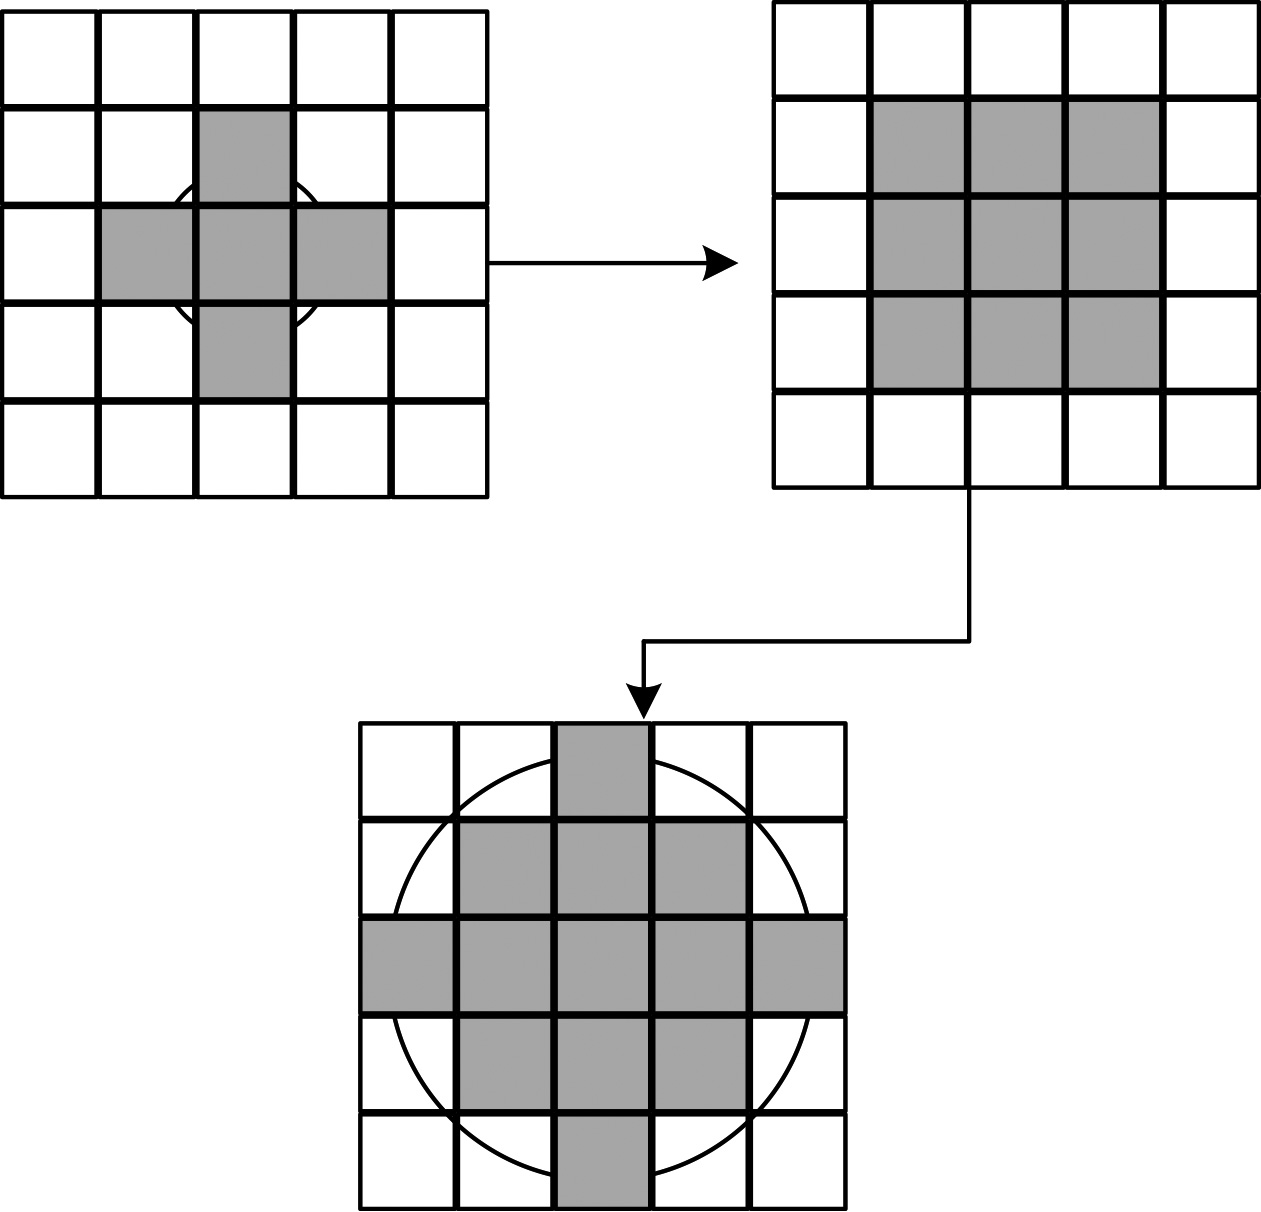
In the preprocessing process of High Score 2 RSI, specific filtering and spatial domain transformation are used to remove image noise and improve RSI quality. The MS algorithm is used to iteratively find the area with the most dense sample points in the RSI space, complete the image analysis, and realize the preprocessing of the high score 2 RSI. Through the above method, the RSI acquisition and preprocessing of the high score 2 can be realized.
Recently, WT techniques have been widely used in image denoising. The principle of wavelet denoising can be regarded as a mathematical function approximation problem, that is, in the spread function space of the original wavelet generating function. The proposed metric is used for extended function mapping, which can better approximate the original signal and complete the noise signal discrimination [19]. From a signal science point of view, wavelet denoising is a filtering problem, and it has a better denoising effect than traditional filters while maintaining the integrity of the original signal. On the basis of its own advantages, wavelet denoising has achieved remarkable results in denoising by using the characteristics of dry WT. The wavelet characteristics are as follows:
Low entropy: Since the coefficient distribution after wavelet decomposition is sparse, the entropy of the processed image will decrease. Multi-resolution: Through the multi-resolution method, the image noise signal can better characterize the non-stationary signals such as edges, breakpoints and spikes of the image signal. Decorrelation: WT can remove the interference of correlated signals on the image. Conversely, the wavelet domain works better than the time domain. Flexibility of base selection: wavelet base selection will affect image denoising to a certain extent. WT can realize the reasonable selection of image wavelet base in combination with various environmental factors, so as to achieve the maximum denoising effect.
A wavelet is a function of local fluctuations: Let
where
Translating the wavelet
In the formula
Based on the above WT, this paper extracts the RSI features of high score 2. Given the basic wavelet function,
As mentioned above, WT can be expressed as the
In RSI, the threshold for change should be determined. The threshold function has a significant impact on image feature extraction in WT, ie coefficient selection. The high-frequency wavelet coefficients are processed by threshold, and the threshold function expression is added to the threshold. The coefficient processing method is determined by comparing the magnitude of the wavelet coefficient’s modulus with the optimal threshold, that is, calculating different coefficients with different threshold function expressions, and finally retaining the reconstruction. The calculation formula of the determined hard threshold function is:
where
where
Compared with the hard threshold function, the soft threshold function introduces a new coefficient
Schematic diagram of the threshold function image.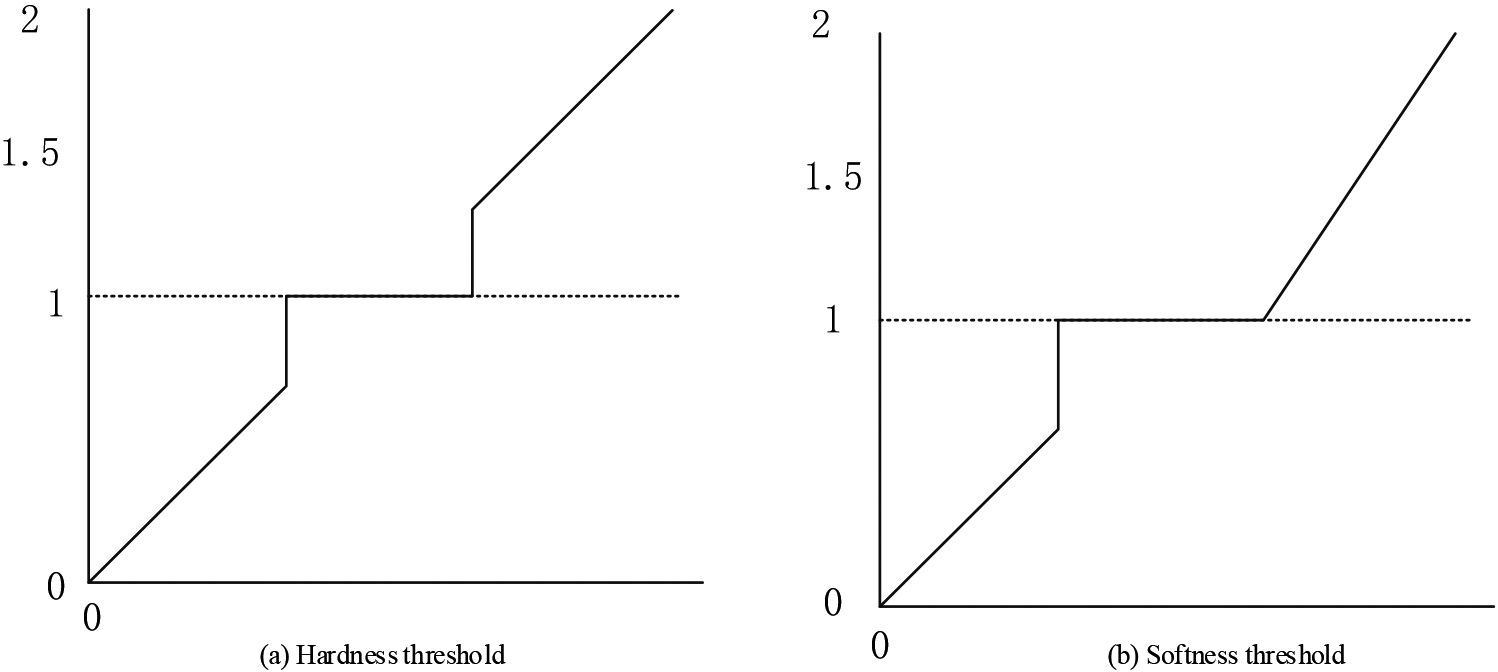
After the threshold is determined, the continuous WT has another attribute translation and scaling. If it
Experimental program
In order to verify that the proposed method can effectively extract the features of high score 2 RSI, an experimental analysis is carried out. The test platform is Win7, Intel i7 series processor, and the running memory is 32 G. Among them, the Gaofen2 RSI in the MySQL database is selected as the research sample image. The image size is 1124*1124, and the pixels are clear, which meets the experimental requirements. RSI extracts a bird’s-eye view of a place. The specific high score 2 RSI is shown in Fig. 5.
In order to facilitate the experiment, the sample RSI determined in the experiment is fused to clearly understand the information in the image. The specific fusion sample RSI is shown in Fig. 5b.
Before the experiment, Pieortho satellite image mapping processing software was used to simulate the information extraction process required for the experiment. Pieortho can quickly complete the automatic extraction of connection points and control points, realize stream batch processing of information data, and ensure that the automatic matching accuracy of points with the same name between images of different sources, different phases and different resolutions reaches sub-pixel level. The point is determined by the computer. The extraction of key point features is selected as the research object of experimental analysis. Figure 6 shows the experimental key points of the setup.
The specific experimental parameters set in the experiment are shown in Table 2.
Experimental parameter settings
Experimental parameter settings
Example RSI.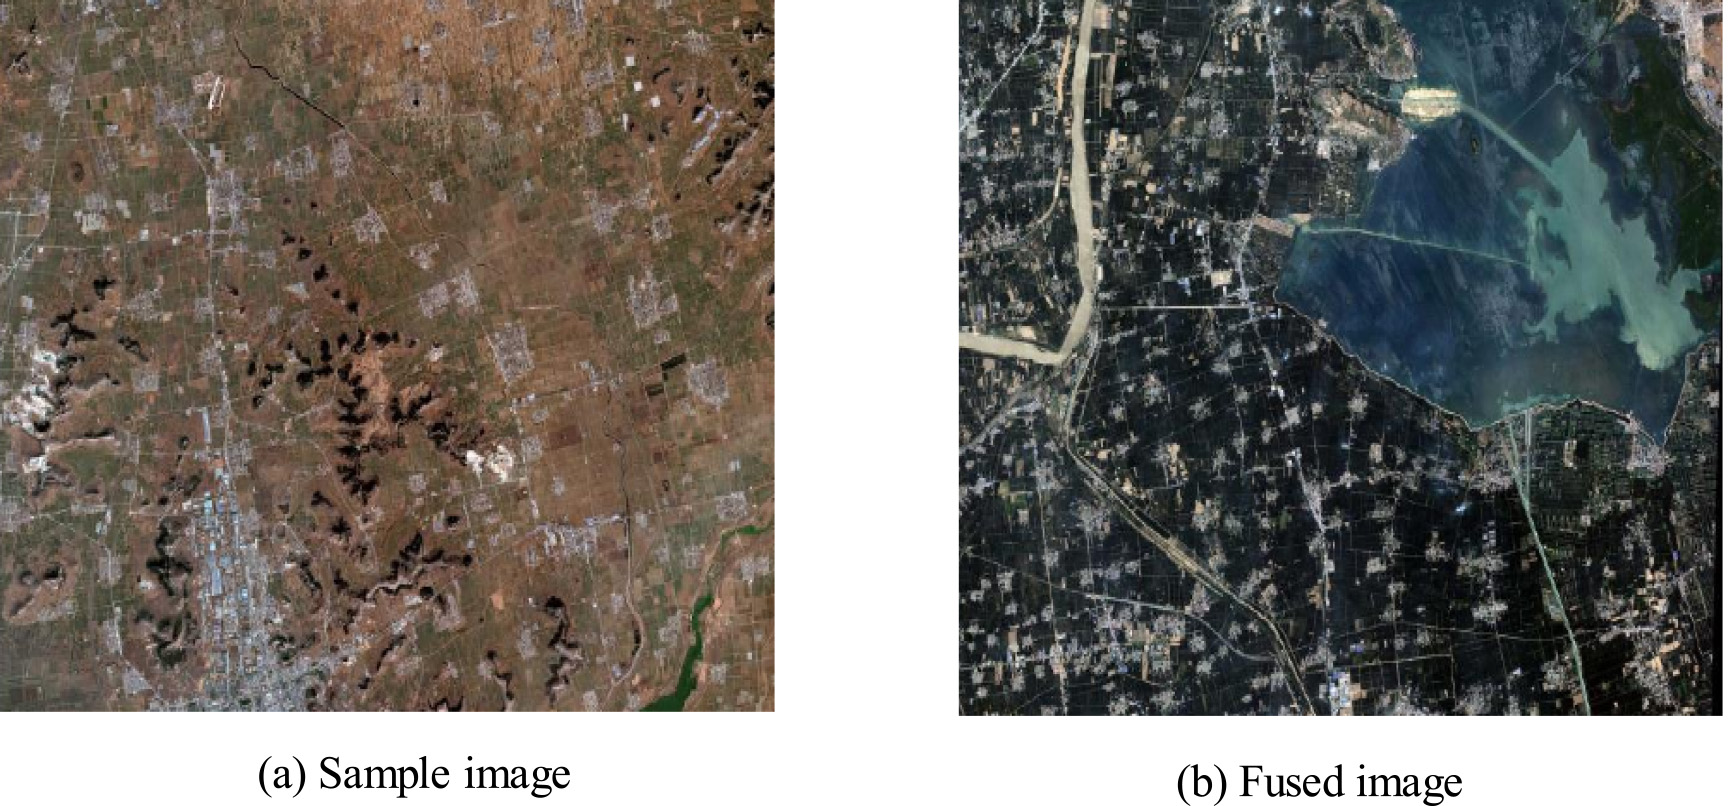
Schematic diagram of key point feature setting of sample image.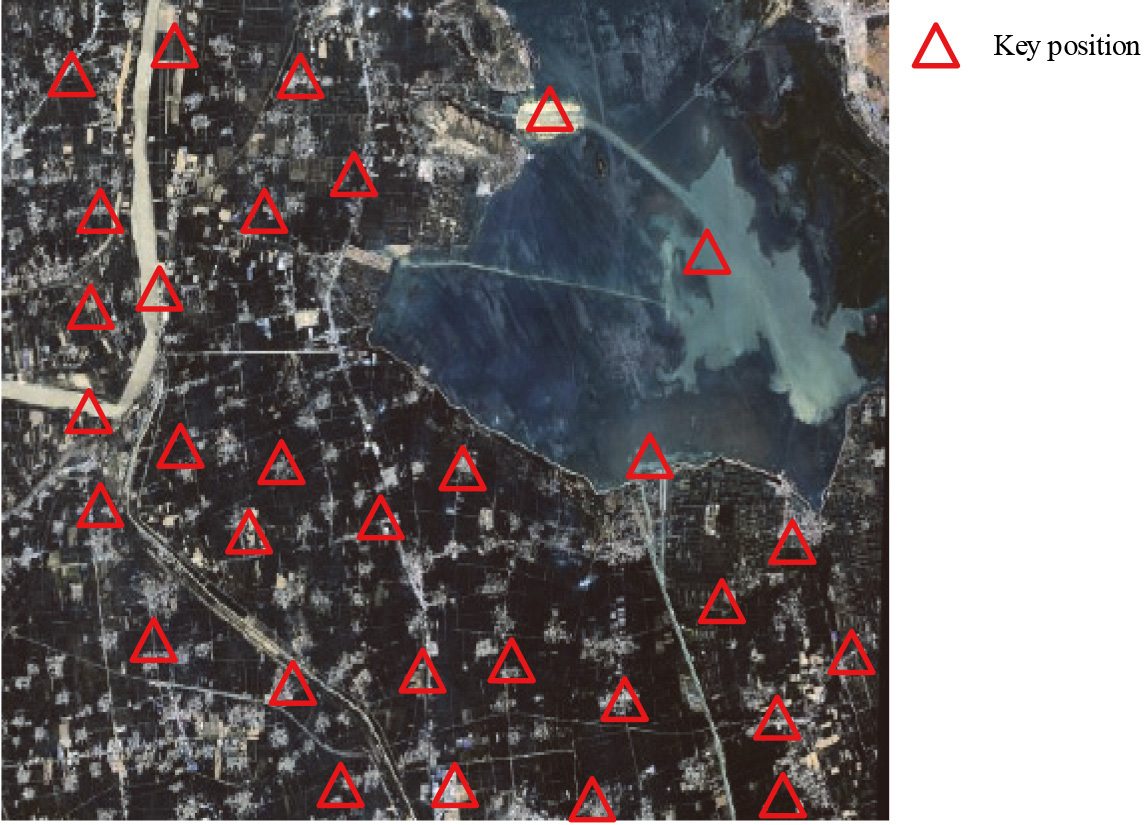
Formal method comparisons are performed in this study, in the Literature [8] and in the Literature [9] according to the set of experimental protocols. Take the feature image of the sample set as the experimental object. The keypoint feature extraction accuracy, noise reduction error and feature extraction time cost of sample RSI are compared respectively. The results meet the experimental requirements.
The key point features extracting of the sample RSI was first analyzed by Hao et al. [8] and Shi et al. [9]. A method of automatically extracting control points, which uses Harris algorithm and geographic location-based matching algorithm to solve feature points. The RANSAC algorithm is used for error elimination. The algorithm can achieve fast and efficient control point extraction, which can be used to control point extraction and geometric correction of high-resolution satellite data. However, this method has a certain error in the feature extraction of Gaofen-2 satellite RSI. Shi et al.’s study [9] is a method to automatically extract and optimize pseudo-invariant features in the relative radiometric correction of high-score RSI, by calculating the change vectors of the brightness, spectral features and spatial features of the two. Then, the pixel value of each change vector is sorted from low to high, and the PIF is extracted after majority voting, and finally – the final PIF is selected by the method of “removing outliers by iterative linear regression”. Although the accuracy of this method for extracting features is very high, the RSI of the second satellite. However, the feature extraction process of this method is costly and time-consuming. Extraction accuracy is a key value that directly reflects the effectiveness of feature extraction. When the value is close to 100%, the accuracy of feature extraction will be higher, and the performance of the proposed method will be better. The results of the extraction accuracy of key point features of RSI samples obtained by this method and the methods proposed in Literature [8] and Literature [9] are shown in Fig. 7.
Accuracy analysis of RSI keypoint feature extraction by different methods.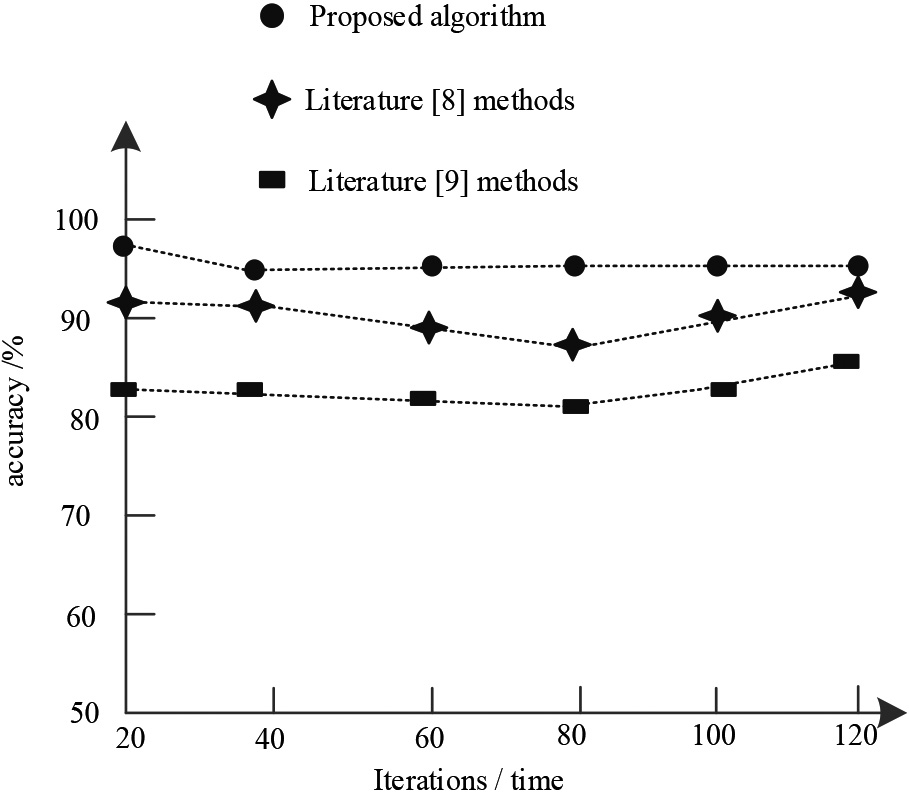
According to the analysis of the experimental results in Fig. 7, with the continuous change of the extraction times, this method and the methods proposed in Literature [8] and Literature [9] have certain changes in the accuracy of the feature extraction of sample RSI key points. When the number of iterations is 60, the RSI keypoint feature extraction accuracy of this method is about 95%, and the keypoint feature extraction accuracy of the RSI samples proposed by the methods in Literature [8] and Literature [9] is about 90%, respectively and 81%; at this time, when iterating 100 times, the RSI keypoint feature extraction accuracy of the proposed method is about 95%, and the RSI sample keypoint feature extraction accuracy of the methods proposed in Literature [8] and Literature [9] are about 91% and 82%, respectively; in contrast, the proposed method achieves higher extraction accuracy than these two methods. The reason is that the proposed method uses wavelet changes in feature extraction to determine its linear features, which is more efficient than general methods and improves the performance of the method.
In the experiment, the method proposed in this paper, the method proposed in the Literature [8] and the Literature [9] are analyzed, and the noise reduction error of the RSI is analyzed. Image noise reduction is the main factor affecting key feature extraction. Therefore, the experimental analysis of the noise reduction error of the three methods is carried out for the sample RSI, and the results are shown in Fig. 8.
RSI noise reduction error analysis of different methods.
Figure 8 shows the analysis results of RSI noise reduction error of different methods. The method proposed in this paper has certain differences in RSI noise reduction error with the methods proposed in Literature [8] and Literature [9]. Among them, the noise reduction error curve of the sample RSI of the proposed method has the lowest trend, which is always lower than 2%. Compared with the two methods proposed in Literature [8] and Literature [9], the error is higher. Therefore, it can be seen that this method has a good noise reduction effect. This is because the image noise is removed by specific filtering and transformation to the spatial domain, the quality of the RSI is enhanced, and the MS algorithm is used to iteratively find the area with the most dense sample points in the RSI space to complete the image analysis, thereby improving the proposed method. effectiveness of the method.
In order to better verify the effectiveness of the proposed scheme, the experiment further analyzes the time cost of sample RSI feature extraction of this method and the methods proposed in Literature [8] and Literature [9]. The result is shown in Fig. 9.
Comparison of feature extraction time cost of sample RSI of different methods.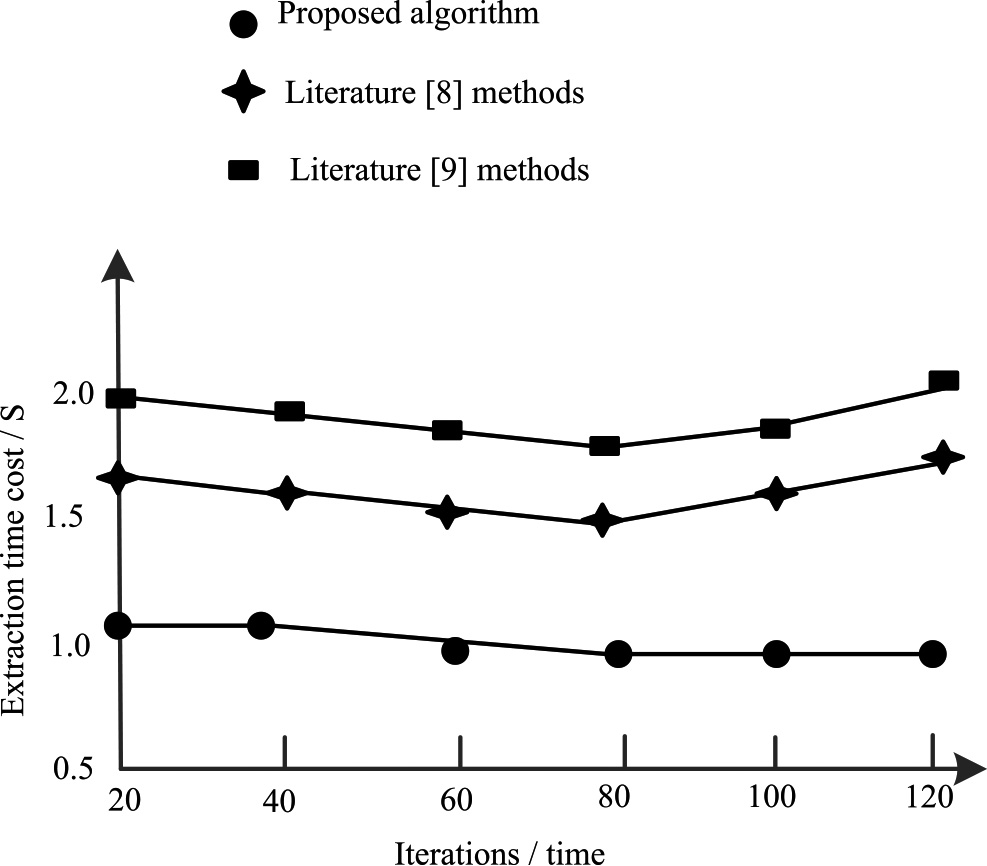
According to the analysis of the experimental results in Fig. 9, the time cost of feature extraction for sample RSI using this method is different from the methods proposed in Literature [8] and Literature [9]. From the trend of the curve, it can be seen that the method proposed in this study has the shortest time cost, followed by the method proposed in Literature [8], and finally the method proposed in Literature [9]. This proves that the method proposed in this study is more comprehensive, has better performance, and is more in line with the feature extraction requirements of satellite remote sensing images.
In this study, a feature extraction method based on RSI of high-scoring WT was designed. The RSI is collected with the help of Gaofen-2 satellite and high-resolution remote sensing technology, the key points of the image are determined through the Gaussian difference scale space, and the key points of the edge are judged by the curvature value of the difference function peak at the edge junction, so as to complete the RSI acquisition. Specific filtering and spatial domain transformations are used to remove image noise and improve the quality of RSI. The MS algorithm is used to iteratively find the area with the most dense sample points in the RSI space, complete the image analysis, and realize the preprocessing of the high score 2 RSI. The linear features of the RSI are determined by the WT algorithm, and the image threshold is set for feature extraction of the high score 2 RSI. The experimental results show that in the analysis of the accuracy of RSI key point feature extraction by different methods, when the number of iterations is 60, the proposed method RSI key point feature extraction accuracy is about 95%. The keypoint feature extraction accuracy of the RSI samples of the proposed method is about 90% and 81%, respectively, and the proposed method also has better performance in the comparison of noise reduction error and extraction time cost. It can be seen that the proposed method can effectively improve the feature extraction accuracy of RSI and reduce the noise in RSI. The innovation of this scheme is that the problem of image noise is improved by using spatial transformation and specific filtering, and the overall effect of high RSI is improved. Considering the linear characteristics of RSI, using the WT algorithm to optimize the feature extraction process can not only improve the feature extraction effect, but also improve the overall quality of the image. There are also shortcomings in the research content, and the extraction of more complex image features has not been considered, which needs to be improved in the later stage.
Footnotes
Funding
This research was supported by: National Natural Science Foundation of China: Research on the mechanism of the impact of mobile Internet applications on matching supply and demand of urban daily life services, (No. 42071202); National Social Science Foundation of China: Research on the Integration of Culture and Tourism Development in Ethnic Areas for Poverty Eradication and Consolidation and Rural Revitalization, (No. 21BKS026).