



Abstract
Good design strategies can help reduce energy consumption and ensure proper natural lighting. In the process of building design, this paper uses orthogonal analysis to identify design elements that correspond optimally to light levels. The visible light transmission ratio, horizontal sunshade baffle depth, sunshade angle, horizontal sunshade height from the window, and heat transfer coefficient were selected as influencing factors. The design elements corresponding to the lowest energy consumption were found. The test points are representative, and the number of tests is small.
Introduction
Inappropriate building design can cause economic problems and comfort issues. This has led to the emergence of various design solutions. Too much light can lead to overheating inside, and buildings need to reduce solar gain when outdoor temperatures are high.
Considering heat loss, lighting effects, glass surfaces strongly affect the energy balance of the building. Windows and shading systems need to be properly designed to control the level of solar radiation and prevent internal overheating, while ensuring visual comfort. Too little illumination makes the room dark. An increase in lighting equipment increases electrical energy consumption.
Some scholars have evaluated the comfort level of users.
In Seyedeh’s study, heating, cooling and lighting energy requirements are considered, as well as CO2 equivalent emissions and thermal and visual comfort, and are evaluated in a simulated environment [1]. Vincent J.L. Gan presents a bim-based and data-driven framework to support the assessment and predictive analysis of thermal comfort in indoor environments [2]. Federico Silenzi proposes a methodology to optimize the selection process of retrofit measures. The building thermal behavior is dynamically simulated to assess the energy demand for heating and cooling purposes [3]. For the renovation of school buildings, a holistic approach to create a comfortable and energy efficient indoor environment seems to be the most convenient strategy [4]. The Dengyun Wang study proposes a post-evaluation method for retrofitting existing hotel buildings through the analysis of such building retrofitting cases. The method demonstrates the retrofitting quality of the engineering examples in terms of energy saving, technical economy and thermal comfort [5].
Some scholars have analyzed the light environment of buildings.
Michael Alva investigates methods of redirection of daylight, achieved by the geometry and proper orientation of prismatic louvers [6]. The Mamdooh Alwetaishi study focus on the effect of window-wall ratio on energy load at different orientations and in different climate zones. The WWR is selected for each orientation based on sufficient natural light [7]. Anna Dudzi’ nska has analyzed the effect of shading in a passive sports hall after practical application and renovation. The results of this paper show that in a well-insulated large-volume hall, a proper choice of external shading devices can only reduce the sunlight entering the room [8]. Gomes studied the effect of new shading devices on light [9].
Some scholars have analyzed the energy consumption of buildings.
Jan facing the consequences of climate change and rising fuel prices, achieving low energy requirements in buildings has become a challenging issue [10]. Modeste analyzes the possibility of applying near-zero energy building research to nine statistically representative building stock communities in Belgium [11]. Mahsa Khorram proposed a multi-cycle optimization algorithm for user comfort and power reduction [12]. Andrew Sonta presents methods to relate lighting area energy to user dynamics at the area level and to model the energy consumption of lighting systems based on this relationship, as well as methods to optimize building layouts [13]. Weinan Gan used the non-dominant ranking genetic algorithm (NSGA-II) to calculate winter heat consumption, total indoor lighting energy consumption, and thermal comfort [14]. Francesco Nicoletti investigates the impact of screening strategies on the energy consumption of buildings tested in a Mediterranean climate. In order to achieve the automatic setting of the slope of the blind slats of the louvers, the required equations are derived and applied from an analytical point of view [15]. The Alexandra Charles proposed that building envelope upgrades are the solution to improve energy efficiency in northern climates [16]. Jianying Hu proposes that the adaptive envelope is a combination of building roofs with thermochromic coatings and the placement of phase change materials in the walls to achieve intelligent management of solar and thermal energy in the building [17]. L. Landuyt optimizes this by considering the optimal insulation thickness, using a balance between material impact and operational energy [18].
In this paper, the effects of luminous environment and energy consumption are simulated by considering various building factors. Reduction of energy consumption and improvement of light comfort are considered comprehensively.
Design content
This paper selects the two-story commercial office building of Xinhua Fushan Yuanzhu as the research object, analyzes its lighting and energy saving, attempts to find the balance point between luminous environment and energy saving of office buildings in Hefei, and selects the optimal design scheme. The 1st and 2nd floor plans of the office building are shown in Figs 1 and 2.
It is located in the core of Chaohu City governmental area in Hefei, adjacent to Chaohu Municipal Government and People’s Court, surrounded by the main city roads of Mushan Road, Yuquan Road and North Outer Ring Road, and close to Chaohu Railway Station, Chaohu High-speed Railway East Station, Chaohu Bus Station and Chaohu Passenger South Station, with easy access to all directions. The basic parameters of the building are shown in Table 1.
Basic parameters of the building
Basic parameters of the building
Plan of the first floor.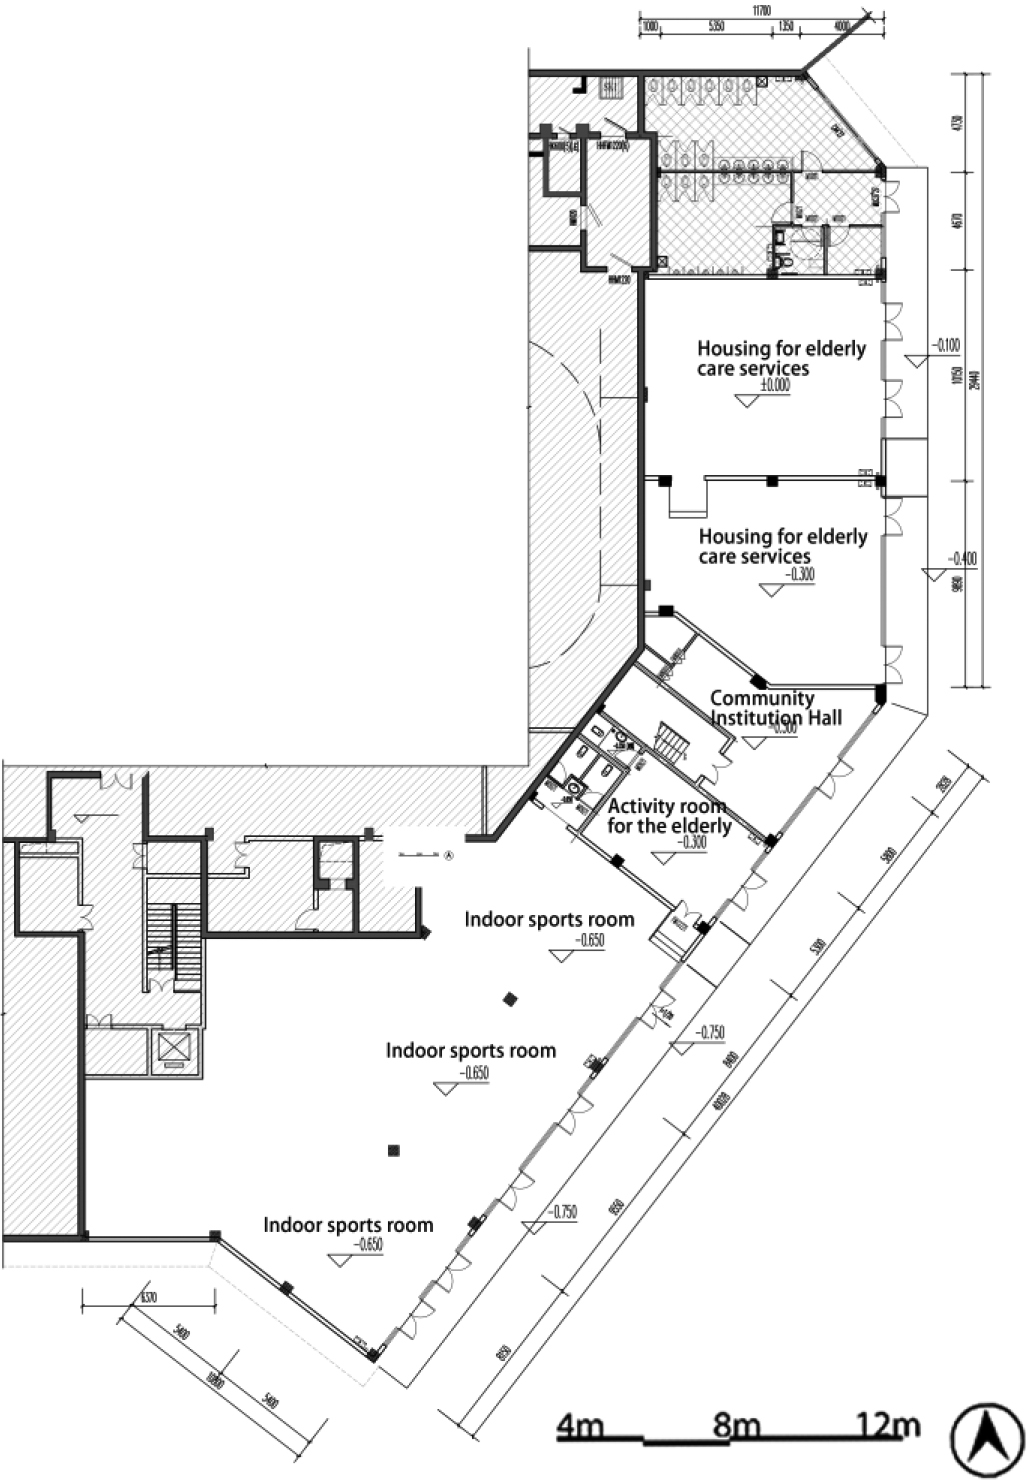
Floor plan of the second floor.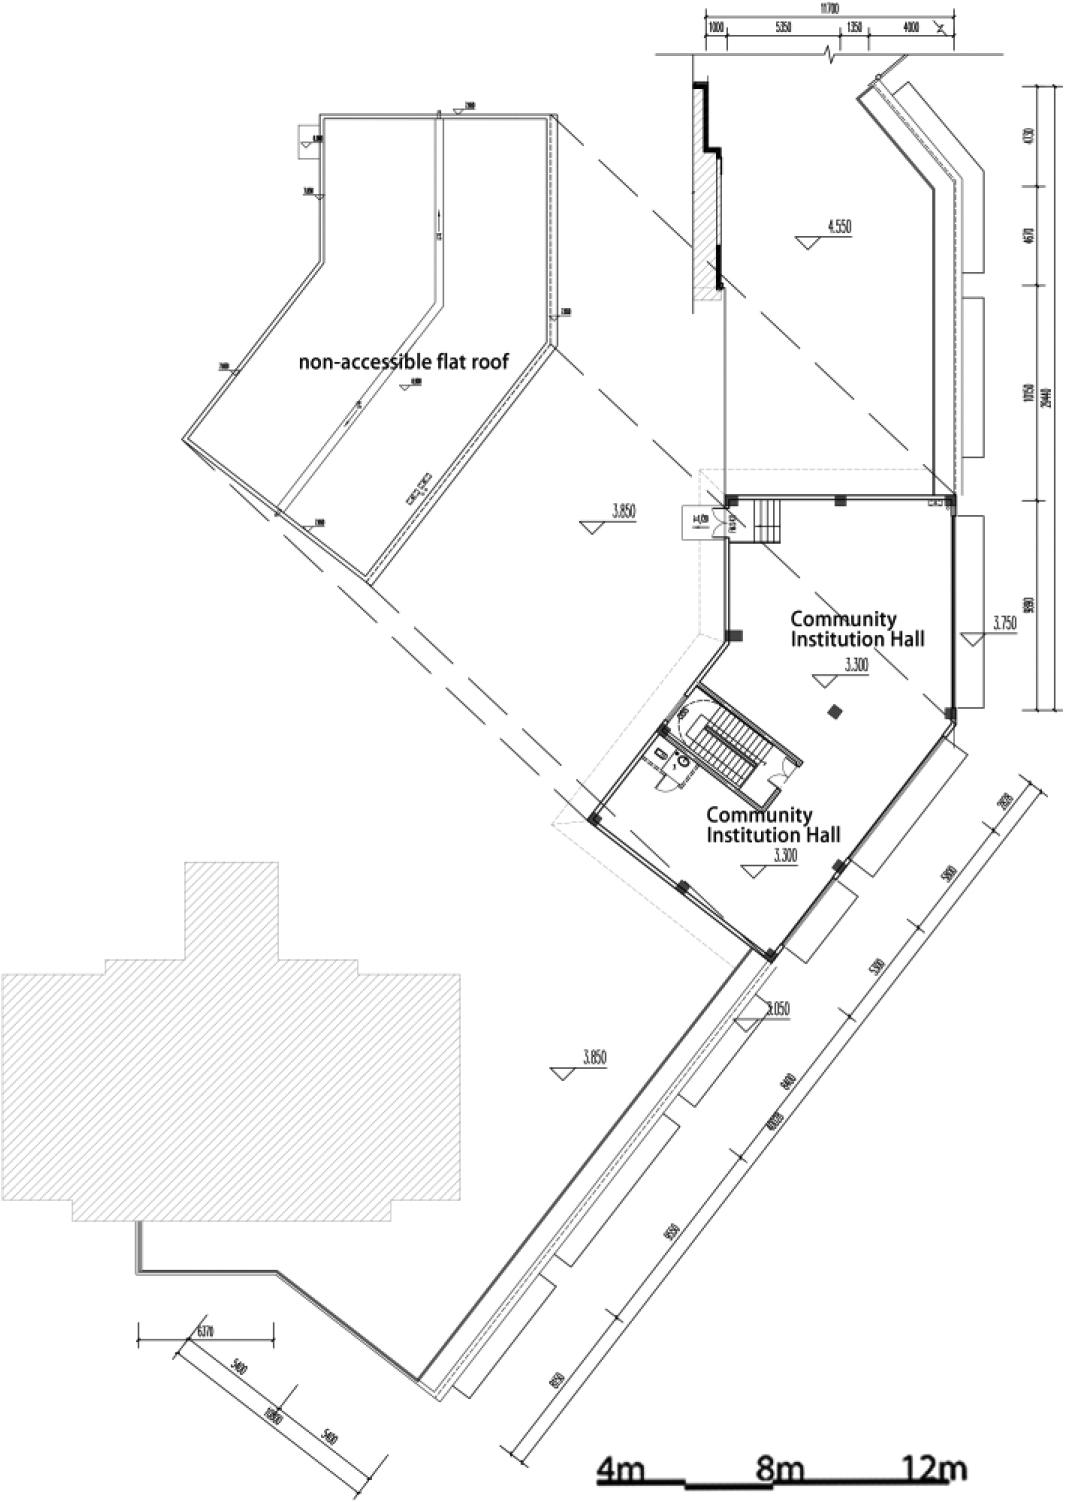
The lighting coefficient at a point on the reference plane of the building interior can be calculated according to the following formula.
En – the illuminance (lx) produced by sky diffuse light at a given point on a given plane in the room under full cloudy sky diffuse light irradiation.
Ew – in full cloudy sky diffuse light irradiation, and indoor illumination of a point at the same time, the same place, in the outdoor unobstructed horizontal surface by the sky diffuse light generated by the outdoor illumination (lx).
PKPM-Daylight, the natural light simulation and analysis software for green buildings, operates on the Windows 10 system and can be run on the AutoCAD platform and PKPM-BIM platform. The software supports the Green Building Evaluation Standard and local landmarks, and automatically generates traceable natural lighting simulation calculation reports to help users quickly complete the evaluation of indoor luminous environment design in China’s building sector. The software is double certified by the Ministry of Housing and Construction’s Construction Industry Science and Technology Achievement Evaluation and the National Center for Quality Supervision and Inspection of Construction Engineering; the software calculated values of typical cases are within 7% error from the actual project measurement values.
The iterative illuminance calculation is carried out by calling the Radiance calculation kernel in the United States and using the Monte Carlo algorithm to optimize the reverse ray tracing algorithm for each grid. The ratio of the calculated illuminance value En to the outdoor illuminance Ew is the calculated value of the lighting factor at that point.
The material, color and surface condition of the material determine the absorption, reflection and projection performance of light, which has a great impact on the building lighting.
The simulation conditions are as follows.
CIE sky model (lighting factor and illumination calculation): full cloudy day.
CIE sky model (glare calculation): full cloudy sky.
Simulation basis: GB 50033-2013, “Design Standards for Building Light”.
Simulation basis: “Green Building Evaluation Standard” GB/T 50378-2014.
Simulation space grid spacing: 0.50 (m).
The number of grids divided in this project: 4612 (pieces).
Ground material reflection coefficient: 0.30.
Number of light reflections: 5.
Simulation range: Standard layer 1 (A-L01F), Standard layer 2 (A-L02F).
Five characteristic parameters were selected for analysis: visible light transmission ratio, horizontal sunshade baffle depth, sunshade angle, horizontal sunshade height from the window, and heat transfer coefficient. Four design values were set for each characteristic quantity. As shown in Table 2.
Characteristic quantities and design values
This paper uses orthogonal analysis to select the appropriate design factors. Multiple levels were selected for each factor. Factors, as the independent variables of the experimental research process, are often those that cause the test indicators to change according to some pattern. The level is the specific state or situation in which the factor is located in the experiment, also known as the rank.
The disadvantages of the full-scale test method are: (1) the number of tests is too many, time-consuming, laborious, when the level of factors is relatively large, the test can not be completed. (2) The error cannot be estimated without repeating the test. (3) It is impossible to distinguish the main and secondary factors.
For example, if 4 factors are selected and 5 levels of each factor are selected, the number of full-scale tests is 4 times 5, which is 625.
The disadvantages of the simple comparison method are: (1) the test site is not representative. The level of factors examined is only limited to the local area and cannot reflect the overall situation of the factors comprehensively. (2) It is not possible to distinguish the main and secondary factors. (3) If the test is not repeated, the test error is not estimated, so the accuracy of the best analysis conditions cannot be determined. (4) It is impossible to use mathematical and statistical methods to analyze the test results and propose the prospective good conditions.
Orthogonal experimental design is a design method that uses an orthogonal table to arrange and analyze a multi-factor test.
Just because the orthogonal test is a partial test instead of a full test, it is not possible to analyze each factor effect and interaction one by one like a full test; when the interaction exists, there is a possibility of confounding the interaction. Although the orthogonal test design has the above-mentioned shortcomings, it can find the optimal combination of levels through partial tests.
Advantages of the orthogonal test method: (1) strong representation of test points, the number of tests is small. (2) No need to do repeated tests, you can estimate the test error. (3) It is possible to distinguish the main and secondary factors. (4) It can use the method of mathematical statistics to deal with the test results and propose the prospective good conditions.
The orthogonal test method can evenly select a small number of representative test solutions among all test solutions. By statistically analyzing the test results of these few test protocols, a better protocol can be introduced. More information is obtained, such as the importance of the influence of each test factor on the test results, and the trend of the influence of each factor on the test results.
To distinguish the main and secondary order of the influence of each factor on the index, i.e. to clarify which is the main factor and which is the secondary factor; to find out the optimal solution, i.e. what level of each factor under investigation can achieve the requirements of the test index; to analyze the relationship between the factors and the index, and to find out the pattern and trend of the change of the index with the factors, which can be used to point out the direction of further experimental research.
K
k
K
k
This results in the optimal level combination
R: extreme difference, on any column R
The size of the extreme difference R reflects the magnitude of the role of the factors in the test, and a large extreme difference indicates that the factor has a large impact on the index and is the main factor, while a small extreme difference is a minor factor.
Building luminous environment and low energy design
Use the orthogonal analysis method. Find out which characteristic quantity has the greatest impact. Find the optimal combination.
The L16 45 orthogonal table is used, as shown in Table 3. There are 5 eigenvolumes in this design. Each characteristic quantity may have 4 values. 16 cases corresponding to energy consumption and illumination are shown in Table 4. The results of the orthogonal analysis of energy consumption and illumination are shown in Tables 5 and 6. Under the current 16 combinations, the 14th combination, the illumination is the largest. The 10th one has the lowest energy consumption.
L16 45 orthogonal table
L16 45 orthogonal table
Energy consumption and luminosity corresponding to 16 cases
Orthogonal analysis method for energy consumption data
Orthogonal analysis method for illuminance data
Setting up the different design parameters, the changes of average illuminance are shown in Fig. 3, and the changes of energy consumption per unit area are shown in Fig. 4.
Based on the results of the analysis, we can draw these conclusions:
The larger the visible light transmission ratio, the greater the light level. But there’s no change in energy consumption.
With the increase of the depth of the visor baffle, the energy consumption increases gradually.
The visor angle has little effect on light and the energy consumption.
The greater the height of the horizontal visor from the window, the lower the energy consumption, with little impact on light level.
The higher the heat transfer coefficient, the higher the energy consumption.
From the results of the orthogonal analysis, for reducing the operating energy consumption, the heat transfer coefficient has the greatest influence. For improving the light level, the visible light transmission ratio has the greatest influence.
The minimum load combination corresponds to the following combinations: visible light transmission ratio 0.7, horizontal sunshade baffle depth 700 mm, sunshade angle 5 degrees, horizontal sunshade height from the window 300 mm, and heat transfer coefficient 1.2.
The maximum visible light transmission ratio corresponds to the following combinations: visible light transmission ratio 0.7, horizontal sunshade baffle depth 700 mm, sunshade angle 10 degrees, horizontal sunshade height from the window 300 mm, and heat transfer coefficient 1.2.
The changes of average illuminance.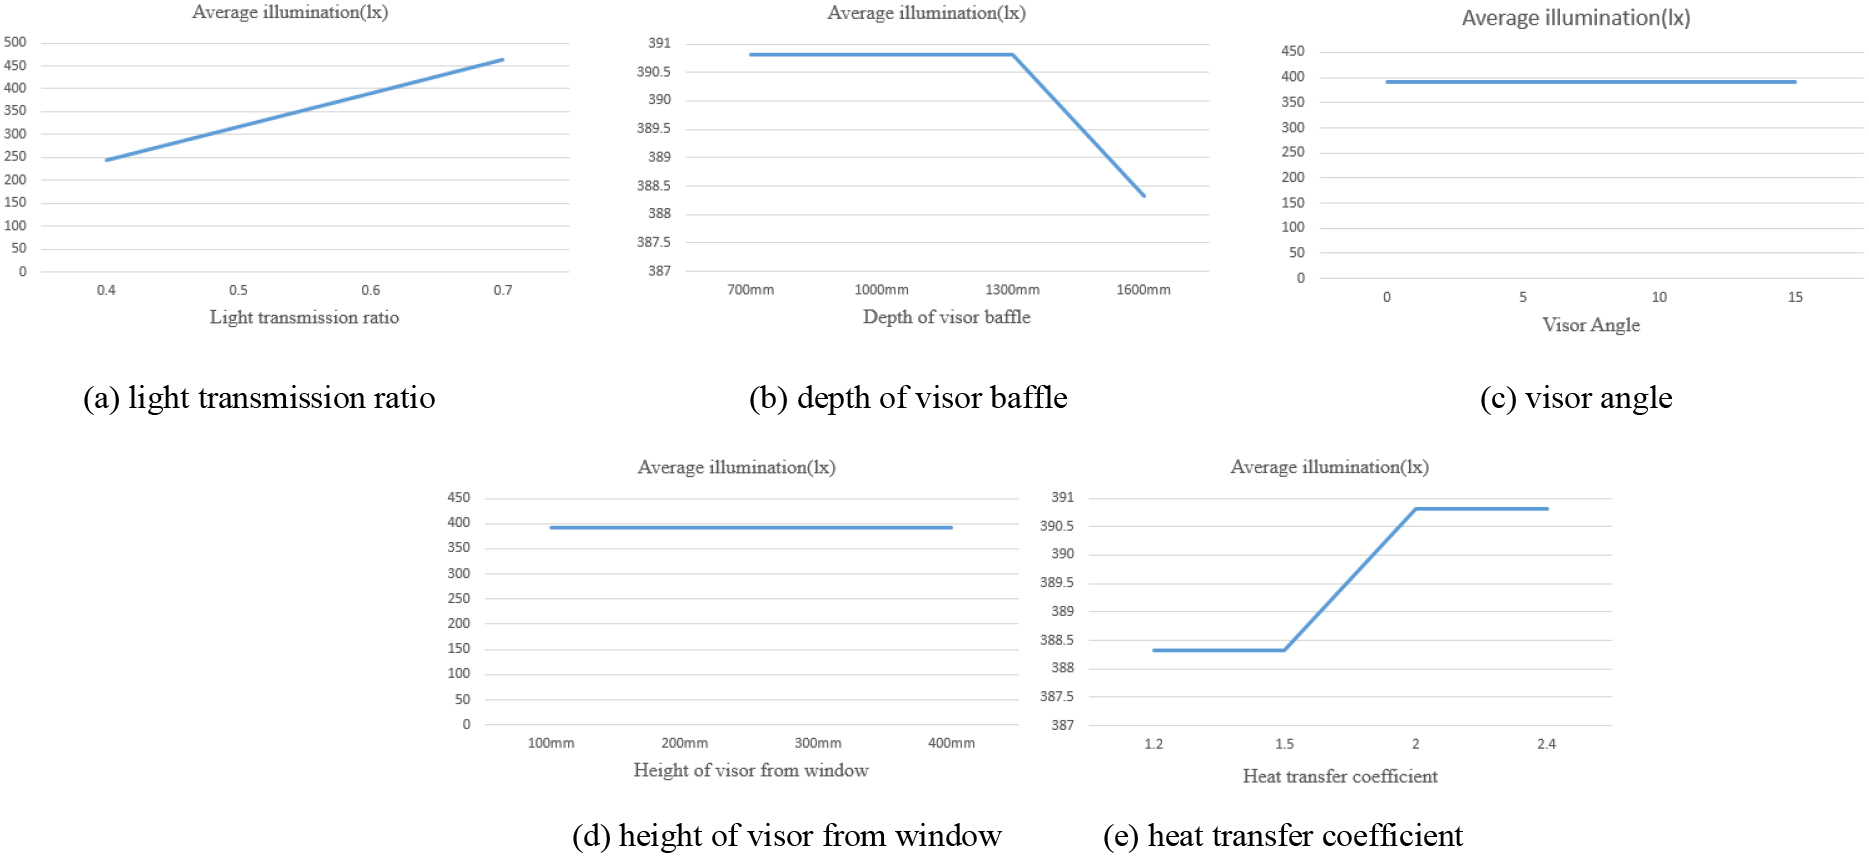
The changes of energy consumption.
Illuminance distribution.
The lighting situation at the optimal combination of illumination levels is shown in Fig. 5.
In this paper, the influence of the outer sun visor on the comprehensive environment of the building is selected. Since the form of the outer sun visor often changes according to the change of the building form in the actual project, three influencing factors, namely the depth of the sun visor, the tilt Angle and the distance from the window height, are selected for experimental calculation. Plus visible light transmission ratio, heat transfer coefficient, this design considers a total of 5 parameters.
We used orthogonal analysis to find out which characteristic quantity has the greatest impact. For reducing operating energy consumption, the heat transfer coefficient has the greatest impact. For improving light comfort, the visible light transmission ratio has the greatest influence. The combinations corresponding to the optimal light comfort and the lowest energy consumption are visible light transmission ratio 0.7, horizontal sunshade baffle depth 700 mm, sunshade angle 10 degrees, horizontal sunshade height from the window 300 mm, and heat transfer coefficient 1.2.
In this paper, the design elements corresponding to the optimal light level are identified. The design elements corresponding to the lowest energy consumption are identified. The test sites are representative, and the number of tests is small. The analysis of this paper can be applied to other areas with hot summer and cold winter, and has certain adaptability.
Footnotes
Acknowledgments
University Natural Sciences Research Project of Anhui Province (Project Number: KJ2021A1002).