
Abstract
The rapid development of renewable energy has also had an impact on the flexibility of multi energy systems such as electricity, heat, and gas. To analyze the flexible characteristics of multi energy systems at multiple time scales, a multi-scale flexibility evaluation method based on morphological decomposition is proposed. The net load curve is decomposed using mathematical morphology methods, and a multi-scale energy storage configuration method based on the flexibility of electric heating systems is proposed. The analysis data shows that the probability of insufficient upward flexibility, margin expectation, and insufficient expectation of the scale weighted flexibility index are 1.12%, 3.98%, and 1.16%, respectively, while the probability of insufficient downward flexibility, margin expectation, and insufficient expectation are 0.73%, 4.54%, and 0.56%, respectively. The introduction of energy storage and controllable load simultaneously results in an overall downward flexibility index of 0.92% for the system. The results indicate that controllable load can improve the economy of system peak shaving, providing more options for energy storage and configuration in multi energy systems.
Keywords
Introduction
Energy is the driving force behind human survival and development. Global energy depletion and increased environmental awareness have led to renewable energy industry developing [1]. The participation of renewable energy source (RES) is gradually increasing and the volatility of their output and power affects power system stability. The ability of power systems to cope with power fluctuations is known as flexibility. Conventional power systems ignore power variations in adjacent periods, and their real-time flexibility is low, which seriously affects system operation [2]. A correct assessment of the impact of uncertainty and volatility on the power system is the basis for flexibility assessment, which needs to address the quantification of flexibility indicators and the optimization of operating strategies [3]. Input capacity and operational flexibility can limit the process of grid integration of renewables, and economic carrying capacity and system cost reduction indicators can be used to analyze the flexibility of renewable energy systems [4]. Current flexibility assessment methods include flexibility assessment methods based on historical data, flexibility assessment methods based on graph theory and flexibility assessment methods based on sampling simulations, which have limited adaptability for flexibility assessment [5]. In order to further reduce the scale of flexible power supply in the system, the risk of insufficient flexibility in the system has been increased from the supply and demand sides. Therefore, the study proposes a multi-scale flexibility assessment method based on morphological decomposition for electric, thermal and gas multi-energy systems. The study consists of four parts. Firstly, is summaries the current research and design of morphological methods and multi-energy systems, the second part is the design of multi-scale flexibility assessment based on morphological decomposition for electric, thermal and gas multi-energy systems, the fourth part is the application of multi-scale flexibility assessment methods based on morphological decomposition analysis, and the fourth part is a summary of the study.
Related works
Morphology is a theory which can be applied to process mathematical morphology image. Abdalla and Nagy [6] used mathematical morphology decomposer for wind speed decomposition and two long and short term memory networks for baseline and residual prediction, and this method outperformed support vector machines for non-stationary time series prediction. Vernieuwe et al. [7] used the operator of mathematical morphology to decompose drought events in time and space, and this method can extract the sustained event and intensity characteristics of drought events. The research team of Wang C combined the threshold function with mathematical morphology and proposed an improved morphological edge detection algorithm to extract the image edges after threshold noise reduction, and the simulation The edge detection of this algorithm is clearer [8]. Su et al. [9] proposed a snowmelt detection method on the foundation of mathematical morphology and wavelet change, using mathematical morphology filter to maintain edge features and combining wavelet transform for edge feature extraction. Harmsen et al. [10] proposed an alternative method for conducting decomposition analysis in the power and thermal sectors, which has five driving factors: volume effect, sub sector effect, thermal effect, fuel mixing effect, and efficiency effect. The research results indicate that this method has improved understanding of the factors driving primary energy use or changes in carbon dioxide emissions in the power and thermal sectors.
Multi-energy system contains various energy systems like heat, gas, et al. Ye et al. [11] proposed a model-based system-centric formulation for the resource coordination problem in local electricity markets, an optimization function for two markets considering the time-coupled operability of efficient distributed energy sources, and a case study proves that The method outperforms traditional energy coordination methods. Su et al. [12] proposed an optimization strategy considering flexibility, using source-conforming storage flexible resources and system flexibility requirements at different timescales to construct an optimized dispatch model, and this method can improve system flexibility. Pourghaderi et al. [13] proposed a new market-based framework for the utilization of distributed energy distribution and transmission flexibility to meet intra-hourly variations in system demand, results show the effectiveness of the framework. Xu et al. [14] proposed a model for co-optimizing energy and reserve markets considering flexibility, combined with cost-optimal energy and ancillary services dispatch demand responses, results show that The approach is able to provide price signals and optimize the resource mix. Huo et al. [15] proposed a flexibility indicator system and an evaluation method based on hierarchical analysis and entropy weighting, and compare and quantify flexibility improvements in four typical regional heat network control models, with results showing that the highest flexibility is achieved in the temperature flow control model.
In summary, many researchers have done different studies and designs for mathematical morphological methods and multi-energy systems, but the applicability of these methods and models still needs to be improved. Therefore, the study proposes a multi-scale flexibility (MSF) assessment method for electric, thermal and gas multi-energy systems based on morphological decomposition, expecting to enhance the effectiveness of system assessment.
Design of MSF assessment for electric, thermal and gas multi-energy systems based on morphological decomposition
This chapter constructs a MSF assessment method based on morphological decomposition for electric, thermal and gas multi-energy systems. The first section of this chapter is the design of a MSF assessment method based on morphological decomposition, and the second section of this chapter is the design of a multi-scale energy storage (MSES) configuring method on the foundation of flexibility of electric, thermal and gas systems.
Design of a MSF assessment method based on morphological decomposition
With the global scarcity of energy and the introduction of RESs represented by wind and photovoltaic into grid system, the supply and demand of electricity, heat and gas multi-energy systems are uncertain [16]. In order to carry out system flexibility assessment, the study proposes a MSF assessment method on the foundation of morphological decomposition, through the construction of a weighted multi-scale morphological filter, combined with mathematical morphological algorithms to decompose net loading curve, and reflect different flexibility demands at different time scales through time series components, in order to achieve the classification, assessment and allocation of flexibility resources, based on the morphological decomposition of the multi-scale The flexibility assessment method is shown in Fig. 1.
MSF evaluation method.
Algorithms for direct multi-timescale decomposition in the time domain include algorithms like mathematical morphology and others, where the basic mathematical morphology operations are the corrosion and dilation operations [17]. The construction of structural element groups enables the decomposition of time domain curves, and the corrosion and dilation operations of the input signal about the structural elements are shown in Eq. (1).
In Eq. (1), the input signal is
In Eq. (2), the open operation is
In Eq. (3), the WMMF filter is denoted as
In Eq. (4), the variance of the filter difference at the scale
The process of morphological decomposition algorithm based on WMMF filter.
The flexibility assessment of the electricity, heat and gas MES is divided into two directions: upward and downward regulation. Waveform recognition allows the curve to be split into subsets in both directions, with the amplitude of the climbing segment indicating the flexibility demand and other information [18]. Thermal units in electricity, heat and gas multiple energy system include both gas-fired and coal-fired units. The high flexibility of gas-fired units allows them to participate in short time scale flexibility regulation, while coal-fired units can participate in hourly time scale flexibility regulation, with short time scale regulation of less than 15 minutes as shown in Eq. (5).
In Eq. (5), the upward and downward climb rates for gas-fired units are
In Eq. (6), the upward and downward climb rates for pumped storage hydro units are
In Eq. (7), the probability of inflexibility is
In Eq. (8), the flexibility margin expectation is
In Eq. (9), the sample expectation is
In Eq. (10), the scale weighted flexibility indicator is
Multi time scale flexibility evaluation algorithm steps.
The assessment algorithm broadly consists of four steps. The first one is net load curve clustering using the AP clustering algorithm, the second step is the multi-time scale decomposition of the curve to obtain the flexibility demand at each time scale, the third step is the calculation of the top and down flexibility resources when time is different from the unit combinations and operating states, and the fourth step is the analytical matching of the flexibility resources and demand and the calculation of the flexibility assessment index.
Based on the random fluctuations of energy at different time scales and the requirements for flexible adjustment of power sources, distinguishing energy storage units at the time scale and planning various energy storage requirements for flexibility at each time scale will be beneficial for solving the supply-demand balance problem between flexible resources and demands brought about by large-scale intermittent renewable energy integration into the power grid at multiple time scales. Renewable energy output fluctuates strongly on multiple time scales, leading to impacts on the flexibility of electricity, heat and gas multi-energy systems. Energy storing can be treated as a flexible and adjustable power source [19]. Therefore, the study proposes an energy storage capacity allocation model based on MSF requirements, where energy storage units can participate in peak and frequency regulation of grid and reduce renewable energy access’s negative impact. Energy storage units can be divided into pumped water, compressed air storage and sodium-sulphur batteries, with the processing characteristics of each determining their application scenarios [20]. Important indicators affecting the application of energy storage are the maximum power output, the response time and the maximum continuous discharge time. The largest scale of application is pumped storage, where the high and low distribution of reservoir resources enables the conversion of gravitational potential energy to electrical energy, with a long response time but long output power and maximum discharge point time, which helps the system to cut peaks and fill valleys. Liquid flow batteries enhance battery energy storage through the regulation of electrolyte content, their capacity cost is low and their conversion efficiency is up to 80%, their short time frequent response is good and they are suitable for the balance of renewable energy fluctuation. Supercapacitors have high power and fast response, with a longer device life than electrochemical storage, and can be used for smoothing renewable energy fluctuations on a time scale. Figure 4 is the MSES capacity configuration model.
MSES capacity configuration model.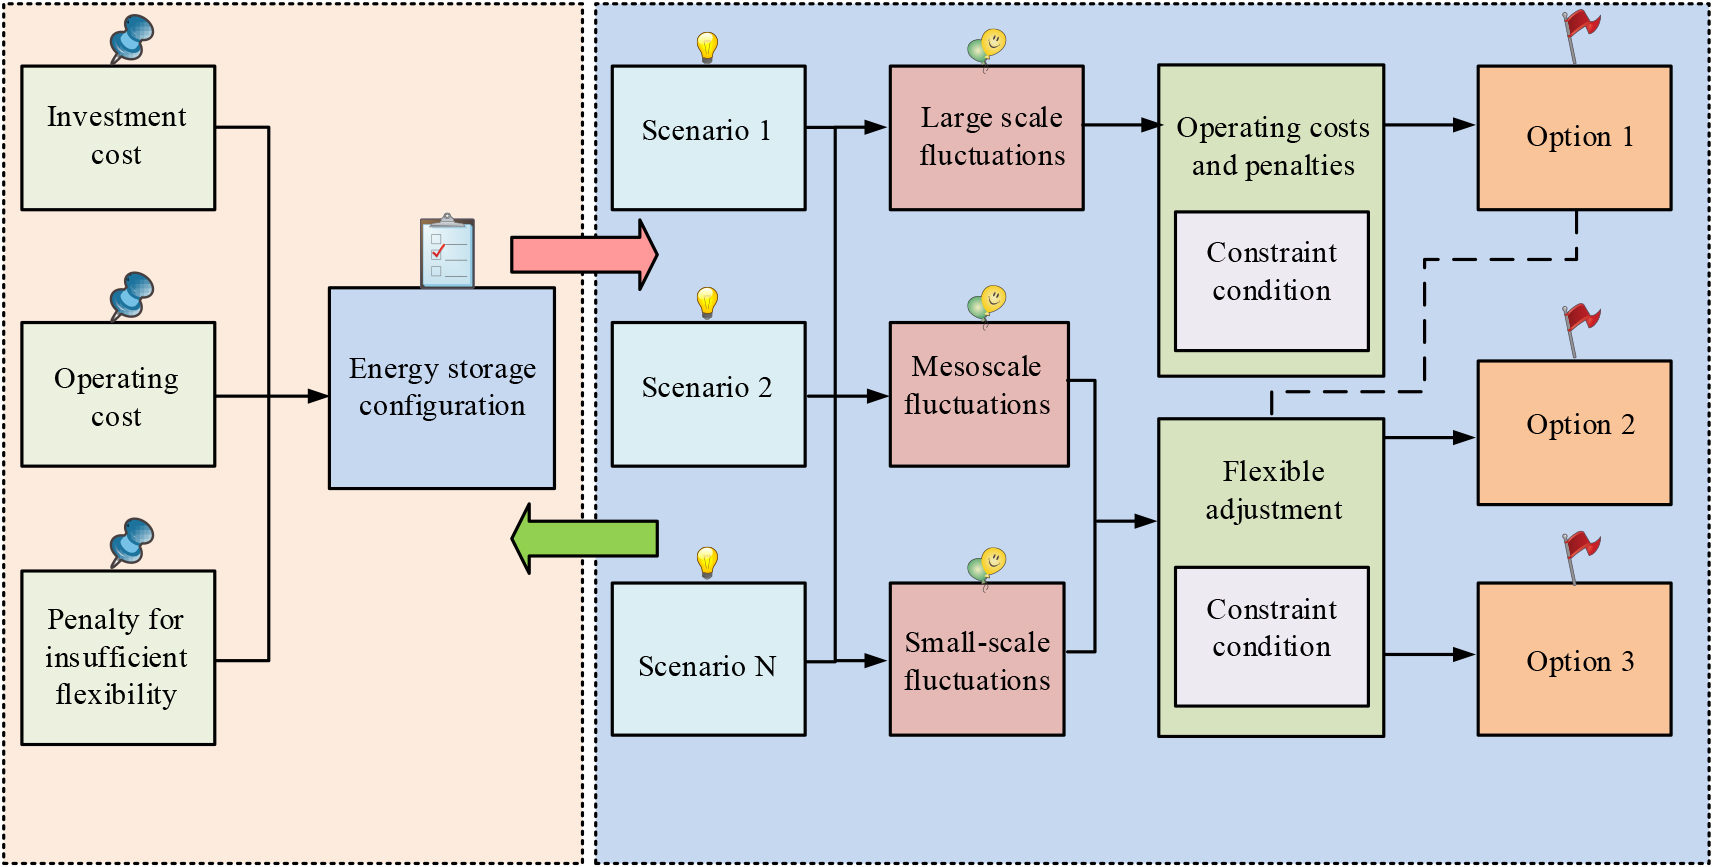
The MSES capacity allocation model is a two-layer nested structure, where the outer layer task is the decision of energy storage allocation, mainly considering the unit operation cost and flexibility deficiency penalty, to achieve economic optimization. The task of the outer layer is to optimize the operation of flexible resources on multiple time scales to achieve the lowest operating costs and flexibility deficiency penalties, and the calculation and output of the unit’s flexibility processing completes the mutual nested optimization of the inner and outer layers. The inner layer multi-scale model optimizes the unit output needs to be adjusted for operating scenarios on short time scales, and hourly time scale operating scenarios will have an impact on the spatial adjustment of the unit up and down at the 15 min and 1 min levels. The study uses WMMF filters for the decomposition of the output curve to obtain the fluctuation components at the three time scales, and constructs a probability distribution model for renewable energy output fluctuations in the scenario The results of the runs are input into the outer layer after run optimization.
The outer model needs to be combined with the output of the inner model to adjust for energy storage costs, operating costs and flexibility deficiency penalties to achieve the lowest total investing cost. The outer model optimization’s objective function is shown in Eq. (11).
In Eq. (11), the total cost of flexibility investment is
In Eq. (12), the energy storage unit’s capacity and power cost are
In Eq. (13), the cost of operating a conventional unit is
In Eq. (14), the inflexibility, load shedding penalty and new energy limit penalties at the
In Eq. (15), energy storage output power’s top and down bounds at each time scale are
The 15 min and 1 min time scales introduce flexible unit regulation output on hourly time scales, where the flexible demand is met while the flexible regulation cost of the system needs to be minimized, and where the optimization objective function contains the flexibility deficiency penalty and regulation cost. The gas unit output constraint contains the power adjustment amount and gas unit’s top and down power limits, subject to gas units’ up and down climbing capacity. The energy storage capacity constraint contains the storage power and the charging and discharging power, and they are during this cycle should ensure conservation. The under-flexibility constraint is load size and renewable energy output size. Power balance constraint is a sum of net load fluctuation components and the sum of the load cutting power.
This chapter analyses the MSF assessment method based on morphological decomposition using data from a multi energy system of a city in southern China as an example. The first section of this chapter is an analysis of the MSF assessment method on the foundation of morphological decomposition calculations, and the second section of this chapter is an analysis of the MSES configuration method on the foundation of electric, thermal and gas system’s flexibility calculations.
Analysis of the algorithm of the MSF assessment method based on morphological decomposition
The data source for the algorithm analysis is the historical output data of RESs as well as loads of a multi energy system of a city in southern China, where RESs mainly contain wind and photovoltaic energy, and the object of analysis is the daily MSF, the total installed capacity is 118,97 MW, the proportion of installed wind power and photovoltaic is 3.0% and 3.2% respectively, the maximum load is 110,00 MW, the specific power unit structure is shown in Table 1.
Specific power unit structure
Specific power unit structure
The AP clustering algorithm obtains 27 net load typical output curves, on which the experiments are based on one-hour unit combinations, and their flexibility is evaluated. The results of the multi-scale morphological decomposition based on the WMMF filter are shown in Fig. 5.
Multi scale morphological decomposition results based on WMMF filter.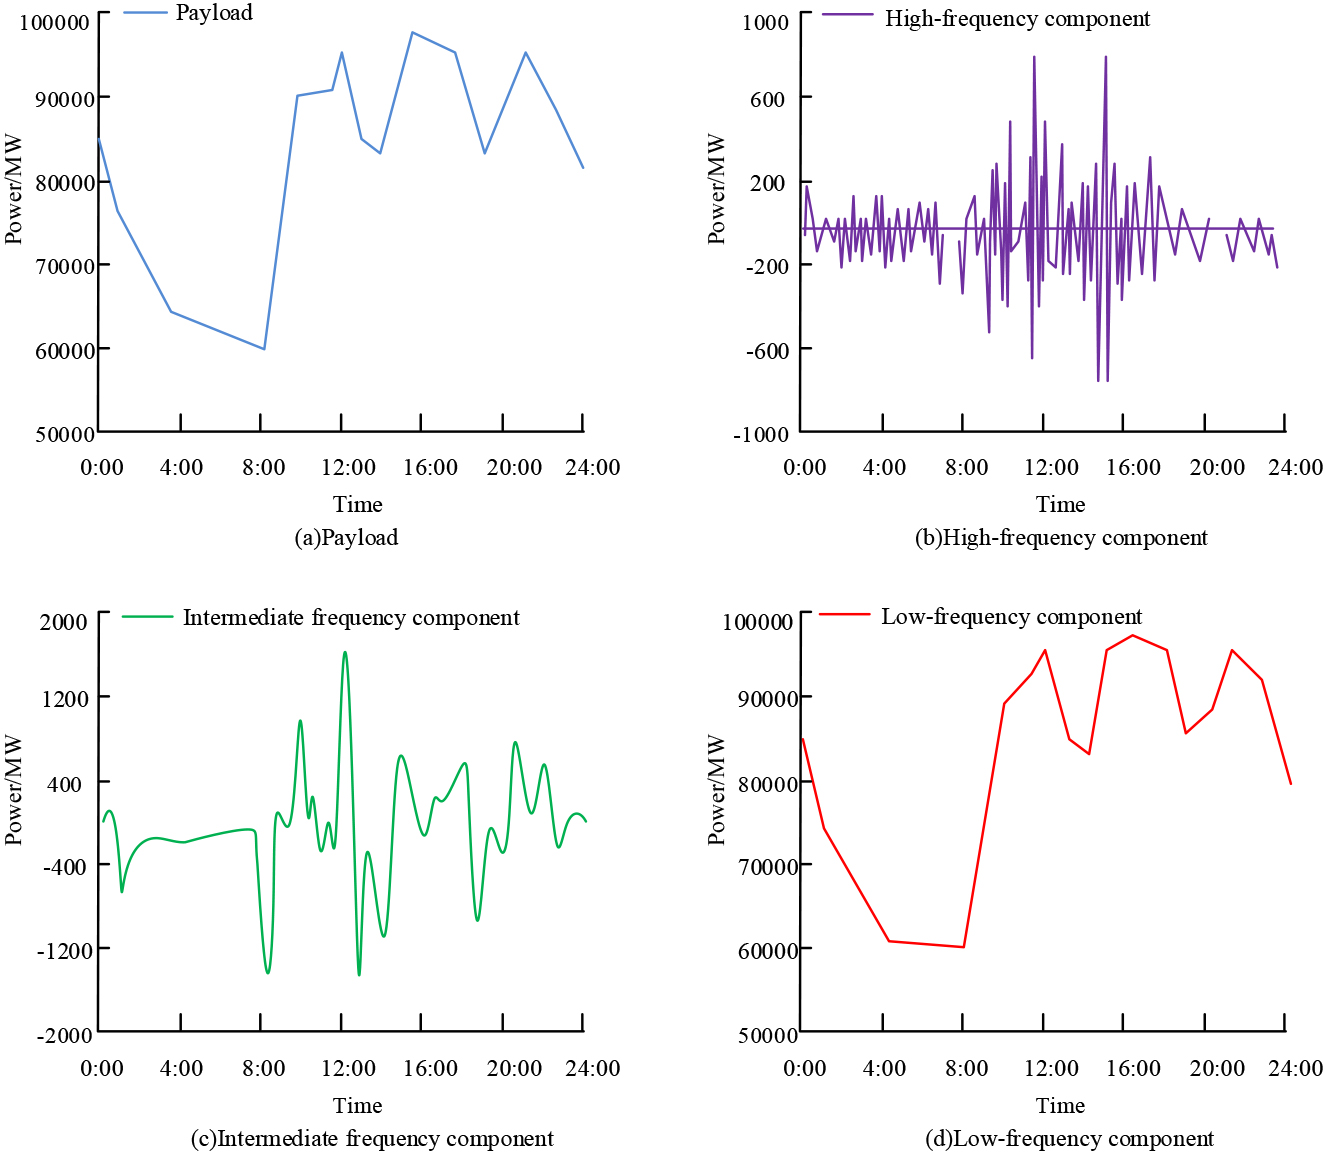
In Fig. 5, this net load curve for a typical day is decomposed into low, medium and high frequency components under the multi-scale morphological decomposition method. The low frequency component’s curve change rate is slower, the high frequency component’s curve change rate is faster, and the medium frequency component’s curve change rate lies between the low and high frequencies. The distribution of MSF requirements and resources on a typical day is shown in Fig. 6.
Figure 6(a) shows the typical daily MSF demand distribution, the flexibility demand fluctuations in different frequency bands are different, the fluctuations in IF and HF frequencies during the day time are obvious, the flexibility demand scalar for the low frequency component during the late night time is more concentrated, the upward and downward flexibility demand distribution is different, indicating that the flexibility fluctuations are directional. Figure 6(b) shows the MSF resource distribution on a typical day. The flexibility resource size varies significantly across the different frequency band components, with power intervals of [
Flexibility evaluation results of a multifunctional system
Typical daily MSF requirements and resource distribution.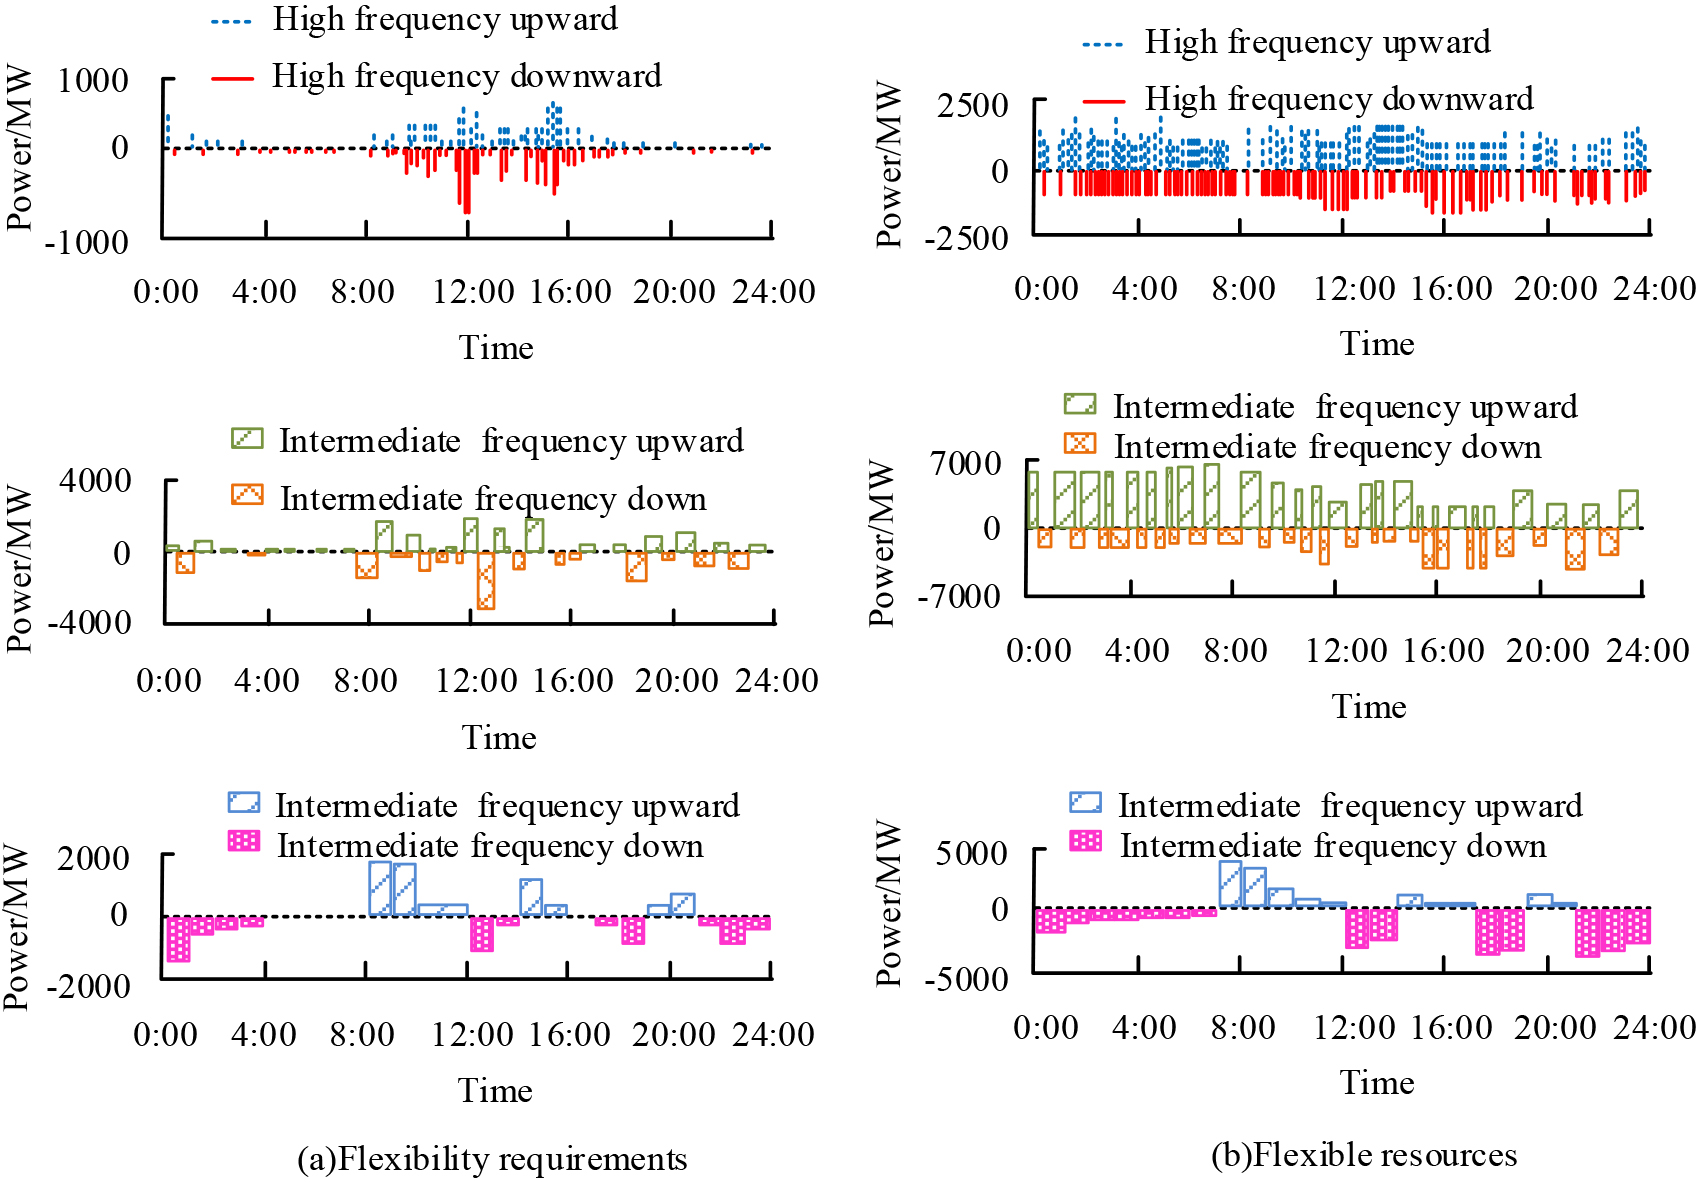
In Table 2, the upward flexibility deficiency probability, margin expectation and deficiency expectation are 0.08%, 0.0103 and 0.0019 respectively under the high frequency component, and the downward flexibility deficiency probability, margin expectation and deficiency expectation are 0.11%, 0.0087 and 0.0022 respectively, the upward flexibility deficiency probability and deficiency expectation are greater than those in the downward direction, and the upward flexibility margin expectation is greater than This indicates that there is more room to improve the downward flexibility adjustment capability of the system under the high and medium frequency components, and the flexibility assessment results under the low frequency component are opposite to those under the medium and high frequency components. The upward flexibility deficiency probability, margin expectation and deficiency expectation of the scale-weighted flexibility index are 1.12%, 0.0398 and 0.0116 respectively, while the downward flexibility deficiency probability, margin expectation and deficiency expectation are 0.73%, 0.0454 and 0.0056 respectively, making the system less flexible upward. The experiments used a MSF assessment method on the foundation of morphological decomposition to analyze this system with storage and load side flexibility resources addition, and the flexibility assessment results of the system under different flexibility resource invocations are shown in Fig. 7.
The flexibility evaluation results of the system under different flexibility resource calls.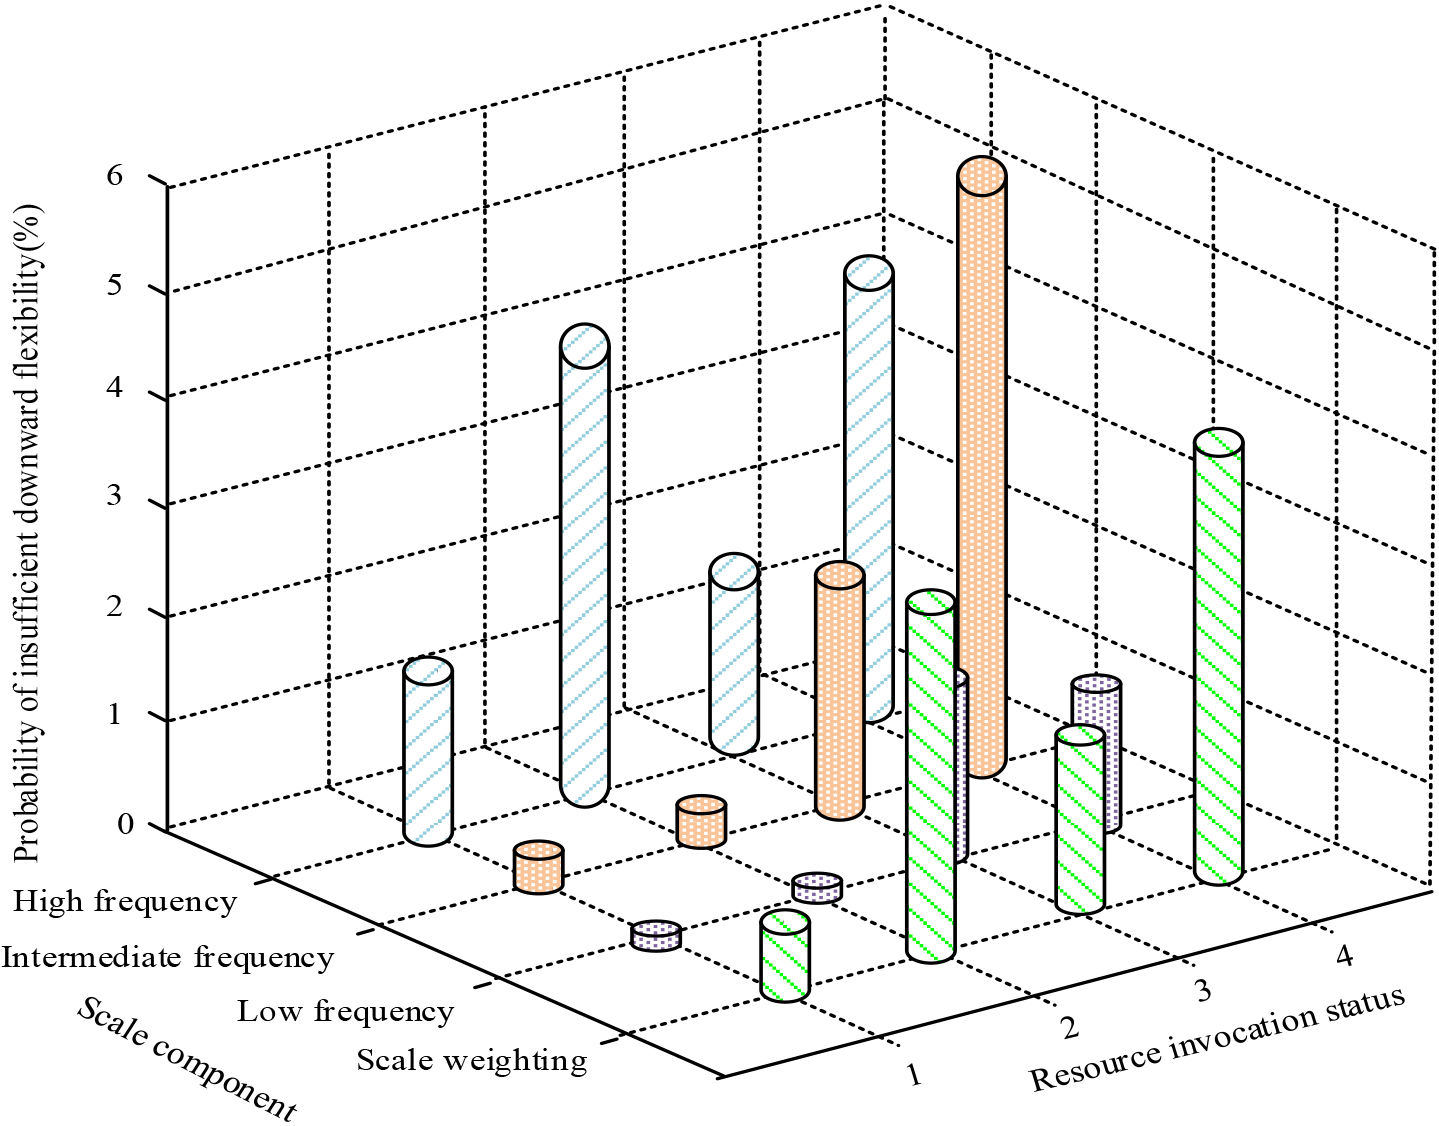
In Fig. 7, 1, 2, 3, 4 represent with storage with controllable, without storage with controllable, with storage without controllable and without storage without controllable loads respectively. The flexibility index is affected by energy storage and controllable load to different degrees. The addition of energy storage reduces the downward flexibility deficiency probability on the high and medium frequency scales by 2.46% and 3.18% respectively, and the controllable load reduces the downward flexibility deficiency probability on the medium and low frequency scales by 5.17% and 1.5% respectively, and the synergistic effect of the two reduces the overall downward flexibility index of the system to 0.92%, which is 0.86% lower than that of energy storage and controllable load alone. The synergy of the two reduces the overall system downward flexibility index to 0.92%, which is 0.86% and 2.2% lower than that of the storage and controllable load alone.
The study changed wind power and photovoltaic installed ratio on the basis of a multi energy system of a city in southern China, and designed three different ratio schemes, combined with a MSES configuration method on the foundation of flexibility of the electric-heat-gas system for optimization. Table 3 is the power supply structures under different schemes.
Power structure under different schemes
Power structure under different schemes
In Table 3, the total installed capacity under different scenarios is 784 MW. The proportion of wind power installed in Scenario 1 is the same as the proportion of PV installed in Scenario 2, which is about 40.8%, and the proportion of wind power and PV installed in Scenario 3 is the same, which is about 20.4%. The relevant parameters of the example are shown in Table 4.
Example related parameters
Typical output scenarios and short time fluctuations of wind power and PV under the AP clustering algorithm and multi-scale decomposition method are shown in Fig. 8.
As seen in Fig. 8, the multi-scale decomposition algorithm and AP clustering algorithm perform multi-scale decomposition and scenario reduction on the historical recorded data of wind power and photovoltaic output in the region, obtaining six typical output scenario curves at the hourly scale of wind power and photovoltaic. They also calculate the fluctuation probability distribution of the 15-minute and 1-minute fluctuation component curves of the net load output in the region. The distribution probability model has six output scenarios at the hourly scale of wind power and photovoltaic, with a more concentrated probability distribution of fluctuating components at the 1 min and 15 min scales, all within the [
Optimization results
Typical output scenarios and short-term fluctuations of wind and photovoltaic power.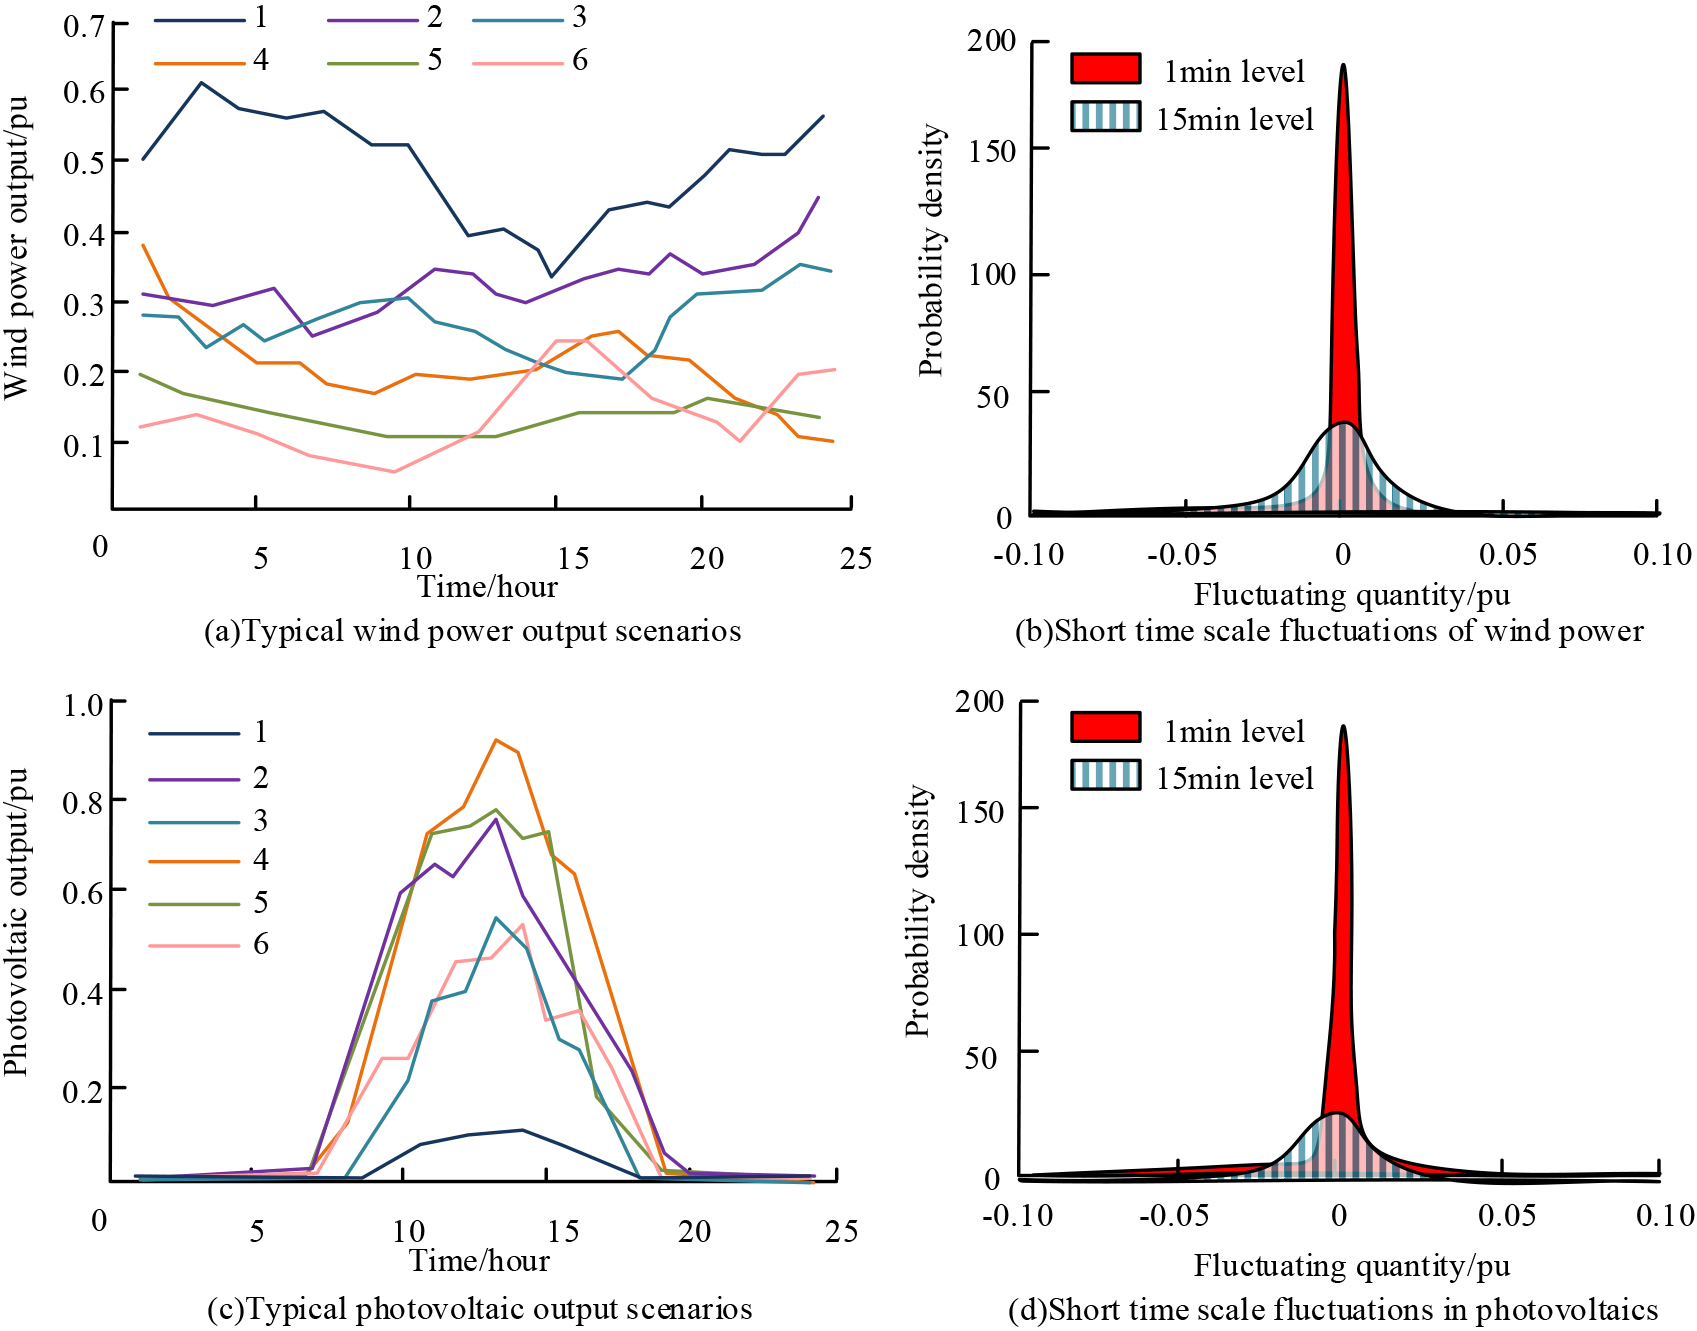
In Table 5, in Scenarios 1 and 2, where wind and PV are connected separately, the output characteristics of the RESs at each scale have a significant impact on the energy storage configuration. The upward peaking pressure on the PV connected system is greater than that on the wind connection, and Scenario 2 requires more pumped storage units to meet the peaking demand at the hourly scale, and the total investment cost for flexibility is higher in Scenario 2. Option 3 is a simultaneous wind and PV connection, which increases the peaking demand on the system, and the investment cost of the water storage units is higher than both Option 1 and 2. The improvement of the wind and PV connection ratio or the introduction of controllable loads can synergistically regulate the flexibility resources. The hourly scale unit output for a typical scenario based on Option 3 with the introduction of controllable loads is shown in Fig. 9.
Hourly scale unit output in typical scenarios.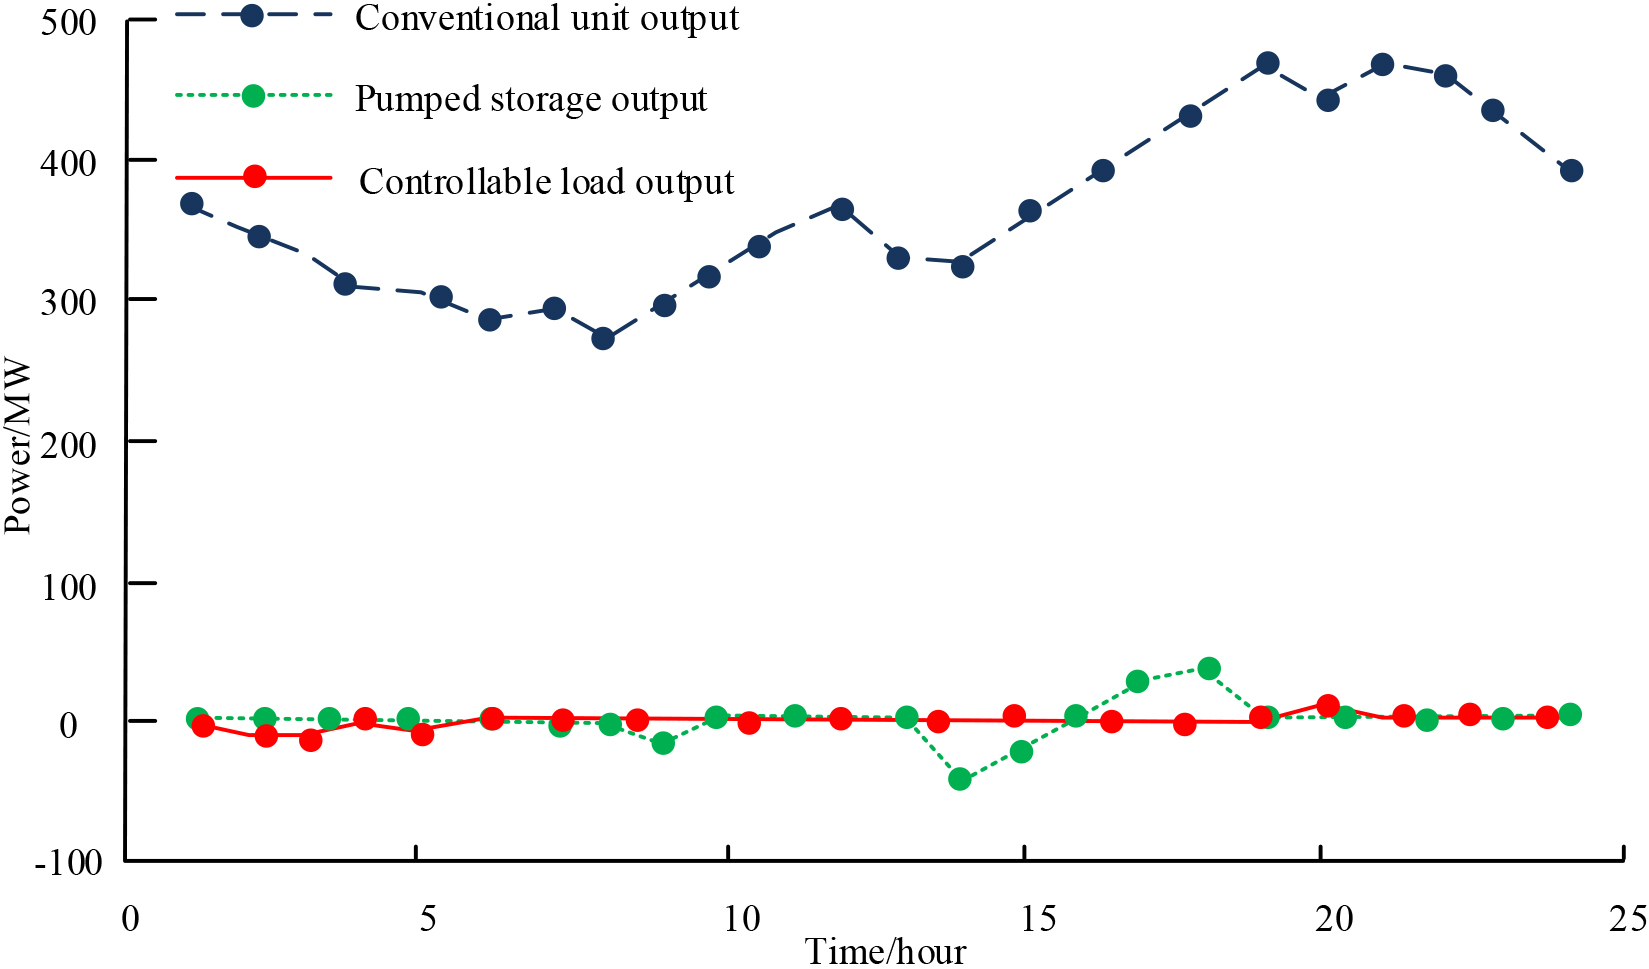
In Fig. 9, the configuration scale of liquid flow batteries and supercapacitors at the 15 minute and 1 minute time scales shows relatively small changes compared to Case 3. This is because compared to pumped storage units, the unit configuration power investment cost of liquid flow batteries and supercapacitors is lower. It is more economical to use liquid flow batteries and supercapacitors for flexible resource regulation in frequent output at the 15 minute and 1 minute time scales compared to controllable loads. Controllable loads only serve as backup flexible power sources to participate in regulation when energy storage is limited by charging and discharging cycles and cannot provide output. Therefore, the addition of controllable loads has little impact on the energy storage configuration results at the 15 minute and 1 minute time scales. After the addition of controllable loads, conventional units are limited in climbing, and controllable loads can bear some of the downward climbing loads, which helps to reduce the peak shaving pressure of the flexible regulation system. The configuration cost of pumping and storage units is relatively high, and the introduction of controllable loads can improve the economy of system peak shaving.
Global resource scarcity and the access of RESs make the fluctuations of power systems difficult to determine. To achieve effective assessment of flexibility resources, the study proposes a MSF assessment of electric, thermal and gas multi-energy systems on the foundation of morphological decomposition, combined with flexibility assessment indicators, and a MSES allocation method based on the flexibility of electric, thermal and gas systems. The case study data show that the flexibility resource size varies significantly across frequency band components, with power intervals of [
Footnotes
Acknowledgments
Supported by National Key R&D Plan: Quantitative Evaluation and Improvement Techniques for Flexibility of Electric-Gas-Thermal-Storage Multi energy Systems (2022YFB2404002).