
Abstract
Using population geographic data to analyze the dynamics of the central urban to explore the negative space and implement green carbon offset retrofits is beneficial for the Dual Carbon goals. We construct a grading system of urban vitality values with ArcGIS to assess the vitality of city blocks and screen out negative spaces. Taking the central urban of Anda as an example, we found that the vitality values along the main road in Anda were high. In contrast, the vitality values of residential sites in the southern and western parts were generally low. By analyzing the distribution of negative space in Anda, we finally recommend that Anda adopt the strategy of “fertile land creation” for the western part, to practice the planning of urban green space projects with joint investment of factories in the southern part, to optimize the low-carbon urban travel space, to implement the green transformation of small negative urban spaces, and to enhance the ecological construction of existing parks and green spaces. We extracted the negative urban spaces and explored the paths and implementability of the carbon offsetting renewal strategies intending to provide some reference for realizing Dual Carbon goals and transforming negative urban spaces in China.
Introduction
In September 2020, General Secretary Xi Jinping pledged at the 75th session of the United Nations General Assembly that China would achieve carbon peaking by 2030 and carbon neutrality by 2060. In 2021, the National People’s Congress formally included the Dual Carbon target in the government work report. At this point, China has officially opened a multi-sectoral “Dual Carbon” strategy system [1, 2, 3].
China is still in the developmental stage of data-based research for the concrete realization of urban carbon emissions and monitoring. Still, it is undeniable that cities must be the main battleground for carbon emissions. With the continuous progress of China’s reform and opening up and industrialization, its society and economy have developed rapidly, and its urban scale has expanded dramatically. Research shows China’s urbanization rate could reach about 70% by 2030 [4]. By comparing the evolution of carbon emission intensity and the urbanization rate of different countries, we can find that the urbanization rate of the countries that have reached the carbon peak is also around 74%. According to this trend, China’s urbanization will reach a level higher than 70% in 2035 [5] and initially achieve its carbon peak target. As the urbanization rate and urban space gradually peak, the pattern of urban development will inevitably shift from incremental expansion to stock optimization. Urban areas, as the carrier of major human activities, will also need to synchronize with “Dual Carbon” planning, which can contribute to the theme of “Dual Carbon” goals in China.
Regarding related theoretical research, Chinese scholars believe that territorial spatial planning to regulate land use conflicts is beneficial for achieving high-quality regional development [6]. Similarly, territorial spatial planning can also remedy and alleviate the problem of unbalanced urban carbon emissions caused by irrational land use. Linlin Xia and Yan Zhang used ecological network analysis to develop a spatially explicit carbon metabolism model in Beijing [7], demonstrating the link between carbon emissions and urban spatial structure. Yulong Zhao thought measuring and allocating carbon emission responsibilities was fundamental to China’s low-carbon development [8]. Putting this problem into practice in urban land allocation requires finding the urban land that can assume a carbon-offsetting role. Underused land and negative space generated by the urban development process can be used to solve this problem. Countries around the world have extensively studied the redevelopment of underused land in urban areas [9, 10, 11], but research has found that the connotation and extension of this type of land are challenging to unify. Combining China’s dual carbon goals with the remediation of underused land and negative space can help Chinese cities address the above issues simultaneously. The emergence of carbon markets [12] will also bring financial opportunities for carbon offset retrofits in negative urban spaces.
Using suitable urban stock space for urban carbon offsetting is the simplest and most effective way to optimize the urban environment and promote realizing the Dual Carbon goal. Combining with the actual situation, we will take the negative space as the primary research object and explore the potential path and implementability of carbon offset renewal in this area.
Theoretical research
The meaning and significance of carbon offsetting
The Dual Carbon target, i.e., “carbon peak” and “carbon neutrality”, is a critical deployment made by China to promote the national concept of green and low-carbon development from a strategic perspective. The concept of carbon offset is a new model of payment for ecosystem services mechanism proposed in the context of the low carbon development concept.
Payment for ecosystem services refers to an institutional initiative to alleviate the conflicts between various interests to ensure the sustainability of ecological services through specific economic means [13]. Forest ecological compensation, for example, is a way to balance the interests of beneficiaries and providers by using forests as a public environmental product [14]. Carbon offsetting is the incentive for emission reductions, which is well established for other ecosystems like forestry and agriculture [15]. Current carbon offset studies in China focus on the macro level between industries [16] and county and city groups [17]. However, research on introducing carbon-offsetting instruments into urban planning or renewal has yet to pioneer. As an economic instrument beneficial to low-carbon development, carbon offsetting also applies to circulating carbon elements within cities. Then all construction activities in the town or between urban and rural areas that benefit from carbon reduction can attract the inflow of funds utilizing carbon compensation. It will support cities in carbon-reducing ecological renewal or land remediation of underused urban space.
Carbon-neutral relevance of underused land and negative urban space
In 2016, the former Ministry of Land and Resources clearly defined underused urban land, meaning that the cause of underused land is mainly due to inappropriate planning in rapid urbanization. Cao believes it also contributes to the formation of negative spaces on campus [18]. The analysis of the causes of negative space and underused land cannot attract people to be active due to inappropriate planning. However, because the concept of space is three-dimensional, negative urban space can include underused urban land in a broader sense. From the perspective of urban renewal, the two studies can learn from each other. Shanshan Feng believes that integrating brownfields into green infrastructure (GI) has been widely recognized as a sustainable development strategy in metropolitan areas [19]. A new paradigm, the smart city, is thought to enable people to live in greener and more sustainable cities [20]. China is also exploring and practicing multi-source data technology to achieve smart city physical examination. Analyzing the data and completing a city health examination will allow us to more efficiently identify negative spaces in the city that are less efficiently utilized, and many of these spaces will be available as landing spots for urban carbon offset projects, which will help cities to achieve green planning.
Study area and study data
Study area
Anda City, located in the southwest of Heilongjiang Province, is a county-level city under the administration of Suihua City and is situated at an essential node in Harbin-Daqing-Qiqihar industrial corridor. Anda has four streets, 13 towns, one township, and another four township-level units under its jurisdiction. By the end of 2020, Anda has a total land area of 3598.76 square kilometers, a total resident population of 357,500, and a central urban area of 2,262.81 hectares (not counting the new development zone of 2,062.69 hectares). It is a typical small and medium-sized city in northern China, which has a resident population of 215,800 in the center city region. As shown in Fig. 1, the central urban of Anda, which has much space for renewal and renovation, has the typical characteristics of the current situation of small and medium-sized cities in northern China. Industrial land within the urban development boundary of Anda totals 670.24 hectares, accounting for 29.62% of the total land area of the central urban; residential land totals 810.56 hectares, accounting for 35.82% of the total land area of the city center; park and woodland green spaces entire 99.51 hectares, accounting for 4.40% of the total land area of the center city regions. The green space rate in Anda is far from the 20% urban greenness expected in Copenhagen, which may be the world’s first carbon-neutral city, and this is the status quo for most cities in China, as shown in Fig. 2.
Location map of Anda and the current situation of central urban construction.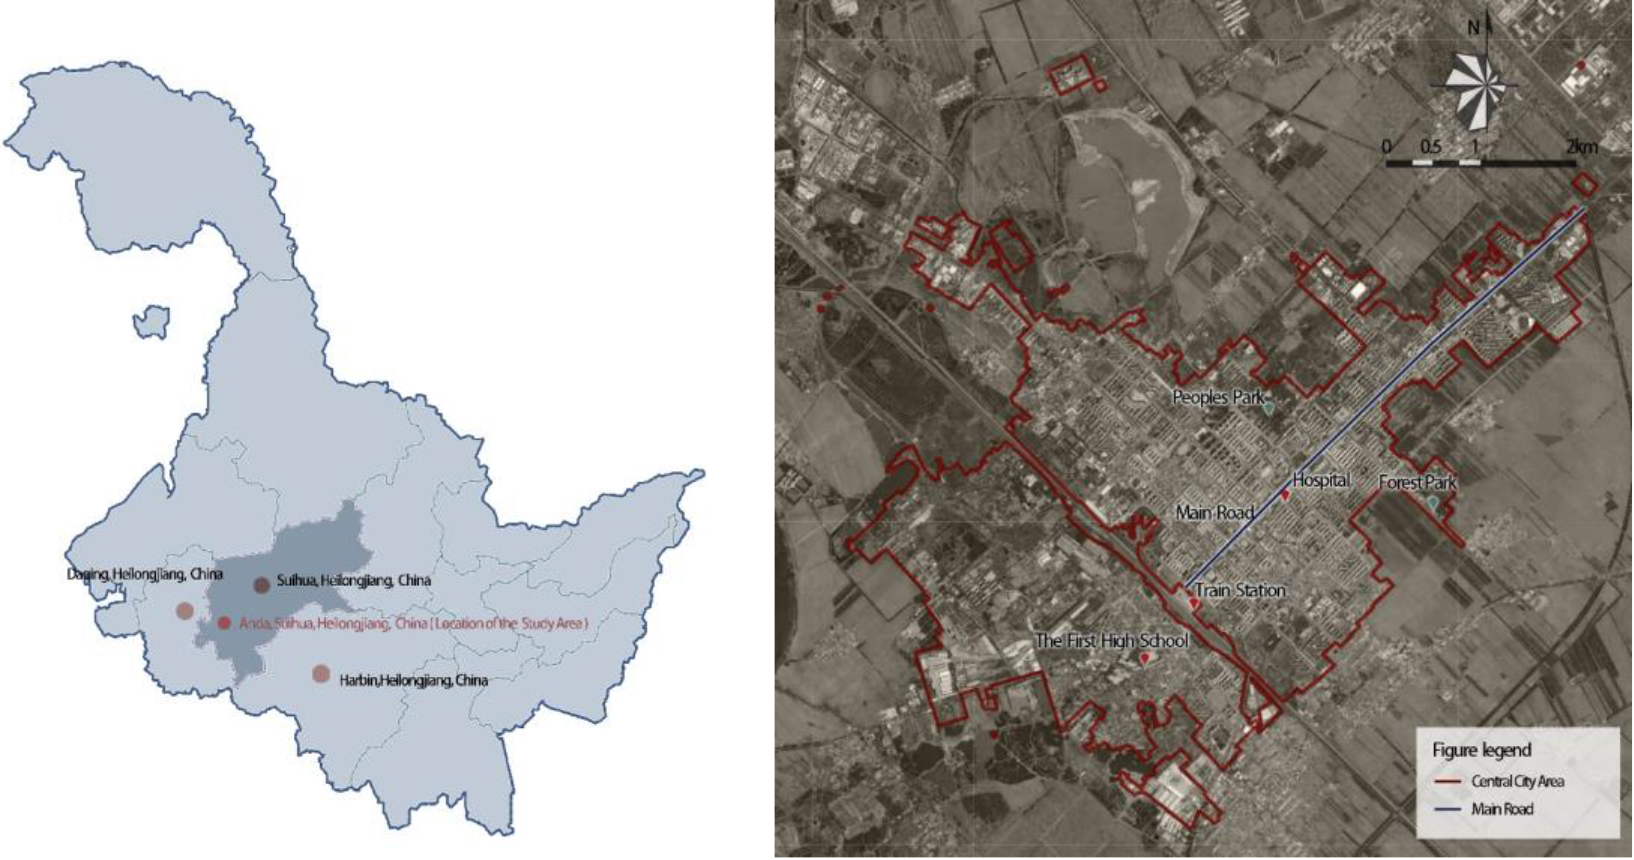
Map of the percentage of each land use.
The increasing level of urbanization in China and the excessive speed of urban construction have neglected the livability of urban space, which has led to many cities in China having unreasonable construction planning structures. The old urban areas in cities are environmentally dilapidated and need more land use efficiency. Through data technology, we can identify the urban spaces in central cities with negative population activities and make reasonable spatial activation or carbon compensation for these spaces. It is of great relevance to China’s city health examination and urban renewal and the realization of the Dual Carbon goals. We are committed to universal research. This approach can be applied to most cities in China.
Data source
This study’s relevant data includes the current status map of Anda’s main central urban planning area (2020) and Baidu Huiyan Urban Population Geography Data. City population geography data is one of the product services of Baidu Maps Huiyan Time and Space Data, which is of great significance in studying the development pulse of cities. Baidu Thermal Map has been used in many applications to study the urban human activity density [21, 23]. Regarding spatial research, Baidu Huiyan spatiotemporal data is more accurate than the statistics of the Baidu Thermal Map. By locating users using Baidu’s products, Baidu Huiyan can obtain data on the spatial distribution of the population in the region. This data helps to conduct population studies and quantitative analysis of land use effectiveness assessment for the study area, which can better assist practitioners in urban planning services.
Data preprocessing
(1) Processing of Baidu Huiyan urban population geography
The Baidu Huiyan service is one of China’s most popular data services, providing real-time user location data. We can obtain relevant data by crawling the data and structurally parsing the Baidu Huiyan urban population geodata platform (
To screen out relatively representative time nodes and the distribution of crowd dynamics in the relevant cities, we collected positioning data from June 1 to June 7, 2022, from 0:00–23:00 in Suihua City. We carried out the crawling data every hour. The sampling accuracy of data points is 200 m. The data structure contains four coordinate systems and the total number of user visits to the Baidu platform within the radiation range of data points at the punctual moments. As shown in Table 1, the system marked the total number of times in the field as a value. We need to crop out the data points in the central urban of Anda through ArcGIS because the minimum range obtained by Baidu Huiyan data is the prefecture-level city range, which is too large for us to study the negative space in the center city regions in this paper. We finally obtained 168 data sets with 44,693 data points to analyze the variations in the spatial and temporal distribution of crowd activities in the central urban of Anda during the day.
Structure of population geography data table (truncated)
Structure of population geography data table (truncated)
(2) Anda center city region vector database map
Based on the satellite map and the status quo map of the main urban area of Anda, we divided and vectorized the parcels in ArcGIS to edit the center city regions of Anda as a spatial basis to precisely distinguish the vitality status of each plot within this area. Eventually, with the new development zone in Anda, we implemented 1602 plots in the vector database map.
(3) Unified projection coordinate system
The final data points of Baidu Huiyan urban population geographic data only have a geographic coordinate system. To realize the subsequent research of nuclear density analysis of population geographic data with the vector data of the central city of Anda, the conversion and re-projection function of the ArcGIS coordinate system is used to finally realize the spatial unification of the projection coordinate system of both.
Research framework
As shown in Fig. 3, the study of identifying negative space in central urban areas based on Baidu Huiyan population geography data consists of three steps.
Research framework of negative spatial extraction analysis in the central urban area based on Baidu Huiyan population geography data.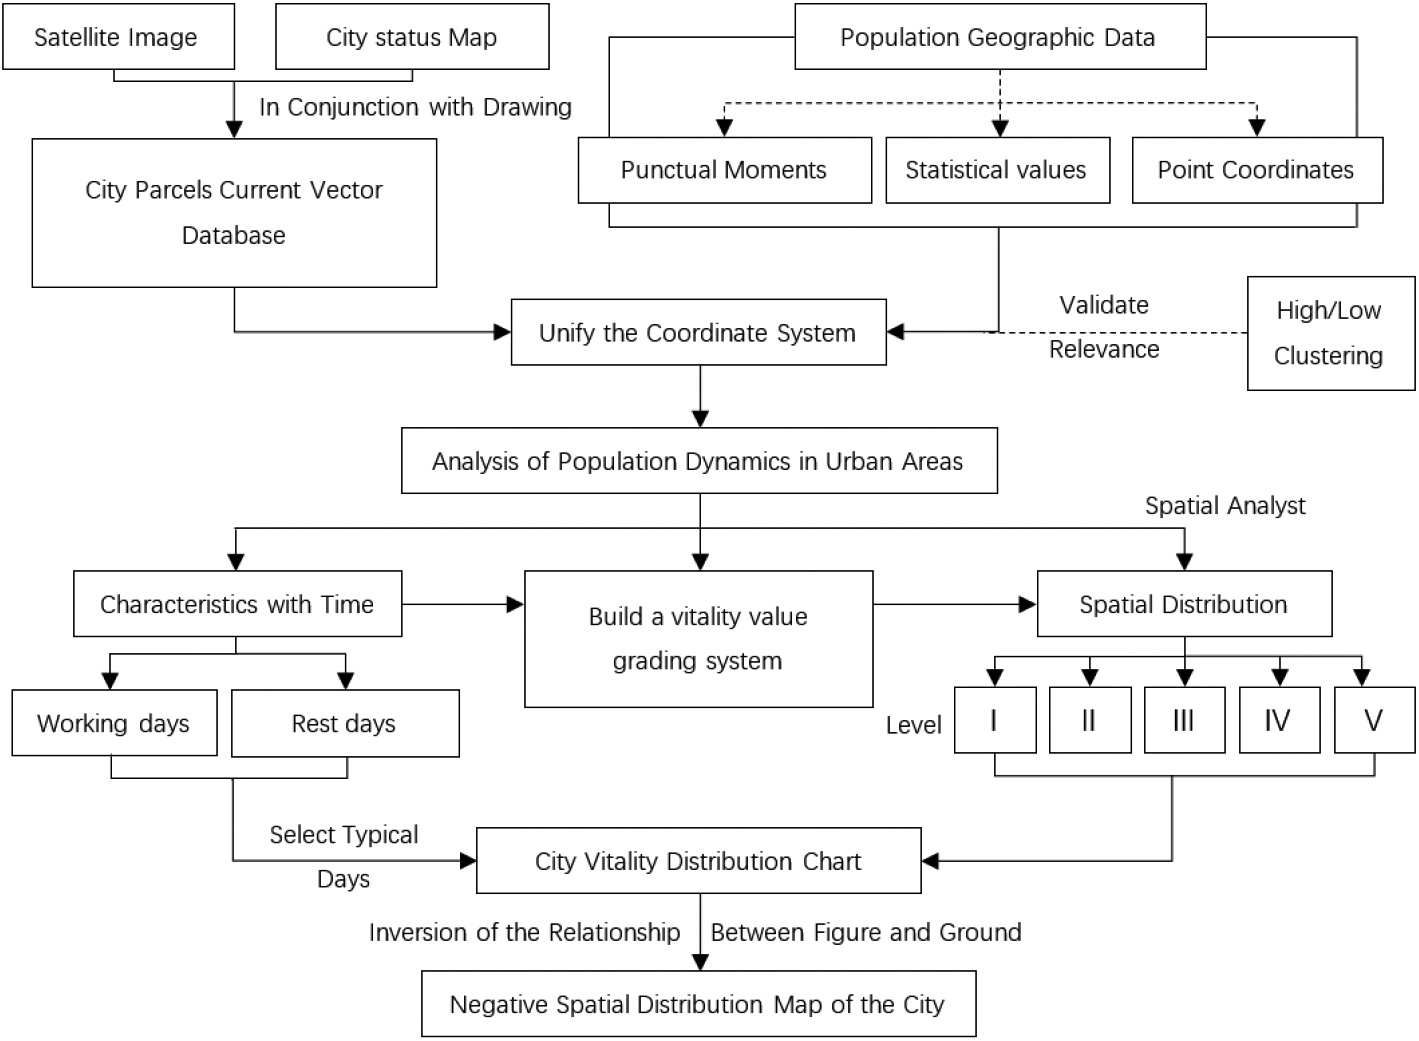
(1) Verify the base database correlation and unify the coordinate system.
Firstly, we use high and low clustering analysis of population geographic data to verify that the data points are relevant in spatial distribution. Then, we unified the projection coordinate system in Arcgis between the population geographic data and the vector database of the central urban area to ensure that there is no spatial deviation between the two to realize the analysis of population vitality in center city regions.
(2) Mapping the distribution of vitality in the central city.
When analyzing the dynamism of the population in center city regions, we construct a vitality value grading system that matches the dynamism of the people in the city under study by studying the characteristics of changes in vitality value data at each time. We analyze the vitality values of each area equally, draw a vitality distribution map of the central city, and classify the vitality grade into five levels.
(3) Negative spatial distribution map of the central city.
We Retained the highest number of vitality values in each block as a reference for spatial activity. We draw on the theory of inversion of the relationship between figure and ground and reverse the dynamism grading distribution map can get the negative spatial distribution map of urban areas.
Using the spatial autocorrelation tool of Arcgis, we analyzed the population geographic data to determine the distribution characteristics of population vitality over time in the central urban area and to identify the periods when the population is active. And then, we implemented the data points into the vector database of the current situation of each parcel in the central city to determine the scope’s location in the town where the population is active.
Results of high and low clustering analysis.
Clustering analysis of the population geographic big data shows that the distribution of z-scores in the central city of Anda in one day ranges from 0.59 to 21.62, where the highest value of the data analysis is located at the time node of the day 16:00, as shown in Fig. 4. At the same time, by combining the trend of the total number of statistical values at each time node of the day, we can learn that the time when people are active in the central city of Anda distributes between 7:00 and 21:00. Z-scores obtained from cluster analysis are generally higher than ten during this period,as shown in Fig. 5. For cluster analysis, when the z score is greater than 2.58, it shows that the probability of the relevant data points randomly generating this clustering pattern is less than 1%. To be as accurate as possible, we will conduct this study when z-scores are greater than 10 for the urban vitality distribution. This period also fits a reasonable time range for people to go to work and school, relax, and play on holidays. 22:00 to 6:00s the next day is the main range of periods where z-values are below 10. This period is when most of the population rests at night. We will not include the rest time in the urban area vitality study.
Characteristics of population clustering over time in the central urban of Anda.
By quantifying and grading the vibrancy value of each parcel within the central city at the mid-macro scale, we can determine the positive and negative vibrancy locations within the central city. The maximum value of the vitality value of the site at each whole-point moment of the day is the vitality value limit at that time, with 0 as the beginning to the limit value as the vitality value interval at that time, using the natural segment point method that comes with ArcGIS to divide the interval into five gradients, we can get the vitality value data of each parcel in the central city at a specific moment of the day and the vitality level classification criteria.
As shown in Fig. 6, taking June 4, 2022 (Saturday, rest day) as an example in the time range of 7:00–21:00, the maximum value of plot vitality on June 4 is 113.41, so the interval of vitality value at this moment is 0–113.41. After that, we calculated using the ArcGIS natural breakpoint method and divided the vitality level of each moment from strong to weak into five classes, as shown in Table 2.
Folding statistics of the maximum value of vitality by the time in the central city parcels of Anda on June 4.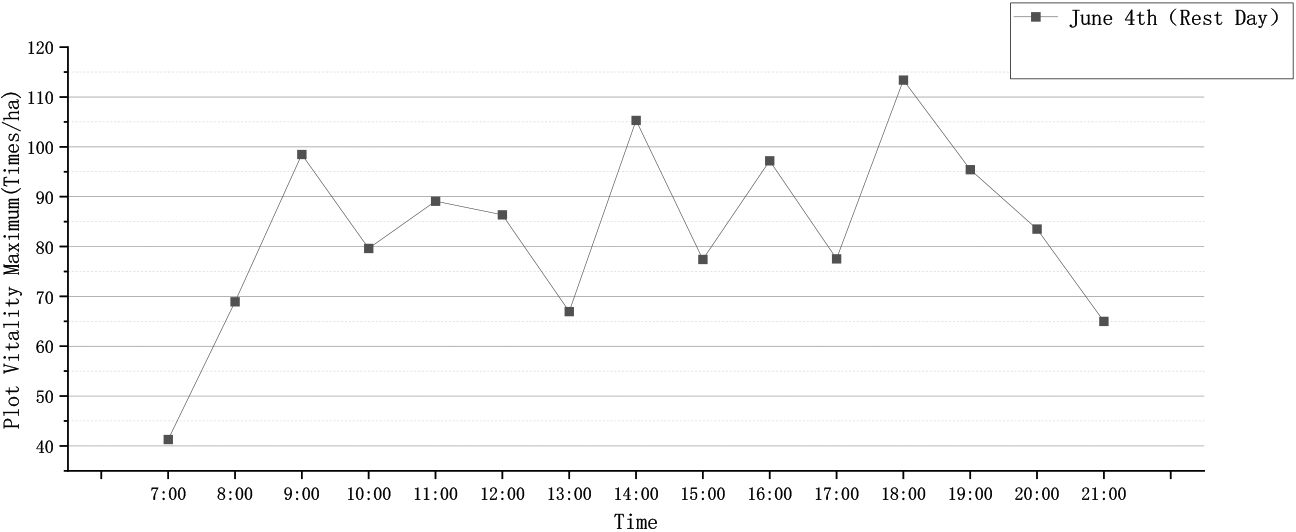
June 4, the day of 7:00-21:00 each punctual moment of urban plots vitality value classification statistics table
Results of the analysis of population nuclear density in the central urban of Anda during different hours on rest days.
Analysis of the spatial and temporal characteristics of crowd activity in the central urban
Taking the rest day as an example, we conducted a nuclear density analysis of crowd activity in the central city of Anda every hour. We could obtain the spatial distribution dynamics of the population in the center city regions of Anda on that day, as shown in Fig. 7. In the nucleus density analysis diagram, the darker the color, the higher the nucleus density, i.e., the more people gathered and the more concentrated the activities; on the contrary, the lower the nucleus density and the less crowded activities.
According to the analysis, there is a clear direction of movement of people’s activities in Anda on rest days. Niu Street is the main street of Anda, along which there are more commercial land, residential land, and public service land. The overall crowd activity in the urban area of Anda revolves around both sides of Niu Street. From the perspective of green areas, the crowd activity in People’s Park in the north-central part of the city is higher than in Forest Park at the eastern end of the town. Crowd activity was consistently lower in the western and southern parts of Anda City. The area in the south where higher activity occurs is in and around Anda City High School No. 1. The western and southern parts of the city have a high concentration of industrial land, poor environmental quality of residential land, low level of urban construction, and a lack of attractive public space. These may be the main reasons for the intense activity of people and the negative spatial appearance in this part of the city.
Distribution of vibrant plots in the central urban
According to the Vitality Value Grading System, we visualized the degree of activity of parcels in the central city of Anda, as shown in Fig. 8. Implementing the level of vibrancy into specific plots helps conduct urban studies on a plot-by-plot basis. We show the level of activity in colors from bright to dull. Red is very active, orange is more active, yellow is moderately active, gray is less active, and blue is inactive. After analysis, parcels that can reach a very active vitality value are usually commercial sites. Residential sites with a better living environment or convenient surrounding facilities can earn a relatively active and moderately active activity level. As with the nuclear density analysis results, the inactive lots are usually industrial or residential sites adjacent to industrial sites.
Results of urban vitality distribution in the central areas of Anda at different times of the day on rest days.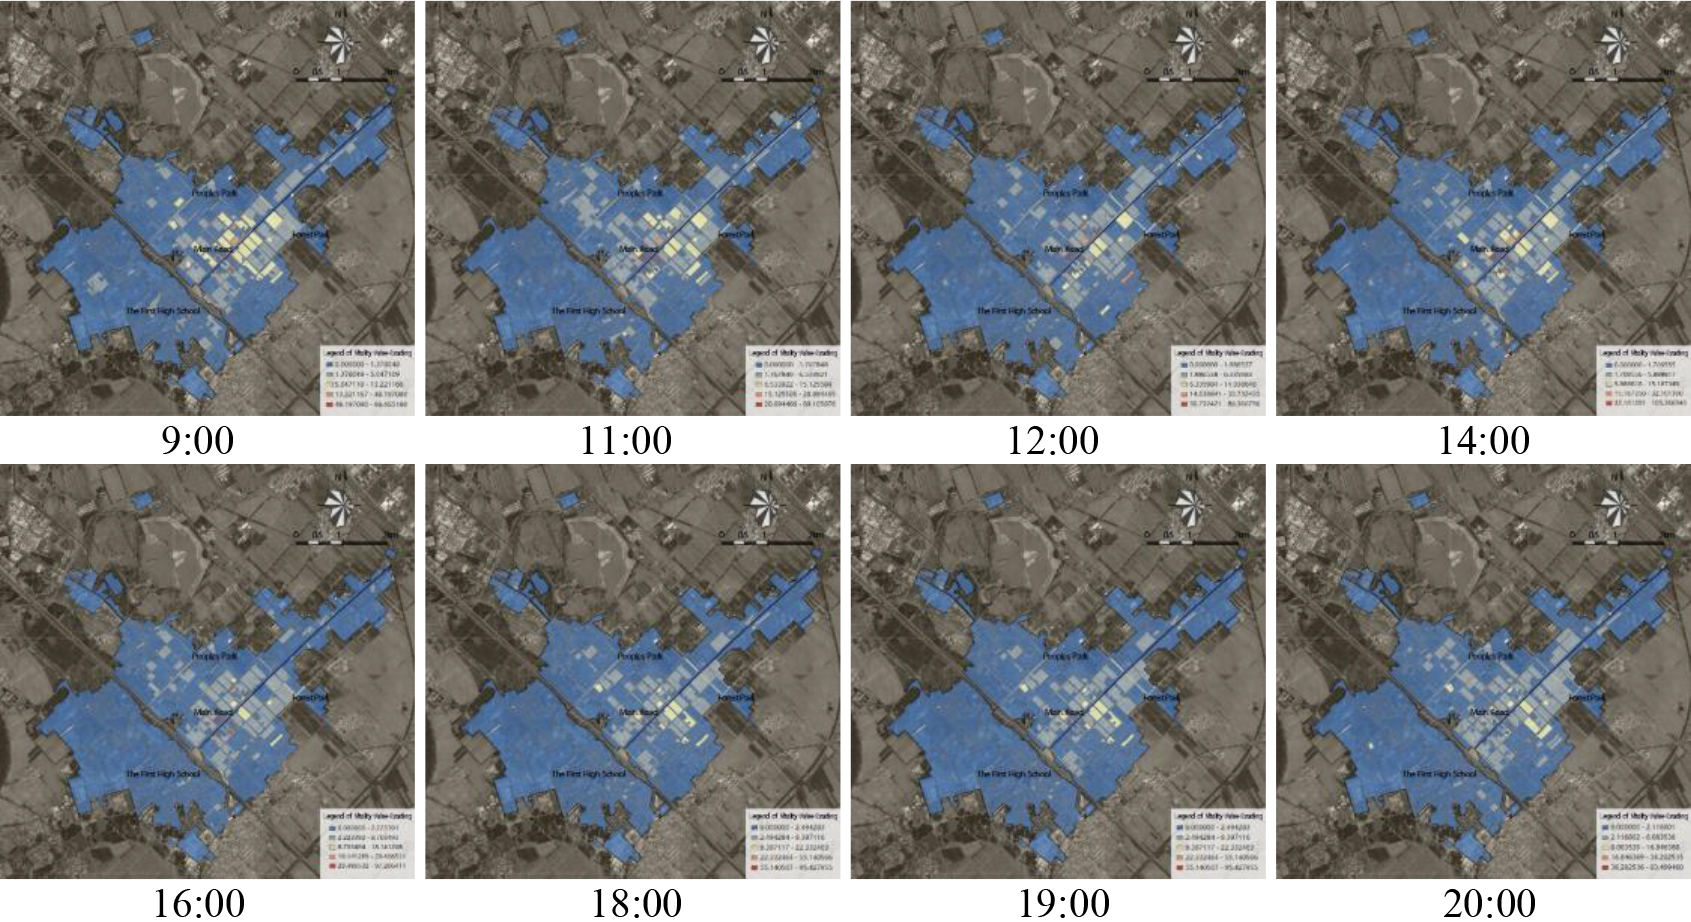
Combining the research results from 7:00–21:00, and we map the vitality distribution in the central area. The mapping principle is that the vitality value of each plot is based on the highest score and plotted into the urban vitality plot distribution map, as shown in Fig. 9. We study negative spaces in urban areas and propose retrofitting strategies for these negative spaces that may be suitable for green carbon offset retrofitting. The activity value can reflect the attractiveness of each parcel to urban residents. We do not count the lots that can reach a better activity value as negative spaces.
Results of the distribution of vitality in the central area of Anda.
The distribution of urban dynamics can reflect the use of urban space. Roger Tranci argues that we can use the theory of the relationship between figure and ground when studying the proportional relationship between ground-level architectural solids and open voxels. Exploring positive and negative urban spaces can draw on this thinking, considering positive active spaces as the figure and negative lost spaces as the ground. In order to observe the distribution of negative spaces, we highlight the city’s least vibrant areas when mapping negative spaces in Anda based on the vitality grading system. We categorized all those areas with activity at less active and above as non-negative spaces and changed the grading system to four levels, as shown in Fig. 10. From the perspective of spatial distribution, the negative space in the urban area of Anda mainly locates in the western and southern parts of the city. In addition to industrial land, this part is primarily a shantytown residential area with a poor environment adjacent to industrial land. We need to renovate them by increasing the intensity of urban development and green renewal.
Results of negative spatial distribution in the central city of Anda.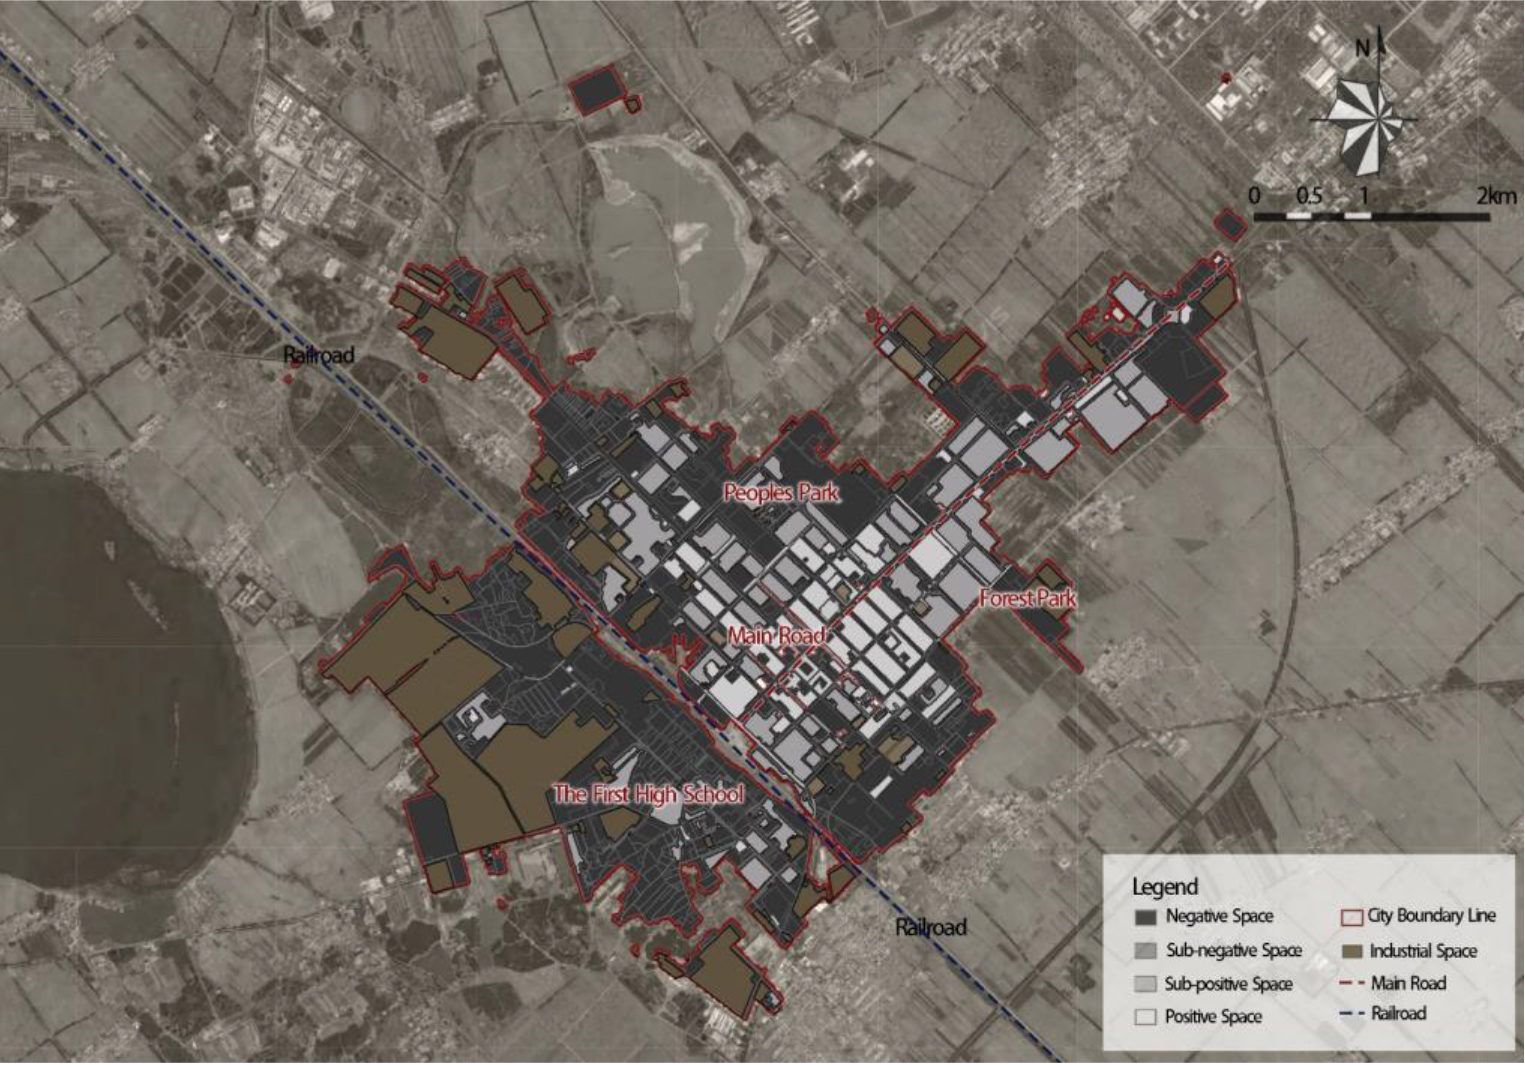
Carbon offsetting strategy of Anda
With carbon peaking and carbon neutrality as the target orientation, Chinese urban construction has gradually clarified the strategic policy of reducing carbon emissions and increasing urban carbon sinks. Using the data of population geography to extract the negative space in the central area of Anda and implementing the carbon offset optimization transformation is beneficial to reduce carbon emissions from the urban layout perspective, as shown in Fig. 11.
Map of carbon offset strategy in Anda.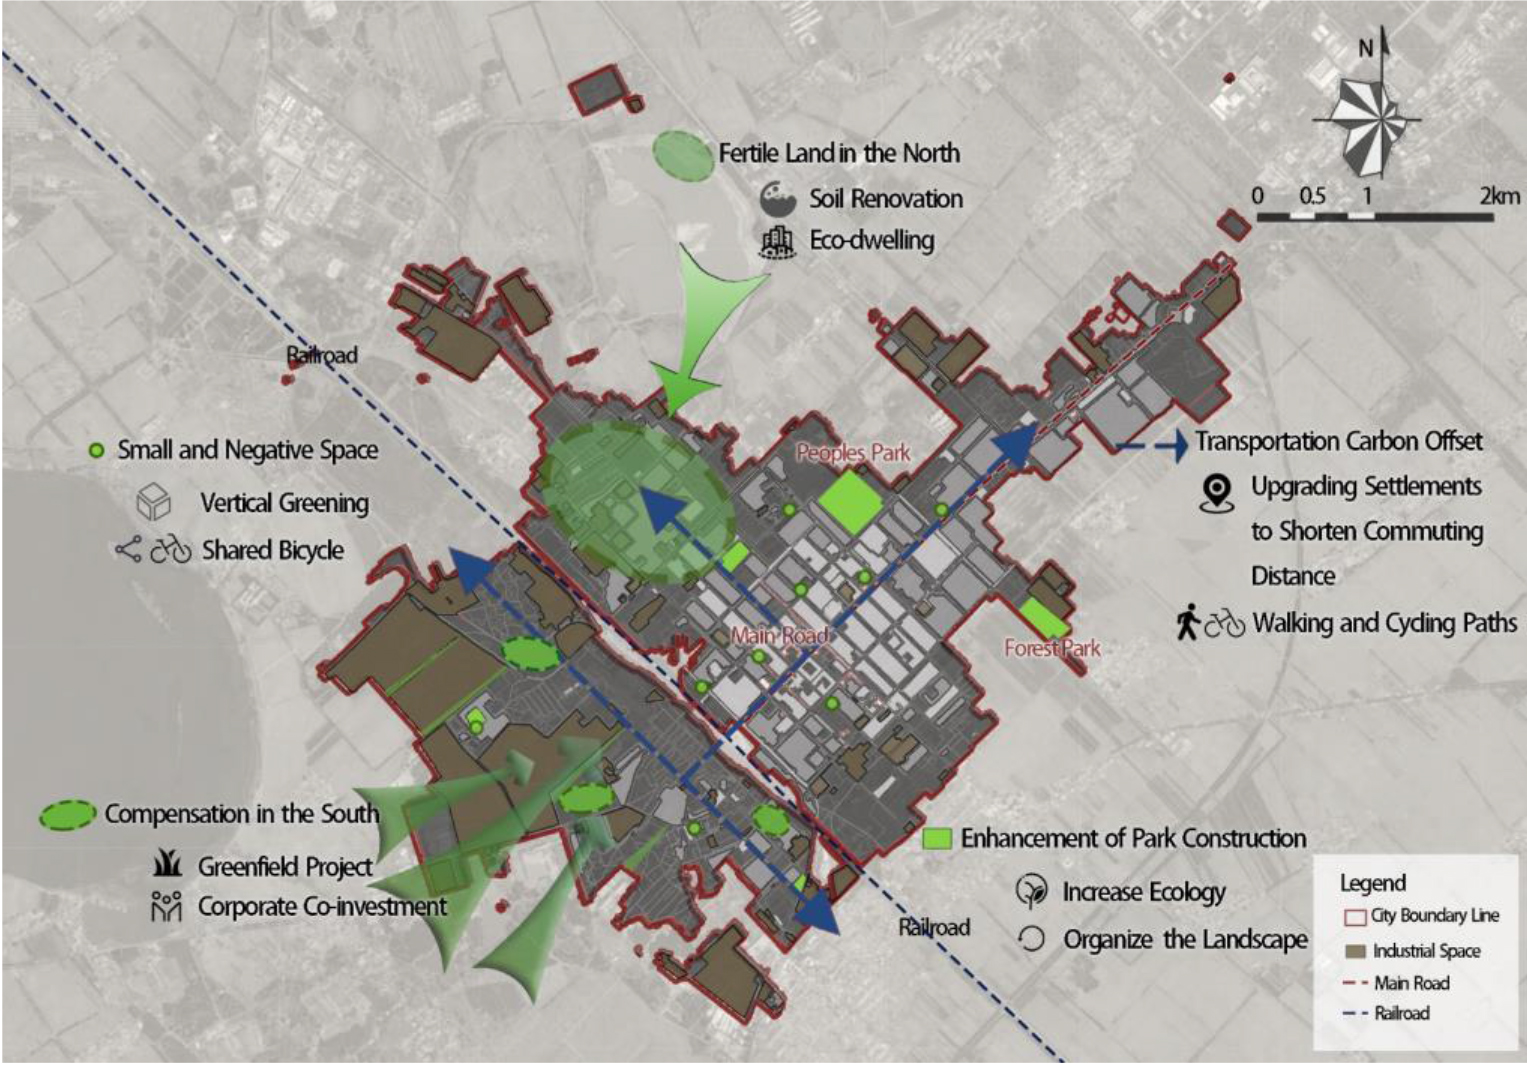
(1) “Fertile Land Creation” in the western part of the city
Urban land has excellent potential for ecological services. The “fertile soil” transformation of the soil structure destroyed by rapid urban construction and development is beneficial to alleviate the contradictory relationship between humans and land while increasing the carbon storage capacity of the soil. We can achieve this transformation by conserving degraded soils and improving their functionality (e.g., storage of greenhouse gases). Anda City has built up the site along both sides of Niu Street better. The western part of the city needs to be better built up in its current state, has more fragmented industries, and is unsuitable for further destructive development. The strategy of operating “fertile land,” increasing the land’s compound, improving the soil quality, and leaving enough space for woody plants will help optimize the carbon pattern of the central area of Anda.
(2) Industrial compensation in the south of the city
Zenghua Gong believes that it is of great theoretical and practical significance to study the realization of corporate social responsibility in the context of the low-carbon circular economy [24]. The geographical location of Anda and Daqing is close to each other. The high proportion of industrial land in the central city of Anda mainly concentrates in the south and in the new urban development zone on the west side, which has a heavy burden of urban carbon emissions. In this part of the low-energy negative space adjacent to industrial land, we should require companies to meet carbon emission standards and minimize their disturbance to the urban environment. In this area, we encourage companies to offset their carbon debt by jointly funding the construction of many additional public urban green spaces. It will enable companies and the city to establish a green business image and improve the ecological status of the southern part of the center city region.
(3) Negative space transportation carbon offset
The low-vitality negative areas in the central city of Anda are contiguous and concentrate in residential lots between the urban public service system and large industrial areas. In this regard, we make the following recommendations. First, increasing the urban green space system, promoting green modes of travel, including walking, cycling, and public transportation, and building public low-carbon transportation spaces with excellent and attractive environments are all conducive to reducing carbon in cities. Secondly, improving the flow relationship between urban industrial areas and residential areas, developing residential living spaces with higher green space indexes near industrial areas, shortening residents’ travel distance, and improving the convenience of low-carbon travel modes for residents can effectively enhance the carbon offset strength of cities. In addition, to ease the summer ventilation in Anda, we can adjust the road network structure on the south side of the railroad and add wedge-shaped green areas along the road in the southwest direction, which is also conducive to urban ventilation.
(4) Green transformation of small negative space
The city’s small negative space has scattered distribution characteristics, a small surface, and a large quantity. They primarily distribute in the marginal area of the site with poor accessibility and the miscellaneous storage space of the old district. According to the specific characteristics of these spaces, we can adopt carbon offset optimization strategies such as three-dimensional greening to improve the environment, green resources to share, and environmental knowledge to promote to increase the carbon sink capacity of these spaces and influence the low-carbon behavior of residents.
(5) Existing parks and green spaces to enhance construction
We need to strengthen its urban green space environment. Increasing the ecological and pro-people nature of urban green areas can improve the city’s carbon offset system while enhancing residents’ awareness of caring for the city’s native green spaces. The vitality values of the two main parks within the central urban of Anda could be higher. When renovating existing parks, clean up negative areas with overgrown grass and old facilities, re-plan the green landscape, and improve the carbon sink capacity of current green spaces in the city.
Guided by the goal of Dual Carbon, carbon offsetting and optimization of negative urban space can be combined with carbon-neutral territorial spatial patterns, city health examination, urban renewal, and other tasks. We can improve the city health examination through the technical means of data and determine the content of planned new and planned renewal within the urban area in the territorial spatial planning based on the study of the city’s current situation. In addition, using mechanisms such as carbon banks and carbon markets to attract enterprises with high carbon emissions to enter into public-private partnerships with the government can complete the construction of urban carbon offset projects. This model suits localities to improve the urban structure, tap the stock resources and achieve the Dual Carbon goal. As shown in Fig. 12, we demonstrate the current implementable pathway for carbon offsetting using negative urban space in Anda.
Optimization idea of carbon compensation in the negative space of Anda under the Dual Carbon target.
In recent years, the application of data technology has brought a more practical and reliable approach to the study of urban space. Using population geographic data to assist cities in completing city health examinations can save human resources and provide a landing point for urban carbon offsetting by overseeing the spaces in urban areas where people are negatively active in real time. Practicing carbon offset projects for the green transformation of cities will be beneficial for cities to achieve Dual Carbon goals and ecologically sustainable development. Currently, the accuracy limitation of population geographic data affects the accuracy of urban spatial dynamics studies. This problem will be solved with the continuous improvement of data technology in China.