
Abstract
In recent years, wireless charging technology for electric vehicles has received increasing attention. Existing research has been limited to the safety of specific body parts in the electromagnetic environment of wireless charging for electric vehicles, with insufficient consideration for the overall human body and the electromagnetic safety of implanted medical devices. In order to assess its safety in the electromagnetic environment more comprehensively, a three-dimensional electromagnetic simulation software based on the finite element method is used to construct models of the human body and implanted medical devices in the electromagnetic environment of wireless charging for electric vehicles. The study aims to investigate the impact of this electromagnetic environment on the human body and implanted medical devices. The results indicate that, except for the maximum magnetic induction of 0.47
Keywords
Introduction
Electric vehicles are now regarded as the trend of road transportation, in order to reduce carbon dioxide emissions, gradually reducing global warming and climate change problems. Therefore, wireless charging technology has attracted more and more attention [1, 2]. The electromagnetic environmental safety issues associated with it have also received extensive attention. When life entities are exposed to external electromagnetic fields, the normal electromagnetic environment within their bodies may be disrupted, leading to biological effects due to electromagnetic exposure [3, 4]. Under high-power electromagnetic influence, human body temperature can rise. Upon reaching a certain level of temperature elevation, it can disrupt the heat transfer process between tissues, leading to tissue death [5]. Additionally, this electromagnetic exposure can interfere with the normal electromagnetic environment of precision devices. Therefore, there is an urgent need for research on the safety characteristics of human and implanted devices under electromagnetic exposure during wireless charging.
Miller et al. studied the electromagnetic environment of the wireless charging system of electric vehicle, which are composed of four modular 50–75 kW couples [6]. The results showed that when the wireless charging system ran at 260 kW, the fringe field inside and outside the vehicle cabin met the published International Commission on Non-Ionizing Radiation Protection (ICNIRP) standards. Cruciani et al. and Vaka and Keshri proposed that the magnetic field generated by wireless power transmission system based on electric vehicles could be reduced by shielding technology of active coils [7, 8]. The general principles of active shielding design were provided to shield the radiation source and reduced the radiation received by the human body. Park and Zhang et al. studied the wireless power transmission system for electric vehicle charging, and evaluated the electromagnetic environment of the system for various exposure scenarios [9, 10]. The results showed that the electromagnetic environment met the standard limits of public and occupational exposure. Chakarothai et al. put forward an experimental method to determine the internal electric field of wireless power transmission system exposure assessment by using the measured magnetic near-field data, and deduced the internal electric field intensity in the human numerical model [11]. Campi et al. studied the numerical analysis of electromagnetic interference generated by dynamic wireless power transmission system in implantable cardiac defibrillator [12]. In this study, the influence of implanted devices on the specific absorption rate in the head model are evaluated by calculation. Even a small implant had a significant influence on the specific absorption rate distribution and the corresponding local peak and mass average specific absorption rate [13]. Shah et al. exposed adult models of different medical implants to the leakage magnetic field of wireless power transmission system of electric vehicles, and evaluated the working conditions of implants such as traditional pacemakers and leadless pacemakers [14].
Currently, both domestic and international electromagnetic environmental safety analyses during wireless charging of electric vehicles are limited to specific parts of the human body, with insufficient consideration for the overall human body as well as the electromagnetic environment safety of implanted medical devices.
This study simulates the scenario of individuals carrying implanted medical devices while riding in electric vehicles undergoing wireless charging, constructs corresponding simulation models to investigate the distribution of electromagnetic fields, and, in conjunction with relevant standards, analyzes the biological safety of implanted medical devices. The findings indicate that, except for the magnetic induction intensity exceeding the limit at the human ankle, the impact of wireless charging on critical areas of the human body and implanted medical devices conforms to standards. This study provides a reliable basis for the development of wireless charging in the electric vehicle industry.
Principle of wireless charging for electric vehicles
The structure of the wireless charging system for electric vehicles involves installing the transmitter at a fixed location either above or below the ground, while the receiver is mounted on the chassis of the vehicle [15]. The wireless charging model for electric vehicles is illustrated in Fig. 1.
Wireless charging model diagram for EVs.
The alternating current (AC) output from the power grid is converted into high-frequency AC through rectification and filtering circuits, as well as a high-frequency inverter circuit. The AC then drives the transmission coil through a capacitance compensation device on the primary side, forming a resonant circuit that transforms electrical energy into magnetic energy at the corresponding frequency. Simultaneously, the alternating magnetic field generated in the receiving coil induces alternating current, creating electromagnetic resonance with the resonant compensation capacitor and winding inductance on the receiving side. The energy conversion device on the receiving side rectifies and filters the high-frequency AC from the receiving coil into direct current suitable for charging the onboard battery of the electric vehicle [16, 17]. The wireless charging principle for electric vehicles is illustrated in Fig. 2.
Schematic diagram of wireless charging for EVs.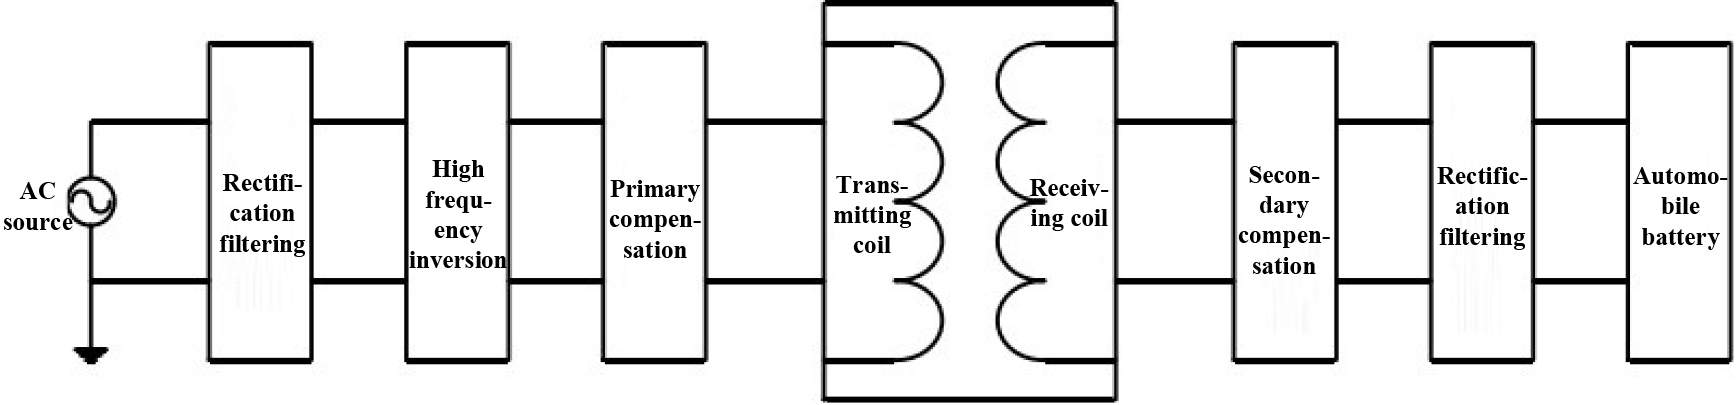
Finite element simulation principle of electromagnetic field
The electromagnetic analysis problem is essentially solving the Maxwell’s equations under given boundary conditions [18]. The following are the differential forms of the Eqs (1)–(4):
When using the system of equations to solve practical problems, it is also necessary to consider the influence of the medium on the electromagnetic field. In a uniform isotropic medium, the relationship between various physical quantities of the electromagnetic field and the characteristics of the medium is as Eqs (5)–(7):
In the above equation,
To simplify the computations related to the electromagnetic field, magnetic vector potential
Substituting Eqs (5)–(9) into Eqs (1) and (3), we obtain the partial differential equation for calculating electromagnetic fields, as Eqs (10)–(12):
In the above expression,
The wireless charging system for electric vehicles mainly consists of two parts: one is the modeling of the electric vehicle, and the other is the modeling of the wireless charging coil.
The literature mentions that in the electromagnetic simulation modeling of automobiles, it is necessary to simplify the model to ensure that the input data can be effectively utilized by the computer [19]. Based on a benchmark electric vehicle’s three-dimensional digital model, a simplified benchmark vehicle body model is established, as shown in Fig. 3, with geometric dimensions of the vehicle body being 4.2 m
The resonant coil used for wireless charging in automobiles adopts a toroidal structure, made of copper. The square plate constructed for the coil is made of polytetrafluoroethylene (PTFE) with a thickness of 1 cm. The coil is illustrated in Fig. 4.
The resonant coil used in this study employs a symmetrical structure, operating at an external frequency of 10.27 MHz, with a separation of 30 cm between the two coils [20, 21]. The specific physical parameters of the coil are detailed in Tables 1 and 2.
Resonant coil related parameters
Resonant coil related parameters
Resonant coil performance parameters
Electric vehicle model diagram.
Resonant coil model diagram.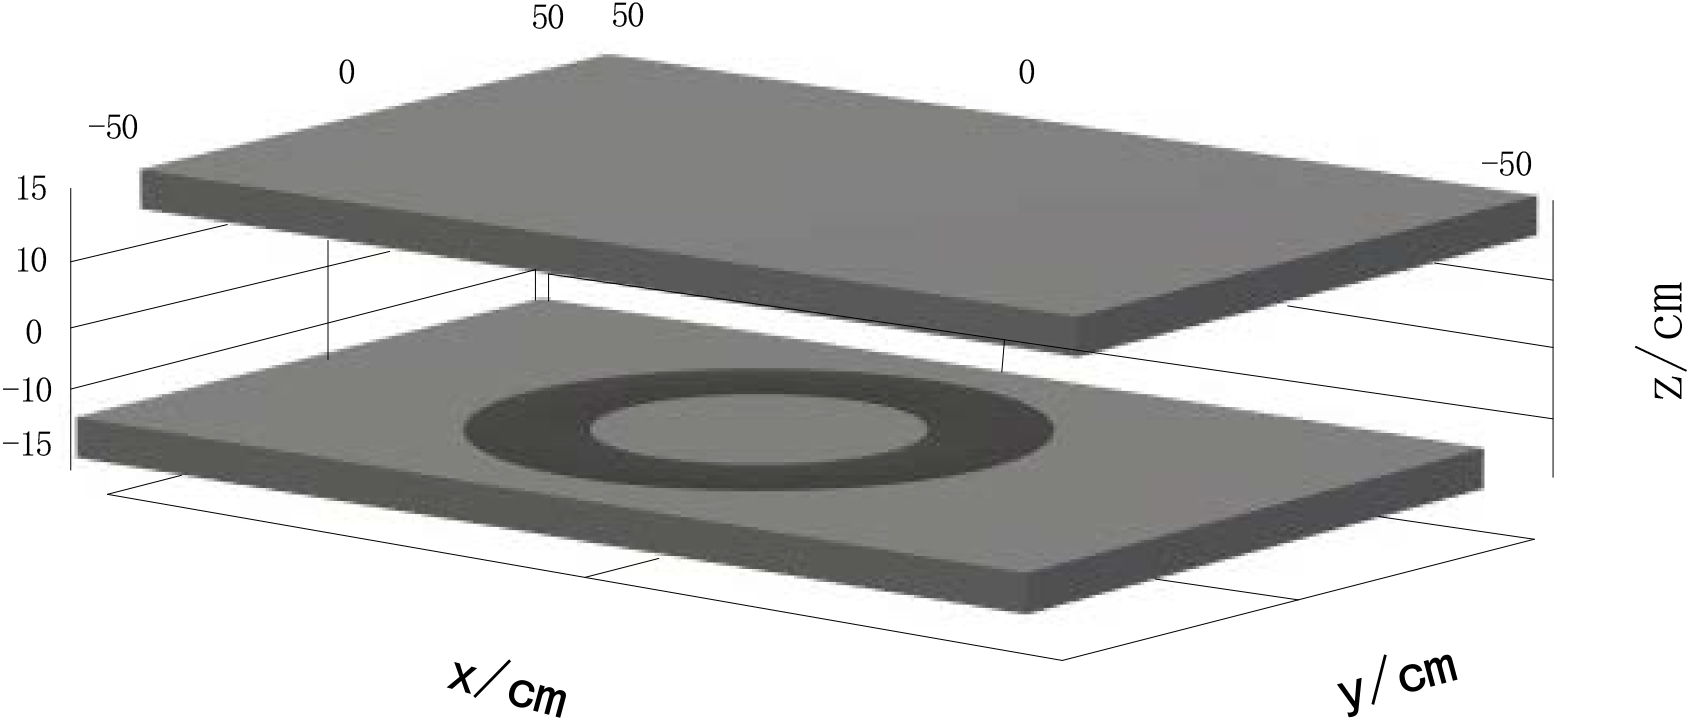
Typically, the simulation calculations regarding the exposure of the human body to radiation require complex and detailed human body models, primarily obtained through electron computerized tomography (CT) and magnetic resonance imaging (MRI) techniques. Since such models can be excessively intricate, this study simplified the standing posture model of the internationally recognized 1.75 m adult by modifying it to obtain a simplified seated posture model with a height of 1.36 m. The human head model follows the international standard 3-layer spherical head model [22], as illustrated in Fig. 5, comprising the three layers of the scalp, skull, and brain, with radii of 9.2 cm, 8.5 cm, and 8.0 cm, respectively.
Main tissue dielectric parameters at 10.27 MHz
Main tissue dielectric parameters at 10.27 MHz
Human body model diagram.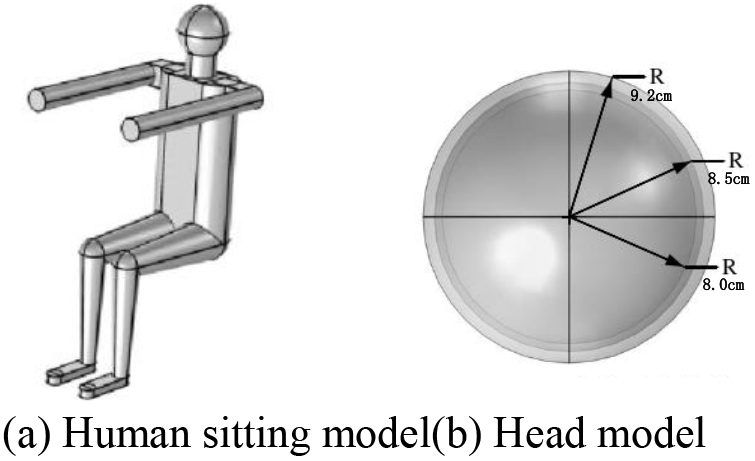
The relative position diagram of the car body and the coil.
Electromagnetic exposure on the surface of the human body involves phenomena such as reflection, refraction, and absorption. The distribution of absorbed electromagnetic exposure within the human body is not uniform and is influenced by parameters such as radiation intensity, exposure time, and the electrical conductivity and dielectric constant of human tissues. Therefore, prior to simulation modeling, it is essential to know the dielectric parameters of various tissues in the human body, providing reliable data for subsequent simulation calculations. The 4th-order Cole-Cole model [23] can be utilized to obtain relevant parameters at 10.27 MHz, and this model is capable of determining electromagnetic parameters within the frequency range of 10 Hz to 20 GHz.
The method of averaging the dielectric constant to derive tissue parameters has been employed in previous literature. The obtained results are presented in Table 3.
In current all-electric vehicles, charging coil placement varies, and this study primarily discusses the electromagnetic exposure on the human body when the charging coil is located at the center of the vehicle body. In the simulation model, the receiving coil is positioned at the bottom of the electric vehicle, with a vertical distance of 146.4 cm from the top of the human head and 128.9 cm from the human neck. The human feet align with the bottom surface of the vehicle, and the vertical distance from the receiving coil to the soles of the feet is 10 cm. The bottom of the vehicle is positioned 30 cm away from the transmitting coil. The relative positioning of the vehicle body and the coil is illustrated in Fig. 6.
As medical advancements continue to progress, the implantation of pacemakers has become a widely accepted routine therapeutic procedure in the field of cardiology. The implantation of pacemakers can replace the pacing point of the heart with pulse stimulation from electrodes, improve the pacing function of the heart, and make the heart beat rhythmically. Artificial heart pacing system mainly includes two parts: pulse generator and electrode lead. The pulse generator is powered by a lithium battery, and is packaged in a titanium shell which is well compatible with human tissues. The wire is made of platinum-iridium alloy, and the surface of the wire is covered with parylene. The connector module is made of 75D polyurethane, and the opening grommet is made of ETR silicone rubber [24].
In this study, modeling software was employed to establish a model based on pacemaker parameters and its implantation in the human body, as depicted in Fig. 7 [25].
Diagram of cardiac pacemaker and implanted human model.
Electromagnetic field distribution of wireless charging system
In order to accurately analyze the impact of the wireless charging system on the human body, it is essential to analyze the electromagnetic field of both the wireless charging coil and the entire vehicle body.
A three-dimensional section line was extracted from the resonant coil in Fig. 4, with the starting point at (0, 0,
Electromagnetic field distribution characteristics diagram of the coil.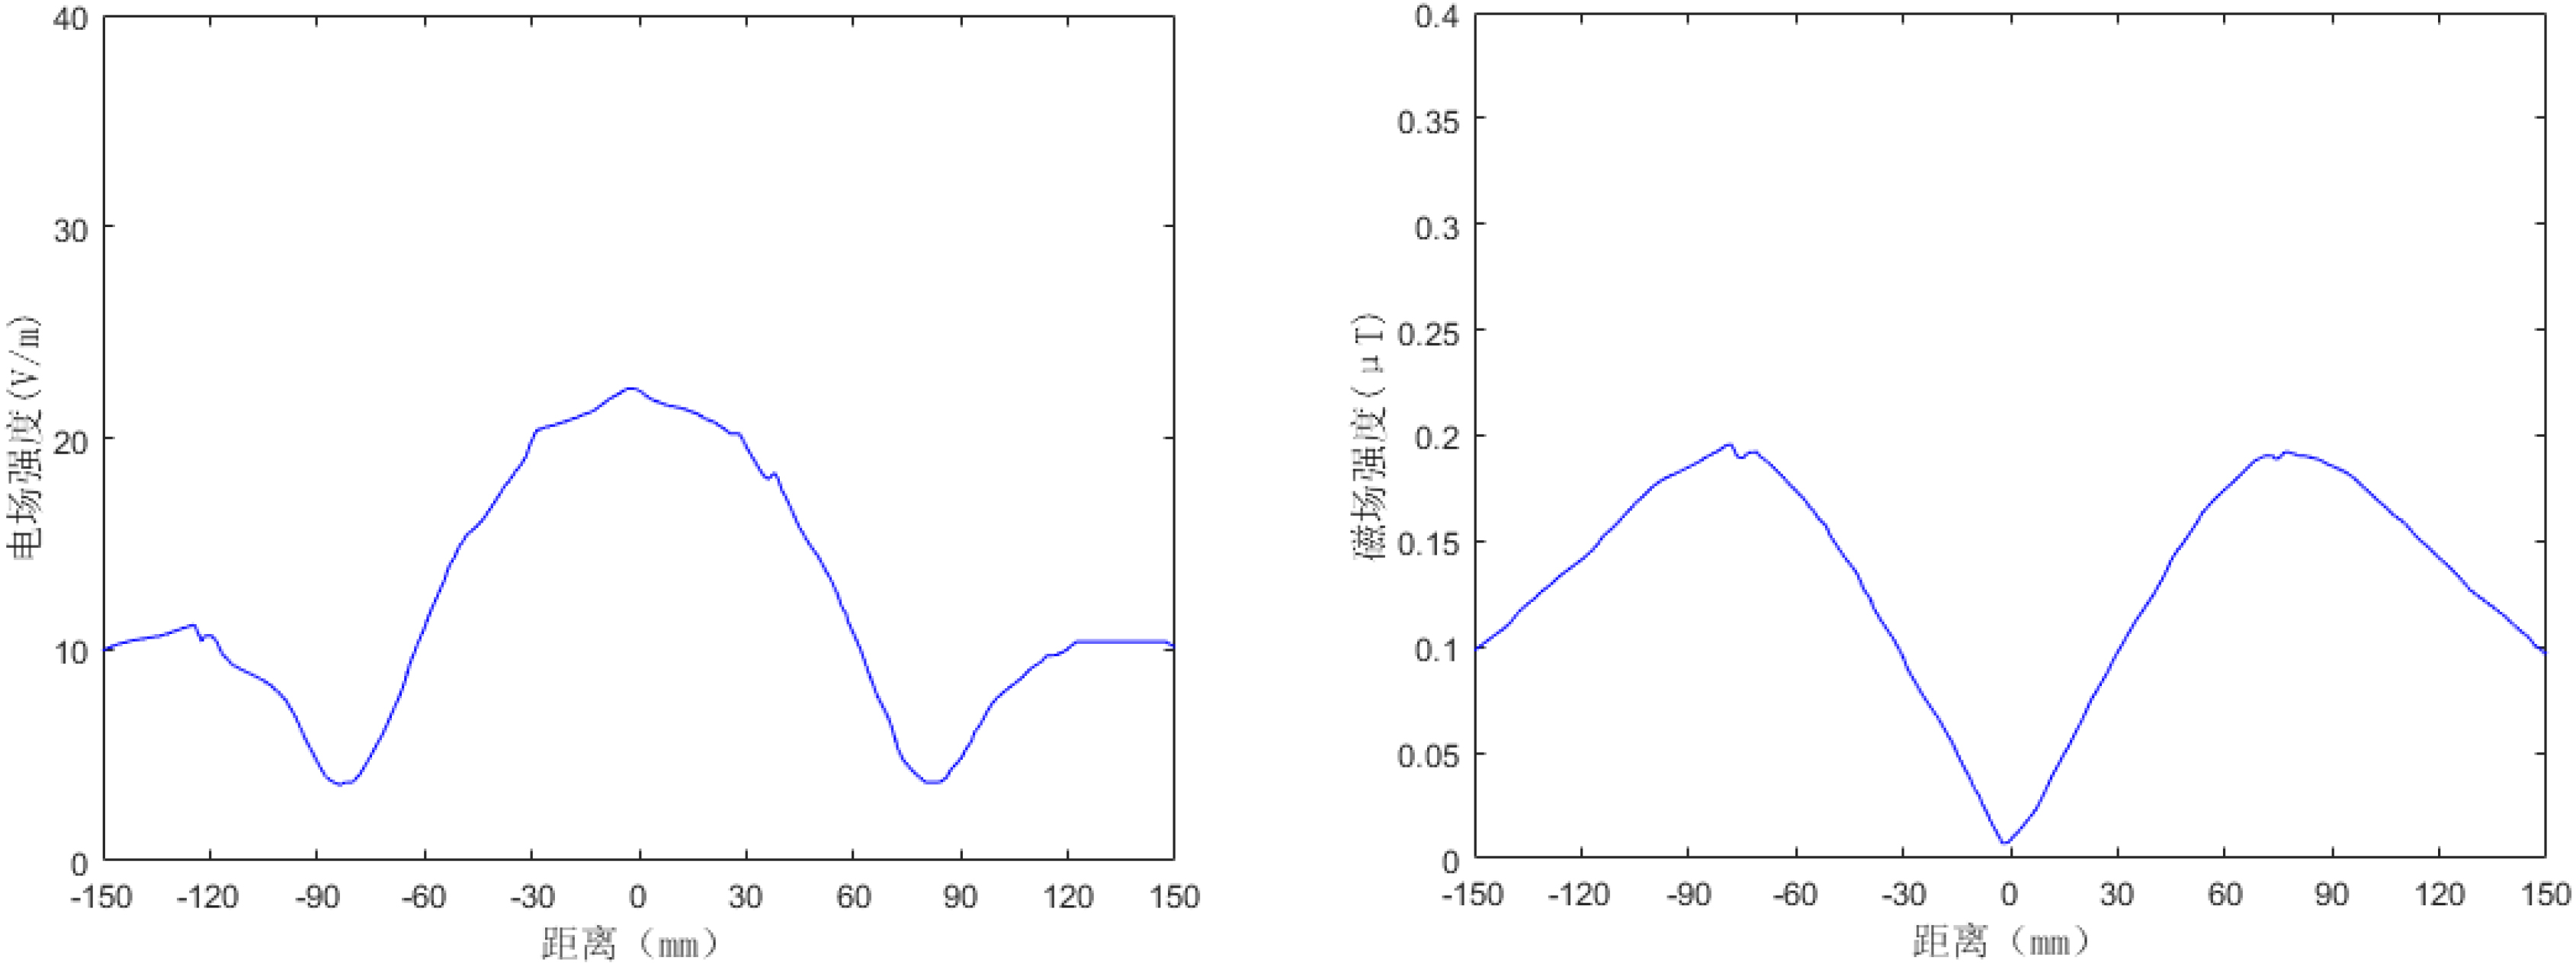
From Fig. 8, it can be observed that the electromagnetic field between the two coils exhibits symmetry along the direction of the section line. The electric field is most intense at the center of the coil, reaching a value of 22.3 V/m, and it decays rapidly with distance. The magnetic field is primarily concentrated around the coil, with minimal magnetic field at the center of the coil, where the maximum magnetic field value is 0.193
Examining the electromagnetic field on the cross-section of the vehicle on the driver’s side (
Electromagnetic field slice map of section (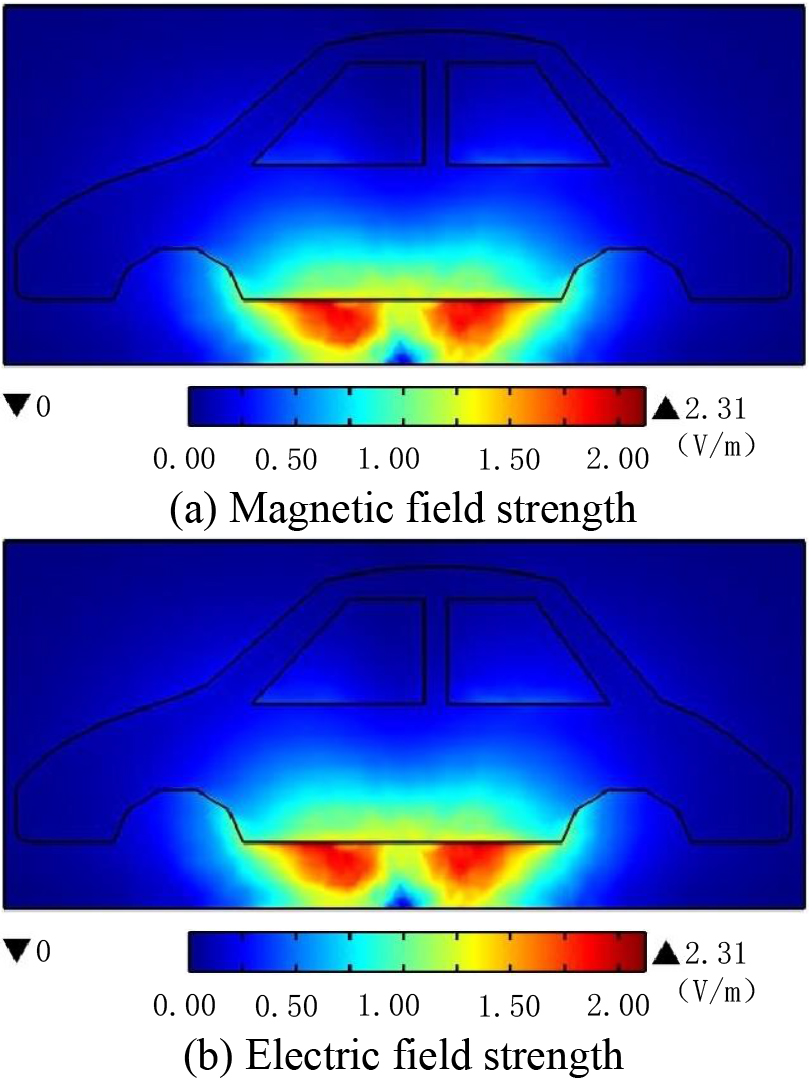
From Fig. 9, it can be observed that the magnetic field is primarily concentrated in the transmitting coil, while the electric field is mainly concentrated around the transmitting coil. As the height increases, the values of the electromagnetic field strength decrease. The electromagnetic field intensity is higher at the driver’s seat, while the energy distribution at other locations on the vehicle body is relatively small. The maximum magnetic induction intensity is 1.15
Distribution of electromagnetic fields in the human trunk
From the analysis of the electromagnetic field distribution in the wireless charging system, it is evident that the human torso is relatively close to the electromagnetic field, experiencing a significant impact. The following is an analysis of the electromagnetic field distribution in the human torso.
A tetrahedral mesh was applied to model the human body, and the results of the meshing are illustrated in Fig. 10.
Human network subdivision diagram.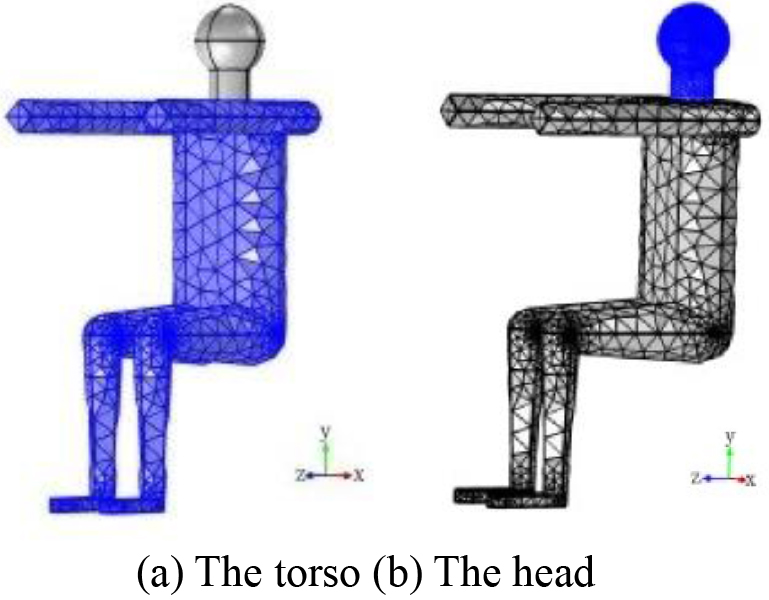
The distribution of electric field intensity and magnetic induction intensity in the torso part of the human body is shown in Fig. 11.
Distribution diagram of electromagnetic field intensity in body.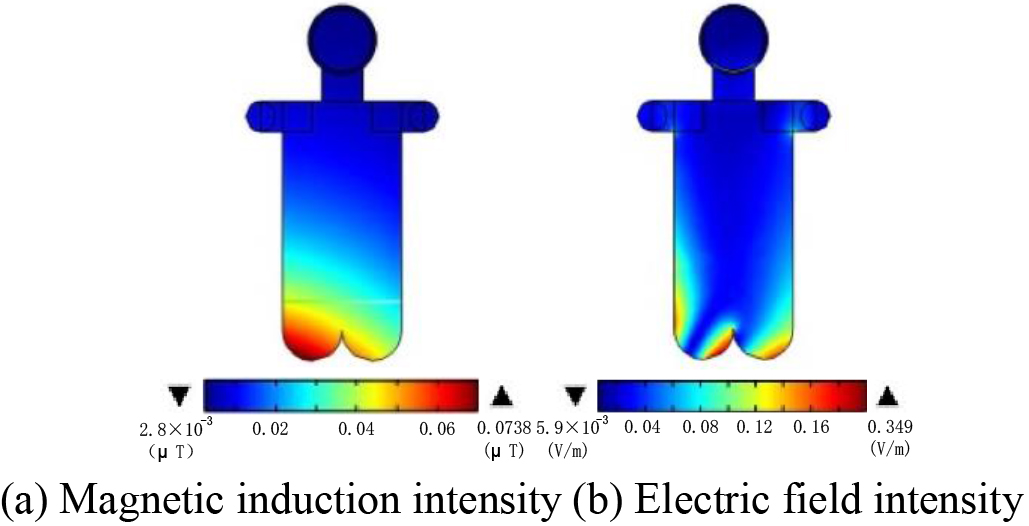
From Fig. 11, it can be observed that the maximum values of magnetic induction intensity and electric field intensity occur at the ankle position, with the magnetic induction intensity at the feet exceeding that of other parts of the body. The maximum value is 0.407
To provide a clearer representation of the distribution of fields in the human body, a cross-sectional analysis was conducted. A section was taken at the center of the head (
Slice map of electromagnetic field intensity in body.
From Fig. 12, it can be observed that, as the human body is non-magnetic, the distribution of magnetic induction intensity is height-dependent. With increasing height, the magnetic induction intensity values decrease, and the lower part of the body is more affected than the upper body. The hips are more affected than other positions in the upper body, while the head is minimally affected by the magnetic field, with a maximum value of 0.0738
The distribution of electric field intensity is different from that of magnetic induction intensity. The electric field intensity is greater in the part of the body in contact with the seat, with higher values on the sides of the body than in the center. The electric field intensity at the head, specifically at the skull, is greater than that on the scalp and brain. The maximum electric field intensity is 0.349 V/m.
To more precisely ascertain the impact of the charging coil on major organs, the following analysis focuses on the electromagnetic field distribution in the human brain and its crucial tissues.
The calculated results for the electromagnetic field distribution in the head are presented in Fig. 13.
Distribution diagram of electromagnetic field intensity in the head.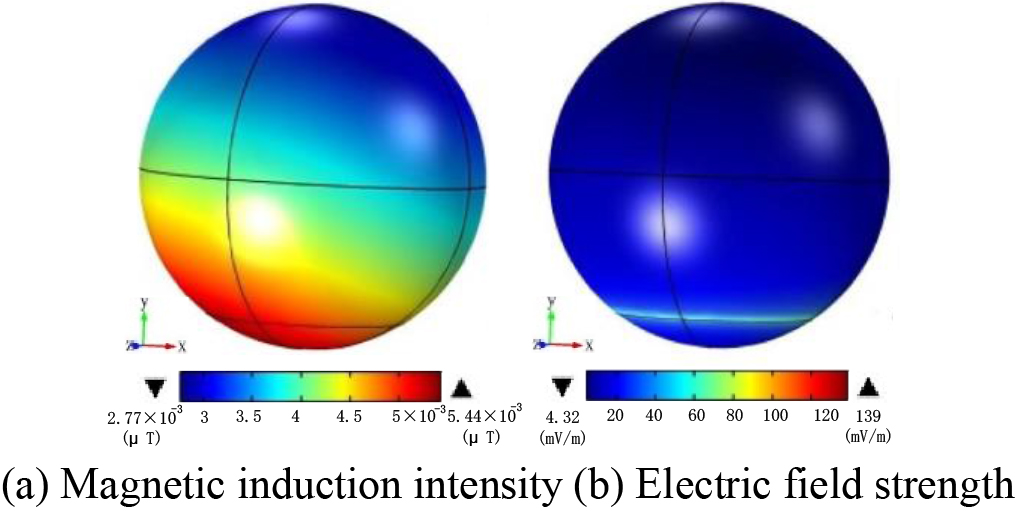
From Fig. 13, it can be observed that the maximum magnetic induction intensity in the head occurs near the neck, with the intensity decreasing sequentially from the neck to the top of the head, reaching the minimum value at the top. The maximum value for the coil is 5.44
The three-dimensional overall distribution map of the head only reflects external distribution patterns and does not explicitly illustrate the distribution of the scalp, skull, and brain in the three-layer spherical head model. Therefore, a slice analysis of the head field distribution is conducted. Cross-sections parallel to the bottom surface of the vehicle (z x plane at y
The sliced analysis of magnetic induction intensity in the head is depicted in Fig. 14. The sliced analysis of electric field intensity in the head is shown in Fig. 15.
Distribution diagram of magnetic induction intensity in the head.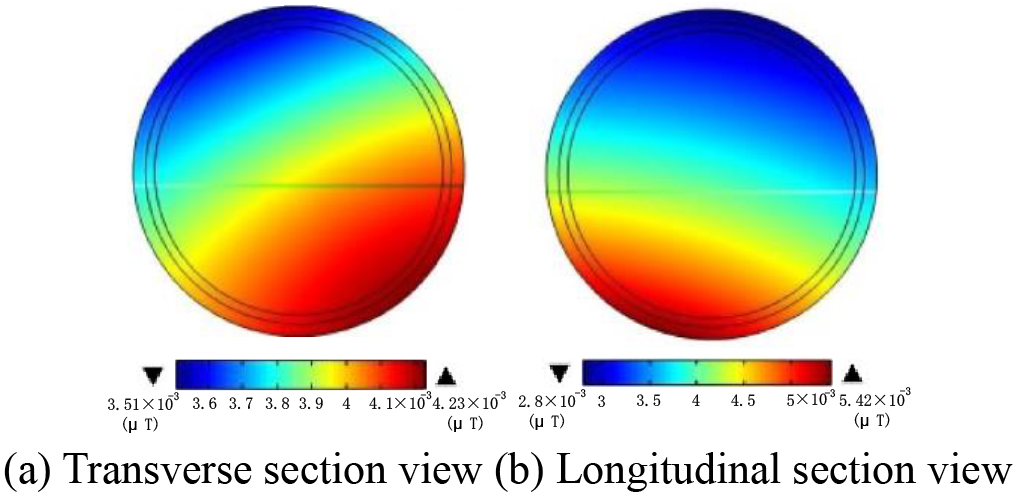
From the sliced analysis in Fig. 14a, it can be inferred that the magnetic induction intensity is highest near the edge of the receiving coil, with a maximum value of 4.23
Slice map of head electric field intensity.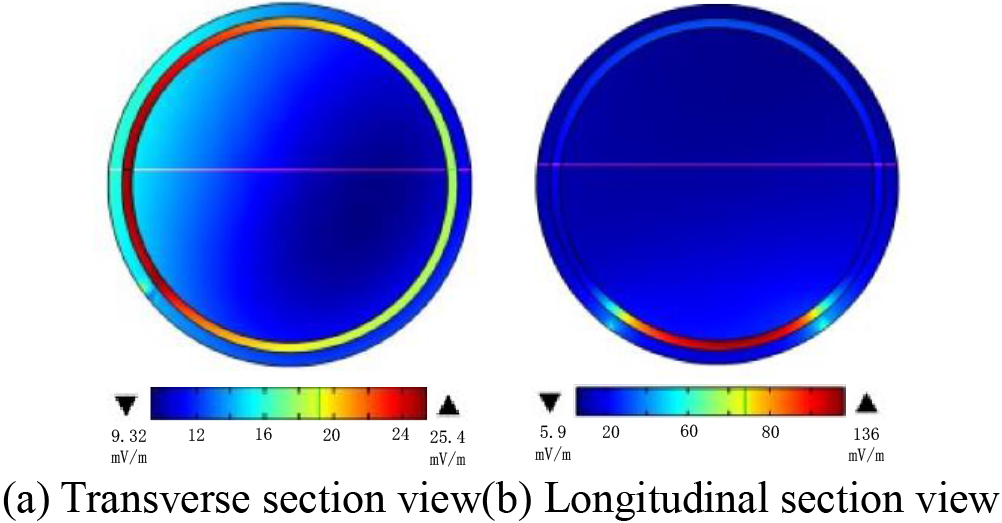
From Fig. 15a, it is evident that the electric field intensity is higher near the edge of the coil, with a maximum value of 25.4 mV/m. In Fig. 15b, the values within the skull are higher than those in the scalp and brain tissue. The maximum value is 136 mV/m.
The brain is the most vital tissue in the human body, governing all life activities. It is the largest and most complex structure in the central nervous system, serving as the highest control system. Therefore, a more detailed investigation of this tissue is essential. The distribution of electromagnetic field intensity in the brain is illustrated in Fig. 16.
Distribution diagram of brain electromagnetic field intensity.
Figure 16 illustrates the distribution of electromagnetic field intensity in brain tissue. Values near the neck are higher than in other positions. As height increases, the magnetic induction intensity decreases sequentially. The maximum magnetic induction intensity in the brain is 5.21
For a more detailed understanding of the electromagnetic field distribution in various important regions of the brain, cross-sectional analyses were conducted at locations near the cerebellum, eyes, and the top of the brain. The starting coordinate for the cross-sections is at y
Three-layer slice map of electromagnetic field intensity in the brain.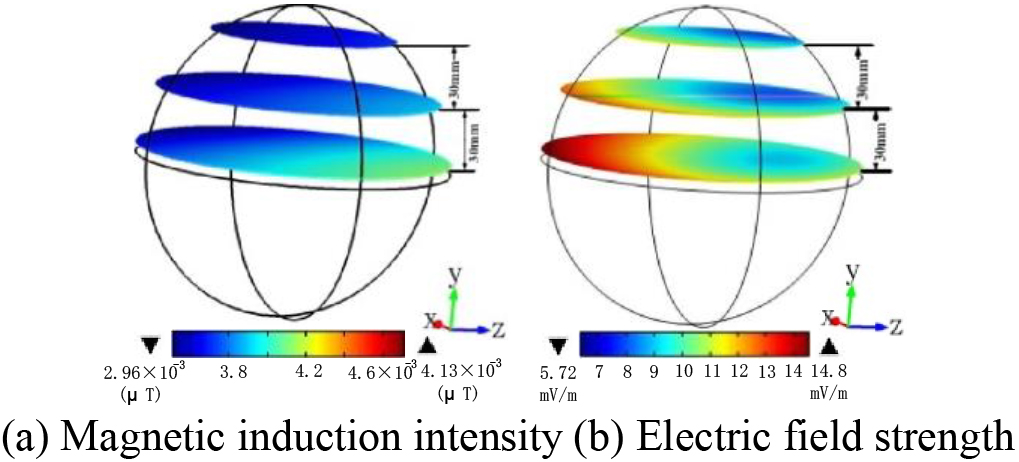
A slice map of the magnetic induction intensity in each part of the brain is shown in Fig. 18.
Slice map of magnetic induction intensity in the brain.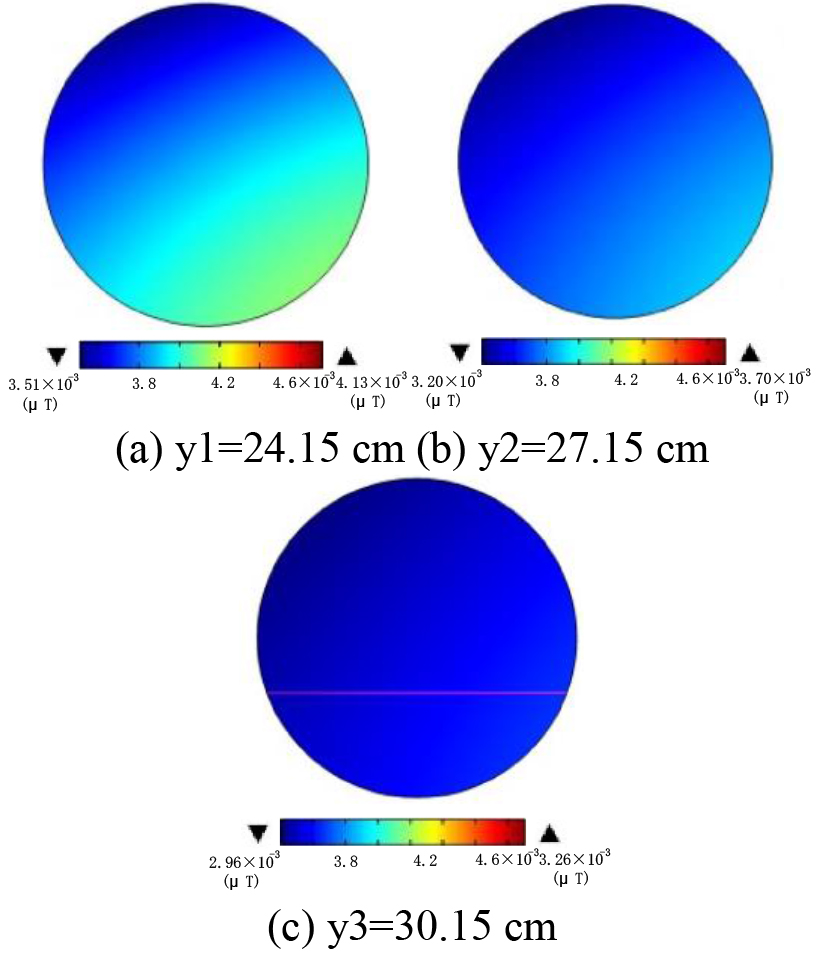
From Fig. 18a, the magnetic induction intensity distribution at the cerebellum position is evident, with a maximum value of 4.13
The sliced distribution results of electric field intensity in various regions of the brain are shown in Fig. 19.
Figure 19a represents the sliced map of electric field intensity at the cerebellum position, with a maximum value of 14.8 mV/m. In Fig. 19b, the sliced map of electric field intensity at the eye position shows a maximum value of 12.6 mV/m. Figure 19c illustrates the sliced map of electric field intensity at the top of the brain, with a maximum value of 10.4 mV/m.
The field distributions in various tissues of the human body were computed, and the results were obtained. To determine whether the charging environment poses a health threat to the human body at this time, the obtained values were compared with the International Commission on Non-Ionizing Radiation Protection (ICNIRP) guidelines. A direct comparison with the ICNIRP limits for the maximum values of field distributions in different tissues is presented in Table 4.
Comparison of maximum values and ICNIRP limits in different human tissues
Comparison of maximum values and ICNIRP limits in different human tissues
Comparison between the maximum values of different brain tissues and ICNIRP limits
Slice map of brain electric field intensity.
Simulation result diagram.
Temperature rise distribution diagram.
From the table, it can be observed that the maximum magnetic induction intensity in the lower torso of the human body exceeds the ICNIRP safety limits. According to the analysis of Fig. 11, the maximum value occurs at the ankles, reaching 0.407
The maximum magnetic induction intensity in the upper torso of the human body is 0.0738
The maximum electric field intensity in the entire torso is 4.57 V/m, representing 16.3% of the ICNIRP standard limit. The maximum electric field intensity in the head is 139 mV/m, accounting for 0.49% of the limit, while the maximum electric field intensity in the brain is 31.3 mV/m, representing 0.11% of the limit. Again, all these values are well below the ICNIRP safety limits.
The comparison of values at different locations in the brain with ICNIRP values is presented in Table 5.
From the table, it can be seen that the maximum magnetic induction intensity values at different locations in the brain are 4.13
Upon comparing the results, it is evident that the field distribution values in the torso of passengers and drivers during wireless charging with the coil are within the ICNIRP safety standards. However, the ankle region in the lower torso exceeds the ICNIRP safety standards.
Next, in conjunction with the human organ model, the electromagnetic safety characteristics of implanted electronic devices during the wireless charging process for electric vehicles will be analyzed. The simulation results for the magnetic field intensity at the pacemaker location when the human body is positioned at the left rear of the electric vehicle with input powers of 3.7 kW, 7.7 kW, and 22 kW for the transmitting coil are shown in Fig. 20.
According to the corresponding standard GB161742-2015, a cardiac pacemaker should not experience any continuous malfunctions when exposed to an external alternating electromagnetic field with a frequency of 1–100 kHz and a minimum root mean square magnetic field strength of 150 A/m. The simulation results indicate that the effective and peak values of the magnetic field intensity for the implanted cardiac pacemaker are 13.7 A/m and 19.4 A/m, respectively, when the input power to the transmitting coil is 22 kW. These values comply with the relevant requirements for sinusoidal magnetic field intensity.
The distribution of temperature rise in major organs after the implantation of a cardiac pacemaker is illustrated in Fig. 21.
As can be seen from the figure, the temperature of pacemaker is 3.2
The study utilizes the COMSOL finite element analysis method to simulate the electromagnetic environment during wireless charging of electric vehicles, taking into account models for the wireless charging system, human body structure, and cardiac pacemaker. The analysis focuses on assessing the impact of the electromagnetic environment on the human body and implanted medical devices. The conclusions are as follows:
Simulation results of wireless charging indicated that energy was mainly concentrated in the central part of the vehicle chassis, with a maximum magnetic induction intensity of 1.15 A comparison of the electric and magnetic fields generated by charging coils at different locations with ICNIRP safety limits revealed that the maximum magnetic induction intensity in the upper torso of the human body reached 80.1% of the limit, while the maximum electric field intensity was 0.349 V/m, accounting for 1.24% of the ICNIRP safety limit-both values were below the ICNIRP safety limits. In the lower torso, the maximum electric field intensity was 4.57 V/m, representing 16.3% of the ICNIRP standard limit. The maximum magnetic induction intensity, which was 0.407 For the implanted cardiac pacemaker, the effective and peak values of the magnetic field intensity were 13.7 A/m and 19.4 A/m, respectively, when an input power of 22 kW was applied to the transmitting coil. This met the relevant sinusoidal magnetic field intensity requirements. The maximum temperature rise of the cardiac pacemaker was 3.2
Footnotes
Funding
The work was financially supported by Science and Technology Projects from State Grid Corporation of China, (5200-202113091A-0-0-00).