
Abstract
Conventional approaches to forecasting the risk of athlete injuries are constrained by their narrow scope in feature extraction, often failing to adequately account for temporal dependencies and the effects of long-term memory. This paper enhances the Long Short-Term Memory (LSTM) network, specifically tailoring it to harness temporal data pertaining to athletes. This advancement significantly boosts the accuracy and effectiveness of predicting the risk of injuries among athletes. The network structure of the LSTM model was improved, and the collected data was converted into the temporal data form of the LSTM input. Finally, historical data labeled with injury labels were used to train the improved LSTM model, and gradient descent iterative optimization was used to adjust the parameters of the improved LSTM model. The improved LSTM network model was compared with the traditional athlete injury risk prediction model in terms of performance. The incorporation of enhanced LSTM networks for the analysis of temporal athlete data holds significant research significance. This approach has the potential to substantially enhance the accuracy and effectiveness of athlete injury risk prediction, contributing to a deeper understanding of the temporal dynamics influencing injuries in sports.
Keywords
Introduction
Sports have developed rapidly, and athletes often face various injury risks during the training and competition process due to factors such as excessive exercise, improper exercise techniques, and sports venues. Once an athlete is injured, it would have a profound impact on their performance in sports competitions and their career [1, 2]. Athletes are injured and their training is interrupted, requiring long-term rehabilitation. Predictive analysis of injury risk in athletes is needed to reduce sports injuries and safeguard athletes’ professional development. Traditional methods for predicting athlete injury risk cannot capture the dynamic relationship between different sports data well, and the accuracy and reliability of athlete injury risk prediction still need to be improved. LSTM networks can capture temporal dependencies and effectively utilize long-term memory effects. Employing these advanced networks enables a comprehensive analysis of various key factors, including athletes’ historical data, current training conditions, and physiological metrics. This approach facilitates precise predictions of injury risks, offering critical decision-making support to athletes, coaches, and medical staff. Armed with this information, they can implement effective strategies to mitigate the likelihood of injuries, thereby enhancing the overall safety and well-being of athletes.
The health and training status of athletes are gradually receiving attention, and the issue of athlete injuries has become an urgent problem to be solved in the sports industry. Many people predict injury risk by establishing regression models, using injury risk as the dependent variable. To enhance the prediction performance of bone stress injury, Kraus Emily used a mixed effect Poisson regression model to conduct accurate prediction and analysis of bone stress injury in long-distance runners [3]. Machine learning has been widely applied in the field of data prediction and analysis, and many people have used traditional machine learning methods for athlete injury risk prediction and analysis. In order to effectively evaluate, predict, and detect sports injuries, Meng Linsheng proposed a new dual feature fusion neural network model for athlete injury assessment, which used 1
LSTM networks have excellent ability to capture temporal information and long-term dependencies, and LSTM network models are used to predict temporal data. To enhance the performance of time series data prediction, Hua Yuxiu applied the LSTM network model to the field of telecommunications networks, accurately predicting and analyzing traffic and user mobility [8]. In order to accurately predict changes in the financial market, Fischer Thomas used a LSTM network model for sequence learning, with better predictive performance than the random forest (RF) algorithm [9]. In order to predict the room temperature climate in the greenhouse, Liu Yuwen constructed a greenhouse climate prediction model on the basis of LSTM, and used the LSTM model to capture the correlation between historical climate data, which could accurately predict the room temperature climate of various vegetables [10]. To further increase the accuracy of short-term traffic flow prediction, Ma Changxi proposed a short-term traffic flow prediction model based on traffic flow time series analysis and improved LSTM networks. He performed time series analysis of traffic flow data with smoothing and normalization to obtain a stable time series as model input data to improve the accuracy of model training [11]. The application of LSTM network models in forecasting athlete injury risk has been somewhat constrained. However, by harnessing LSTM models to capture temporal exercise data, significant enhancements in the precision and dependability of athlete injury risk prediction can be achieved.
To tackle the challenge of incomplete consideration of temporal data in athlete injury risk prediction, this study made enhancements to the LSTM network model. The approach involved partitioning lengthy sequences into multiple subsequences using sliding windows and introducing Dropout techniques to reduce inter-neuronal dependencies. The physiological data, training status data, and sports environment data of basketball players were collected from March 1, 2022 to August 1, 2022. The collected data was processed for missing and outliers, and the feature vector sequence was organized into a three-dimensional (3D) tensor form suitable for LSTM model input. A 5-fold cross validation method was utilized to divide the training and testing sets. The findings indicated that: (1) the improved LSTM network model had excellent accuracy in predicting athlete injury risk. (2) After dividing the test samples into 10 sample sizes, the improved LSTM network model had high injury risk prediction stability. (3) Compared with random forests, decision trees (DT), support vector machines (SVM), and LSTM network models, the improved LSTM network model had higher prediction accuracy and generalization ability. (4) The improved LSTM network model could handle temporal dependencies well and had excellent temporal performance.
Methods for predicting athlete injury risk
Data collection and preprocessing
Athletes often suffer injuries during sports activities, and the occurrence of sports injuries poses various hazards to athletes. Athlete injuries cause serious physical health problems, which can have negative psychological effects on athletes, cause financial pressure on them, and affect their physical training and competition [12, 13].
Predicting injury risk for athletes can help reduce the probability of injury occurrence and maintain high-level performance [14, 15]. For effective and precise prediction of athlete injury risks, it is imperative to comprehensively gather athlete-related data, encompassing physiological metrics, training status information, and data related to the sporting environment.
The data of 200 basketball players from a certain university in China is collected. Among the 200 basketball players collected, 50 have sports injuries, and the other 150 have no sports injuries. Sports data collection is conducted every morning at 8:30 am. Physiological data measurement includes heart rate measurement, blood pressure measurement, and body temperature measurement. Training status data includes maximum exercise speed, training frequency, and training duration. Environmental data includes temperature data, humidity data, and altitude data. The process of data collection is illustrated in Fig. 1.
Process of data collection.
The chest strap heart rate monitor is correctly worn on the athlete’s chest to ensure that it closely fits the athlete’s body, and real-time heart rate data during exercise is recorded. Automatic inflatable cuff sphygmomanometers are used in a quiet state to record athletes’ diastolic and systolic blood pressure. The forehead temperature gun is used to record the body temperature of athletes during rest.
Sports trackers are employed for capturing data on athletes’ maximum movement speed, training duration, and weekly training frequency. Additionally, meteorological stations are utilized to measure crucial environmental factors, including temperature, humidity, and altitude within sports environments.
During the data collection process, the accuracy and stability of the collection equipment is ensured and the timestamps of the data are recorded to maintain the timing information. The time period for collecting athlete injury related data is from March 1st, 2022 to August 1st, 2022, and the collection time is 8:30 am. Data collection is conducted every day. The partial data of a certain athlete is described in Table 1.
Partial data table of an athlete
In Table 1, some data information collected by a certain athlete is recorded. All data is given time information, recording the movement data of athletes between March 1st, 2022 and August 1st, 2022. Each column of data represents the record of each data collection, including information such as collection time, heart rate, blood pressure, body temperature, etc. Comprehensive collection and analysis of physiological data, training status, and possible environmental factors of athletes can help predict the risk of injury for athletes.
Upon gathering data from all athletes, the collected dataset undergoes a crucial preprocessing phase. This data preprocessing encompasses data cleaning, with the primary goal of ensuring the quality of the collected data and addressing missing or anomalous data points. The data cleaning process includes a thorough examination, processing, and rectification of physiological data, training status records, and potential environmental variables.
Missing and abnormal values in the collected athlete data are checked. During the data collection process, data loss may occur due to collection equipment or human factors. For missing values, the average value is utilized to fill in the missing values, and for abnormally large or small data, the correctness of the data is verified for manual correction. If the outlier cannot be explained or is unreasonable, it should be excluded.
Preprocessing the athlete data that has been collected plays a pivotal role in preserving data integrity and quality. It establishes a robust data foundation for subsequent athlete injury risk prediction, mitigating the risks of errors stemming from inaccurate or inconsistent data.
LSTM neural network is a variant of recurrent neural network suitable for processing time series data, with built-in long-term dependent memory [16, 17]. In LSTM neural networks, the smallest unit is the LSTM neuron, which can remember information within a certain period of time, and capture long-term dependencies in data, thus effectively overcoming the defect of long-term dependence [18, 19].
LSTM neurons are controlled by three gates to control cell state. The input gate determines the addition of input information to the cell state and controls the weight of the input by using the sigmoid function [20, 21]. The forgetting gate determines the removal of some information from the cellular state, controlling the forgetting and retention of information. The output gate determines the extraction of information from the cell state as the output of the LSTM model.
Cell state is the main memory part of LSTM, responsible for transmitting information to different time steps. The structure of LSTM neurons is illustrated in Fig. 2.
Structure of LSTM neurons.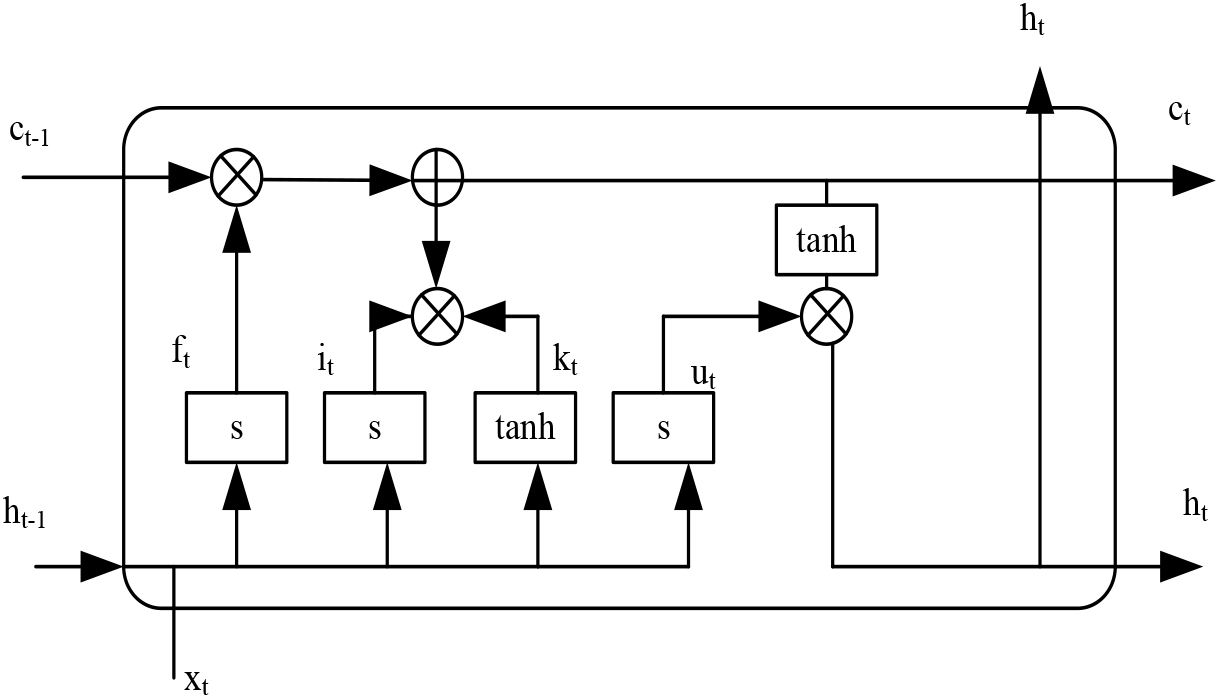
In Fig. 2, the structure of LSTM neurons is described. Firstly, through the forgetting gate, the discarded information is determined. In the second step, the information added to the cell state is determined, and the old cell information is updated to the new cell information. The third step is to update the cell status and output it.
Within the athlete data collected over an extended period, the neural memory state accumulates a substantial volume of information. Some of this information may become obsolete or irrelevant over time. By incorporating forgetting gates, it becomes possible to filter out less important data, preserving clarity in the memory state.
The working principle of the forgetting gate is as follows:
In Eq. (1),
The formula for the sigmoid function is:
The step of adding new information to the cell state is divided into two parts, including obtaining a candidate cell information and updating new cell information.
The calculation process of candidate cell information is shown below.
In Eq. (4), using the tanh function,
Old cell information is updated:
New cell information is output:
The output gate uses the sigmoid function for judgment, passing the cell state through the tanh layer to obtain a vector of values between
LSTM networks can analyze athletes’ injury risk based on temporal dependencies and historical data. However, when capturing long-term dependencies, the large time span involved often results in excessive computational burden [22, 23]. The LSTM network is improved by using sliding windows to divide long sequences into overlapping subsequences. On each subsequence, LSTM is run and the results are merged or aggregated to obtain the final prediction.
The process of using a sliding window for data capture is shown in Fig. 3.
Process of data capture using sliding windows.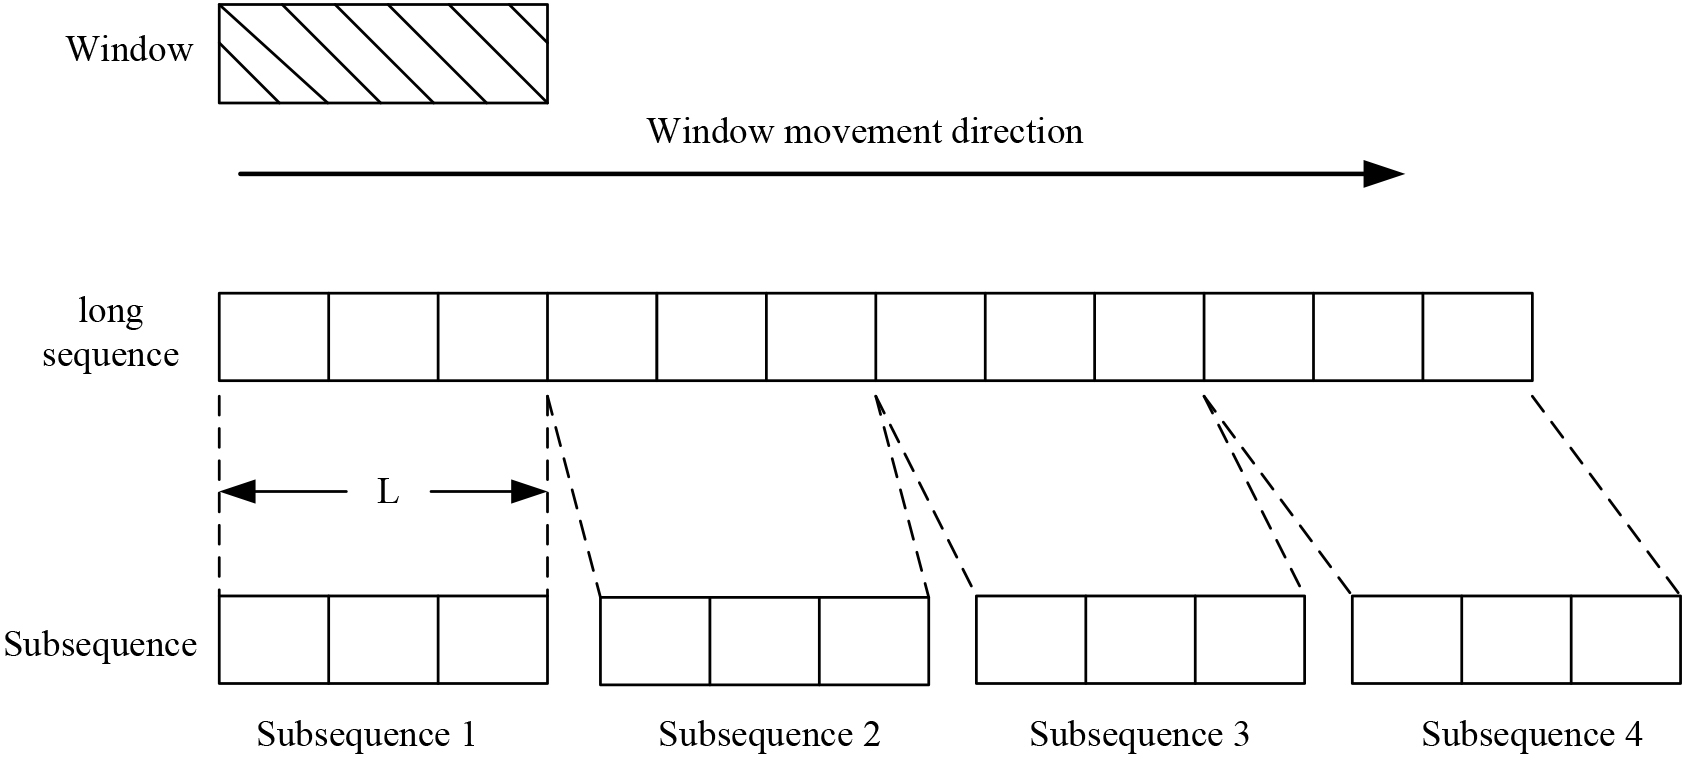
In Fig. 3, the process of using a sliding window for data capture is described. Firstly, the window size and window movement direction are initialized, sliding from the starting position of the long sequence, with L time steps each time. At each time step, the sub sequence in the current window is intercepted.
In the analysis of injury risk in long sequence athletes, due to the lack of regularization process in traditional LSTM networks, the overfitting risk of traditional LSTM networks is high. To reduce the risk of overfitting and increase the generalization ability of the model, regularization methods are added on the basis of traditional LSTM networks.
Dropout regularization is a random inactivation technique that randomly sets the output of a portion of neurons to zero during data training, thereby reducing dependencies between neurons and reducing overfitting [24]. In the LSTM network model, Dropout is introduced and placed between time steps within the LSTM layer. The probability of Dropout is selected as 0.3. During the data training process, Dropout is applied to reduce the dependency between neurons. During the data testing phase, Dropout is turned off.
The improved LSTM network model is illustrated in Fig. 4.
Improved LSTM network model.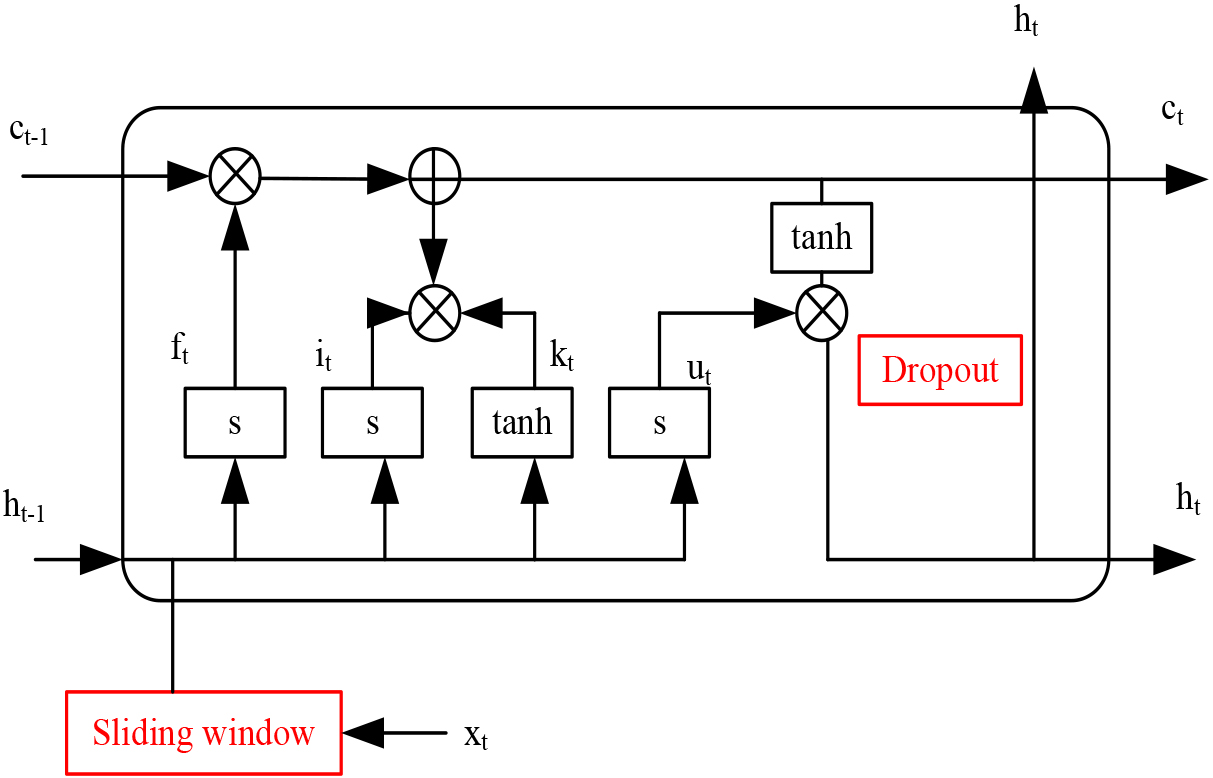
In Fig. 4, an improved LSTM network model is described. Sliding windows are used to shorten long sequence data and help the model capture long-term dependencies. During model training, Dropout regularization techniques are introduced to reduce the dependency between neurons and enhance the model’s generalization ability.
The prediction and analysis of injury risk for athletes is combined with time series information, and the physiological data, training status, and environmental factor data of athletes are labeled with time. The injury risk prediction and analysis are carried out through feature vectors. The relevant characteristics of athlete injury risk include physiological characteristics, training status characteristics, and environmental factors characteristics, which contain time information.
The size of the sliding window is set to 7 days, and the time step of the sliding window is 2 days. The feature vector sequence is the feature values within each time step. The sequence is labeled. In order to facilitate subsequent supervised learning, each sequence is assigned a label, which is set as a binary label. The setting of the label is whether the athlete has suffered any injuries within the next time interval. If an athlete experiences sports injury, the label is set to 1. If the athlete does not experience any injury, the label is set to 0.
The feature vector sequence is organized into a three-dimensional tensor form suitable for LSTM model input. The three dimensions of the three-dimensional tensor form are: sample size, time step size, and feature quantity. The three-dimensional tensor representation of athlete injury risk is:
[f1, f2, f3, …, fn],
In the three-dimensional tensor of athlete injury risk, the long athlete injury data sequence is divided into multiple subsequences and arranged according to a certain time sequence, enabling the LSTM network model to fully capture temporal dependencies and utilize long-term memory effect data.
Model training and optimization
Athletes often experience sports injuries during their physical activity. One of the main goals in predicting the risk of injury for athletes is to predict in advance which athletes may be injured, in order to take preventive measures to reduce the risk of injury [25, 26]. Predicting the risk of athlete injury effectively reduces the risk of sports injury, thereby improving sports performance.
To accurately predict the risk of athlete injury, the improved LSTM network model is fully trained. Temporal data with time labels is used for training; binary cross entropy is used as the loss function; a random gradient descent optimizer is used to minimize the loss function.
Firstly, the neural weights and biases of the improved LSTM network model are initialized, and the training data is input for model training. In model training, there are two forms of data propagation: forward propagation of data and backward feedback propagation of errors. The predicted results are compared with the actual injury situation of athletes, and the performance of athlete injury risk prediction is reflected through the loss value.
Based on the error in predicting injury, the contribution of the parameters in the model to the loss is reflected, and the model parameters are adjusted in a timely manner through gradient descent to optimize the athlete injury risk prediction model. Through repeated iterative optimization, the parameters of the improved LSTM network model are continuously adjusted, and the loss value is updated and calculated until the loss function converges to an acceptable range, completing the training.
In order to prevent overfitting in the improved LSTM network model during training, Dropout is regularized to reduce the risk of overfitting.
Performance evaluation of athlete injury risk
Data partitioning
The prediction of athlete injury risk is closely related to the historical data of athletes. The experiment collects data from 200 basketball players from March 1st, 2022 to August 1st, 2022, with a sliding window size of 7 days and a sliding window time step of 2 days.
The collected athlete related data is divided into multiple subsequences based on a 7-day time interval, with each subsequence containing data points collected during that time interval, totaling 34800 subsequences. To comprehensively train and test the collected data, a 5-fold cross validation method is utilized for dataset partitioning in the experiment.
Firstly, the 34800 subsequences are divided into 5 subsets of the same size, and the data partitioning for different subsets is random. The subsequence data from one subset is selected as the test set, while the data from the other four subsets are utilized as the training set. A total of 5 iterations are conducted, with each iteration replacing the test subset until all data can be tested and trained.
Model parameters and experimental environment
To effectively analyze the performance of athlete injury risk prediction, relevant experimental environments are constructed and model parameters are set. The improved LSTM network model is a deep learning method, and the Python programming language is utilized to construct the LSTM network model.
The experimental environment is presented in Table 2.
Experimental environment table
Experimental environment table
In Table 2, the experimental environment is described. In Python, the TensorFlow library is imported. The LSTM network model is constructed and the graphics processing unit is used to accelerate model training.
Due to the large amount of data on athlete injuries in the dataset, it is difficult to input all the data into the model at once. The batch size is set to 12; the learning rate of the model is set to 0.0001; the training cycle is set to 50 times. The learning rate determines the step size of the model at each parameter update.
The experiment is refined base on the LSTM network model. Sliding windows are used to partition long sequences into overlapping subsequences, and Dropout regularization techniques are introduced. To effectively analyze the performance of the improved LSTM network in predicting athlete injury risk, the performance of athlete injury risk prediction is evaluated.
After sufficient training of the collected dataset, the data from the test set is used for validation analysis. The results of athlete injury risk prediction and the actual injury situation of athletes are analyzed to reflect the performance of injury risk prediction. There are four scenarios for predicting and actual outcomes of athlete injury risk.
TP indicates that the prediction of athlete injury risk is a positive case and the actual one is also a positive case; FP indicates that the prediction of injury risk for athletes is positive, but it is actually negative; FN indicates that the predicted injury risk for athletes is negative, but it is actually positive; TN indicates that the prediction of injury risk for athletes is negative, and it is also a negative case in reality.
The accuracy, recall, precision, and F1 values of athlete injury risk prediction are reflected through the results of TP, FP, FN, and TN.
The formula for accuracy is expressed as:
The accuracy is the proportion of correctly predicted samples to the total sample size in athlete injury risk prediction.
The formula for precision is expressed as:
The precision is the proportion of positive cases in the sample of athletes’ injury risk prediction.
The formula for recall rate is expressed as:
The F1 value is calculated based on the results of recall and precision.
In order to more intuitively reflect the predictive performance of athlete injury risk, receiver operating characteristic (ROC) curves are drawn to evaluate the predictive performance [27, 28]. By observing the trend of the ROC curve and the AUC (Area under Curve) value, the accurate performance of the model is determined [29, 30].
In order to comprehensively analyze and improve the performance of LSTM networks in predicting athlete injury risk, the experiment compares the improved LSTM network model with RF, DT, SVM, and LSTM network models. Model generalization ability refers to the performance of a model on unprecedented data, which is reflected by comparing the injury risk prediction performance of the model in training and testing sets. The smaller the difference in injury risk prediction performance between the training and testing sets, the better the generalization ability of the model. In athlete injury risk prediction analysis, temporal performance evaluation is conducted. Past time steps are utilized as inputs to predict future time steps and analyze whether there is a time lag in the model’s predictions.
To better analyze the model’s prediction of time lag, the date time is converted into a timestamp. By using a timestamp, the time and date of the athlete’s injury occurrence are reversed.
To analyze the stability of the model, the testing performance is observed under different sample size conditions by changing the data size in the test set. The samples in the test set are randomly divided into 10 equal parts to test the injury risk prediction performance under different equal part test sample conditions.
Accuracy and loss of improved models
The accuracy of a model is used to measure its predictive accuracy on test data, and loss analysis is used to measure its performance on training data. On the test set, an improved LSTM network was used for accuracy and loss analysis. The analysis results of accuracy and loss values are illustrated in Fig. 5.
Accuracy and loss values.
In Fig. 5, the model accuracy and loss analysis results are described, and the horizontal axis represents the number of iterations in model training. The left vertical axis represents the accuracy of athlete injury risk prediction in the test set, and the right vertical axis represents the loss value of the model. It can be learned that the accuracy of the improved LSTM network model was greater than 80.0% at epochs
In actual athlete injury risk prediction analysis, the number of samples analyzed is often different, which requires the model to have strong stability. To test the predictive performance of different numbers of samples, the samples in the test set were divided into 10 small portions. The stability results of the improved model under different test sample conditions are shown in Fig. 6.
Stability of the improved model.
In Fig. 6, the stability analysis results of the improved model are described. The horizontal axis represents different proportions of test samples, and the vertical axis represents the numerical values of the accuracy and precision of the improved model’s injury risk prediction. If the accuracy and precision of the model did not change significantly in different proportions of test samples, it indicated that the model was relatively stable. It can be seen that out of the 10 test samples, 5 of them had an accuracy rate of 89.4% for injury risk prediction, and 5 of them had an accuracy rate of 89.5% for injury risk prediction. The accuracy deviation of athlete injury risk prediction under different sample conditions was 0.1%. Among the 10 test samples, 3 had an precision rate of 89.9% in predicting injury risk; the precision rate of injury risk prediction for one test sample was 90.0%; the precision of injury risk prediction for 6 test samples was 90.1%. The precision deviation of athlete injury risk prediction under different sample conditions was 0.2%. The improved LSTM network model maintained very high stability in predicting athlete injury risk in different test sample environments.
To comprehensively analyze the performance of the improved LSTM network for athlete injury risk prediction, the improved LSTM network model was compared in performance with a variety of other models. The experiment selected RF, DT, SVM, and LSTM network models as comparative models. The accuracy, precision, recall, and F1 value results of injury risk prediction for different models are presented in Table 3.
Performance of injury risk prediction for different models
Performance of injury risk prediction for different models
In Table 3, the performance of different models in predicting injury risk is described, and the average prediction accuracy, precision, recall, and F1 values of five models are presented. It can be learned that the performance of injury risk prediction is improved LSTM network model, LSTM network model, SVM, DT, and RF, with average prediction accuracy of 89.4%, 86.2%, 82.2%, 76.5%, and 75.4%, respectively. The improved LSTM network model had better performance in predicting injury risk than the LSTM network model. This is mainly due to the improved LSTM network model using sliding windows to divide long sequence data into subsequence data, which is beneficial for obtaining long-term dependencies. Additionally, the improved LSTM network model introduces Dropout regularization to reduce overfitting. Therefore, the application of an improved LSTM network model for predicting athlete injury risk has high performance.
In order to more intuitively analyze the performance of athlete injury risk prediction using different models, ROC curves were utilized to evaluate the performance of injury risk prediction. By observing the trend of ROC curves and AUC values, the performance of different models could be compared very intuitively. The ROC curves of different models are illustrated in Fig. 7.
ROC curves of different models. A. ROC curve of the RF model. B. ROC curve of the DT model. C. ROC curve of the SVM model. D. ROC Curve of the LSTM network model. E. ROC curve of the improved LSTM network model.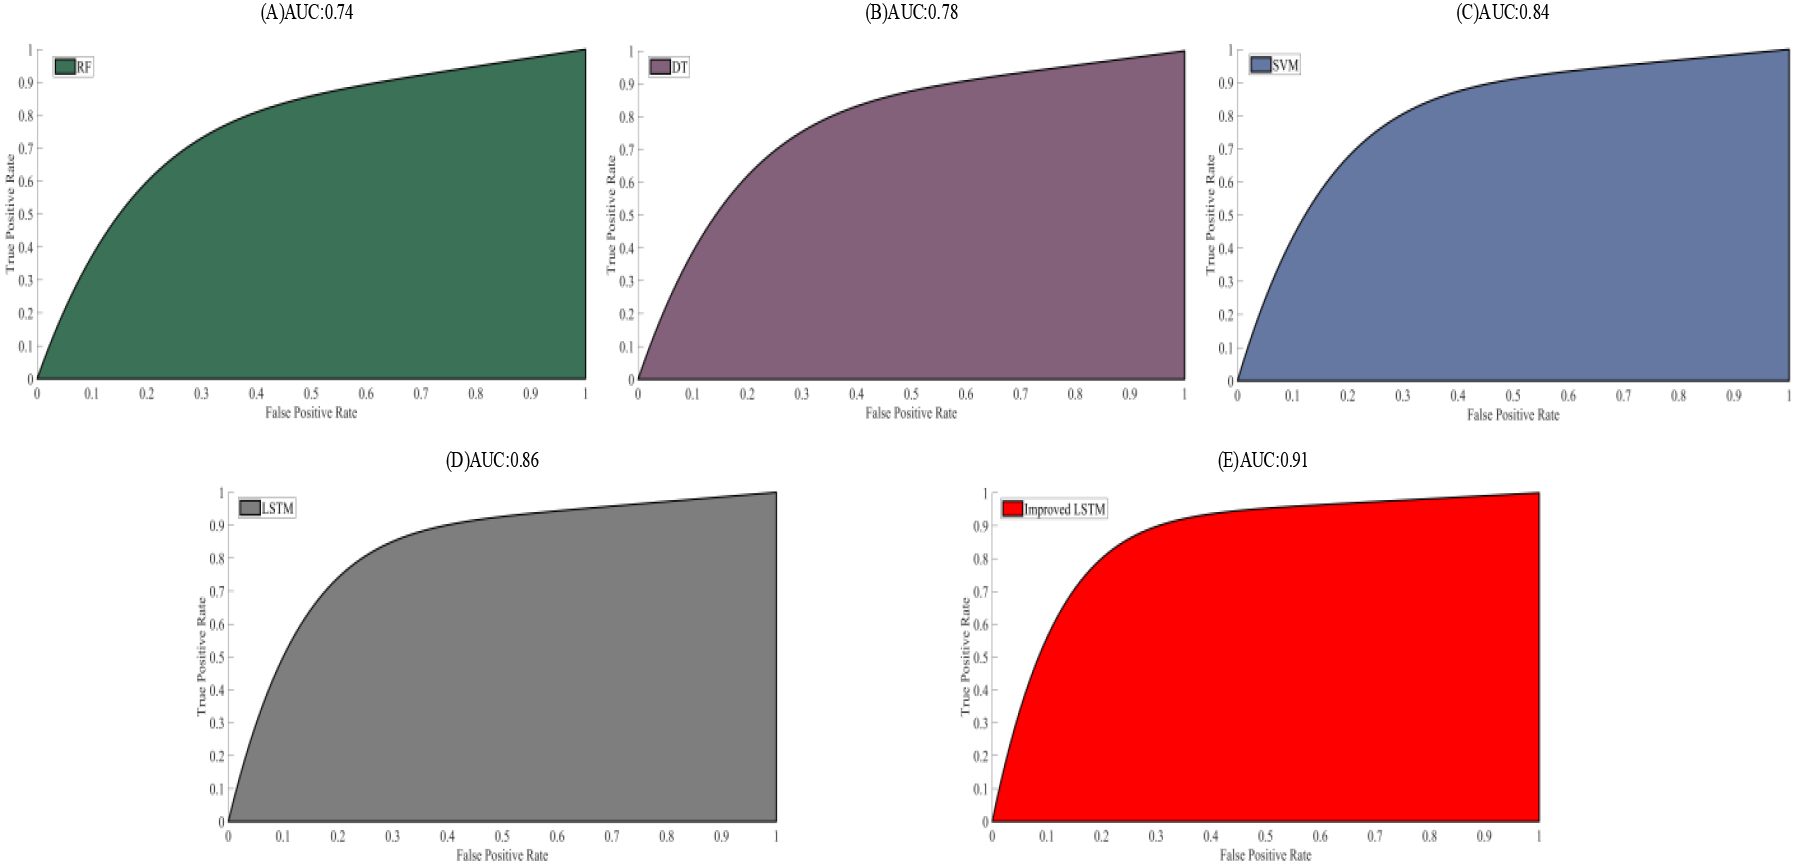
The ROC curves of different models are described in Fig. 7, and the AUC values of each curve are calculated. The horizontal axis in the ROC curve indicates the rate of false positive cases and the vertical axis indicates the rate of true positive cases. The closer the curve is to the point (0, 1), the higher the performance of the model corresponding to the curve in predicting athlete injury risk. The area enclosed below the ROC curve is the AUC value, which ranges from 0 to 1. The closer the AUC value is to 1, the better the model’s performance is. The closer it is to 0.5, the closer it is to random guess. The closer it is to 0, the worse the model’s performance is. The AUC values of RF, DT, SVM, LSTM network model, and improved LSTM network model were 0.74, 0.78, 0.84, 0.86, and 0.91, respectively. The ROC curve of the improved LSTM network model was closest to the point (0, 1). The LSTM network model was improved, and sliding windows were used for long sequence partitioning, effectively improving the performance of athlete injury risk prediction.
The generalization ability of the model is also the main indicator for evaluating the performance of athlete injury risk prediction. By analyzing the injury risk prediction performance of different models in training and testing sets, the generalization ability of the model was reflected. The generalization ability of different models is shown in Fig. 8.
Generalization ability of different models. A. The generalization ability of the random forest model. B. The generalization ability of the decision tree model. C. The generalization ability of the support vector machine model. D. The generalization ability of the LSTM network model. E. The generalization ability of the improved LSTM network model.
Temporal performance.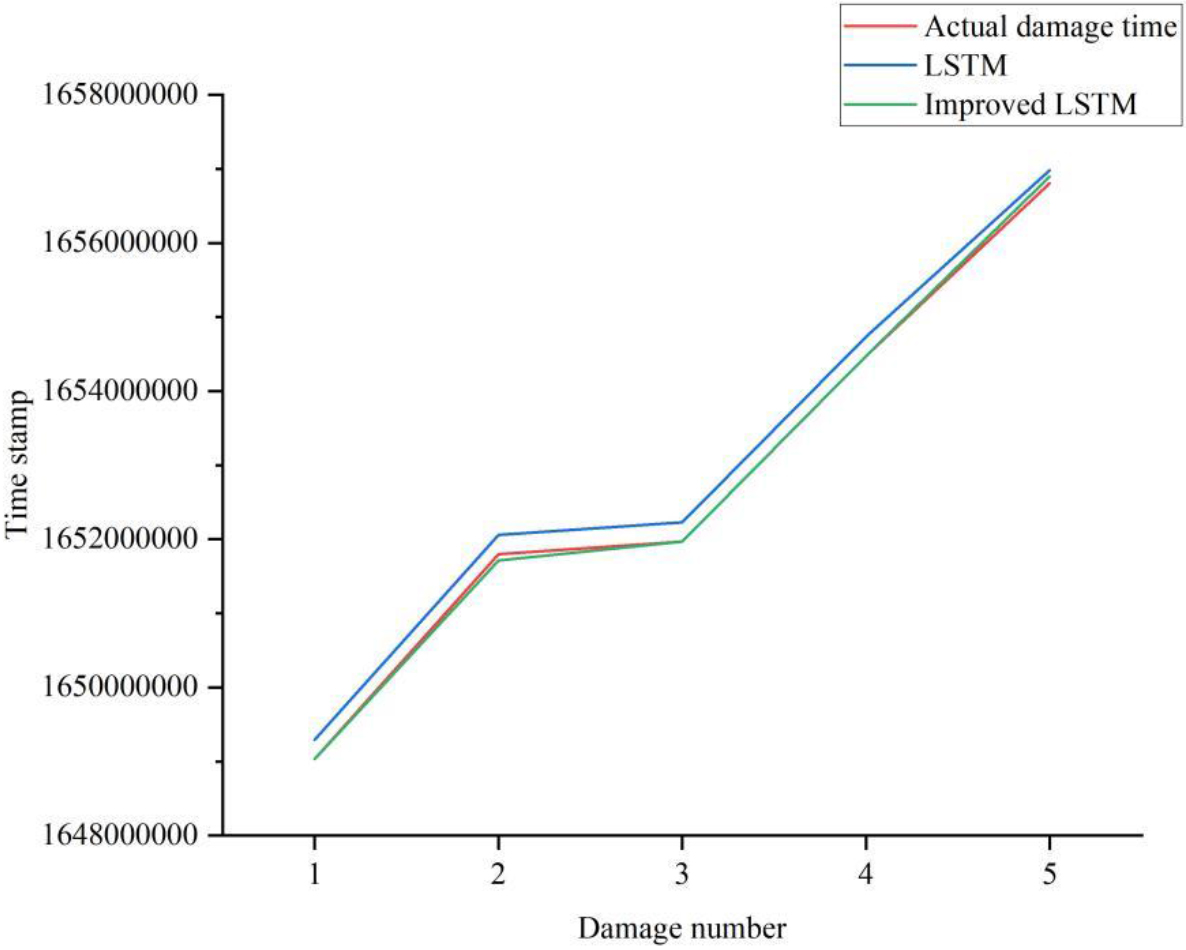
In Fig. 8, the generalization ability of different models is described, and the horizontal axis represents four evaluation indicators, including accuracy, precision, recall, and F1 value. The performance of athlete injury risk prediction in the training and testing sets was compared. It can be learned that the performance of the five models in predicting athlete injury risk in the training set was generally higher than that in the test set. This may be due to the model overfitting the training data and losing its generalization ability to unseen data. It can be seen that the performance difference in predicting athlete injury risk between the training set and the test set in the improved LSTM network model was the smallest. The accuracy difference was 0.4%; the precision difference was 1.0%; the recall difference was 0.1%; the F1 value difference was 0.3%. Therefore, the improved LSTM network model effectively reduces overfitting on training data by introducing Dropout regularization, thereby improving the generalization ability of the athlete injury risk prediction model.
Athlete injury risk prediction requires temporal performance, and accurately predicting the time of injury occurrence based on past athlete data can help protect athletes. Temporal performance evaluation mainly analyzes the lag of injury risk prediction, which can lead to an increased risk of injury for athletes. In the collected dataset, the actual injuries of an athlete occurred on April 5, May 7, May 9, June 7, and July 4, 2022, respectively. The temporal performance of athlete injury risk prediction using the LSTM network model and the improved LSTM network model is illustrated in Fig. 9.
In Fig. 9, the temporal performance analysis results of athlete injury risk prediction are described. The horizontal axis represents the 5 injuries that athletes have experienced, and the vertical axis represents the timeline. The data in the timeline is displayed in the form of a timestamp. The timestamps corresponding to the actual 5 injuries are April 5th, May 7th, May 9th, June 7th, and July 4th, 2022. The timestamps corresponding to the five injuries predicted by the LSTM network model are April 8th, May 10th, May 12th, June 10th, and July 6th, 2022, respectively. The improved LSTM network model predicts that the timestamps corresponding to the five injuries are April 5th, May 6th, May 9th, June 7th, and July 5th, 2022, respectively. It can be clearly learned that the predicted injury time of the improved LSTM network model was closer to the actual injury time, and the predicted time of the first, third, and fourth injuries was on the same day as the actual injury occurrence time. Therefore, the application of an improved LSTM network for predicting athlete injury risk has excellent temporal performance.
Conclusions
Accurately predicting injury risk in athletes necessitates an understanding of temporal dependencies and the utilization of long-term memory effects. This is due to the dynamic nature of athletes’ physical conditions and the evolving risk of injuries over time, where historical data plays a crucial role in forecasting future risks. In this study, we have compiled and time-stamped past data of basketball players. Leveraging the Long Short-Term Memory (LSTM) network model as a foundation, we incorporated Dropout techniques and employed sliding windows to segment extensive sequential data effectively. Subsequently, this enhanced LSTM network model underwent meticulous optimization and training, aiming to improve the precision and reliability of injury risk predictions. The experimental findings indicated that the improved LSTM model had very high accuracy in predicting athlete injury risk and could maintain stable predictive ability in different test sample environments. The improved LSTM model was compared with the LSTM network model, SVM, DT, and RF. The improved LSTM model had higher accuracy in predicting injury risk and higher generalization ability, and effectively reduced the time lag of injury risk prediction. The application of an improved LSTM model in predicting injury risk for athletes helps to protect their physical health. However, when analyzing the risk of athlete injury, this article has only analyzed the data of basketball players, and the sports covered are too single. Predicting and analyzing the risk of athlete injury in various sports would be the direction of future research.
Footnotes
Funding
This work was supported by: (1) Supported by the Science and Technology Research Program of Chongqing Municipal Education Commission (Grant No. KJZD-K202302901); project name: Optimization of key technology of visual object detection based on complex moving image and its application in teaching and training. (2) Chongqing Preschool Education College High-level Talent Research Workstation Project: Children’s physical health and sports ability promotion workstation (Grant Number: 2023GZZ-001).