
Abstract
Power quality analysis and governance need the identification of power quality issues. With the use of smart meters and various smart collection devices, more and more power quality data are collected, and the massive data collection brings pressure on communication, storage and computation to the conventional algorithm for identifying and classifying power quality disturbances based on cloud computing. In the paper, a classification algorithm for power quality disturbance identification based on edge computing and fusion model is proposed. The algorithm’s key concept is to compress and sense the power quality signals at the edge side, and then transmit the compressed power quality data to the cloud, which uses an improved Dense-Net and LSTM fusion model to identify and classify the compressed power quality data. Through experiments, it is proved that the method can compress the power quality signal to 70% of the original signal size while satisfying the recognition and data on power quality disturbance categorization accuracy, reducing the communication cost of data transmission, lowering the computational pressure and caching pressure on the cloud, and having certain robustness.
Introduction
With the proposed goal of ‘carbon peaking, carbon neutrality’, the rapid expansion of distributed energy resources and micro-small grids, the power grid’s distortion signal will have an impact on the power system’s safety and stability [1], causing power quality disturbance (PQD) disturbance, which may cause serious safety accidents and economic losses. As a result, proper power quality disturbance classification is critical for improving the quality of power supply, monitoring the status of power equipment, and troubleshooting the grid [2, 3].
Traditional power quality perturbation identification shifts edge-side compute-intensive tasks from end-user devices to cloud infrastructure. With the widespread adoption of power electronics, the focus of power quality perturbation signals shifts to communications with high throughput and low latency, and the cloud begins to expose the limits that it has. The physical separation between the terminal device and the cloud is too long, which will cause problems such as high communication costs and insufficient security [4, 5].
To reduce the communication cost of data transmitted from the edge device to the cloud and reduce the storage pressure of the edge device, the computing power of the edge device can be used to adopt compression sensing [6] technology on the edge side, which breaks through the framework of the sampling theorem of Nyquist. The literature [7] uses a combination of empirical modal decomposition and compressive sensing to compress and reconstruct transient power quality signals, which can reduce the need for the memory of the acquisition device and improve the transmission rate. Although the transmission of compressed data to the cloud can reduce the cost of communication, the reconstruction of power quality in the cloud will increase the computational pressure in the cloud, so it is necessary to deploy a model with stronger feature extraction and classification recognition capabilities for power quality signals in the cloud, and disturbances can be identified and classified without reconstructing the signal.
The traditional power quality disturbance recognition classification models include decision trees [8, 9], support vector machines (SVM) [10, 11], artificial neural networks (ANNs) [12] and other methods. The literature [13] proposed an efficient classifier based on curve transformation and support vector machine (SVM) to automatically identify, locate and classify different forms of power quality problems.
However, the traditional machine learning methods have insufficient ability to extract features and process large amounts of data, and the classification accuracy rate also needs to be improved. Convolutional neural networks [14, 15] (CNN) can obtain the characteristics of the input data very well, and can remove noise from the supplied data, and have a large number of applications in the identification of power quality disturbances. Literature [16] proposed a convolutional neural network with a hybrid architecture method for processing power signals using a convolutional neural network with one dimension, and then converted these signals into images, used a two-dimensional convolutional neural network for processing, and combined the generated feature vectors. Finally, the fully linked layer classifies the combinatorial vectors. The convolutional neural network proposed in the literature [17] is a combinatorial method based on variational pattern decomposition, which requires few samples but has high classification accuracy. However, the increase in the quantity of layers of the CNN network will lead to rapid degradation of the accuracy of the model after saturation, and the residual network (ResNet) structure [18] can solve this issue and increase CNN performance. In the literature [19], a ResNet and support vector machine-based model was proposed, which has a higher level of performance than traditional neural network algorithms. ResNet algorithm when extracting 18-layer and 34-layer CNN features and support vector machine classification, and the accuracy rate is improved by 2.01%. The literature [20] proposes a method for identifying and classifying power quality disturbances in microgrids, which consists of a five-layer-one-maintenance positive initial residual network and a three-layer fully connected layer (deep convolutional network), which can quickly extract the features of different types of disturbance signals, identify and classify them. However, the number of ResNet network structure parameters is too large, the computing power requirements are high, and the connection between the network layers is not close enough. Long short-term memory networks [21, 22] (LSTM) are good at extracting timing features from sequence signals.
Therefore, an algorithm based on edge computing and model fusion is proposed, which aims to reduce the communication cost of edge devices sending data to the cloud, reduce the caching and computing pressure in the cloud, and the main innovation points are:
This study proposes a multi-scale parallel dense network based on edge computing, which uses the computing power of the edge-side device to compress the data and reduce the cache pressure and computing pressure in the cloud. Using the computing power of edge equipment and using compression sensing technology, compressing the power quality disturbance signal, reducing the amount of data acquisition, and then transmitting the compressed data to the cloud for identification and classification, reducing the transmission and communication cost of data, and alleviating the cache pressure in the cloud. In the cloud using multi-scale parallel dense network and LSTM fusion model, the model uses parallel dense block structure on multiple scales, the extraction of potential spatial features and the fusion and flow of features, the LSTM module using sequence recombination method to extract time features of the sample, and then the features extracted by the two modules are fused, so that the cloud does not reconstruct the signal under the premise of perturbation identification classification, effectively alleviating the computational pressure of the cloud. The network model raises the network’s depth without increasing the amount of network parameters, significantly decreases the number of parameters in the network, as well as lowering the computing pressure in the cloud.
Compression perception
Compressed Sensing (CS), proposed by Donnho, is a spatially transformed compressive sampling based on a random smooth observation matrix when the original power quality disturbance signal is sparse or becomes sparse through a sparse transform base. The number of points sampled is significantly less than Nyquist sampling, and the original signal is recovered by the reconstruction algorithm. The linear observation model is shown in Eq. (1).
where
The sparsity factor
To solve the above problem, it can be solved using
where
However, the solution to the l0-parametric minimization has been shown to be NP-hard and non-convex. l1-parametric minimization is often used as a convex approximation to l0-parametric minimization, and l1-parametric minimization is given by Eq. (3).
In the meantime, in order to recover
1) The dimensionality of the observation
2) The observation matrix
Where,
Therefore, to cut data transmission costs, the data is compressed on the edge side by using the computing power of the edge device to signal compress the sensory acquisition. The first sparse basis used on the edge devices is the Discrete Cosine Transform (DCT), which is highly applicable, simple in structure and easy to implement in hardware. The Bernoulli matrix is then used as the observation matrix, which is more straightforward to implement and store than the random Gaussian observation matrix. The transformation matrix representation of the DCT is shown in Eq. (5), the matrix’s row is
Where
The recognition classification network model used in the cloud in the paper is demonstrated in Fig. 1. The network model is comprised of a shallow feature extraction module, a dense block module and a connection layer connecting the dense blocks, and a propagation layer. Within the shallow feature extraction module, the initial convolutional processing operation is mainly performed, as shown in Eq. (6).
Where
Multi-scale parallel DenseNet network structure.
The parallel dense block module, as well as the connection and propagation layers that connect the parallel dense blocks, are primarily responsible for deep feature extraction, the sizes of convolution kernels in dense blocks are 3, 5 and 7, respectively. The parallel dense block used in the paper consists of three dense blocks in parallel, Fig. 2 depicts the structure of dense blocks, each dense block consists of five convolutional blocks, the structure of the convolutional blocks is shown in Fig. 3, including two sets of activation, convolutional operations and Batch-Normalization. The convolution kernels of the dense block have scales of 3
where are multiple functions combining convolution operations, activation functions and Batch-Normalization; ‘[]’ stands for concatenation, and the dense block is the concatenation of
Dense block structure.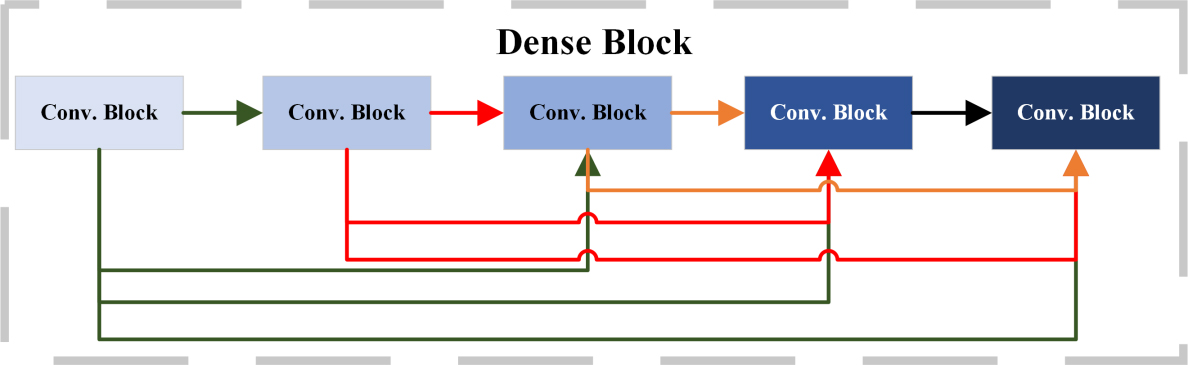
Convolution block structure.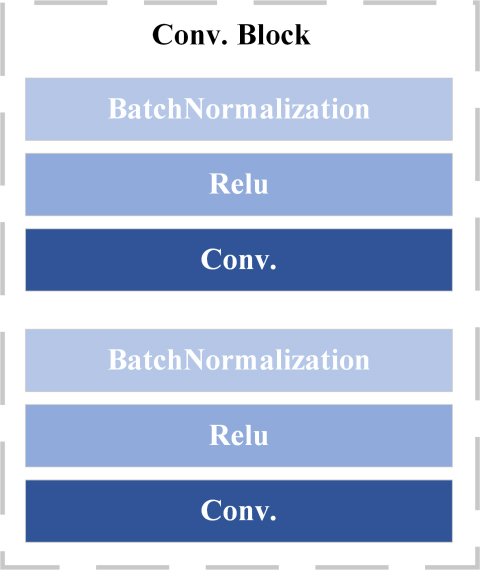
The multi-scale parallel dense network used in the paper in the cloud, the effect of multi-scale dense blocks in parallel can facilitate the flow and fusion of features, which can mine more potential features of the data and reduce the number of network parameters while improving the representation capability of the network.
The long-short-term memory network (LSTM) is a gating-based recurrent neural network proposed by Hochreiter and Schmidhuber, which can significantly demand the gradient disappearance or explosion problem in RNN. The LSTM augments the RNN with three gates: an input gate, an oblivion gate, and an output gate, which are computed using Eqs (8)–(10). Figure 4 depicts the LSTM’s internal structure.
The weight matrices of the input, forgetting, and output gates are
LSTM internal structure.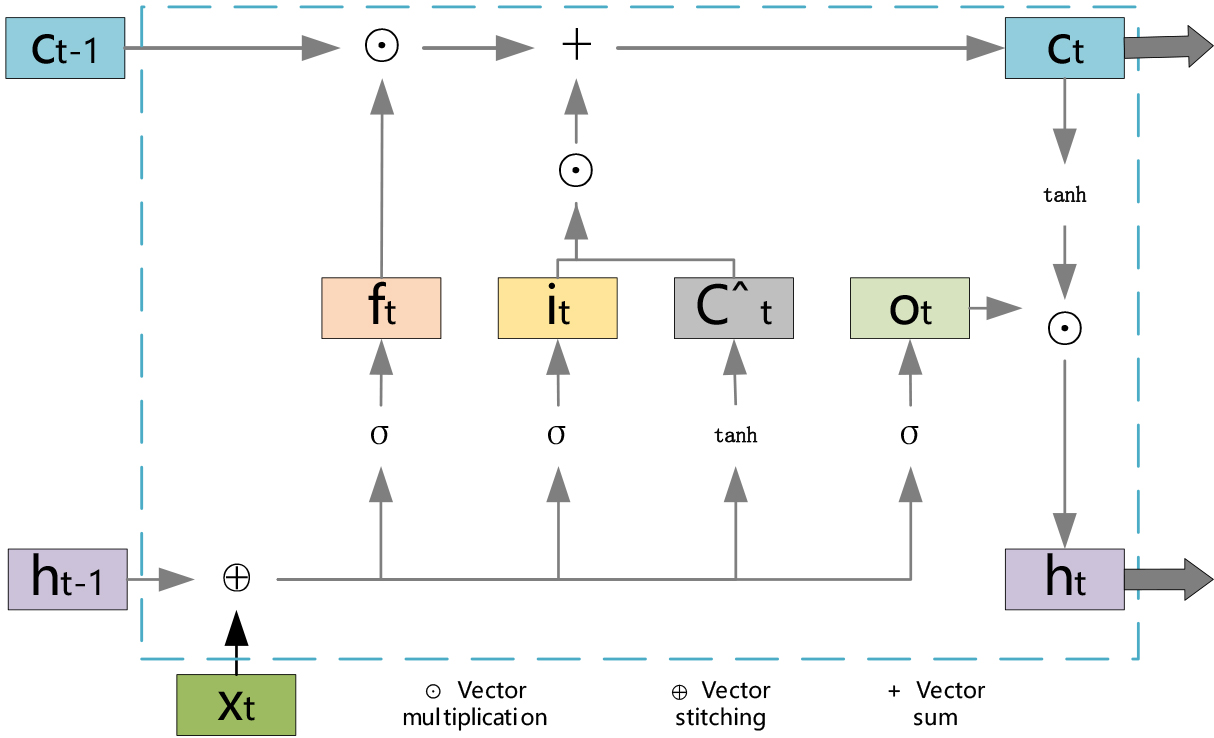
In this paper, we adopt the method of sequence recombination to cut the signal into multiple sequences according to the period, and recombine the sequences into vectors
It is a multi-scale parallel dense network model based on edge computing that is employed in the article, as illustrated in Fig. 5. The model consists of two parts, the data acquisition equipment on the edge side will be a compressed power quality signal for sensing, reduce the amount of transmitted data, reduce the communication cost of data transmission, the discrete cosine transform is employed as a sparse basis on edge equipment, and the observed matrix is a random Bernoulli measurement matrix. The data is transmitted to the cloud, and the cloud fusion model classifies the compressed data. The cloud model has a strong capability of potential feature extraction, and the multi-scale parallel dense network can extract the spatial characteristics of the data well, and the LSTM can extract the temporal features of the samples, and then fuse the spatial features and temporal features to classify them. The module has a strong feature extraction capability, so it can accurately classify the data without restoring it to the original data, reducing the computational complexity of the cloud. The network has fewer training parameters than other network models, thus further reducing the computational complexity of the cloud.
Mathematical models of power quality disturbance
Mathematical models of power quality disturbance
Multi-scale parallel DenseNet model structure based on edge computing.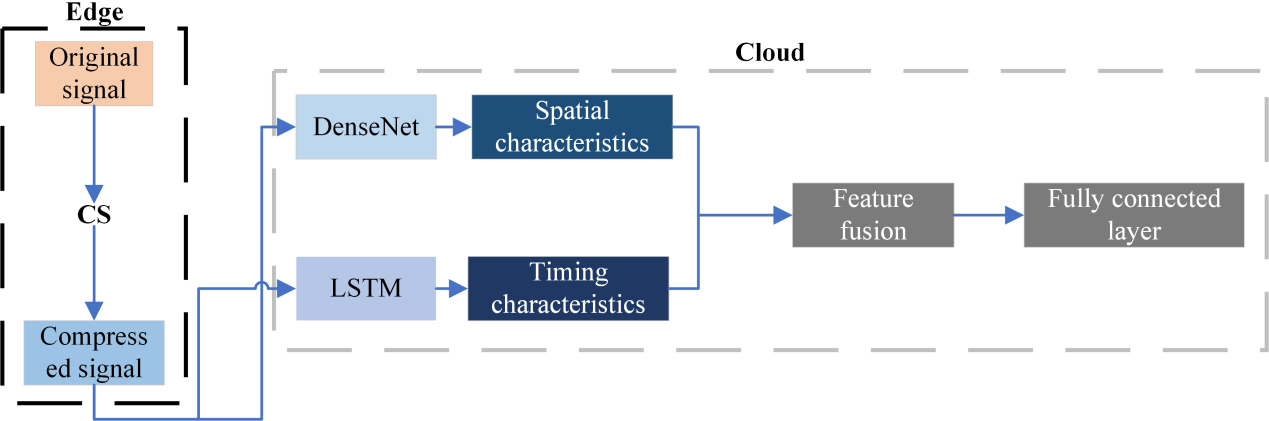
Power quality disturbances can be caused by a single disturbance caused by a single cause, or may be caused by a superposition of multiple single causes at the same time, forming a compound disturbance. According to IEEE Std 1159–2019, 35 different categories of raw data are formed in the simulation environment, including 9 categories of single disturbances, 21 categories of double disturbances, and 5 categories of triple disturbances, and the parameters of the data such as duration and disturbance amplitude are set according to Table 1. Each type of A total of 4000 sets of signals were generated for each type of perturbation, using a 6.4 kHz sampling frequency. A single perturbation sampling waveform of 10 cycles, the size of one perturbation data was approximately 23,479 bytes.
The raw data is then perceptually compressed. The training process is cross-validation, and the compressed data set is separated into three parts: training, validation, and testing, in the ratio of 8:1:1. During the training process, the optimal model is saved according to the accuracy of the validation set.
Experimental results and analysis
This paper uses Matlab to generate a total of 35 power quality simulation signals; a deep learning model is built in Pytorch to select the appropriate compression ratio, hyper-parameter selection and classification, and to compare with other deep learning models to verify the superiority of the approach presented. In the training process of the model, the learning rate decay method and the early stop mechanism are introduced to improve the training effect: when the accuracy of the model does not increase after 3 rounds of testing on the validation set, the learning rate is adjusted at a rate of 0.1 to improve the training efficiency; when the accuracy of the model does not increase after 5 rounds of testing on the validation set, the training is finished and the optimal model is saved to prevent The model is saved to prevent over-fitting.
The intelligent convergence terminal used in this paper is an edge device with a Cortex-A7 architecture single-core 4-core processor at 1.2DHz, with 2GB DDR3 and 8GB FLASH memory integrated in the periphery.
Selection of signal compression ratio
In this paper, the accuracy of the model after training is used as an evaluation index to determine the compression ratio of the model. In this paper, the data is compressed for noiseless and noisy environments of 20 dB, respectively, and the model is trained using the compressed data. On the compressed test set, the test results are displayed in Fig. 6. When the data is compressed to 70% of the original data, the compression rate increases and the classification accuracy does not improve significantly. Therefore, considering the cost of data communication as well as the model’s categorization accuracy, the compression rate of the data is set at 70%, and the data mentioned below are all compressed data with 70% compression rate.
The relationship between compression rate and classification accuracy.
Training results of various optimizers in a noise-free environment.
Training results of various batch sizes in different noise environments.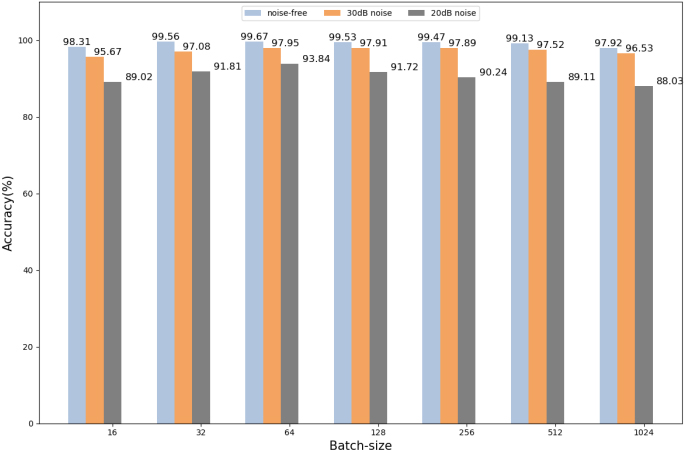
The number of training sessions and classification accuracy are utilized as assessment measures in this study to establish the model’s hyper-parameters. In the process of optimizer selection, 64 batch scales were used for training to select the best optimizer, and the initialisation parameters of each optimizer were the default parameters. The results of comparing the seven common optimizers are shown in Fig. 7.
As shown in Fig. 7, RMSprop has the highest classification accuracy of 99.67%, while its training times are only 15, which is the best classification accuracy and training times among all optimizers, so the model chooses RMSprop as the optimizer.
In order to achieve better training results for the model, the paper chooses to train the model at different batch scales, using data with different noise, and the results are shown in Fig. 8. On the whole, after 64 batch scales, the classification accuracy of the model decreases as the batch scale increases, and the trend is more obvious when the noise of the data becomes larger. Therefore, 64 is chosen as the batch scale size for the model in this paper.
Noise robustness testing
In this paper, data with 50 dB, 30 dB, and 20 dB Gaussian white noise are used to train the model, and the accuracy of the test set under different ambient noise was obtained as 99.24%, 97.95% and 93.84%, respectively. The accuracy of classification for data with 20 dB of noise is shown in the Table 2. Taking harmonics (C25) as an example, the triple disturbance consisting of the dimensional transient rise, pulse and harmonics, the model’s classification accuracy for this triple disturbance is 99.07%. As the table shows, the detection of composite disturbances containing transient rise, harmonic, notch and oscillation in high noise environment is poor, but overall, the average classification accuracy of the model for various types of single disturbance, double disturbance, triple disturbance and quadruple disturbance in high noise environment reaches 95.67%, 93.99% and 92.15%, respectively, and the model has better robustness in high noise environment (20 dB noise). The model has good robustness and still has high accuracy in a high noise environment (20 dB noise).
The classification accuracy of the best model on the test set (SNR
20 dB)
The classification accuracy of the best model on the test set (SNR
Comparison of the number of parameters of the model
To prove that the method suggested in this research is superior, different models were trained on the same data, with the training process for each model shown in Fig. 9 and then tested using a high noise (SNR
The training process of each model in a noisy environment (SNR 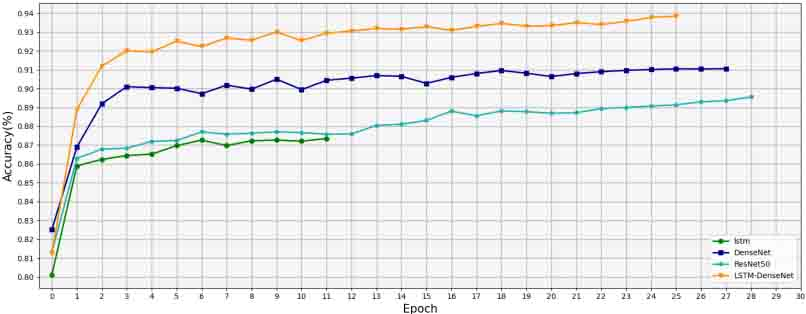
The fusion model on the basis of edge computing proposed in this paper compresses the extracted power quality data on the edge side, and then transmits the compressed data to the cloud for identification and classification. In order to ensure the accuracy of identification and categorization, it can not only reduce the communication cost of data transmission, but also reduce the cache pressure and computing pressure in the cloud. The follow-up work is to increase the types of disturbed data in the data, test whether the model can still maintain a high compression rate and classification accuracy in more complex data sets, and further optimize the network model according to the results.
Footnotes
Acknowledgments
The authors acknowledge the State Grid Shanxi electric power company science and technology project (52053020000X).