
Abstract
Taking on the problems of unstable reconstruction performance and high reconstruction method computational cost induced by the unpredictability of the measurement matrix during power quality signal reconstruction, this research provides a power quality reconstruction model based on a self-encoding network and compressed sensing for the first time. The model includes a noise-adding module, an encoder module and a decoder module. The noise-adding module adds a specific amount of white noise in relation to the original signal to simulate the disturbance signal collected in the real scene. The encoder module uses a nonlinear measurement method to observe the power quality signal, and the decoder module completes the signal through a compressed sampling matching tracking algorithm. Refactoring. The outcomes of the experiment reveal that the compressed reconstruction model proposed in this paper significantly improves the efficiency and stability of power quality signal reconstruction.
Keywords
Introduction
In the last few years, the scale of power grids has continued to expand, and large-scale power grid systems have produced many power quality problems such as unstable power and a wide range of harmonics in the power system, which have brought serious impacts on residents’ lives and social production [1, 2, 3]. How to quickly and accurately sample and analyze power quality signals has become the key to solving these problems. Compressed sensing technology solves the problems of the huge amounts of sampled data and difficulty in data storage through specific signal observation, sampling and reconstruction, and improves the efficiency of power quality signal sampling. It is important for power quality analysis and research [4].
Traditional power quality signal sampling and analysis methods mainly include traditional processing methods such as wavelet transform and S transform based on the Nyquist sampling theorem. Literature [5] puts forward the advantages of wavelet transform applied to signal processing, transient analysis, and other fields. Literature [6] discretizes the signal based on the traditional S transform, which improves the sampling efficiency.
However, these methods generally have shortcomings such as a large amount of sampled data, difficulty to store, and sampling frequency that does not meet actual needs [7]. In response to this problem, Donoho et al. provided the theory of compressed sensing, which greatly reduces the cost of data sampling, storage and transmission [8]. The key to the realization of the compressed sensing algorithm is mainly the sparse representation of the signal, the selection of the appropriate measurement matrix, and the three aspects of the reconstruction algorithm [9]. The sparse representation of the signal depends on the conversion of sparse bases. Common sparse bases mainly include Fourier bases and wavelet bases. Literature [10] studied the effect of sparse basis in power quality signal compression sampling and compared and analyzed the reconstruction performance of Fourier basis and wavelet basis. The selection of the measurement matrix is a key step in the theory of compressed sensing, which directly affects the degree to which the reconstructed signal retains the original signal. Typical random measurement matrix mainly includes Gaussian random measurement matrix and Fourier random measurement matrix. Literature [11] introduced zero elements into the Gaussian matrix by threshold processing, and applied it to the power quality signals compression and reconstruction, and achieved better results. The most important part of the theory of compressed sensing is the design of the reconstruction algorithm, which directly determines the practicality of compressed sensing theory in actual scenarios [12]. Greedy matching pursuit algorithm, convex optimization algorithm, and combination optimization algorithm are the three most classic reconstruction algorithms [13]. In contrast to the other two algorithms, the greedy algorithm requires a smaller amount of calculation and a better reconstruction effect under the same premise, so it has a wider range of applications. Typical greedy algorithms include MP algorithm-based orthogonal matching pursuit algorithm, orthogonal matching pursuit algorithm with regularization, and pursuit method for subspace matching [14]. However, the implementation of the above algorithm requires a known signal sparsity, which is often difficult to achieve in reality. To solve this problem, literature [15] proposed an optimized adaptive matching pursuit algorithm, which makes a preliminary judgment on the sparsity in the sampling stage, and reduces the time required to process the signal by optimizing the iterative process. Literature [16] improves the dependence of reconstruction effect on sparsity. The algorithm uses variable step size and old and new residual values to control the power quality reconstruction accuracy and the number of iterations, which greatly improves the reconstruction performance. Literature [17] combines principle component analysis theory with compressed sensing theory, and establishes a linear relationship between signal sparsity and coefficient source difference.
Although compressed sensing theory has good applications in power quality signal reconstruction, random observation matrices often have problems such as large calculations, large storage, and unstable reconstruction quality after sampling [18, 19, 20]. The autoencoder can learn to extract the condensed expression of the data itself through self-learning, and then use the condensed coding features to reconstruct the information originally contained in the data [21]. Literature [22] applies the self-encoding network to the compression and reconstruction of image signals, and the reconstruction effect is significantly better than traditional image reconstruction methods. Applying the autoencoder to the compression and reconstruction of power quality can not only overcome the shortcomings of the random measurement matrix in the signal compression process, but also improve work efficiency by reducing the amount of calculation.
Therefore, the article establishes a power quality reconstruction model based on the self-encoding network and compressed sensing. The two steps of the selection of the measurement matrix and the selection of the reconstruction algorithm in the process of power quality signal compressed sensing are used, respectively, by the encoder in the self-encoding network. The network and decoding sub-network are improved. During the training process, the encoder module automatically learns how to collect the characteristic information of the signal, and uses nonlinear measurement instead of traditional linear measurement for power quality signal observation, avoiding artificial design of the observation matrix and solving the random measurement matrix. The problem of breaking the traditional three-step power quality compressed sensing, using the self-learning ability of the network model to reduce the signal reconstruction time and improve the reconstruction performance.
Power quality data reconstruction model based on self-encoding network
Compressed sensing
According to the theory of compressed sensing, assuming that the original signal is
In the formula,
The traditional compressed sensing process includes two steps: compressed sampling and signal reconstruction. The self-encoding network includes two steps: encoding and decoding. Based on this, the compressed sampling in the compressed sensing process is equivalent to the dimensionality reduction coding of the original power quality signal; the signal reconstruction is the same as the decoding of the low-dimensional signal, and the two are essentially the same.
The power quality of the power system is always interfered by external noise during the measurement process. There are many reasons for the formation of noise, such as power switching, electromagnetic interference, power electronic equipment, etc., which may generate noise. The characteristics of these noises are similar to those of white noise. Therefore, the denoising self-encoding network established in this article is a neural network model with multiple layers that changes the input signal based on the traditional self-encoding network and adds a certain proportion of white noise to the input signal. The model consists of three parts: signal adding noise, encoding sub-network, and decoding sub-network.
1) Noise-adding module
The purpose of adding noise to the signal is to make the simulated signal closer to the real data. Based on the original signal, a certain proportion of white noise is added to form a damaged signal, which is used as the input data of the network, and then a clean original signal is reconstructed through model training. White noise is obtained by randomly combining sounds of different frequencies. Its power spectral density is constant and uniformly distributed throughout the frequency domain. According to its definition, the power density spectrum
In the formula,
Assuming that the initial power quality signal is
2) Encoder module
At present, most of the network frameworks for machine translation are encoder-decoder networks. Figure 1 depicts its working structure. The encoder compresses the input sequence into a fixed-length feature vector, the name of this feature vector is the context. The end of the decoder reconstructs the output sequence by reading the vector. Among them, the encoder and decoder can be implemented by RNN or CNN, or a combination of the two.
Encoder-decoder network structure.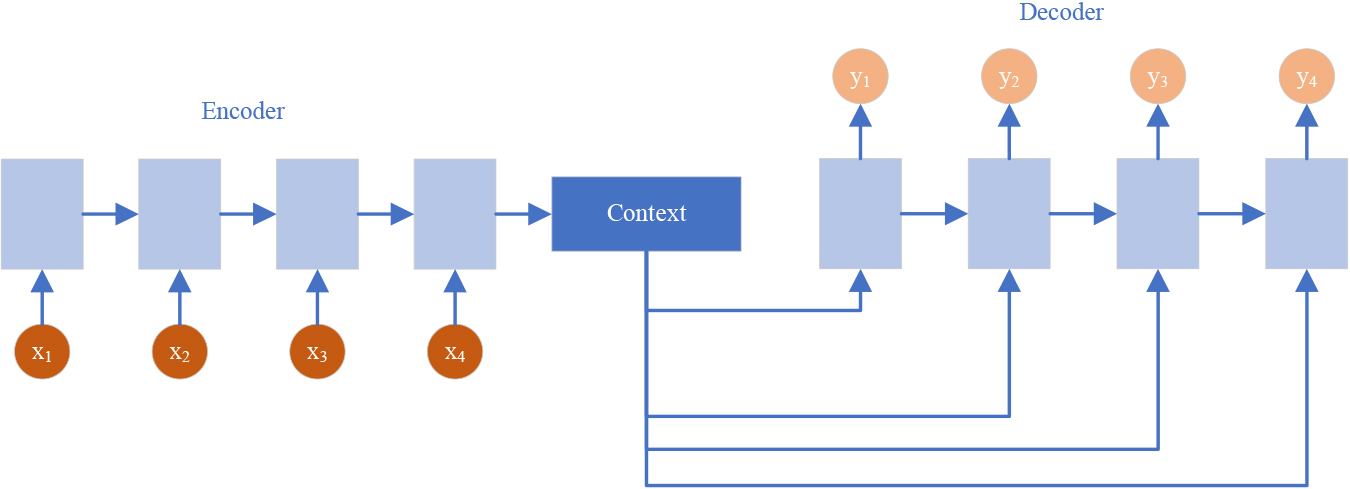
The encoder module in this article is a three-layer neural network that maps N-dimensional signal compression sampling to M-dimensional measurement value vectors. The purpose is to iteratively learn signal structure features during the compression sampling process and retain the most effective key information to reconstruct the signal. In traditional compressed sensing, compressed sampling usually uses a linear measurement method, that is, selecting a specific observation matrix that meets the conditions of the routing information protocol, and then multiplying the observation matrix with the sparsely represented original signal matrix to obtain the output value. The non-linear measurement method is to perform non-linear operations on the measured value based on the linear measurement. Compared with the linear measurement, the non-linear measurement can learn more signal key characteristic information and achieve better reconstruction performance. The encoder module is a five-layer network. Each layer has N, K, and M neurons, respectively (M
Where:
3) Decoder module
The decoder module aims using a massive number of signal reconstruction data to learn a nonlinear reconstruction function suitable for this type of signal, and to reconstruct the M-dimensional measured value vector into an N-dimensional original signal as accurately and quickly as possible. This module is also a five-layer network, which is symmetrical in structure with the encoding module, but there are differences in parameter settings and the quantity of neurons. The amount of neurons in each layer is M, K, and N, respectively. The input value is the M dimensional measurement value y output by the encoder, and the output is the reconstructed key structural feature
Model training is to obtain appropriate parameters. It is a process of parameter optimization. Through each round of training, the difference between the model’s predicted value and the actual label value, namely the loss value, is obtained, and then back-propagated according to the loss value, that is, according to the model, the loss value of this layer is reversed to calculate the error of the previous layer, and each weight parameter of the current model is updated layer by layer until the loss value stabilizes within a range of amplitude. The model loss function is composed of three parts. The first term is the mean square error, which is used to calculate the error between the original signal and the rebuilt signal; the second term is the regularization function, which is used to avoid model overfitting; the third term is sparse penalty terms, fewer neurons in the hidden layer, and get key features. Its expression is:
Where
Power quality data reconstruction model based on self-encoding network.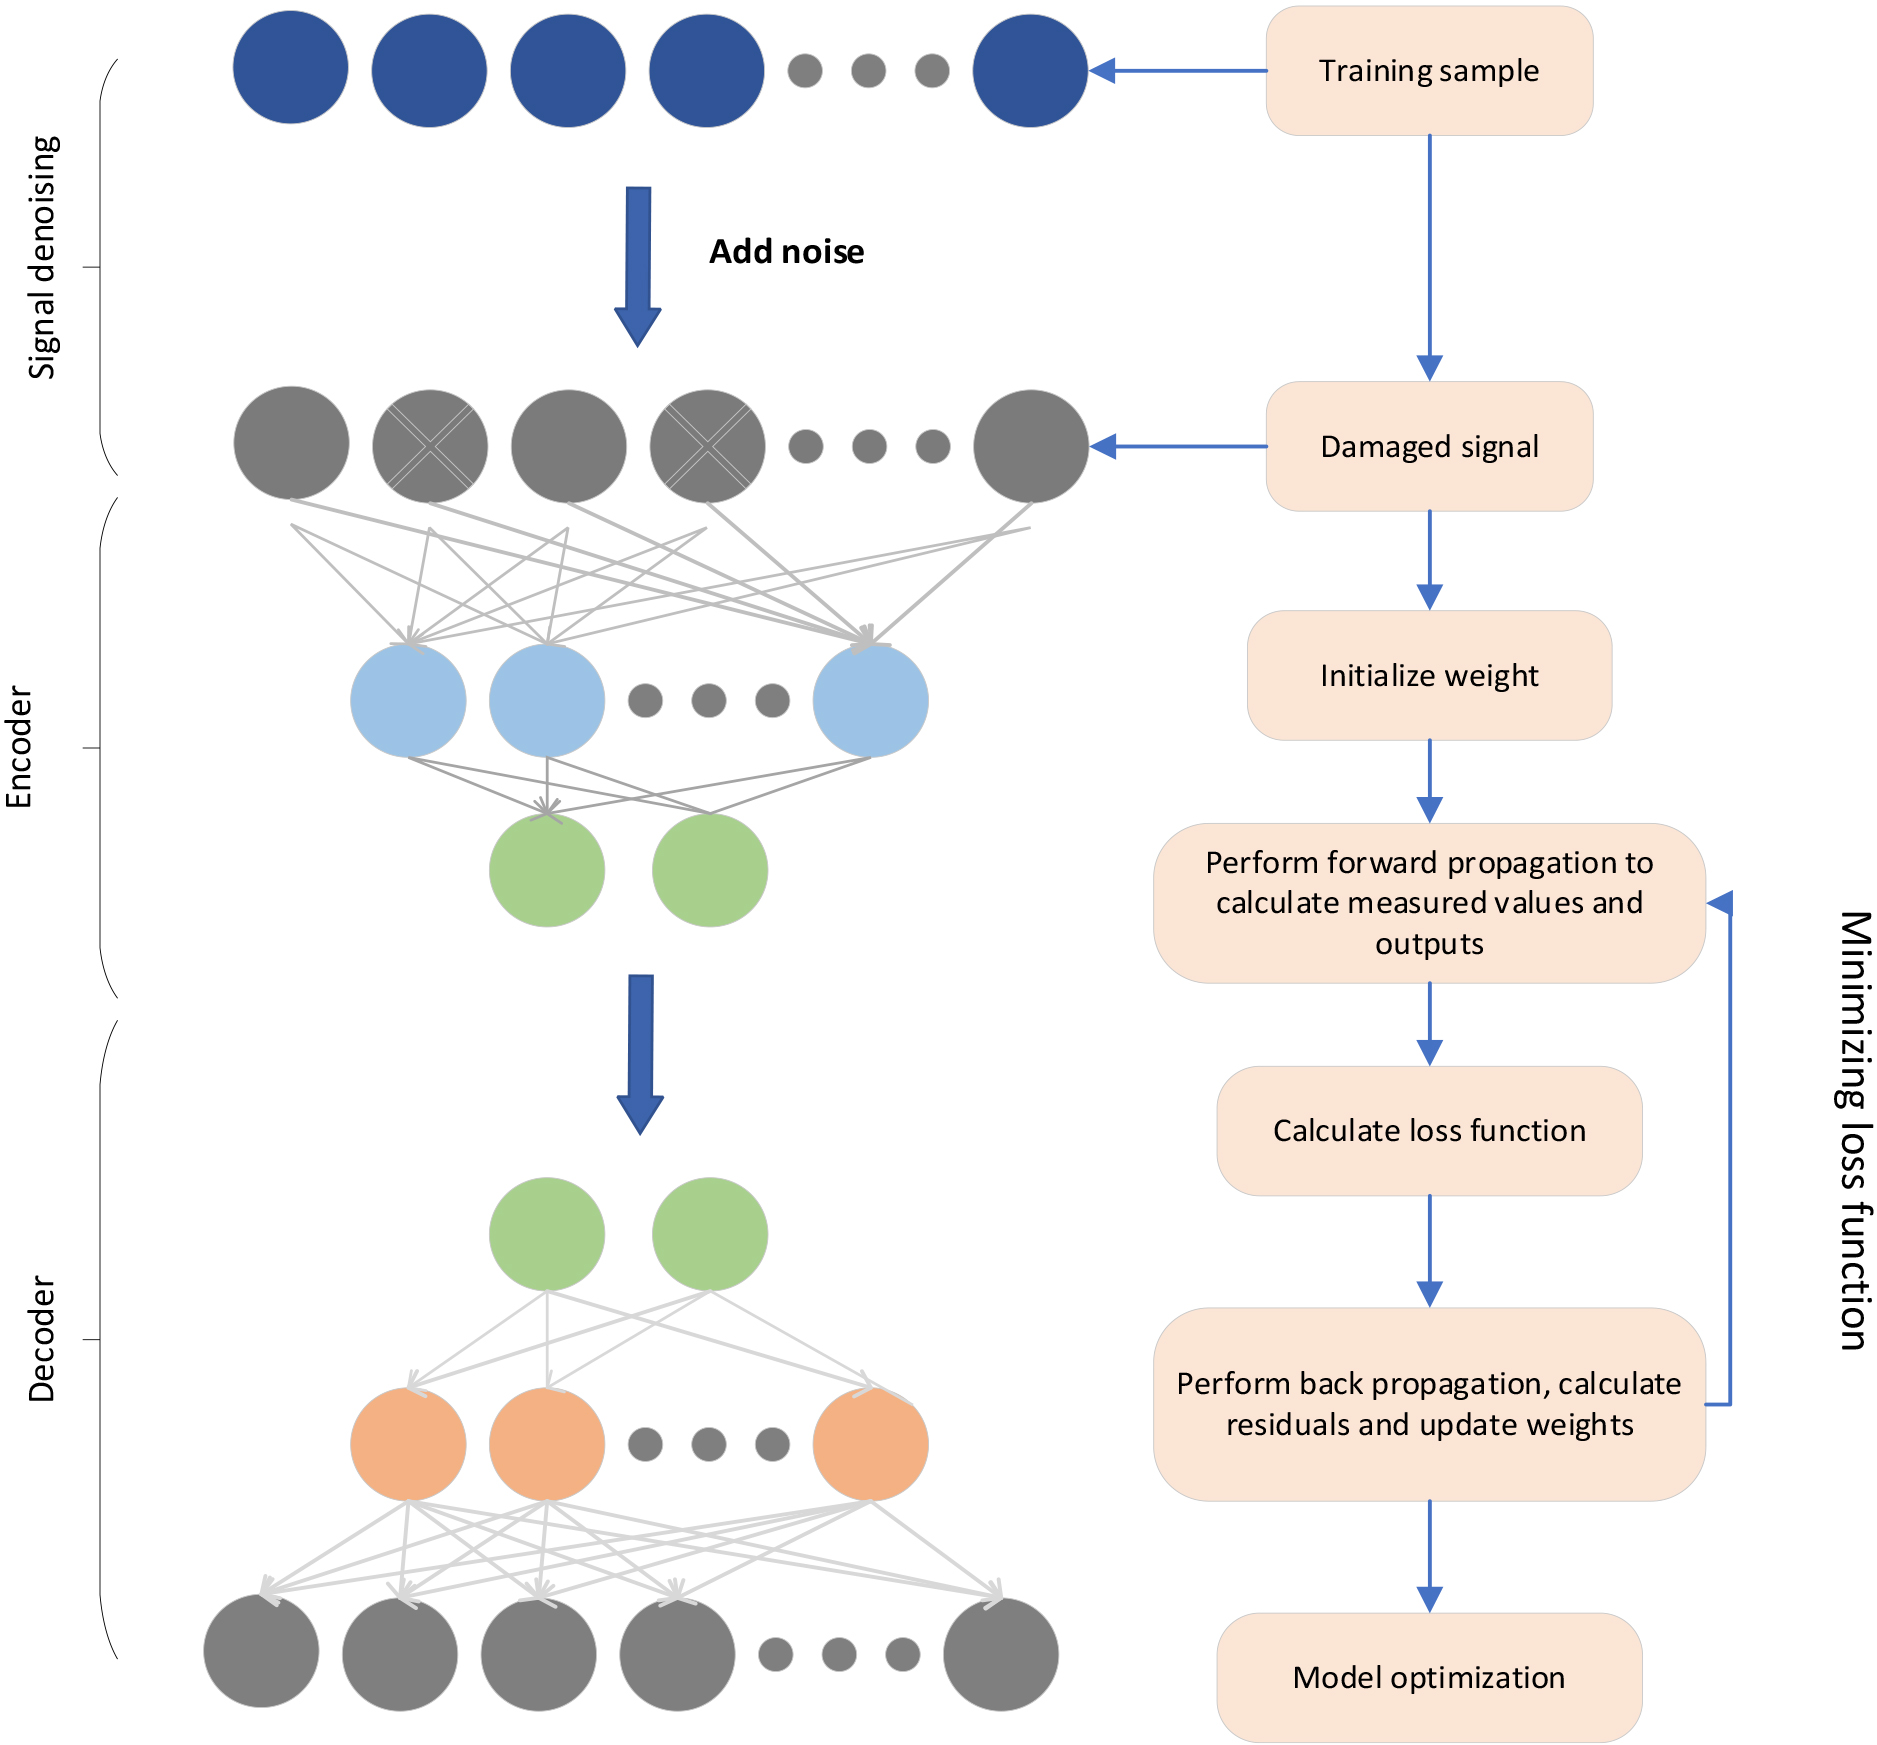
The parameter update process is: first obtain the measured value vector
In summary, the power quality reconstruction process based on self-encoding network and compressed sensing mainly include 7 parts:
Construct a self-encoding network, set the hyper-parameters, and initialize the weight parameter W and the bias value Execute the noise-adding module to get the damaged signal. Execute the coding module algorithm to calculate the measured value y and the output signal Compare the error between the damaged signals and the output signals, and calculate the loss function. Back-propagation algorithm to update model parameters. Continuously loop iterative steps 3), 4), and 5) to minimize the loss function. Output reconstruction signal.
Experimental environment
To verify that the proposed model is feasible and effective, the MatLab 2019a simulation platform is used to generate six different types of power quality disturbance signal samples, The self-coding network model is built, and the compressed sensing experiment is carried out on the generated disturbance signal samples. The parameters are set as follows: the sampling frequency is 6000 Hz, the fundamental frequency is 50 Hz, and the sample signal length is 1200 sampling points.
Experimental analysis
Power quality disturbance signal simulation
The ideal power quality signal is a completely symmetrical sine wave. This paper mainly simulates six different types of power quality disturbance signals. Table 1 displays the expressions.
Mathematical models of power quality disturbances
Mathematical models of power quality disturbances
Under the above specified experimental environment, according to the above power quality disturbance signal expression and white noise signal expression, the power quality disturbance signal is constructed by using the MATLAB 2019a simulation tool.
The power quality compression reconstruction model based on a self-encoding network and compressed sensing is used to reconstruct six disturbance signals, corresponding normal lossless original signal, lossy signal, reconstructed signal, and reconstruction error, as shown in Figs 3 to 8.
Lossless original graph, lossy graph, reconstruction graph, and reconstruction error graph of voltage sag.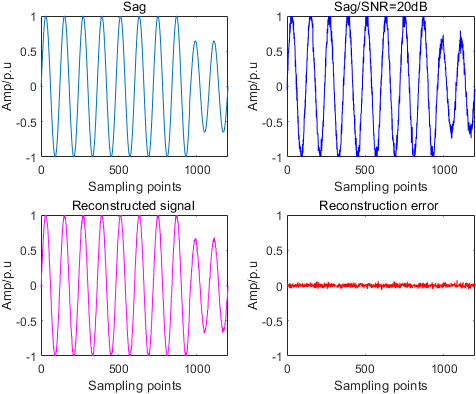
Lossless original graph, lossy graph, reconstruction graph, and reconstruction error graph of harmonics.
Lossless original graph, lossy graph, reconstruction graph, and reconstruction error graph of interruption.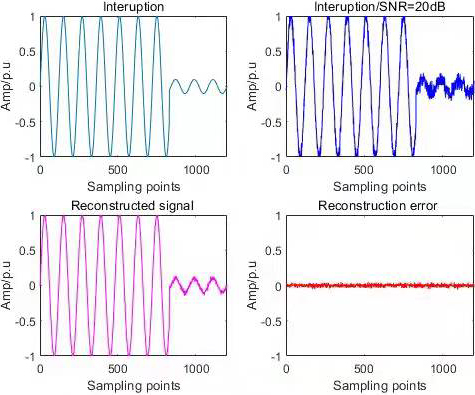
Lossless original graph, lossy graph, reconstruction graph, and reconstruction error graph of flicker.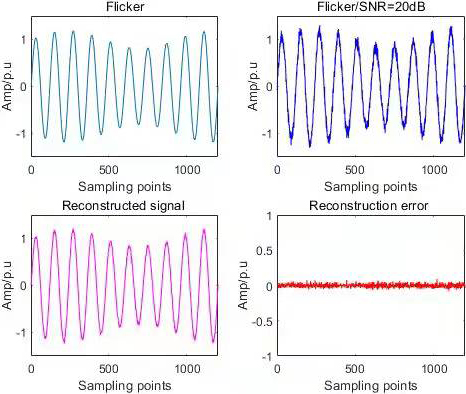
Lossless original graph, lossy graph, reconstruction graph, and reconstruction error graph of sag 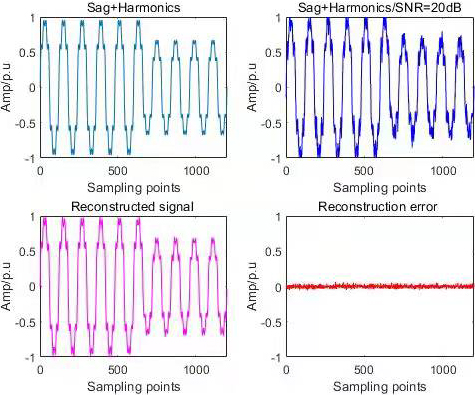
Lossless original graph, lossy graph, reconstruction graph, and reconstruction error graph of swell 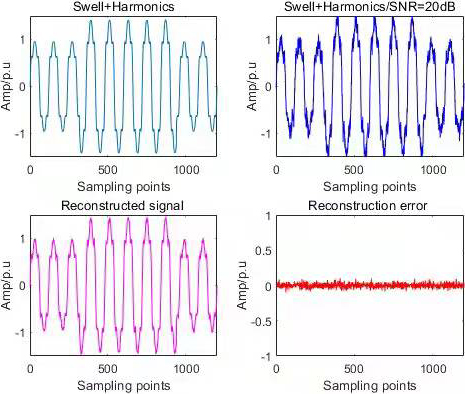
To verify the performance of the power quality data reconstruction model based on self coding network more objectively and fairly, the voltage sag disturbance signal is taken as an example for experimental analysis.
1) Evaluating indicator
To test the model’s performance in this research, we use signal-to-noise ratio (SNR) as the evaluation index, which is the signal-to-noise ratio in the data output by the model, and its expression is:
Where
2) Determine the number of layers L of the self-coding network
In the process of model construction, we carry out a set of experiments to determine the optimal number of network layers L. During the experiment, the control variable method is used to adjust the number of network layers L. Figures show the impact of different network layers on the performance of model reconstruction. Figure 9 demonstrates that the effectiveness of the model gradually improves as the number of network layers increases. However, when the number of network layers L is greater than 5, the performance of the model is slightly improved, but the number of model parameters increases sharply, the time cost loss is huge, and the hardware requirements for reconstructed data are improved. Therefore, to balance the time cost and reconstruction performance, the number of layers of the self-coding network is set to 5.
Influence of network layers on the model.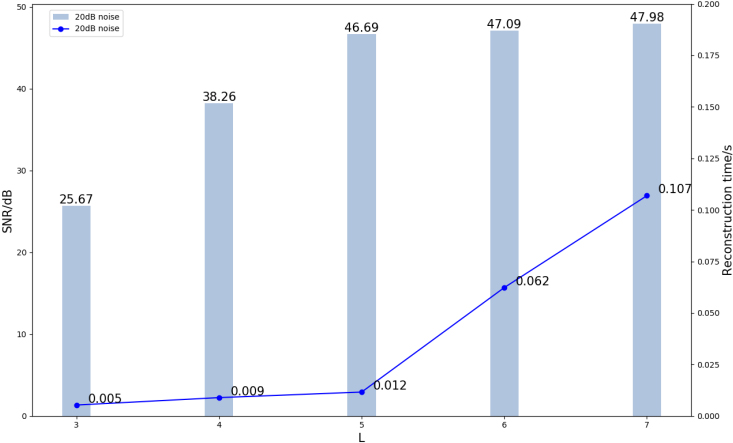
3) Determine the sparsity coefficient
In the process of model training, to determine the effectiveness of sparse coefficients, we first compare the reconstruction performance when the sparse coefficients are 0 and 0.001, respectively. The experiments show that the sparsity of neurons can enhance the uniqueness of features, improve the representation ability of features, and then improve the accuracy of network training. Secondly, to obtain the best sparse coefficient
Influence of sparsity on model.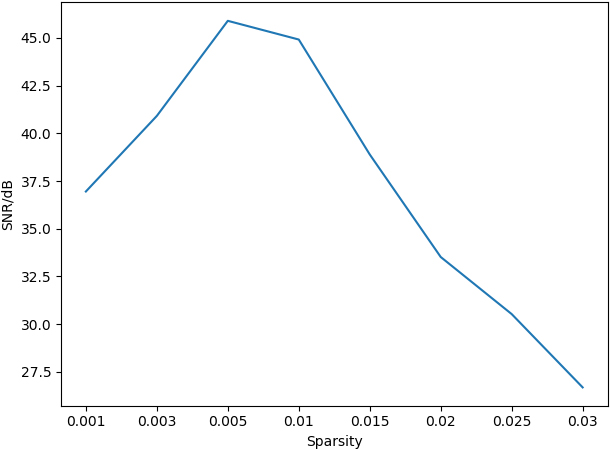
4) Analysis of the influence of noise on model performance
The noise intensity will greatly affect the reconstruction quality of the model. Figure 11 depicts the impact of different intensity noise on the model with the change of observed values. As may be seen in the figure, the reconstruction model’s quality decreases sharply as noise increases. The experimental signal-to-noise ratio is 20 dB.
Influence of noise on model.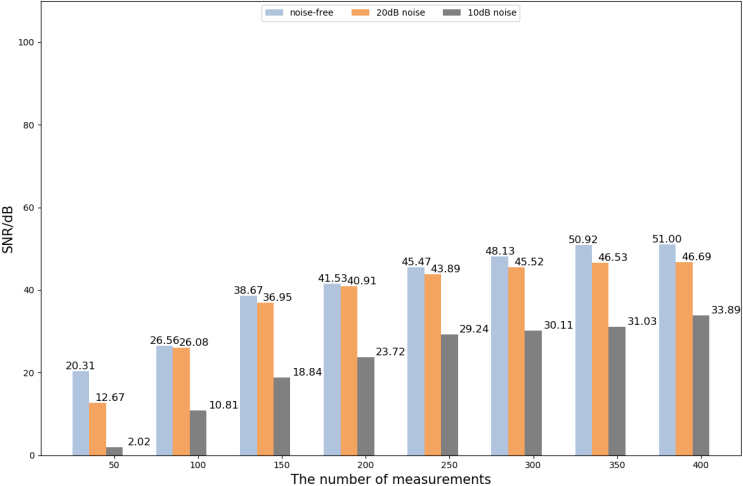
5) Comparative analysis of models
In order to verify the effectiveness of the non-linear measurement method to replace the traditional linear measurement for power quality signal observation and to solve the randomness problem of the measurement matrix, the model in the paper (AE-CS) was compared with the compressed sample matching tracking algorithm (DG-CoSaMP) using Fourier transform basis and Gaussian random matrix, the compressed sample matching algorithm using Fourier transform basis and Bernoulli measurement matrix (DB-CoSaMP) under the same experimental conditions. Tracking algorithms (DB-CoSaMP) were compared, and the changes in evaluation metrics are shown in Fig. 12. The analysis shows that the reconstruction performance of the AE-CS model is significantly better than the other two algorithms, and the model in this paper can reconstruct a better quality image signal from a small number of measurements and obtain a higher average SNR value over the whole measurement range. The main reason for this result is that the AE-CS model learns a function that is best suited to various signals, and this function enables the observation of the test signal by capturing the signal structure features of a large number of training samples during the training process, and thus the reconstruction of the signal. The other two algorithms use a fixed observation matrix, which is less adaptable and leads to poor reconstruction results.
Comparison of performance indicators for voltage sag reconstruction of various algorithms
Variation curve of evaluation index for the lossy signal of voltage sag under three algorithms.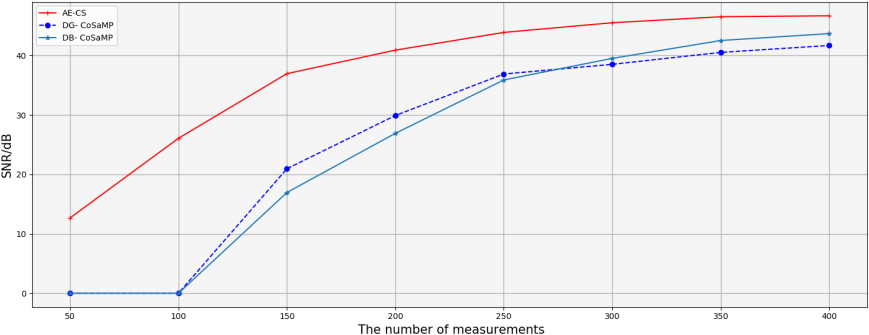
To verify the superiority of the self coding network architecture fitting learning method over the performance of the traditional iterative reconstruction algorithm, under the same experimental conditions, the model in the paper (AE-CS) is compared with the orthogonal matching tracking algorithm (OMP) and the compressed sampling matching tracking algorithm (CoSaMP). The changes of each evaluation index are displayed in Fig. 13. As may be seen in the figure, the AE-CS model retains more effective information through fitting learning in the compression sampling process, and an optimal reconstruction function is obtained through multiple training, which can adaptively reconstruct all power quality data.
Variation curve of evaluation index for the lossy signal of voltage sag under three algorithms.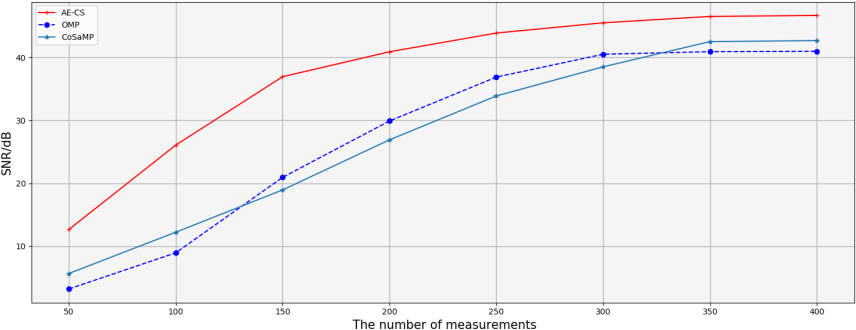
To make the evaluation indexes more authentic and effective, the number of experiments is increased to 50, and all indexes take the average value, as shown in Table 2. According to the table analysis, in terms of reconstruction time, the AE-CS model is many times faster than OMP and CoSaMP. This is because OMP and CoSaMP algorithms need multiple iterations when reconstructing data, and multiple matrix multiplications are required for each iteration, while the model in this paper only needs twice the matrix multiplication, which greatly reduces the reconstruction time cost. From the analysis of parameter quantity, the AE-CS model needs to train 812824 parameters, and the OMP model and CoSaMP model need to train 4924304 and 1847104 parameters, respectively. Therefore, the time cost of the AE-CS model is far lower than that of other algorithms and has a great advantage in reconstruction efficiency.
In this research, a power quality reconstruction model using a self-coding network is proposed for the first time. The model applies the idea of self coding to the compressed sensing scene, iteratively learns the key structural characteristics of the input signal by using the nonlinear measurement method of the encoder module, obtains the observation vector, and solves the problems of high computation, storage and unstable reconstruction quality after sampling of random measurement matrices in the compressed sensing process. At the same time, the decoder module is trained iteratively to reduce the signal reconstruction time by using the self-learning ability of the network model. The experimental results show that compared with the traditional model, the signal-to-noise ratio of the model established in this paper is increased by 34.87%, the reconstruction speed is increased by 3 times, and the reconstruction effect is better.
Footnotes
Acknowledgments
The authors acknowledge the State Grid Shanxi electric power company science and technology project (52053020000X).