
Abstract
With the development of science and technology, new energy technology has increasingly become a hot spot of academic research. Today, solar, nuclear, tidal and wind power generation is gradually replacing thermal power generation. Aiming at the configuration problem of traditional wind power generation, this research will optimize the control of wind turbine generator sets, so as to realize the configuration optimization of the entire distribution network. In this study, a MOG (MOG) algorithm control optimization method was introduced. First, each scenario is constructed, and components such as centralized wind power plants are configured and controlled through the internal power flow program; then, decision variables are defined, and three objective functions with trade-off relationships are constructed. Finally, the MOG algorithm is used for iterative solution, and the point with the lowest violation cost is selected as the optimal solution. Simulation experiments including three different configuration scenarios were conducted in MATLAB environment for comparing the influence of different connection modes on distribution network. According to experimental results, the effectiveness of the proposed method is verified and it is proved that the proposed method can be applied to complex distribution networks.
Introduction
Intermittent energy sources including solar and wind energy (RER) have been introduced into power systems [1]. This brings changes to the planning and operation of power generation, transmission and distribution. Since renewable generating units can usually be installed near the power load, the introduction of such power resources is conducive to the development of technology, environment and economy, and will further promote the development of environmentally friendly power generation, transmission and distribution systems [2].
Economically, the integration of renewable energy that can be stored in the power grid can reduce the dependence of power distributors on upstream power companies, realize reserve energy sales, and reduce losses by taking advantage of the close distance between power generation points, thus improving the efficiency of distributors [3]. However, to integrate RER into distribution network, a great deal of researches are needed. Based on robust methodology, appropriate control and energy storage devices should be adopted. For example, Zhang et al. [4] put forward the optimization method of distributed ESSs (like batteries and supercapacitors) to reduce the negative impact of RER with high permeability and promote the use of distributed ESSs in distribution networks. Mehmood et al. [5] studied the wind and solar distributed generator having the battery storage system (BSS), and combines NSGA-II method to determine the scale and allocation of optimization problem, taking into account of battery life, power loss, voltage regulation (VR) and DG layout cost.
In addition, Jannat and Savic [6] put forward an optimization method for the distribution of shunt capacitors and RER in distribution network, considering objective functions, including bus voltage stability, power loss and current balance. However, the use of SVR and its influence are not considered. Sun et al. [7] developed a complex distribution network to control wind power energy, and proposes a method of wind turbine condition detection and evaluation. Bayesian optimization algorithm is used to optimize hyperparameters, but the analysis is not combined with the actual distribution network. Wang et al. [8] took account of the load fluctuation randomness and the wind power active output, and proposes an optimum control strategy for frequency adjustment of variable speed wind turbine parameter system under high wind power penetration rate. However, it considers the multi-objective configuration and analysis using various combinations of CB and SVR. The research innovatively takes into account the impact of various fields of technology, economy and environment. Research is carried out in these areas, and different devices and methods are studied for various constraints. In this study, a multi-objective genetic algorithm is proposed to optimize three different configuration schemes, and by comparing the three optimization results, the optimal distribution network configuration scheme is finally obtained.
Model description
The method put forward is implemented in 20 kV medium voltage distribution system, which includes 162 buses and 165 lines, and a distribution network composed of substations, distribution stations (JS) and substations (TS) responsible for power transmission, distribution and consumption.
Wind power and ESS
This method proposes a control optimization method based on MOG algorithm. By switching the taps on the winding of the autotransformer, the voltage regulation within the determined switching operation range can be realized, which is more suitable for complex distribution networks, and has certain robustness in different optimization scenarios, and has stronger applicability. In addition, the method proposed in this study takes the lowest point of violation cost in the complex distribution network environment as the optimal solution demand point, which can consider the economic benefits on the basis of ensuring the stable and efficient operation of the overall system, and solve the risk unit control problem in the complex distribution environment from the perspective of technology and economic effects. Compared with other research methods, it is more comprehensive and more applicable. It can lay a theoretical foundation for the practical control scheme of multi cortical risk unit control with high efficiency and economy.
In this paper, centralized wind power station and BSS are regarded as RER and ESS respectively. For the wind power station and BSS, the central bus JS which connects the substation to the main medium voltage TS or load bus is a practicable location. JS can transmit more power, and it is the best option to reduce the power loss existing in current distribution network. In addition, when the production capacity of the wind turbine exceeds the load demand of the network, extra power can be transmitted and stored in BSS, thus reducing energy waste. The largest wind turbine output power under rated wind speed considered in this optimization method put forward is 0.5 MW.
Assuming that bidirectional BSS is used in the current distribution network, the optimization aims to determine the optimum arrangement of BBS charging and discharging time. Shi and Luo [9] defined three different control strategies for power system operators. In terms of the first strategy, whenever the wind power generation of specified proportion and the wind turbine output power are greater than the load level, ESS is run to meet the energy storage demand. In the second strategy, whenever the load demand is higher than the wind power generation’s specified proportion, ESS can be for meeting the load demand. As for the third strategy, if the available power generation cannot satisfy the load demand, ESS is used. The third strategy is used in the methodology proposed in this paper.
The mathematical expression of BSS’s charge and discharge arrangement and SOC at the time t as well as its constraints is:
Wherein Pdch, Pch, Pg, Pw and Pl are respectively BBS’s discharging time, charging time, upstream power, wind farm generation and load demand of distribution network at the time T. When the demand load is less than the total power generation, BBS operates under the charging mode, so that the SOC will increase. On the contrary, when the demand load is greater than the total power supply, BBC will operate as a generator in discharge mode. BBS is subject to the following constraints in charge and discharge and SOC:
Wherein,
CB and SVR are reactive power support and voltage regulation equipment in distribution network. In this paper, the cooperation among CB, SVR, ESS and wind power station is studied to achieve optimum operation. CB provides reactive power interacting with reactive load to power network. That is, after the capacitor is placed at bus
Wherein,
Similarly, SVR, as a distributed voltage regulation device, is widely used in distribution network. The working principle of SVR is on the basis of embedded auto-transformer and voltage regulation operation. Through switching the taps on the winding of auto-transformer, the voltage adjustment within the determined range of switching operation can be realized. The standard SVR includes a reversing switch with a voltage adjustment range of about 10% [10]. In this paper, the SVR with 32 switching steps is taken into account of, including 16 pressurization steps (positive values) as well as 16 depressurization steps (negative values) within the range of VR, with each step indicating a 0.625% change of voltage in the operation.
Real-time optimization of large-scale complex distribution network based on power flow is a difficult task. Adding multiple devices to this complex power network for scale and layout optimization will further increase decision variables and optimization complexity, but a feasible convergence solution can be obtained. In addition, there will be quite high memory requirement and quite long simulation time. Therefore, this paper proposes a robust real-time optimization method by
Flow chart of proposed method.
As an elite multi-objective and evolutionary algorithm,
Each subspace only supports occupation by one solution of
When and only when Eq. (10) holds for
The set
Accordingly,
This algorithm defines three populations:
1)
2)
Wherein,
3)
The optimization algorithm proposed in this paper have the following steps:
Establish an empty population
Create randomly generated
For each individual of
According to the following steps, file
4.1) Determine
4.2) Calculate the limits
4.3) Put
Now, create the subordinate population
5.1) Select two individuals
5.2) Generate a random number
5.3) If
5.4) If mu
And then include it into
According to its position in the target space, analyze and place the individuals from
At last,
This paper selects the power flow analysis method with the largest accuracy, namely NR, to perform analysis of power flow [14]. On this basis, an improved NR power flow method is put forward. Power flow analysis has great significance in the analysis and demonstration of the influence of ESS, renewable energy as well as adjustment equipment on network parameters and indicators.
Power balance constraint
As shown in Eq. (13), the conventional steady-state AC power flow constraint refers to the set of nonlinear equations at the bus of the network [15].
Wherein,
The largest and the smallest limits of the network’s bus voltage amplitude and phase angle can be expressed as:
Wherein,
Line current constraint is applied to avoid the current from approaching the heating limit. It can keep the current at the transmission and reception ends of the line within the line’s upper limit:
Wherein,
In the optimization problem, to get a good solution, the choice of objective function is vitally important. The optimization method of this paper aims at minimizing the objective function which contains three cost functions with trade-off relationship with among each other. The first objective function refers to the system’s total actual power loss; the second objective function refers to the daily voltage deviation:
Wherein,
Wherein,
In the end, the third objective function space is mainly for the illegal cost. It includes four important optimization and power flow constraints. The last objective function
Wherein,
From this, the violation cost of four constraint items is derived:
1) If
2) If
3) If
4) If
Wherein,
In the third objective function, considering the violation of specific constraints, the reasons are as follows: first, give constraints greater priority; secondly, improve the robustness of the algorithm to obtain natural feasible solutions; finally, prevent the singularity of Jacobian matrix in power flow analysis.
By creating various configurations of ESS, SVR and CB through simulation, three independent optimization scenarios are realized. Each scenario will be described separately below.
The first scenario
In this scenario, centralized BSS and wind power station are configured to show the influence of integrating them into the real distribution network. In the optimization process, firstly, the BSS and the wind turbine are modeled and mathematically expressed, and the optimum scale (optimum Pareto frontier) is obtained as shown in Fig. 2. The optimization result of the first scenario: the optimum parameters of BSS are shown in Figure. Among it, Fig. 3a reflects the charging and discharging schedule of BESS and Fig. 3b shows the SOC of BESS.
The optimum pareto frontier of the first scenario.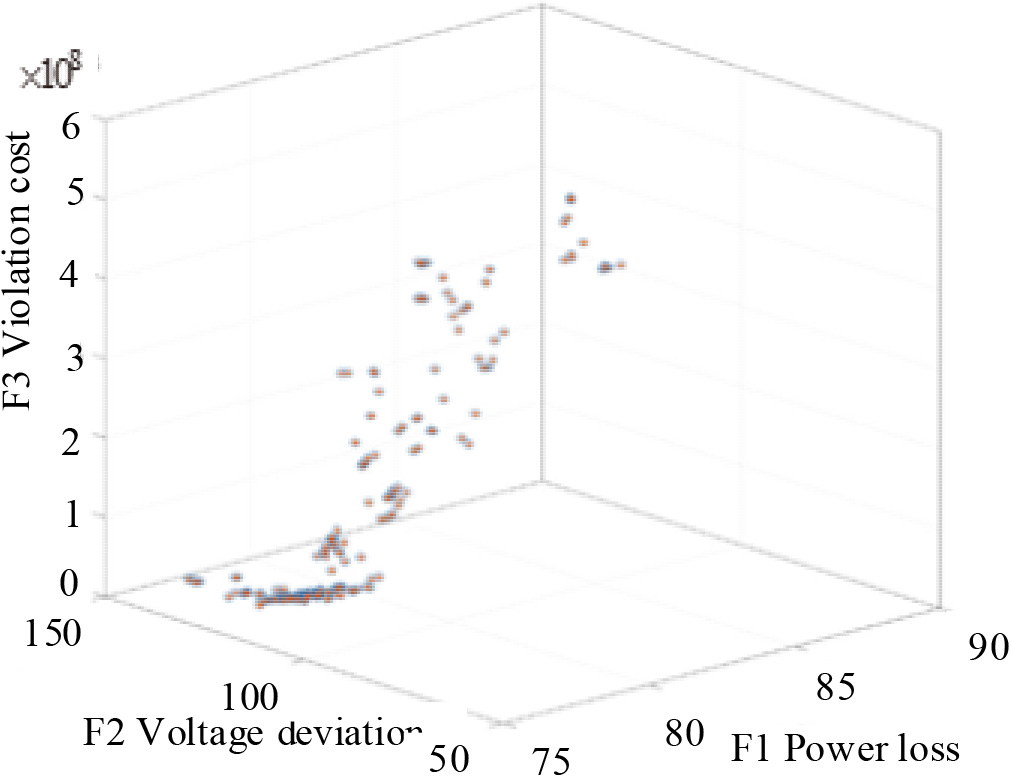
Optimization results of the first scenario.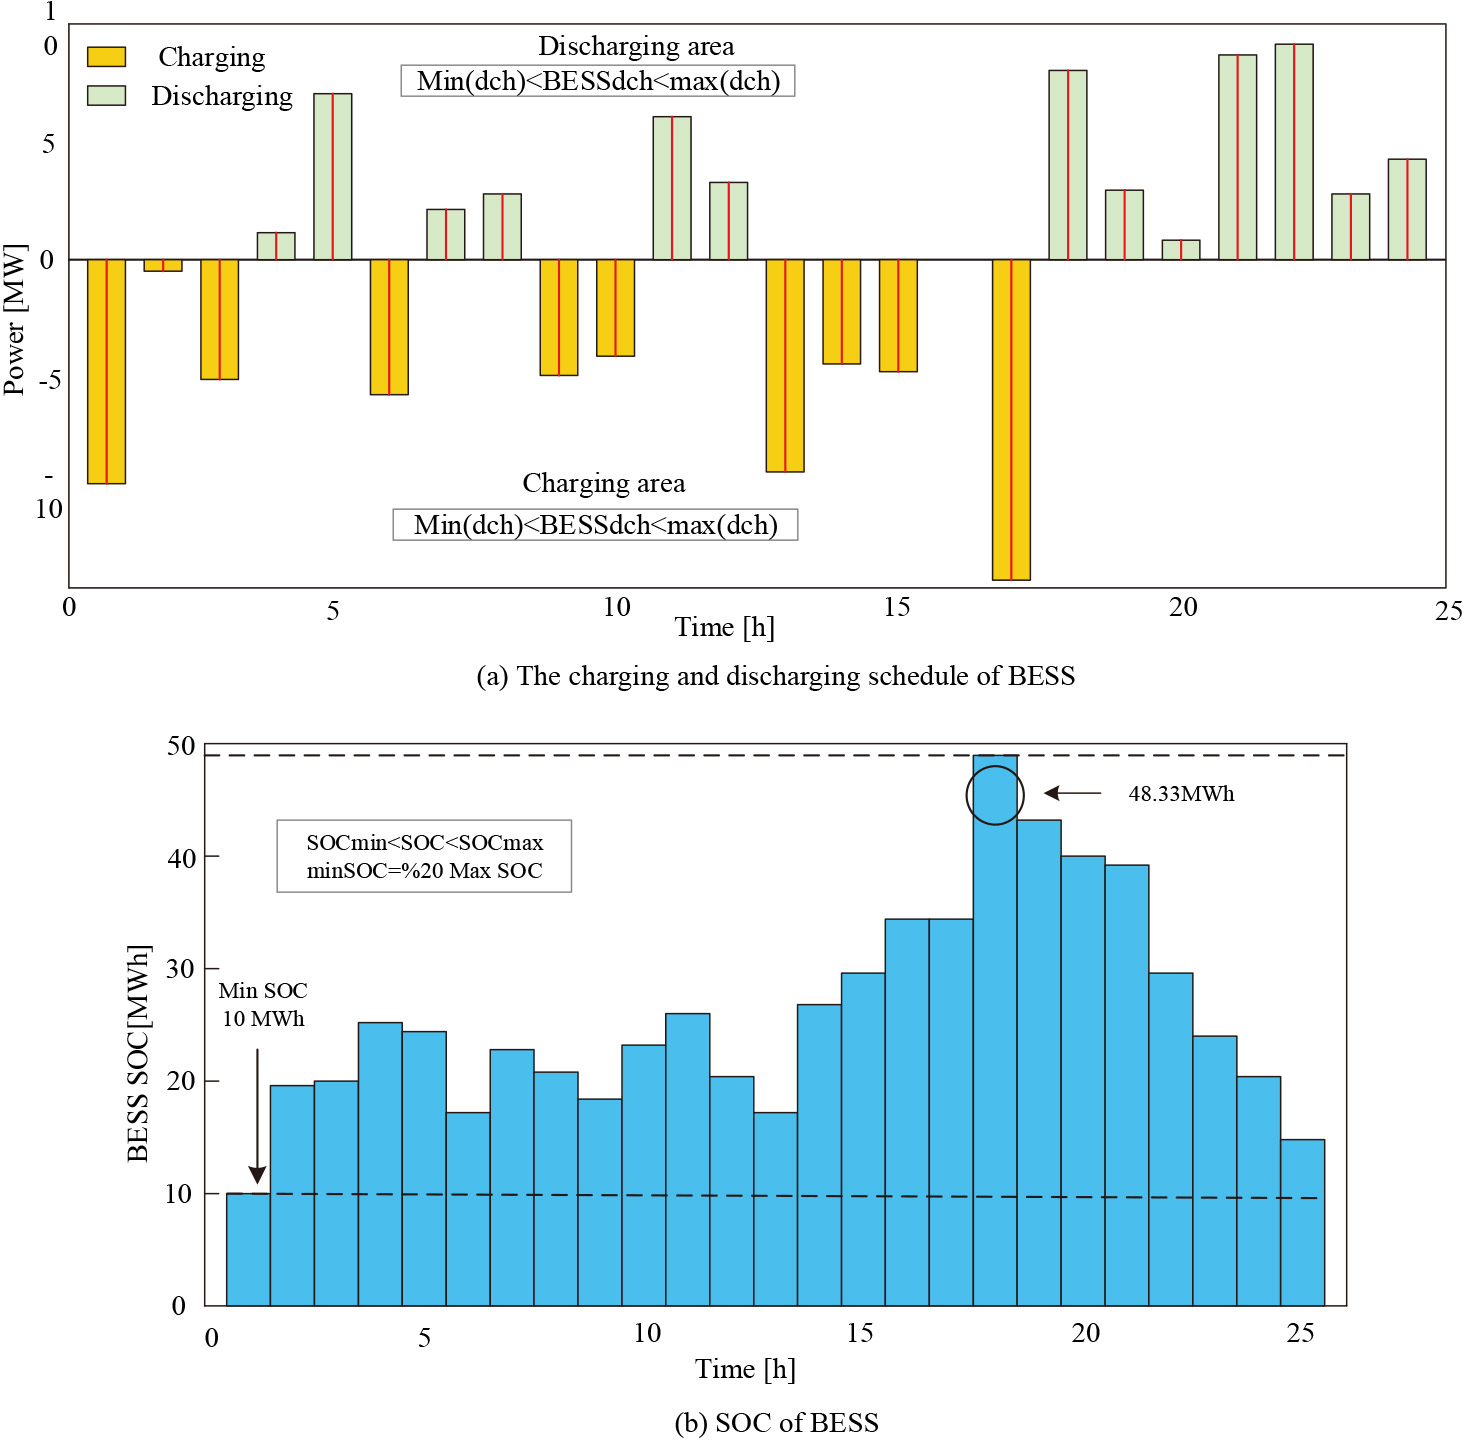
As shown in Fig. 3, Fig. 3a reflects the charging and discharging schedule of the BESS, and Fig. 3b shows the SOC of the BESS. It can be seen that in this scenario, the charging and discharging scheduling of the system is relatively uneven, in which the energy value of the discharge area fluctuates between 0–10, while the energy value of the charging area fluctuates between 0–15. Therefore, it can be seen that the charging interval and the discharging interval do not match well, and the floating range of the charging interval is larger, which is likely to shorten the service life of the battery. Meanwhile, the optimized SOC value is 48.33 mwh.
The second scenario is simulated in the distribution network to analyze the impact of BSS and SVR when they are running simultaneously and the wind power station’s optimum penetration. The optimum Pareto frontier is shown in Fig. 4. The optimization result of the second scenario: the optimum parameters of BSS are shown in Fig. 5. Among it, Fig. 5a reflects the charging and discharging schedule of BESS and Fig. 5b shows the SOC of BESS.
Optimum pareto frontier of the second scenario.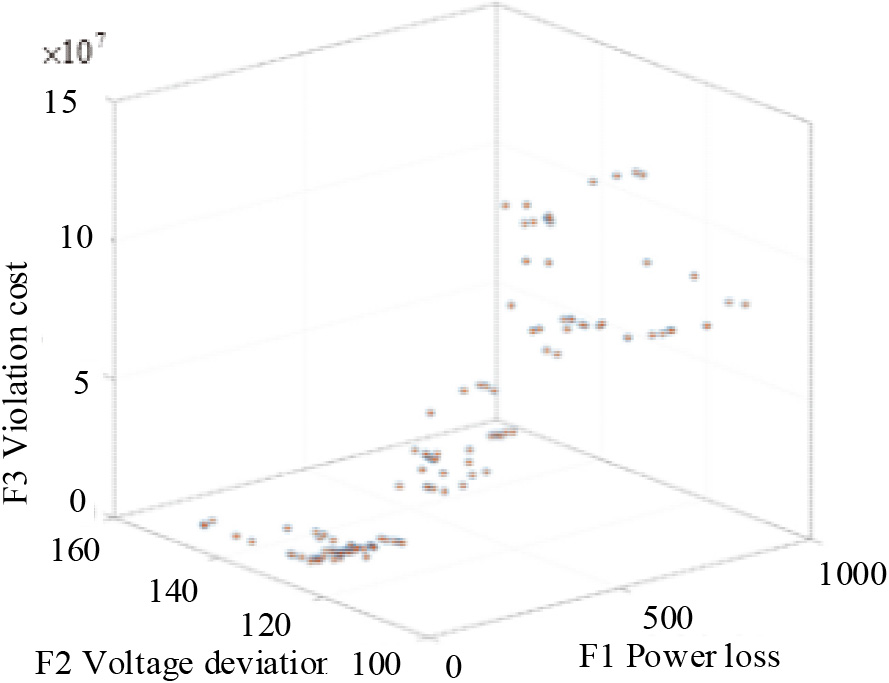
Optimization results of the second scenario.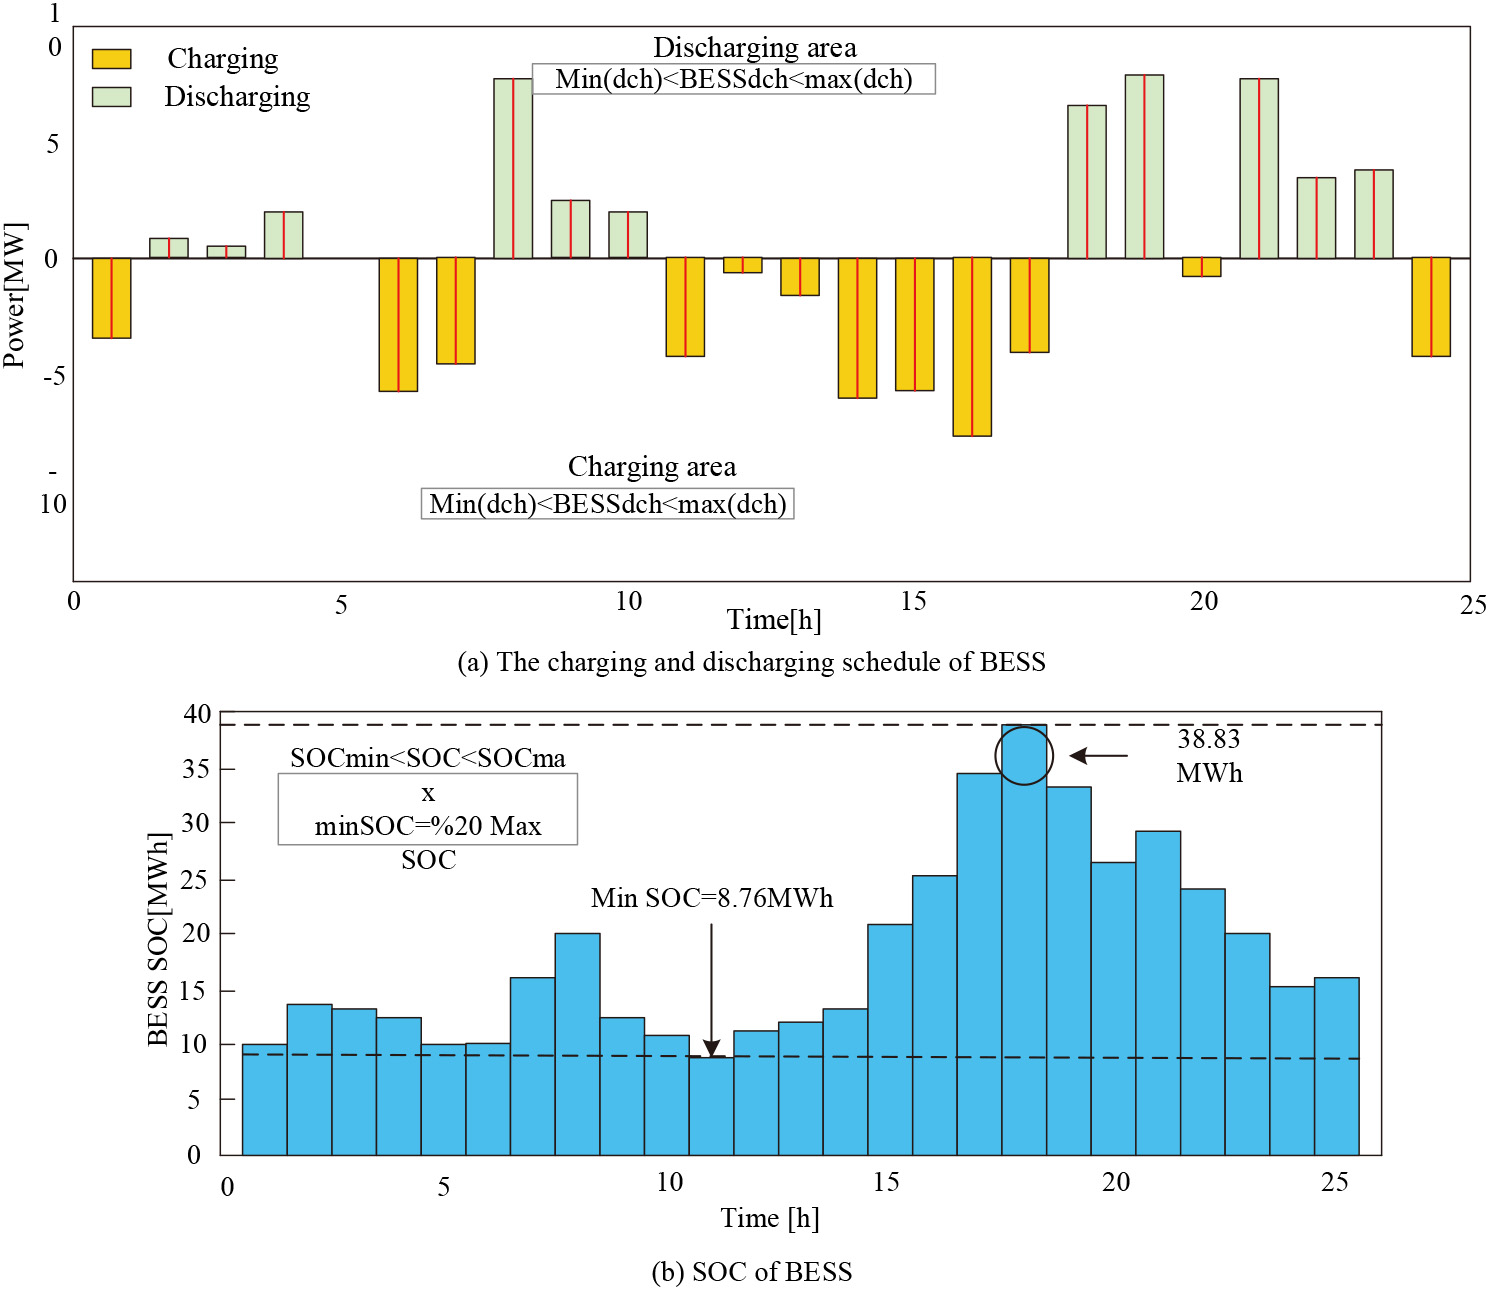
As shown in Fig. 5, Fig. 5a reflects the charging and discharging schedule of BESS, and Fig. 5b shows the SOC of BESS. It can be seen that in this scenario, the charging and discharging schedule of the system is slightly more uniform than that in scenario 1, but the overall situation is not good. The energy value of the discharge area is floating between 0–10, while the energy value of the charging area is floating between 0–10. Therefore, the coincidence between the chargeable interval and the discharge interval is increased. There is no interval difference, but the overall fluctuation range is still large. However, compared with scenario 1, the optimized system in this scenario can better guarantee the service life of the battery. At the same time, the optimized SOC value is 38.83 mwh, which is smaller than that of scenario 1, indicating that the optimization performance of this scenario is more superior.
The last scenario is to optimize the centralized BSS, wind power station, SVR and CB together, and observe the influence of these equipment combinations on the distribution network parameters. Figures 6 and 7 show the optimization and simulation results of this scenario. The performance of different scenarios will be compared below.
The optimum Pareto frontier of the third scenario.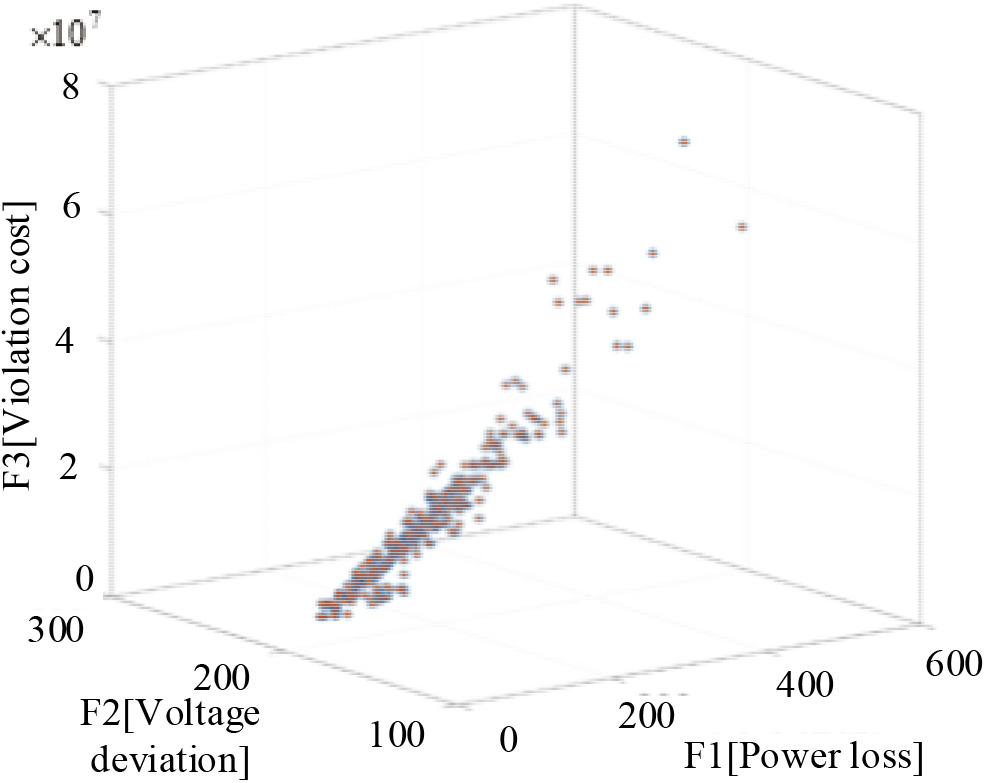
Optimization results of the third scenario.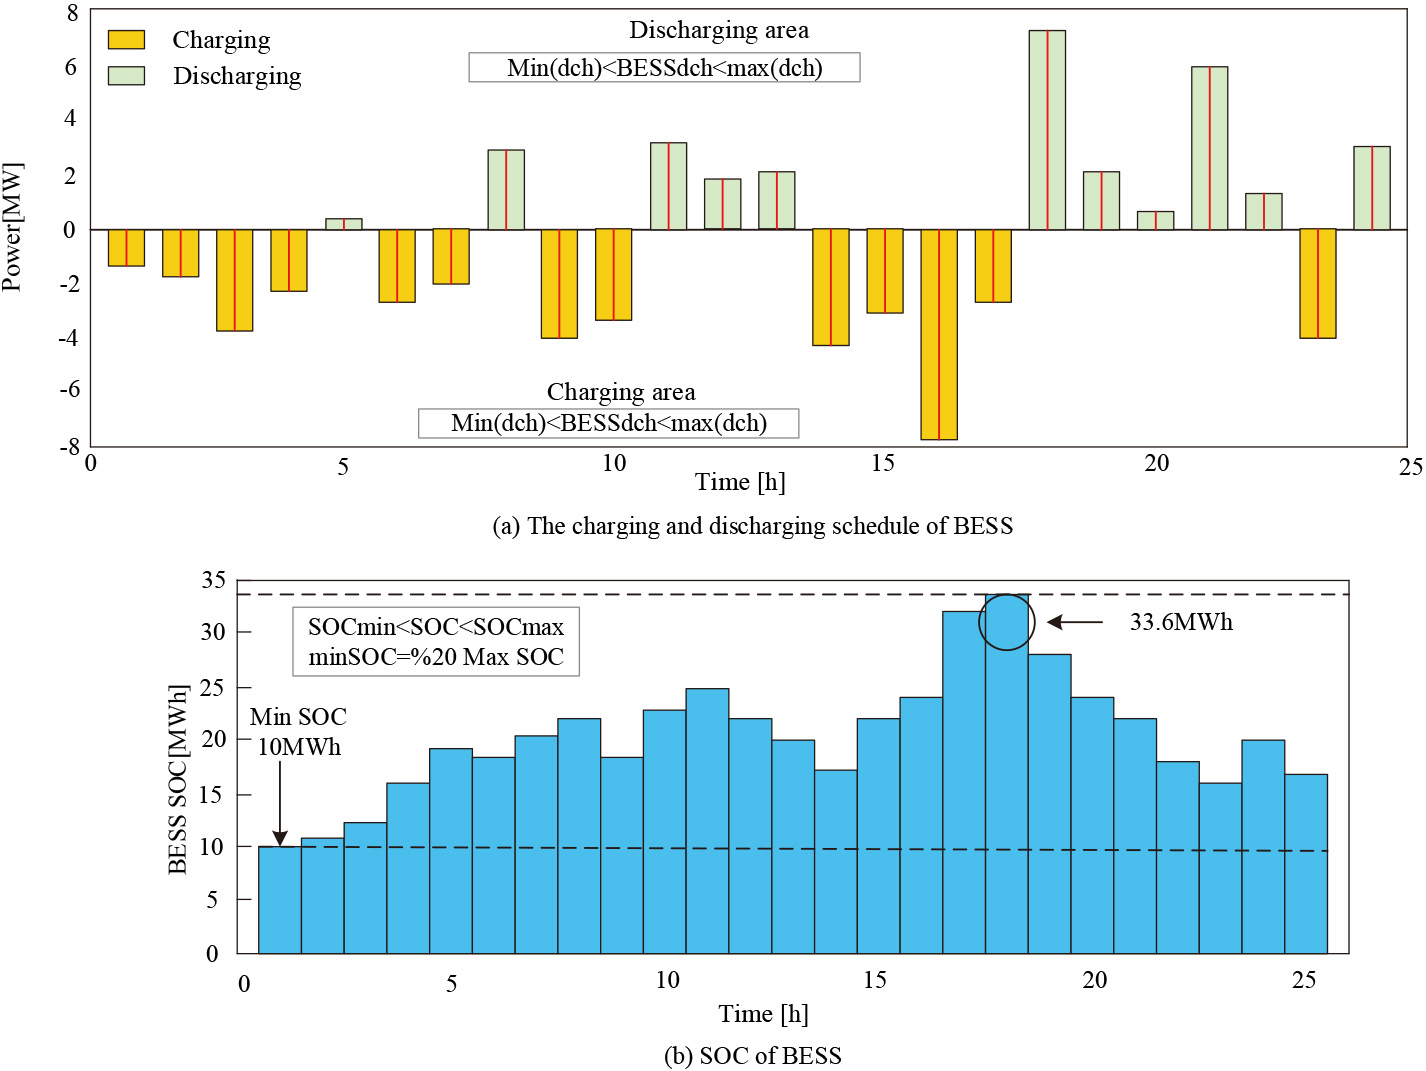
As shown in Fig. 7, Fig. 7a reflects the charging and discharging schedule of the BESS, and Fig. 7b shows the SOC of the BESS. It can be seen that in this scenario, the charging and discharging scheduling of the system is more uniform than that of scenario 1 and scenario 2, and the distribution effect of the charging and discharging states is better. The energy value of the discharge area fluctuates between 0–8, while the energy value of the charging area fluctuates between 0–8. Therefore, the coincidence between the chargeable interval and the discharge interval is increased, the interval difference problem is solved, and the overall fluctuation range is further reduced, the minimum interval among the three scenarios is optimized. It can be seen that compared with scenario 1 and scenario 2, the optimized system in this scenario can help the battery stabilize the load and extend the trial life. At the same time, the optimized SOC value is 33.60 mwh, which is the lowest SOC value among the three scenarios, indicating that the optimized performance of this scenario is the best among the three scenarios.
According to the foregoing, different optimization solutions and network behaviors can be obtained by applying different configurations. The following part will analyze the optimization results from the technical parameters of the network, optimization scale, location and integrated equipment operation.
Experimental results show that the following points can be obtained:
Before optimization, the benchmark case, that is, the typical power shortage scenario, is simulated. The results obtained in the benchmark scenario in this paper are as follows: the smallest voltage is 0.835 p.u, and the distribution network’s total loss is 148.79 MW. In this case, the network operation will inevitably tend to power off and load reduction, resulting in the damage of power system equipment or the reduction of service life and leading to power supply shortage of end Optimization results of multi-objective and multi-configuration control
users. This is deemed as totally dependent on upstream power. The daily power consumption is 1696.7 MWh, as shown in Table 1.
In the first scenario, using the proposed technology, only the centralized wind power station and BSS are optimally configured. Table 1, Figs 2 and 3 show the simulation results, in which the optimum wind turbines are 141 sets. The power loss is saved by 46%, and the voltage deviation is reduced by 60%. The smallest voltage is increased by 0.9 p.u. However, in this scenario, the largest capacity of BSS is set to exceed 48 MWh, which requires a large economic investment. Therefore, the first scenario tends to go against the power flow.
In the second scenario, after the simultaneous optimization of SVR, BSS and wind power station, the smallest voltage of the network rises, and the dependence on upstream power is reduced by 60%. The total power loss has not changed.
In the last scenario, all devices are considered simultaneously in the control optimization deployment. In this scenario, the smallest voltage of the system is 0.901 MW and the total power loss is 94 MW. At the same time, the optimum SVRs are 8 sets and the optimum injected reactive power of CB is 4.84 Mvar. The optimum number of wind turbines is 120. The smallest optimum capacity of BSS is 33.66 MWh, and the daily dependence on the main power grid is reduced to 43.46.
In addition to verifying the influence of SVR, CB, wind power and BBS through simulation results, this paper also develops a new index for the evaluation of the influence of its switching operation by SVR in relevant scenarios. Table 2 gives the DSSI values obtained in all relevant scenarios, and it can be seen that the third scenario has the best DSSI index.
Daily switching indicators of SVR in various scenarios
It can be seen that the daily SVR switching operation and daily SVR switching indicator indicators of scenario No. 1 cannot be reflected; The daily SVR switching operation value of scenario 2 is 706, and the corresponding daily SVR switching indicator value is 0.1149; The daily SVR switching operation value of scenario 2 is 485, which is less than the daily SVR switching operation value of scenario 2, while the corresponding daily SVR switching indicator value is 0.0789, which is less than the daily SVR switching indicator value of scenario 2. It can be seen that the daily SVR switching indicator value in scenario 3 is more advantageous.
In summary, through the comparative analysis of triple optimization scenarios, it is found that a control optimization method based on multi-objective genetic algorithm is proposed by using the optimal control method of reactive power compensator, voltage regulator, storage system and intermittent wind power. Simulation experiments are carried out to implement the proposed optimization method by implementing multiple different configurations by inserting or removing different devices in the real power distribution network. Meanwhile, the effectiveness of each configuration is analyzed in detail, and the output results demonstrate the superiority of the proposed methodology. The proposed method can be applied to control optimization algorithms related to distribution networks.
In this paper, the optimum control method of intermittent wind power, reactive power compensator, storage system and voltage regulator are developed. A control optimization method on the basis of MOG algorithm is put forward. By switching the taps on the winding of auto-transformer, the voltage adjustment within the determined range of switching operation can be realized. An improved NR power flow method is put forward, which uses line current constraint to ensure that the current will not approach the heating limit. In the experiment, through the comparative analysis of the three scenarios, it can be seen that the daily SVR switching operation and the daily SVR switching index of the scene 1 cannot be reflected; the daily SVR switching operation value of the scene 2 is 706, which corresponds to the daily SVR switching index value. It is 0.1149; the SVR switching operation value of scenario 2 is 485, which is smaller than the SVR switching operation value of scenario 2, and the SVR switching index value of the corresponding day is 0.0789, which is smaller than the SVR switching index value of scenario 2. It can be seen that the daily SVR of scenario 3 is more advantageous to switch the indicator value. The simulation experiment realizes many different configurations by adding or removing different devices in the actual 162-bus distribution network for implementing the proposed optimization method. At the same time, the effectiveness of each configuration is analyzed in detail, and the output results prove the superiority of the proposed methodology. The proposed method can be applied to complex distribution networks. Although the current research can provide a theoretical basis for the control scheme of wind turbine which has the ability to handle complex configuration and economic effects, the control scheme is likely to be interfered by multiple external factors in the actual environment, and the results of the current research are still the results under the perfect environment. The scheme optimization under multiple external interference is the main research direction in the future.
Footnotes
Funding
The research is supported by: Hunan Natural Science Foundation Project (No. 2020JJ4558); Hunan Education Department Youth Project (No. 21B0690); Hunan Science and Technology Department Science and Technology Project (No. 2016TP1023); Shaoyang Science and Technology Plan Project (No. 2021GZ039).