
Abstract
For the power generation prediction of traditional hydropower stations, most of them only use time series prediction and neglect to study the spatial topological relationship of hydropower stations in the river basin, so that it is difficult to fully explore the characteristic relationship of space power stations. In this paper, a research method for power generation prediction of hydropower in river basin hydropower stations based on multi-head attention map convolutional neural network is proposed. This method establishes a first-level node neighborhood feature map based on the spatial geographic distribution information of hydropower stations in the basin, and uses the method of graph convolution to carry out node feature mining and feature learning, so as to transform the power generation capacity evaluation problem of the hydropower station in the basin into the node prediction problem in the graph, which is different from the global normalization rule. the multi-head attention mechanism introduced further improves the information aggregation quality of the graph node, and uses the historical temperature, power generation, electricity price, unit status and other data of each hydropower station in the basin for training. The reasoning results show that the proposed method achieves higher accuracy than other schemes, and the power prediction method is conducive to the formulation of power plans of hydropower stations in the basin, and can also play a positive role in guiding the site selection of hydropower plants.
Keywords
Introduction
Hydropower has the characteristics of small power generation cost, high unit output efficiency and easy adjustment, and with the national medium- and long-term goals of carbon peak and carbon neutrality, hydropower substitution and efficient mining of hydropower have become the most realistic options, screening out the important factors affecting the power generation of hydropower stations in the basin, such as the average precipitation in the area where the power stations are located, market-oriented electricity prices, power generation plans of related power stations, etc., Specifically, in optimizing the direction of dispatching operation, it has the role of guiding power grid dispatching, predicting power generation in advance, reasonably arranging power load, and ensuring the stable operation of the power grid. In the direction of energy planning and decision-making support, the power generation plan and energy policy of the hydropower station can be formulated, the reasonable power generation capacity and power generation period can be determined, and the economic and social benefits of the hydropower station can be further improved. In the direction of risk assessment and safety early warning, potential safety hazards can be found, corresponding measures can be taken to ensure the safe operation of hydropower stations, potential safety hazards can be found, and corresponding measures can be taken to ensure the safe operation of hydropower stations. In the direction of energy conservation, emission reduction and environmental protection, which can reduce the dependence on fossil fuels, reduce the emission of greenhouse gases such as carbon dioxide, and protect the environment. the overall power generation prediction research of hydropower stations in the basin is helpful to coordinate the regional power generation plan. It plays an important role in promoting regional balanced energy and consumption systems. As far as traditional methods are concerned, such as ARIMA [1] time series model, least squares prediction, Kalman [2] state transition prediction, etc., which use relevant historical data for prediction, but it has high requirements for data input, it is difficult to deeply reflect the nonlinear factors of the original data, support vector machine [3] and radial basis neural network can deeply characterize the complex nonlinearity of the input data, but it usually only has two to three layers of neuron network structure, and the generalization of the model is still a little improved. Huang et al. [4] combined GNN with LSTM and applied it to the power generation prediction task, GNN is applied to capture spatiotemporal correlations. Zhou et al. [5] used the road network to form a graph structure and used the recurrent neural network to learn the spatiotemporal features at the same time, and the model effect was improved by 3% to 6% compared with the contrast method, which proved the usefulness of spatial features for traffic flow prediction tasks. Gan et al. used GCN to capture the spatial characteristics of the road network and compare it with the existing benchmark model to verify the effectiveness of using GCN. However, GCN does not allow different weights to be assigned to different nodes in the neighbor, which limits the spatial feature extraction capability of the model. As a result, the graph neural network of the multi-head attention mechanism came into being. The graph neural network of the multi-head attention mechanism can obtain different weights according to the characteristics of neighboring nodes, so as to change the aggregation method of information and improve the expression ability of the model for space. At the same time, GCN [6] is only suitable for processing undirected graphs, and the graph processed by the graph neural network of the multi-head attention mechanism does not need to be undirected. The feature information extraction mechanism of the graph neural network with the multi-head attention mechanism has a high correlation with the node information with the same edge, which is very different from other kinds of graph neural networks, and the training time can be shortened. Firstly, by modeling the spatial topology of the hydroelectric power station [7] in the study area, forming a collection of edges and nodes, collecting historical historical temperature, power generation, electricity price, unit health and other dimensions, and using the graph neural network with multi-head [8] attention mechanism for historical data training and reasoning, the results show that the prediction accuracy of the model has been improved compared with other methods, which can improve the prediction accuracy of power generation in the basin power station.
System overview
In order to predict the power generation of regional distributed hydropower stations, this paper uses the graph convolutional neural network method with multi-head attention to carry out spatiotemporal prediction, and analyzes the historical collected data of the research area in the time dimension and spatial dimension as a stream, the multi-head attention mechanism [9] can mines the context of each dimension information better, and the spark parallel processing mechanism also accelerates the processing speed of the model. Due to the weak time-varying nature of electricity prices, average temperature, and health indicators, batch processing methods [10, 11] that take values once and calculate separately can be adopted. one-dimensional convolution scheme is used for power sequence. the calculation results are embedded in the spatiotemporal prediction platform of multi-head attention, and the whole process is shown in Fig. 1 above.
Block diagram of the power generation prediction architecture.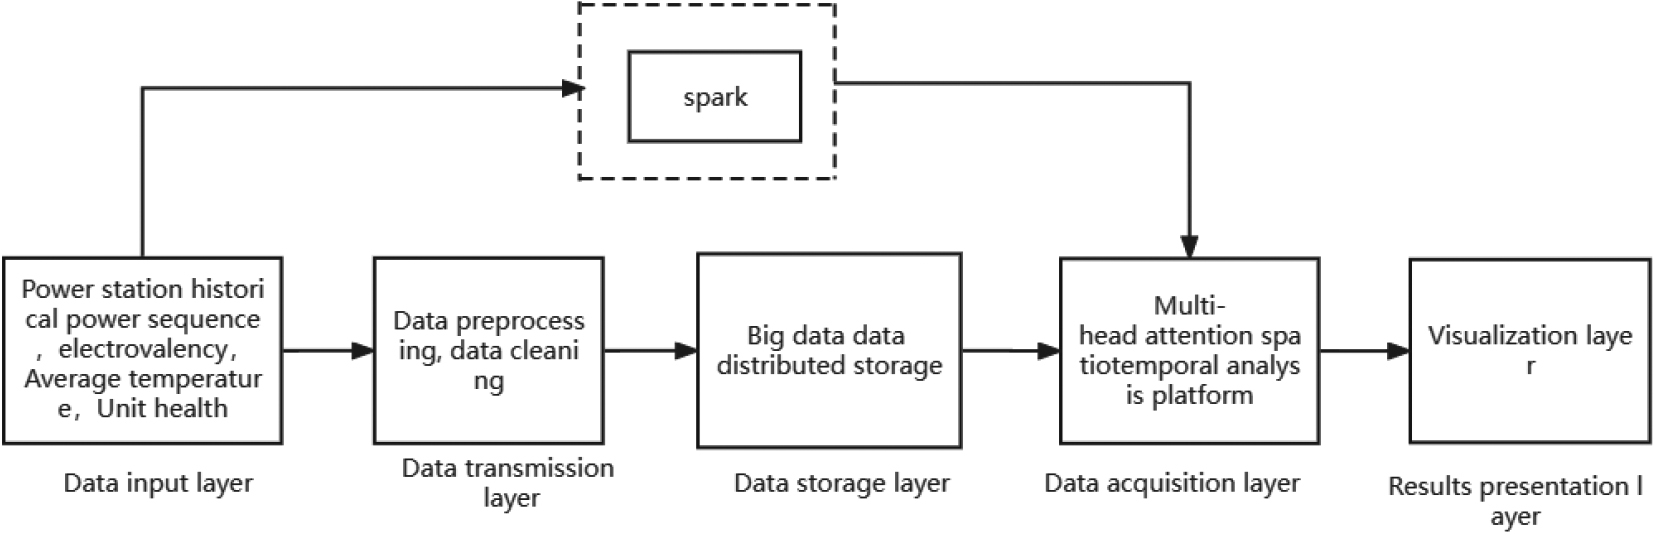
Spatial diagram of power generation topology of hydropower station.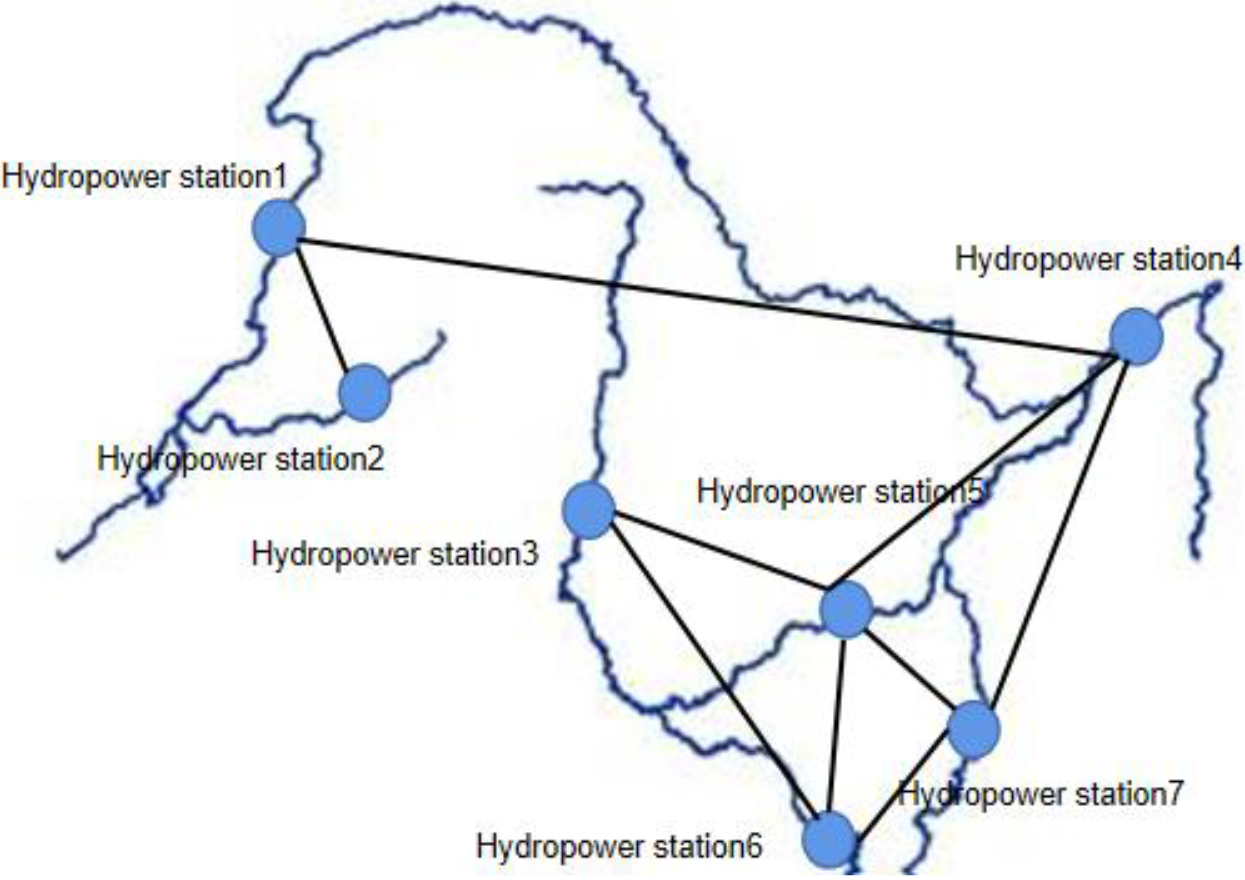
Modeling of diagram structure
For the basin space power station node for abstract expression [12, 13, 14], it should consider the spatial accessibility and difficulty of the power station node, spatial accessibility mainly considers the water connectivity of the power station node, the difficulty is mainly based on the number of cross-nodes connected between the power station node and the power station node, this paper only considers the first-level node of the neighboring power station node to establish a topological relationship, here, we define the edge set, the node set is E, V, then the topology map structure G
where
Time series module
This refers to the power sequence of each power station, due to its strong time-varying [16, 17, 18, 19, 20] characteristics, so it first combines the convolution operation for feature extraction. The historical time step power sequence S of each node contains the historical power generation power information of each power station combines with one-dimensional convolution for aggregation processing, which has the advantages of simple calculation and does not rely on the output of the previous node,and it also does not require complex iteration, input time series S, convolution kernel K, the principle and formula of the one-dimensional convolution process are as follows:
Schematic diagram of one-dimensional convolution process.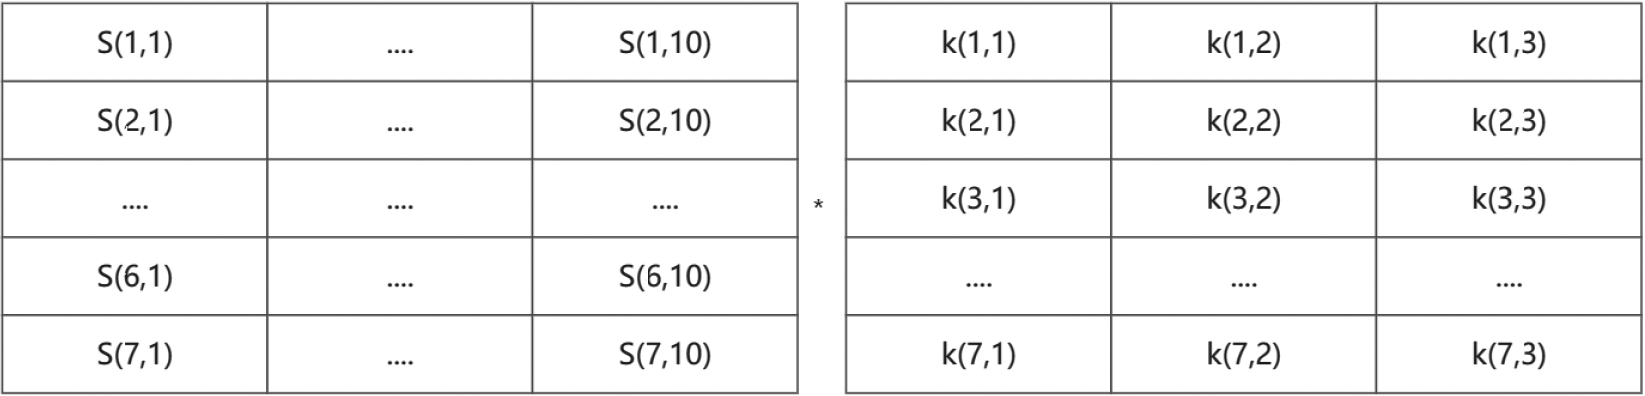
where
In the graph structure, the characteristics of each node are defined by combining the feature information of their own nodes and the feature information of the nodes connected to it, the multi-head attention graph neural network adopts a unique messaging paradigm, which introduces the attention mechanism to the graph, when updating the feature vector of the node, it firstly calculate the attention score of all neighbors [22, 23, 24, 25], and then multiply this attention score by the characteristics of the corresponding neighbors, and finally take the form of addition as the output representation of the final node. The diagram of the graph neural network flow of multi-head attention is as follows.
Flow chart of multihead attention map convolutional neural network.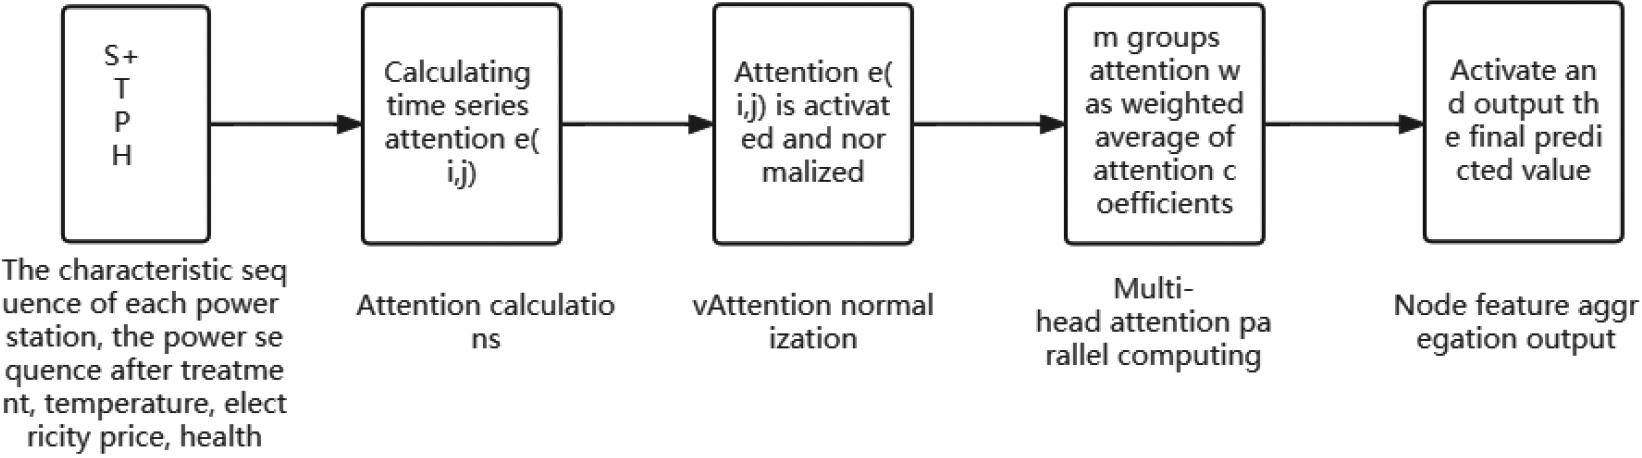
Suppose that the multi-headed attention neural network inputs [26] where the set
where
The attention coefficient is then normalized using the softmax function [27], as in the normalization operation in Fig. 4, as shown below:
where
where
In order to enhance the feature extraction ability of the model, this paper draws on the multi-head attention mechanism in the Transformer to obtain the global and local connection in one step through parallel computing, which can reduce the global variance [28, 29, 30], and improve the convergence accuracy. the process is as follows:
where
Data sources
Schematic diagram of power station data device.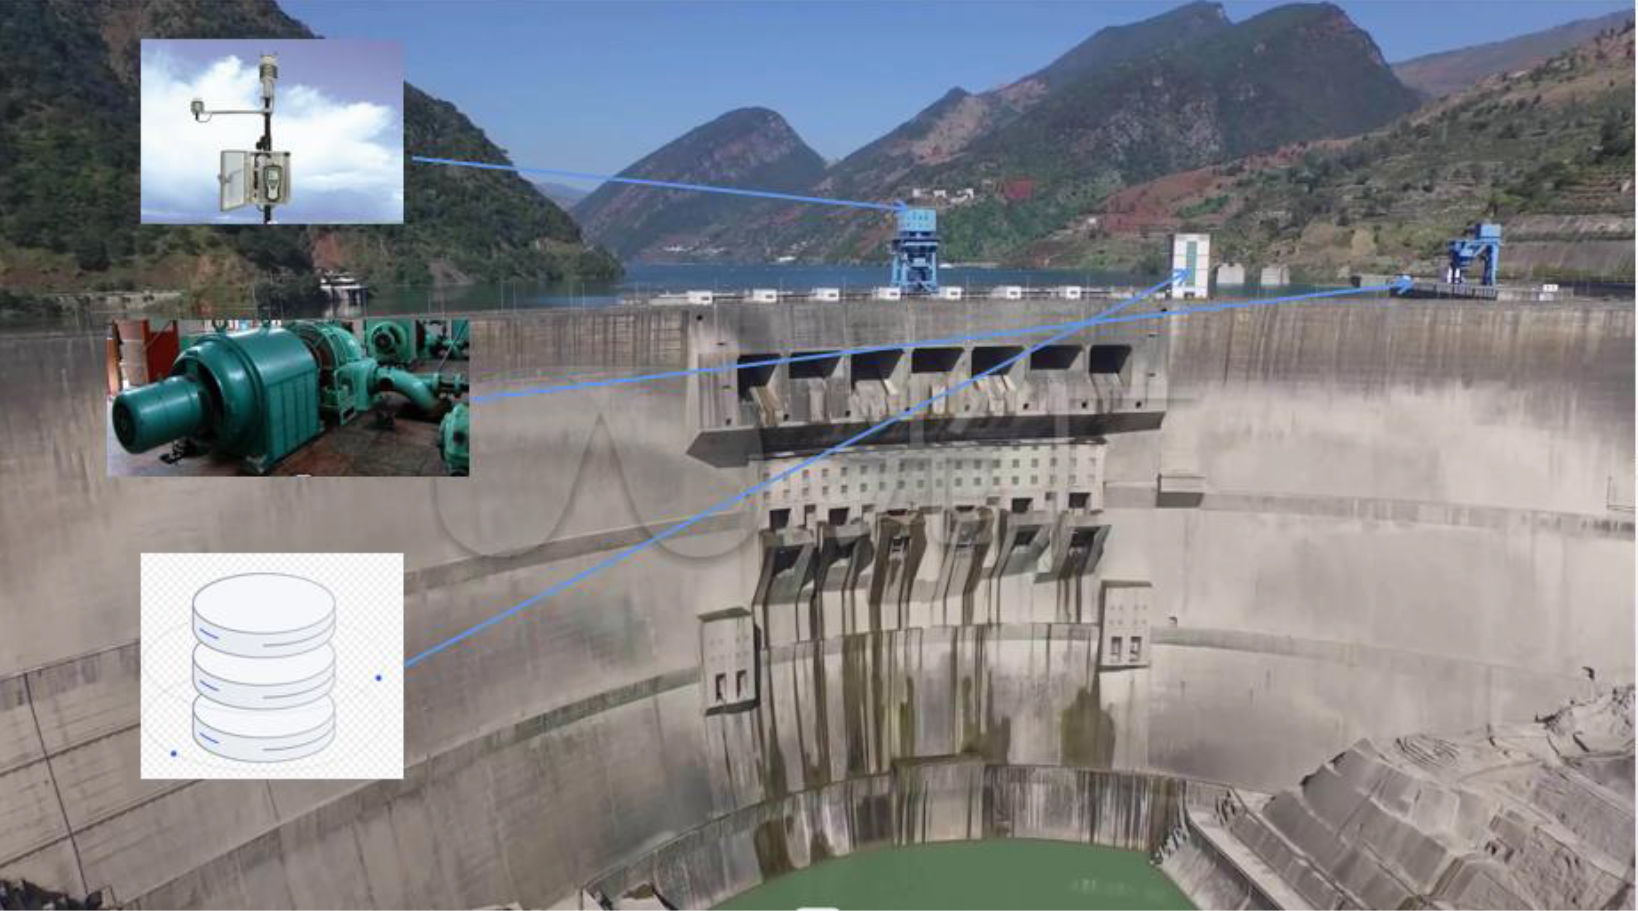
In this paper, 7 associated hydropower stations are selected in the Sichuan River Basin for data analysis, and the historical temperature, power generation, electricity price, unit status dimension data of the research hydropower station are obtained, the sampling time of the power generation is 1 minute time interval, the time window is 20 m, the temperature, electricity price, and unit status are selected from the data of the first 4 time steps of the power station to be studied, due to the weak time-varying nature of the three dimensions of temperature, electricity price and unit status, the time window is selected as 10 h, and the temperature and unit status data acquisition device is shown in Fig. 5 below. Generation power and electricity prices are obtained from a local time series database. Scores are obtained based on expert ratings and historical conservation [31, 32, 33, 34] records. In particular, the unit status data is determined by multi-expert evaluation mode, with a scoring range of 0–100, The status of the unit is related to many factors, such as fuel supply, operating load, operating temperature, maintenance and maintenance, external environmental factors, in this expert evaluation, the characteristics of large correlation and small collinearity are selected for evaluation, and the three quantitative indicators of operating load, operating temperature and maintenance in the unit history are selected for comprehensive evaluation. some scoring results are shown in Table 1 above.
Status health score table of each power station
Since the unit scoring status data is offline transient collection, it can only partially reflect the real state of the unit at the time of scoring evaluation [35, 36, 37, 38], but the historical unit status is unknown, so the method of linear multivariate fitting of the historical traceability of the two scores is used to obtain the historical unit status scoring data, and the dimensions of the two scores are based on the real operation status of each power station unit and the historical unit operation and maintenance record table, Comprehensively considering operation time and operation time [39], and evaluating the operation status of the first two time steps in turn. The counter-presentation intent is as follows.
Inversion time fitting curve of unit state evaluation.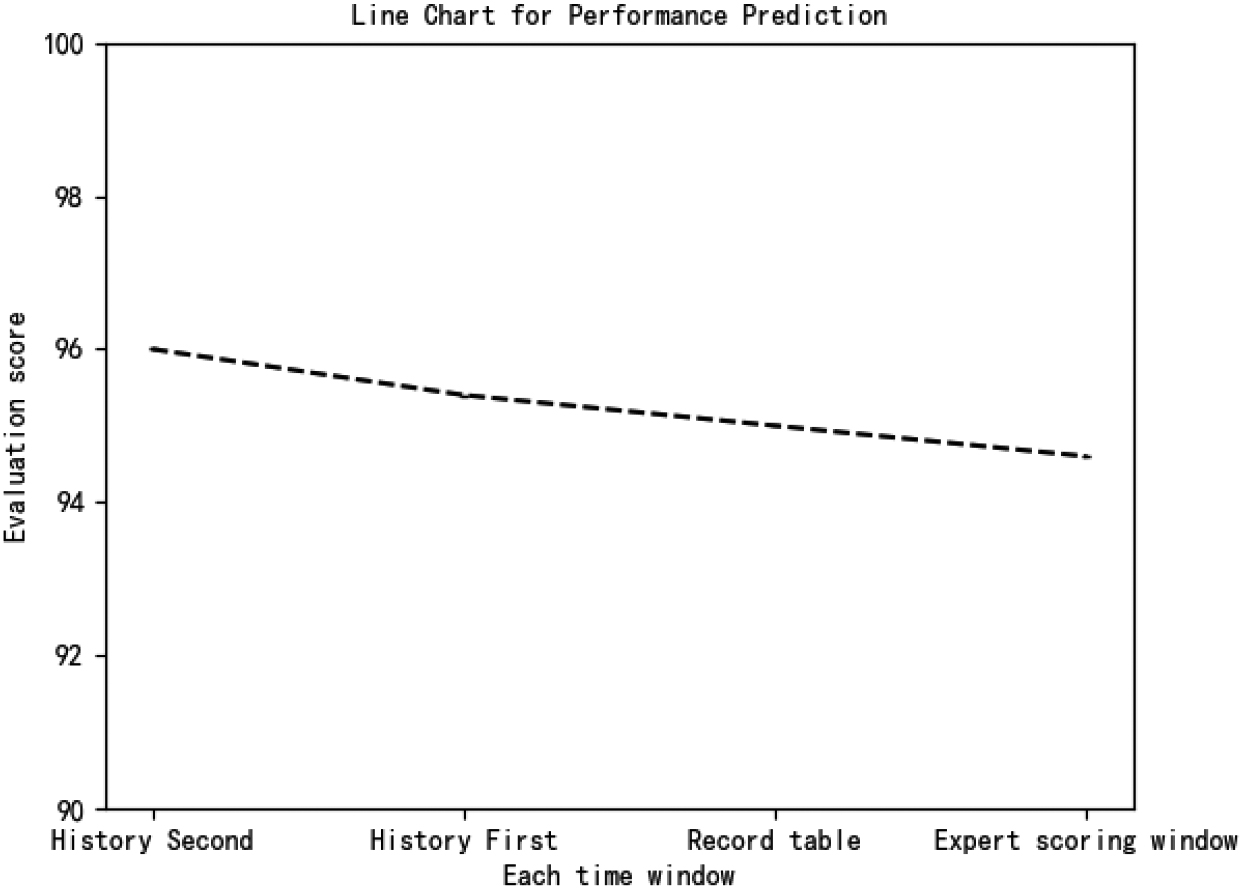
Power generation, temperature, electricity price and unit status dimension are different, which can cause data deformation and rise if they process and calculate at the same time, resulting in distortion effect, so first of all dimensions of data dimensionality normalize processing operation, using the maximum-minimum scheme to each dimension of data for protocol processing, set k
In terms of time period, the training set and test set are divided according to the time step and time window determined in 4.1, and the time range of the training set and test set is 60 days.
If the number of training samples is
Batchsize and head numbers ablation experiment.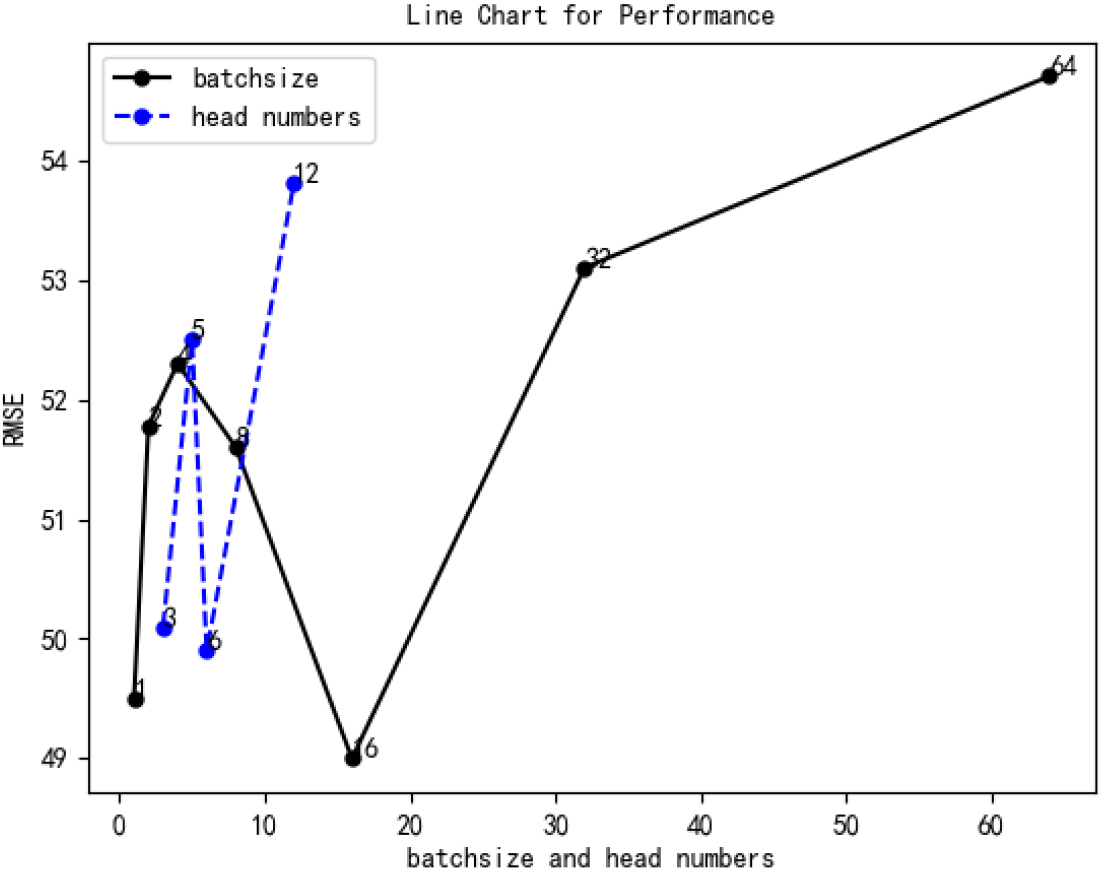
The parameter selection of the model: the power time series convolution step is 3, the anchor point convolution is used to calculate in the unfilled mode, the batchsize takes the set of {2, 8, 16, 32, 64}, the epoch is 800, the learning rate is 0.005, the number of heads in the multi-head attention mechanism is determined by the grid experimental method, and the set of the number of attention heads is in set {3, 5, 6, 12}. For in-depth training and inference on the RTX2060 platform, the experimental trend distribution of batchsize and attention head number is as follows.
SVR power prediction curve.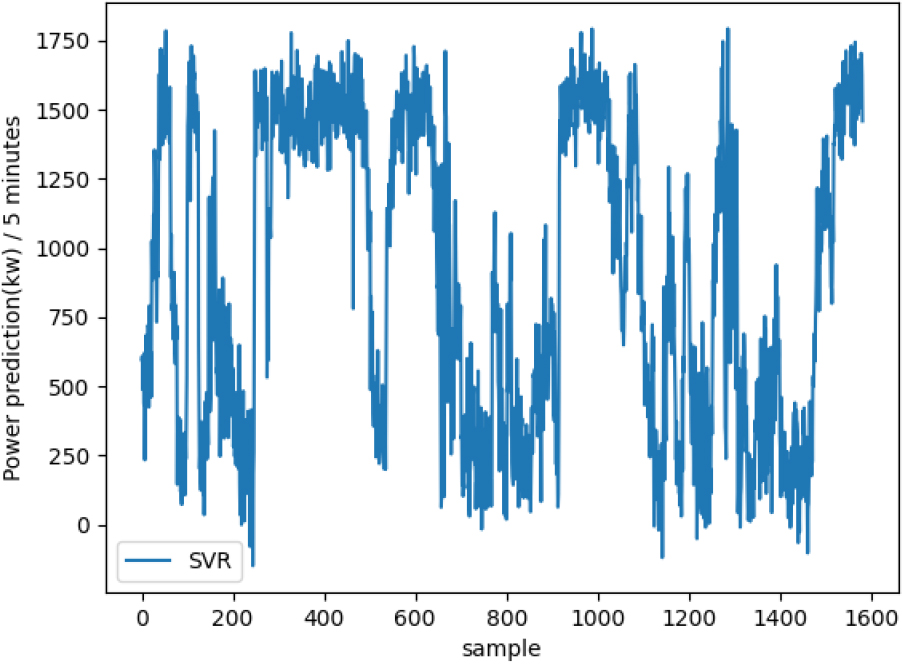
LSTM power prediction curve.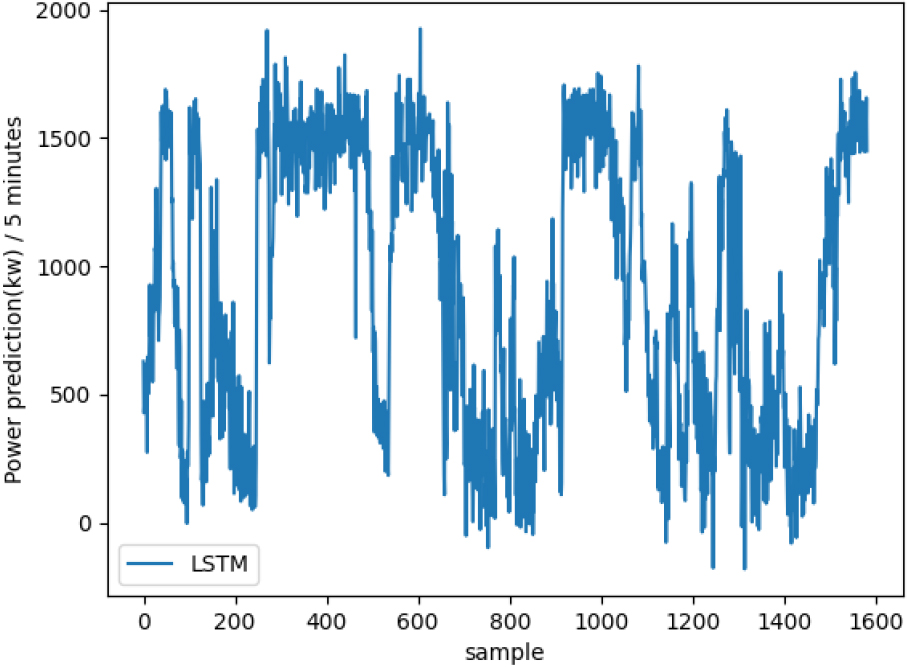
CNN power prediction curve.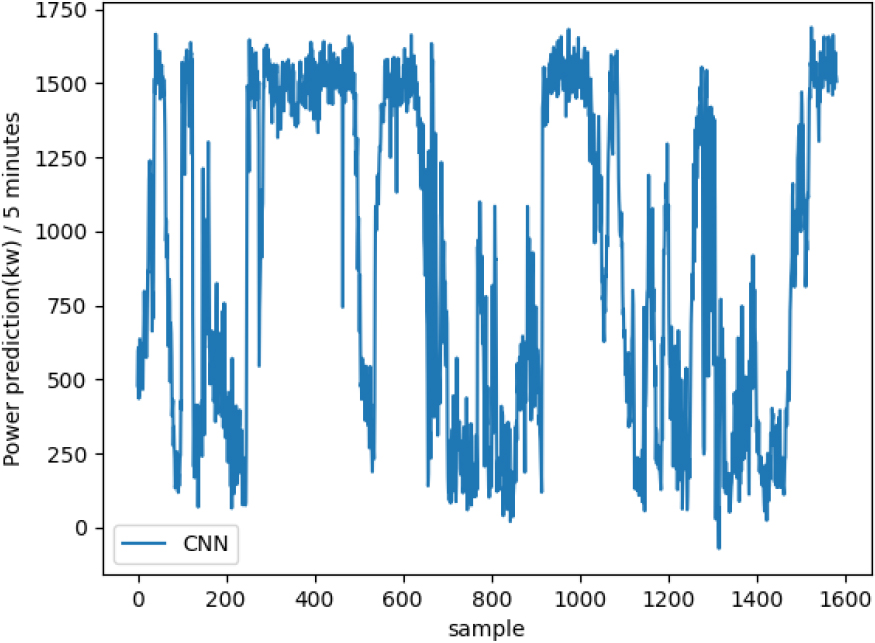
GAT power prediction curve.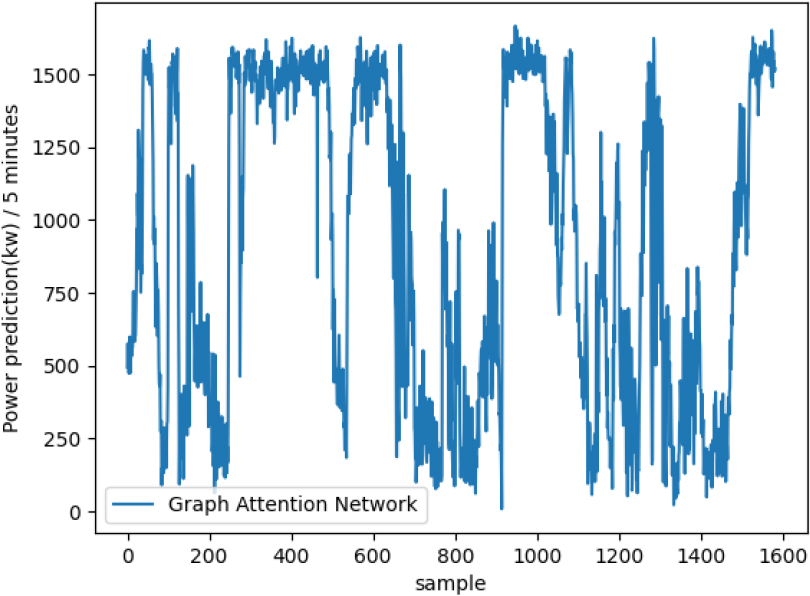
Multi-head attention graph convolutionl neural network power prediction curve.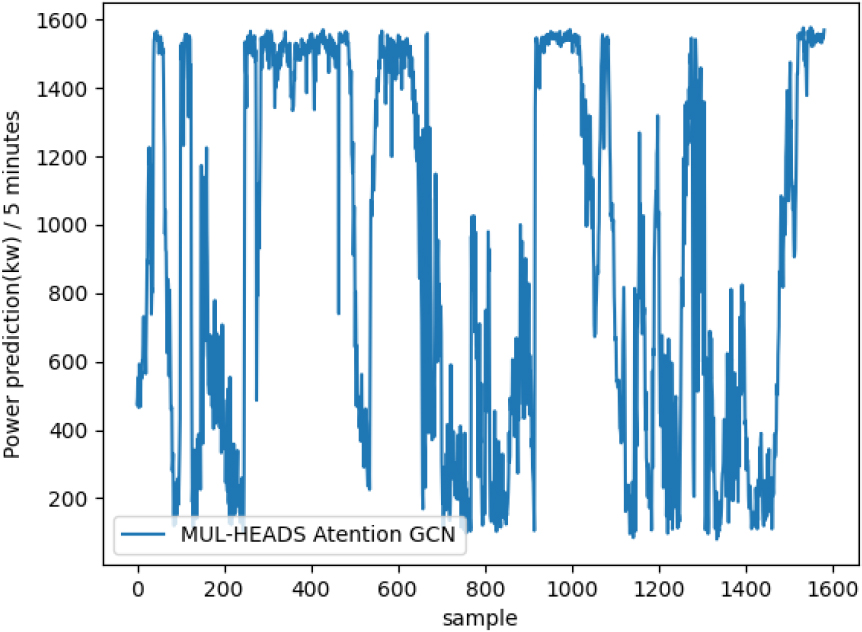
Autoregressive power prediction curve.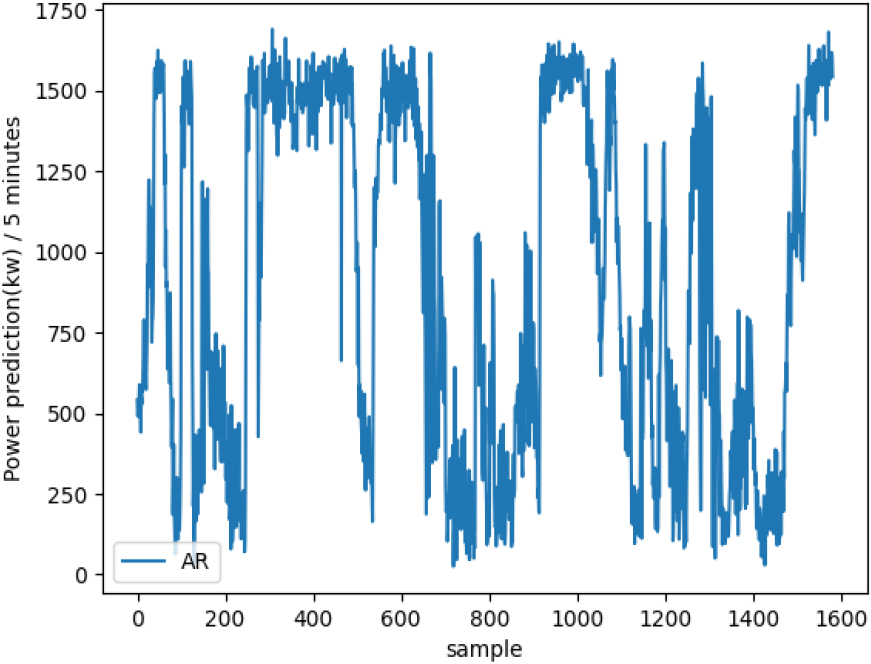
As can be seen from Fig. 7 above, the root mean square error reaches the optimal time when the hyperparameter batchsize and head numbers are 16 and 6 respectively, based on this, the specific value of the hyperparameter can be determined.
AR (autoregression), lag order p take 11, SVR (support vector regression), its kernel function parameter coefficient g take 0.5, penalty factor coefficient take 0.8, LSTM (long short-term memory model), input_size, batch_size, time_step values are 7,100,10, CNN (convolutional neural network), convolution kernel size is 1*3 dimensional convolution, GAT (graph attention neural network), the number of heads is 8, LeakyReLU as the activation function, the covariate version of GCN, cached is True, and the power generation power of the 3 nodes of the power station in the next 5 minutes was predicted, and the prediction curves of the experimental group and the control group for the 3 nodes of the power station were as follows.
It can be seen from Figs 8–14 above that the power data of the power station has strong nonlinearity, and the graph attention neural network with the multi-head attention mechanism has a better fitting effect than the control group, whether in the peak or trough.
In order to quantitatively test the effect of each model, the training set is used to train each model, and the root mean square error [43] and relative error of each model are evaluated on the test set, and the control group input is the splicing of long sequence data of each dimension. The comparison results are shown in Table 2 below.
Error test table of each model
Power prediction curve of convolutional neural network.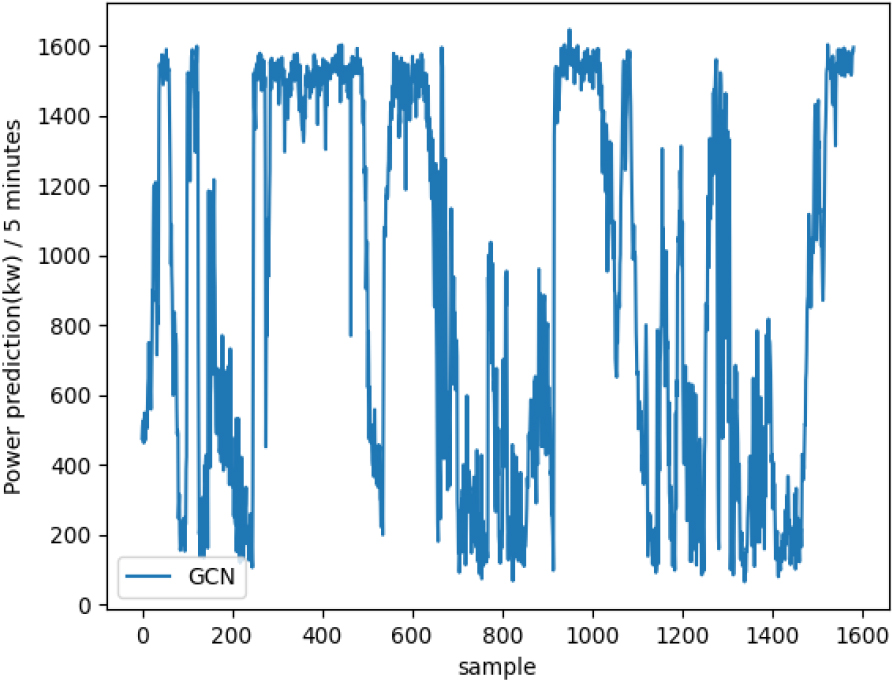
It can be seen from Table 2, AR model, whether RMSE or MAE, is the worst comparison method, which only regresses its own historical dependent data, which has no good effect on this time series type data, and the SVR model prediction accuracy has been improved, but no matter what type of data it is, it uses the kernel for the largest interval spatial mapping. LSTM model has long short-term memory module capabilities,which can capture a longer period of the above dependence, therefore, compared with relative SVR model in convergence accuracy, it has a certain improvement. CNN convolutional neural network, with variable receptive fields, The feature association of multi-factor time series can be extracted, and after multi-layer neural network mapping and feature activation, it also produces good results, compared with LSTM, the convergence accuracy is improved. RMSE decreased by 3.1, MAE decreased by 1.1, the graph attention network migrated the idea of attention variation weight to graph computing, which divide and conquer neighborhood nodes and then weighted aggregation, from the experimental results, convergence accuracy compared with CNN model and other models have improved, compared with CNN model, RMSE decreased by 0.7, MAE decreased by 1.5, for the experimental group model MUL-HEADS GCN [44, 45, 46, 47], the number of attention heads was increased on the basis of the GAT model, Drawing on the idea of model inheritance, the use of independent attention heads makes the overall model generalization higher, the error is lower, and the usability and accuracy of the model are enhanced, and in terms of model error, compared with the GAT model, RMSE and MAE are reduced by 4.4 and 1.5 respectively. The GCN model also achieves good results, but the model lacks the blessing of attention mechanism and lacks correlation depth for feature mining of context sequence data.
In order to reduce the influence of variance in orphan data, this paper introduces the self-attention mechanism under the traditional graph convolutional neural network architecture, integrating the multi-head attention factor, taking into account of the spatial topological factors of the hydropower station in the river basin on the basis of traditional multi-dimensional time series prediction to form a spatiotemporal analysis base, which greatly improves and enriches the extraction of data feature distribution. Secondly, there are few considerations in the topology construction process in this paper, and only abstract associations are made for the primary connection, in fact, hydropower stations may not be just “binary trees”, but the topology construction of hydropower stations in complex spatial basins is the next way forward.
Conclusion
In order to solve the problem that the power generation prediction of traditional hydropower stations mostly only uses time series prediction and neglects to study the spatial topological relationship of each hydropower station in the river basin. In this paper, a research method for power generation prediction of hydropower in the river basin based on multi-head attention map convolutional neural network is proposed, which uses the historical data of various dimensions of the power station for experimental analysis and comparison experiments with the control group model, For the traditional autoregressive time series prediction method, because only consider its own trend change and ignore the contribution of covariates, its error in the control group is maintained at a high level, such as SVR [48], LSTM, CNN, AR algorithm, for the GCN, CAT, MUL-HEADS CAT [49] algorithm using covariate multi-feature attributes, its experimental error is greatly improved, among which the experimental error of the MUL-HEADS CAT algorithm using multi-head attention [50] is the lowest. which further confirms the effectiveness of the proposed method, but there are still problems such as insufficient experimental comparison, which is the direction of further research in the future.