
Abstract
The detection and handling of data leakages is becoming a critical issue for organizations. To this end, data leakage solutions are usually employed by organizations to monitor network traffic and the use of portable storage devices. However, these solutions often produce a large number of alerts, whose analysis is time-consuming and costly for organizations. To effectively handle leakage incidents, organizations should be able to focus on the most severe incidents. Therefore, alerts need to be analyzed and prioritized with respect to their severity. This work presents a novel approach for the quantification of data leakages based on their severity. The approach quantifies the severity of leakages with respect to the amount and sensitivity of the leaked information as well as the ability to re-identify the data subjects of the leaked information. To specify and reason on data sensitivity in an application domain, we propose a data model representing the knowledge within the domain. We validate our quantification approach by analyzing data leakages within a healthcare environment. Moreover, we demonstrate that the data model allows for a more accurate characterization of data sensitivity while reducing the efforts for its specification.
Keywords
Introduction
In the recent years data breaches are becoming an increasingly major issue for organizations. This is demonstrated, on the one hand, by the increasing number of data breaches reported by public and private organizations. For instance, a study from Ponemon Institute in 2012 showed that 94% of US hospitals suffered serious data breaches [37]. On the other hand, data breaches have a serious impact on organizations. According to a 2014 report by Ponemon Institute and IBM [38], data breaches cost organizations $3.5 million dollars on average.
The main cause of data breaches is that IT systems often implement inadequate measures that allow users to access sensitive data, which they are not authorized to access. The problem is that it may not be always possible to specify fine-grained access control policies to protect sensitive data. For example, access control policies in hospitals often do not pose restrictions on the amount of health records that doctors can access. Moreover, access to information should not be restricted under certain circumstances. For instance, doctors should be able to access patient records to face an emergency. Typically, this is addressed using the break-the-glass protocol [2,6], which allows users to bypass security mechanisms, thus leading to potential data misuse.
Timely detection and management of data leakages is becoming a serious challenge for organizations [12]. According to the newly proposed EU data protection regulation, organizations are obliged to notify privacy authorities within 24 hours after the detection of a data breach [25]. To detect data leakages, organizations usually deploy data leakage detection (DLD) solutions. These solutions analyze the disclosed data and raise an alert when a leakage is detected. However, the number of alerts can be huge in certain situations, making their analysis and management difficult. For example, in hospitals a DLD solution might produce a large number of alerts due to the usage of the break-the-glass protocol. Before taking any action (e.g., notifying authorities), organizations typically evaluate a sample of the alerts manually. To effectively manage and mitigate the damage due to security incidents, organizations should be able to focus on the most severe incidents [47]. To this end, data leakages should be quantified based on their severity.
Data leakage quantification, however, is still an open problem. Many proposals [5,9,40] are founded on quantitative information flow. In particular, they quantify data leakages in terms of the number of “sensitive” bits which have been disclosed. Thereby, they do not consider the semantics of the leaked information in the assessment of data leakages. From our knowledge, only M-score [20] assesses the severity of data leakages on the basis of the semantics of the leaked information. In particular, M-score uses the amount and sensitivity of leaked information as well as an identifiability factor to measure the severity of leakages. The amount and sensitivity of leaked information characterize the “quantity” and “quality” aspects of the leakage respectively. These aspects are weighted with respect to an identifiability factor, which represents the ability to obtain the identity of the individual(s) to whom the leaked data refer. However, M-score requires defining the sensitivity for all pieces of information explicitly. Such a task is time-consuming and error-prone. More importantly, M-score only computes a coarse estimation of the sensitivity of leaked data, which may not reflect their actual sensitivity, and thus fails to accurately determine the severity of data leakages. A detailed study on the limitations of M-score approach is presented in Section 6.
This work is an extended and revised version of [48] and proposes a novel approach to quantify data leakages, which relieves security experts from the burden of defining sensitivity annotations for piece of data and accounts for the actual sensitivity of leaked information in the calculation of the severity of data leakages. In particular, we make the following contributions:
We propose a new metric that evaluates the severity of data leakages based on the amount and sensitivity of the leaked data as well as an identifiability factor; We propose a data model representing the knowledge of an application domain to specify and reason on the sensitivity of the information in the domain.
Our metric uses the same factors used by M-score. However, compared to M-score, our metric provides a more accurate discrimination of data leakages with respect to their severity. In addition, differently from M-score, our approach does not require specifying the sensitivity for every piece of information characterizing the application domain explicitly. The data model makes it possible to infer the sensitivity of every piece of information through a sensitivity propagation mechanism based on an initial partial sensitivity assignment.
We validate our approach by analyzing a sample scenario in the healthcare domain. Healthcare is indeed an interesting domain to investigate as a large amount of sensitive data, such as patient healthcare records, has to be protected. In particular, we evaluate the ability of our quantification approach to correctly assess the criticality of data leakages. To this end, we have built a data leakage dataset and asked a group of security experts to annotate every leakage in the dataset with its criticality. The severity measurements calculated using our metric have been analyzed against the evaluation provided by the security experts. Moreover, we study the impact of the data model in determining data sensitivity. In particular, we evaluate the effectiveness of the data model in relation with the effort required to compute data sensitivity.
The remainder of the paper is organized as follows. Next section motivates the need of approaches for data leakage quantification using a running example in the healthcare domain. Section 3 presents an overview of our approach. Section 4 defines the data model along with the machinery to reason on data sensitivity, and Section 5 describes how leaked information is mapped to the data model. Section 6 presents our metric for data leakage quantification along with a comparison with M-score. A discussion on the application of our approach and its potential benefits is presented in Section 7. An evaluation of the proposed metric and of the effectiveness of the data model is presented in Section 8. Finally, Section 9 discusses related work, and Section 10 concludes the paper by providing directions for future work.
Running example
Consider a local hospital where patients of a small region are treated. The hospital offers treatment for various diseases, ranging from flu to serious cases such as heart attack and infectious diseases. Patient information is stored in a central database at the hospital in the form of electronic health records (EHR). Doctors and nurses can only access EHR of the patients they treat. Typically, a patient is assigned to a doctor who is responsible for his treatment (primary care doctor). On the other hand, different nurses may assist a patient. However, in emergency situations doctors and nurses can bypass access control mechanisms by invoking the break-the-glass protocol. Therefore, they can have access to the EHRs of all patients. The hospital has also administrative personnel for financial management and to make appointments with patients. Moreover, the database is maintained by a database administrator.
To detect data leakages, the hospital employs a DLD solution. In a typical day hospital employees access thousands of patient records. In addition, the number of invocations of the break-the-glass protocol can be huge [6]. Therefore, the DLD system can generate hundreds of alerts, making the evaluation of their severity difficult and time-consuming. Below we present three representative alerts of data leakages:
A query is made by a doctor requesting an unusual large number of patient records. In particular, the names and addresses of
A query for patient data is made by a doctor after his regular working hours. He retrieved 200 records containing the names and diseases of patients.
A query for data about patients affected by HIV is made by a medical researcher of the hospital, specialized on cardiovascular diseases. He retrieved 500 records containing the gender, age and treatment provided to patients.
To assist organizations in the evaluation of data leakages, leakages should be ranked on the basis of their severity. However, the quantification of data leakages is not a trivial task as the leakages may differ on several aspects. The amount of leaked information is a main aspect to quantify the severity of data leakages. For instance, the leakage described in Alert 1 contains thousands of patient records, while in Alert 2 only a relatively small amount (200) of records is retrieved. Another difference is the information leaked itself. In particular, the sensitivity of the information (i.e., the impact that its disclosure has on the patient) can be different. For instance, disease information (Alert 2) is more sensitive than patient addresses (Alert 1). Finally, data leakages also differ on the extent that an individual related to the data is identifiable. According to the EU Data Protection Directive (95/46/EC), personal data should be protected. However, the principles defined in the directive do not apply to anonymous data. Therefore, the ability to identify the individuals related to the leaked data has an impact on the severity of a leakage. For instance, in Alerts 1 and 2 the leaked data can be directly linked to patients’ identity, while Alert 3 concerns data which do not allow the complete re-identification of patients.1
Here we assume that information about gender and age is not sufficient to fully re-identify a patient.
In order to obtain a ranking of alerts we need a method to quantify the severity of data leakages. Such quantification should take into account the amount and sensitivity of leaked information, and the extent to which the identity of the individuals related to the leaked information can be ascertained.
DLD solutions are often deployed by organization to detect data leakages. These solutions analyze the data leaving the system and raise an alert when a data leakage is detected. However, the number of alerts can be very large, making their analysis costly and time-consuming for organizations. To enable organizations to focus on the most severe incidents, data leakages have to be ranked based on their severity.
To address this issue, we propose a novel data leakage quantification system (Fig. 1). The system is connected to a DLD solution. When the DLD solution raises an alert indicating a potential data leakage, the quantification system analyzes the disclosed data to estimate the severity of the leakage. Since leakages can originate from different sources, data can be structured or unstructured. For instance, data originating from a database are structured, while data in an e-mail are usually unstructured. In this work, we focus on structured data where portions of the database’s tables are leaving the database as result of a user query. However, the system can be extended using technologies like natural language processing and information retrieval, to extract information from unstructured data.

Data leakage quantification process.
The severity of data leakages depends both on the amount of the data leaked and on the data themselves. Therefore, the quantification of data leakages should consider both these factors. In particular, data leakage quantification should reflect the cost of data disclosure according to the data subject/owner or to the organization hosting the data. We represent such a cost in terms of the sensitivity of data.
To enable the quantification of data leakages, it is thus necessary to assign a sensitivity value to every piece of data. Assigning a sensitivity value to all pieces of data, however, is time-consuming and error prone. To address this issue, we employ a data model representing the knowledge of the application domain to reason on data sensitivity. The data model makes it possible to specify the sensitivity of some pieces of information and infer the sensitivity for the other pieces of information based on this initial assignment (Section 4). To calculate the severity of data leakages, leaked data are mapped to the data model. Intuitively, the attributes and values in the leaked tables are mapped to the corresponding piece of information in the data model (Section 5). The sensitivity of data along with a discrimination factor, which determines to what extent data can be related to an individual, and the amount of leaked data is used to quantify the severity of data leakages (Section 6).
Data leakages are ranked and visualized on the basis of their severity. A security analyst, thus, can evaluate data leakages focusing on the more severe incidents. Based on this analysis, organizations can take the appropriate actions to prevent or mitigate the losses. If the analysis reveals that a leakage is a false positive (i.e., wrongly recognized by the DLD solution as a leakage), feedback explaining the assessment is sent to the DLD system to reduce the number of false alerts in the future.
To determine the sensitivity of data we represent the knowledge of the application domain using a data model. A data model provides a representation of the data within an application domain along with semantic relations between the data.
A data model is a tuple T is a set of data types. I is a set of data instances.
Figure 2 shows an example of data model for the healthcare domain. Data types are nodes represented by rectangles, while data instances by ovals. Hierarchy relations are represented with straight edges between two nodes. For instance, the hierarchy relation between
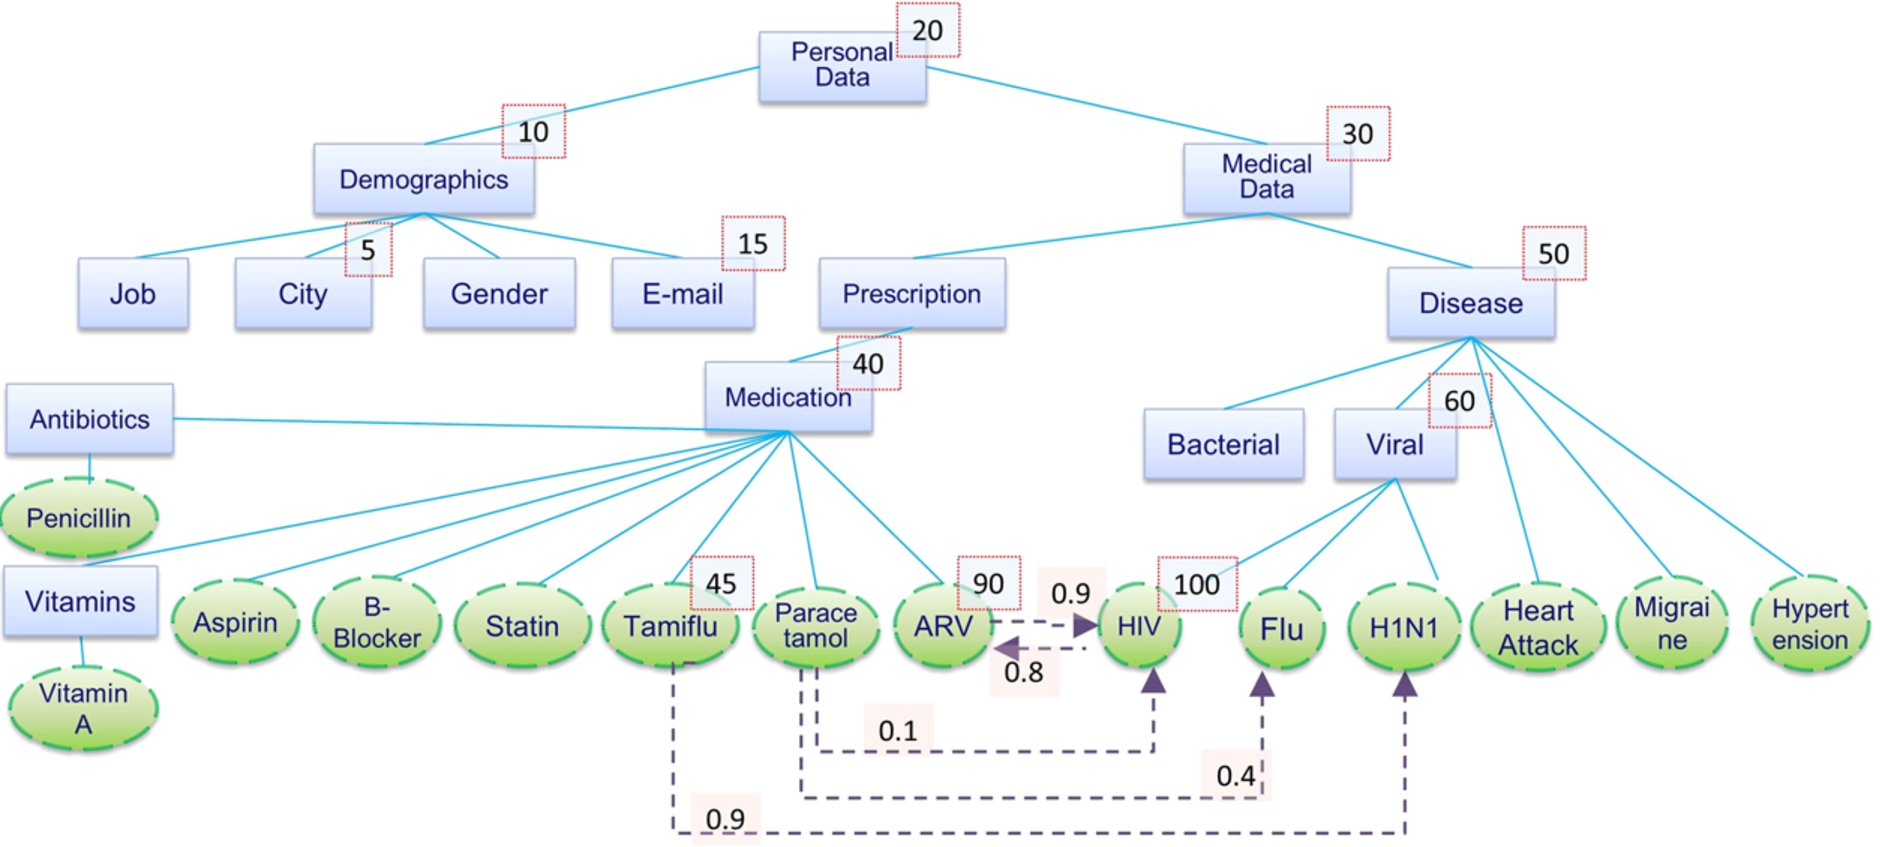
Data model example.
Nodes can be annotated with a sensitivity label that indicates the sensitivity of the data represented by the respective node. For instance, the sensitivity label of node
Both domain and security experts need to be involved in the construction of the data model for a given domain. Domain experts should define data types and instances along with the hierarchy relations between them. Moreover, they should determine the inference relations between instances with the respective probability labels. On the other hand, security experts should annotate the data model with sensitivity labels.
The annotation of the data model with sensitivity labels, however, can be difficult as the number of nodes can be large. Ideally, security experts should be able to assign sensitivity labels to few nodes and, based on this initial assignment, the system should determine the sensitivity of the other nodes. Here, we provide the machinery to reason over the data model in order to determine data sensitivity. In Section 8.2 we evaluate the effectiveness and efficiency of such an approach. To reason over the hierarchical structure underlying the data model, we introduce the notion of sensitivity propagation.
Let
Sensitivity propagation is used to assign a sensitivity value to the nodes in the data model based on hierarchy relations. In particular, Eq. (1) encodes a propagation strategy similar to the most specific overrides strategy presented in [26,33]: if a node does not have a sensitivity label, then its sensitivity is inherited from the node higher in the hierarchy. This approach provides great flexibility in the definition of sensitivity annotations as it allows a security expert to model cases where the sensitivity of a node is lower than the sensitivity of the parent node. It is worth noting that a node can have more than one parent node. In this case, a node is assigned the sensitivity value of the parent node that has the highest sensitivity value (among all parent nodes of the node).
In Fig. 2 the sensitivity label of
Although sensitivity propagation simplifies the task of assigning sensitivity values to nodes, it may lead to an inaccurate assignment by underestimating the sensitivity of some pieces of information. For instance, a security expert might assign a low sensitivity value to a data instance whose disclosure allows the inference of a data instance annotated with a higher sensitivity value [36]. To this end, we use inference relations to validate the propagated values and eventually adjust the sensitivity of the nodes to a higher value.
Let
Intuitively, the sensitivity of data types is obtained through sensitivity propagation. On the other hand, the sensitivity of data instances also depends on the sensitivity of the information that can be inferred through the inference relations.
Consider the sensitivity value of node
To quantify the severity of data leakages, the leaked data have to be mapped onto the data model in order to determine their sensitivity. Recall that in this work we focus on structured data leaving a database. Thus, the mapping consists in determining, for each entry in the leaked table, the corresponding node in the data model. In this section we first introduce the notation used to represent data; then, we present the mapping.
Let
Note that the new EU Data Protection Regulations is not passed yet.
A database table
We assume that all attributes and the corresponding domains are defined in the data model. In particular, attributes correspond to data types in the data model. Formally,
Next we present an example of database table along with the classification of attributes used in the remainder of the paper.
Consider the scenario in Section 2. The database includes table
We have now the machinery to present how to obtain the sensitivity of leaked data. Suppose that a table
Note that, in addition to the attributes and values contained in the leaked table, we also consider pre-acquired knowledge as part of the leaked information. In particular, conditional clauses such as WHERE clauses in SQL may leak information. For instance, consider a user query requesting the medication prescribed to patients infected by HIV (i.e., WHERE
To obtain the sensitivity of the leaked data, the values of the sensitive attributes in the leaked table need to be mapped onto the data model. For the mapping, search methods can be employed. However, the efficiency of the search methods depends on the size of the data model. To facilitate the search process, the attributes in the leaked table can be first mapped to the corresponding data type node in the data model. The value of the attribute can be then mapped starting the search from the data type node corresponding to the attribute and continuing downward the hierarchy defined by the data model. Consider table
The estimation of the severity of data leakages requires metrics that assess the sensitivity and the amount of the data leaked. In this section, we present an overview of M-score [20] and study its accuracy by applying it to some data leakage samples. Based on this analysis, we present our proposal for data leakage quantification.
M-score
M-score [20] has been proposed to estimate data misuse in database environments. It is based on the calculation of the severity of a (portion of) table, which may have been leaked. M-score evaluates the severity of a data leakage by evaluating three main aspects of the leaked data: the sensitivity, quantity and distinguishing factor. The sensitivity of data is defined through a sensitivity score function.
Let
Given a record
Let
Intuitively, the raw record score of a record is obtained by summing the sensitivity score of every piece of sensitive information in the record, with a maximum of 1.
The distinguishing factor of a record r with respect to a table, denoted as
Let
The final record score for a leaked table
Let
It is worth noting that the distinguishing factor is calculated with respect to the source table. To capture the quantity aspect of the leakage, M-score determines the severity of leakages based on the final record score and the number of records disclosed.
Let
Parameter x is a weighting factor used to determine the importance of the amount of data (versus their sensitivity) in the computation of the severity of data leakages. In particular, greater is x, more importance is given to the sensitivity of data compared to the amount of leaked data. In the next section, we analyze the impact of this parameter on the severity of leakages.
In this section we study the accuracy of M-score by applying it to a number of leakage examples. These examples are based on table
Sensitivity score function
Sensitivity score function
The sensitivity score function used to assess the severity of leakages is shown in Table 1. The sensitivity score assigned to diseases is related to the impact the disclosure of disease information has on the life of an individual. In particular, diseases whose disclosure has a major impact on the life of the patient (e.g., HIV) are assigned a higher sensitivity than diseases with less critical impact (e.g., Flu). The sensitivity of medication is related to its degree of specialization; medication can be general and specialized. General medication is prescribed to treat mild symptoms of different diseases, such as headache. This category includes medication such as
We apply M-score to three cases. In the first two cases, we focus on the impact of data sensitivity on the severity of leakages. Thus, we consider the same number of leaked records and set parameter x of M-score equal to 1. In the third case, we focus on the impact of the amount of leaked records on the severity of leakages. Thus, we vary the number of records in the leakages. In M-score the impact of the amount of records is accounted by parameter x (see Definition 8). To study the effect of this parameter we consider three values for x, namely
Case 1. Consider the leakages in Tables 2(a) and 2(b). In Case 1.1 the records contain general medication prescribed to patients suffering from serious health issues. In Case 1.2 the records contain information about specialized medication prescribed to patients suffering from serious health issues. We expect Case 1.2 to be more severe than Case 1.1 as it contains more sensitive information. However, M-score calculates the same severity value (2.000) in both cases. The problem lies in the use of the min function in the calculation of
Case 2. Consider the leakages in Tables 2(c) and 2(d). In Case 2.1 the records contain general medication. In contrast, the records in Case 2.2 contain information about specialized medication. In both cases we consider only a small percentage of records (1 record) about patients suffering from a serious health issue. Therefore, Case 2.2 should be estimated more severe than Case 2.1, as it contains more sensitive information. In contrast, M-score calculates the same severity value (2.000) in both cases. The problem lies in the use of the max function in the calculation of
M-score evaluation
Case 3. Consider the data leakages in Tables 2(e) and 2(f). Case 3.1 is composed of records with general medication with only a small percentage of records (1 record) referring to patients suffering from a serious health issue. Case 3.2 is the same of Case 1.2. A notable difference between the two leakages is the number of leaked records. Case 3.1 contains seven records, whereas Case 3.2 contains four records. Although Case 3.2 has fewer records, it should be more severe than Case 3.1, since the sensitivity of data in Case 3.2 is much higher than in Case 3.1. As mentioned above, we study three values of parameter x (see Definition 8). When
As shown in the examples above, M-score may not be able to accurately determine the severity of leakages; in particular, this metric only provides an estimation of the severity of data leakages rather than computing their actual severity. The main problem lies in the way in which the raw record score and the final score are calculated and, in particular, in the use of the min and max functions respectively. The min function allows a maximum sensitivity score of 1 per record, thus failing to account for the actual sensitivity of a record. In particular, M-score is not able to discriminate data leakages that contain at least one highly sensitive record (i.e.,
Consider a record
Consider a leaked table
This section presents L-severity, a new metric for quantifying data leakages that addresses M-score’s drawbacks. Similarly to M-score, L-severity assesses the severity of data leakages based on the sensitivity, distinguishing factor and amount of leaked data. However, we pursue a different approach than M-score in that we propose a metric that computes the actual severity of data leakages rather than an estimation. In particular, our metric computes the severity of data leakages by considering the sensitivity of every piece of data in the leaked table.
Let
In the calculation of record sensitivity we make use of the data model (Section 4). In particular, we use
To calculate the severity of data leakages, we introduce L-severity metric.
Let
To demonstrate L-severity we applied it to the same cases used to evaluate M-score (Section 6.2). To make a fair comparison with M-score we use the sensitivity score function in Table 1 to determine the sensitivity of data.
Comparison between L-severity and M-score
A summary of the severity scores obtained by L-severity and M-score is shown in Table 3. Accordingly, the value of L-severity is 2.050 for Case 1.1 and 2.900 for Case 1.2. Hence, L-severity is higher for Case 1.2 than for Case 1.1. Similarly, the L-severity value for Case 2.2 (2.100) is higher that the value for Case 2.1 (1.150). Finally, Case 3.2 has a higher L-severity value (2.900) than Case 3.1 (1.950). Thus, L-severity provides values that better characterize the severity of leakages with respect to the intuition (Section 6.2).
In this section we discuss the practical application of the proposed data leakage quantification approach along with its potential benefits for a security analyst. First, we show how existing domain ontologies can be employed as a baseline for the data model. Then, we discuss issues concerning the computation of data sensitivity. Finally, we demonstrate how the data leakage quantification approach can be used to facilitate the analysis of alerts.
Defining the data model
The severity of data leakages depends on the sensitivity of the leaked data. To reason on data sensitivity we employ a data model that provides a description of the data characterizing an application domain along with the semantic relations between data. In our approach we take advantage of existing domain ontologies to represent the data model. Ontologies [19] are often adopted to capture the knowledge of a specific application domain. The basic elements of ontologies are Classes, Individuals, Attributes and Relationships. Classes are abstract groups of objects, while individuals represent instances of classes. Attributes are used to represent properties and characteristics of classes and individuals. Relationships represent ways in which classes and individuals are related to one another. Ontologies can be used as a basis for the definition of a data model. Table 4 shows the correspondence between the elements of the data model and the elements of an ontology.
Correspondence between the data model and ontologies
Correspondence between the data model and ontologies
As an example we illustrate how the data model can be instantiated in the healthcare domain using an existing ontology. Several ontologies have been proposed for the healthcare domain [14,34,35,41,45,46]. Here, we consider SNOMED Clinical Terms (SNOMED-CT) [41], one of the most exhaustive and used medical ontologies. Figure 3 presents a fragment of SNOMED-CT related to the AIDS disease and the HIV virus. In SNOMED-CT classes and individuals represent clinical terms. SNOMED-CT uses relationships to link each term to other terms. These relationships provide formal definitions of medical terms. One type of relationship in SNOMED-CT is the IS-A relationship which relates a term to a more general term. Based on this relationship, medical terms are organized in hierarchies, from the general to the specific. Therefore, the IS-A relationship can be mapped to the hierarchy relation of the data model. SNOMED-CT also uses other types of relationship to define a term. For instance, relation ASSOCIATED WITH is used to relate an individual of class
SNOMED-CT does not provide a native support to specify data sensitivity and inference labels. To this end, SNOMED-CT can be extended by annotating terms and relations with two additional attributes. In particular, sensitivity labels can be specified as an attribute of classes and individuals, and inference labels as an attribute of relations.
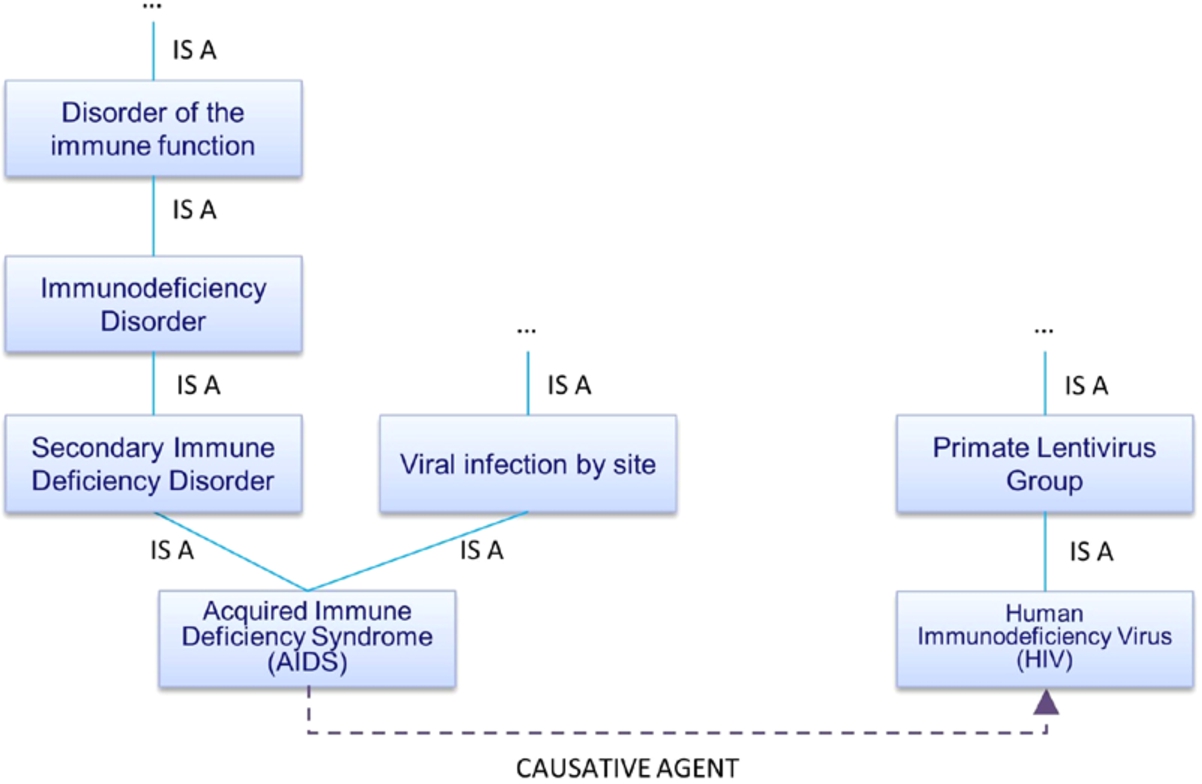
Fragment of SNOMED-CT.
As shown in Section 4, the data model makes it possible to determine a sensitivity value for each piece of data based on an initial (partial) assignment. Therefore, such an assignment plays a crucial role in the quantification of leakages. Different solutions have been proposed in the literature to define the sensitivity of data. These solutions can be divided in two main streams. On one side, we can find user-centric solutions [11,31] which require users to define sensitivity values for the data based on their preferences and context of use. Users may use different criteria to define such values. For instance, medical personnel may express data sensitivity as the impact that the disclosure of the data has on the patient. In contrast, administrative personnel may express sensitivity as the financial impact that the disclosure of the data has to the healthcare institution. Thus, the resulting annotation contains a degree of subjectivity that depends on the criteria and belief of the user defining sensitivity values. On the other side, we can find approaches based on guidelines and standards. These approaches aim to provide a standardized and consistent ground for sensitivity annotations. Contrarily to user-centric solutions, solutions relying on standards and guidelines limit user intervention, thus reducing the degree of subjectivity in the annotation.
In our approach we rely on HL7 Healthcare Privacy and Security Classification System (HCS) [22] to annotate the data model with sensitivity labels. HL7 HCS provides guidelines and a tagging system for automated labeling and segmentation for protecting healthcare information. We have chosen this tagging system for two main reasons. First, it is largely accepted by the community as demonstrated by the several projects and initiatives contributing and implementing these guidelines [4,13,23,24,44]. Moreover, the tagging system provided by HL7 HCS is based on SNOMED-CT (and other code systems) and, thus, well suited for our data model.
HL7 HCS proposes to annotate data with security labels which provide a structured representation of various security aspects concerning a piece of data, such as confidentiality level and sensitivity. The confidentiality level is the most important aspect and is used to indicate the classification of healthcare information. Its values range from Unrestricted to Very Restricted, defining six different confidentiality levels in total. Sensitivity tags define compartments of IT resource by categorizing their value and importance. For instance, tag HIV is used to denote the sensitivity of HIV/AIDS information, tag SEX the sensitivity of sexuality and reproductive health information, PSY the sensitivity of psychiatry information and so on. Sensitivity tags are associated with guidelines that define on how strictly pieces of data should be handled. For instance, HIV/AIDS information is deemed highly sensitive and its handling is subject to stringent requirements.
However, HL7 HCS only provides a “qualitative” annotation of healthcare information. To this end, we have extended the HL7 HCS tagging system to define sensitivity values from confidentiality and sensitivity tags. First, we defined an initial sensitivity value for pieces of data according to their confidentiality level as shown in Table 5. For instance, every piece of data that has a Restricted confidentiality level are assigned with a sensitivity value of 80. These initial sensitivity values are then adjusted based on sensitivity tags (if defined for the piece of data) to comply with the respective sensitivity guidelines. For example,
Mapping from HL7 confidentiality tags to sensitivity value
Mapping from HL7 confidentiality tags to sensitivity value
HL7 HCS provides a partial classification of classes and individuals in SNOMED-CT. We used the resulting sensitivity values for these classes and individuals as the initial assignment of sensitivity values in the data model. Then, we derived the sensitivity for other classes and individuals using the approach described in Section 4. In particular, the IS-A relationship was used for sensitivity propagation, and the other types of relationship were used to compute inferred sensitivity.
Sample HL7 security tags and assigned sensitivity values
Organizations often employ a DLD system to detect potential data leakages. DLD systems, however, may produce a huge number of alerts, making their evaluation a time-consuming and error-prone task. To properly handle alerts and mitigate the potential damages caused by data leakages, security analysts should be able to timely focus on the most critical cases and have the information necessary for the investigation.
To facilitate the task of security analysts, we have developed a web-based data leakage audit tool for the visualization of alerts. The tool is connected to a DLD system. When an alert is raised by the DLD solution, the tool analyzes the alert by mapping the leaked data to the data model and assessing its severity. The alerts are then visualized along with information that provides insights on the security incident.

Data leakage audit tool.
A screenshot of the tool is shown in Fig. 4. For each alert, the tool displays the associated profile (e.g., user, role) along with the performed query (second and fourth columns). Moreover, other contextual information, such as the timestamp and IP address, are shown (fifth and sixth columns respectively). The tool also displays the severity of data leakages (last column). In particular, severity is visualized using a three value scale, namely high severity (shown in red), medium severity (shown in orange) and low severity (shown in yellow). Note that the definition of such a scale is domain dependent; it is based on the sensitive values used to annotate data within the domain as well as the security requirements of the organization.
Depending on the adopted DLD solution, other information about the alerts may be available for the analysis. We have connected our quantification system to the DLD solution presented in [10]. This DLD solution is a white-box behavioral-based anomaly detection system which provides information related to the root causes of alerts. This information can be displayed by the visualization tool to provide additional insights on the alert (third column).
In addition, the tool provides capabilities that facilitate the analysis of alerts. For instance, it allows security officers to rank alerts on the basis of their severity or group alerts with respect to other aspects like profile, enabling security analysts to focus on specific types of alerts.
In this section we evaluate the severity-based data leakage quantification approach (Section 6) and the data sensitivity calculation method using the data model (Section 4).
Assessing data leakage severity
In this section we evaluate the ability of the severity-based data leakage quantification approach to assess the criticality of data leakages. In addition, we compare our solution with M-score.
Experiment setting. For the evaluation we have considered a real setting based on the healthcare scenario presented in Section 2. The hospital database was implemented using GNU Health,5
The leakage dataset was manually analyzed by a group of security experts. In particular, we developed a questionnaire describing the leakages; each leakage was described along with its key features. The security experts were invited to answer the questionnaire and evaluate the criticality of the leakages. In particular, the security experts assessed the criticality of the leakages using a three-valued scale (i.e., low, medium, high). This assessment was the underlying reference dataset used for the evaluation and comparison of the two data leakage quantification methods.
Evaluation framework. To assess the quality of the quantification results obtained using both data leakage quantification approaches, we have considered an evaluation framework consisting of a number of standard quality metrics, namely recall, false discovery rate (FDR), and F-measure [7,49]. For the evaluation, we computed recall, false discovery rate and F-measure per criticality level (i.e., low, medium, high), as well as for the overall leakage dataset.
Recall measures the quality of an approach in finding relevant information and is calculated as:
False discovery rate (FDR) measures the quality of an approach in terms of false positive and is calculated as:
F-measure is an aggregate measure of performance which combines precision and recall into a single measure and is calculated as:
Note that, although we compute precision for the computation of F-measure, we do not report the results for this quality metric. Indeed, precision is implicitly given by FDR, i.e.
Results. The results of the evaluation are shown in Table 7. For each approach, the table reports recall, FDR and F-measure for each criticality class as well as for the overall leakage dataset. To make a fair comparison between the two approaches we used the same sensitivity values for the data in both approaches. Moreover, we have set parameter x of M-score to 1.
Data leakage quantification: Recall, FDR and F-measure
The results indicate that M-score quantification approach is not able to properly assess the criticality of approximately
On the other hand, L-severity yields an overall recall of
Although our method shows promising results in the quantification of data leakages, it only uses severity to characterize the criticality of data leakages. The questionnaire provided to the security experts also aimed to identify which aspects were considered to determine the criticality of data leakages. This study has shown that other aspects, like the anomaly level of database activities, should be considered alongside severity for the quantification of data leakages. We leave the investigation of these aspects and, in particular, the definition of a security metric able to combine severity and anomaly level as future work.
In this section we evaluate the effectiveness of the data sensitivity annotation process based on the (semantic) information available for reasoning on data sensitivity.
Experiment setting. For the evaluation of the data model we have considered a fragment of the SNOMED-CT ontology. The selected fragment consists of 100 terms, of which 54 data type nodes and 46 instance nodes. The nodes are connected with hierarchy relations. In addition, the fragment comprises 26 inference relations between instance nodes. In the experiments we have analyzed and compared three approaches to determine data sensitivity. The first approach uses all available information for the annotation of data with sensitivity labels. In particular, it uses sensitivity propagation (Definition 2) to reason over hierarchy relations as well as inference relations (Definition 3). This corresponds to the approach described in Section 4, and we refer to it as
To evaluate the three sensitivity calculation approaches we have considered five initial sensitivity value assignments (annotations). We have defined an initial annotation consisting of 15 nodes (
Evaluation framework. The aim of the evaluation is to assess the effectiveness of data sensitivity calculation approaches in relation with the effort required by the security expert to build an annotation for all data elements. To this end, we have considered three metrics, namely coverage, underestimated nodes and undefined nodes.
Coverage (
Underestimated nodes (
Undefined nodes (
Results. The results of the evaluation are shown in Table 8. For each approach, the coverage (
Data model validation
Data model validation
As expected, the results show that
The underestimation of sensitivity is primarily caused due to the absence of information on the relations between instance nodes, an issue that is addressed in
Several proposals aiming at data leakage detection and protection can be found in the literature [1,39,43]. Data leakage detection (DLD) solutions differ in the approach and technologies used to detect leakages. In particular, DLD solutions can be classified into two main streams: specification-based [17,18,21,43] and behavior-based [10,27,28,32] approaches. Specification-based approaches use predefined policies (e.g., access control policies, firewall rules, patterns) that define which operations are allowed or not. For instance, such approaches include the use of keywords, regular expressions, text classification [21], and information retrieval [17,18] to detect the presence of sensitive data leaving the organization perimeter. The major drawback of specification-based approaches is that they can only detect known leakage patterns. In behavior-based DLD solutions the permitted usage of data is defined by observing users’ behavior. These approaches usually employ machine learning or statistical techniques to learn a model of normal behavior and flag every deviation from such a model as an anomaly. Although behavior-based approaches have the ability to detect unknown leakage patters, they often produce a large number of false alerts, i.e. alerts that do not correspond to an actual data leakage. In addition, most existing DLD solutions only focus on detecting leakages and do not assess their severity. Our work is complementary to DLD solutions. In particular, our approach can extend DLD solutions by providing insights into the raised alerts.
A number of proposals for the quantification of data breaches exist in the literature [8,15,16]. These proposals measure the impact of a security incident in financial terms. For instance, security incidents are quantified on the basis of the damage on the reputation of the organization and the losses on the revenue. Another approach for measuring the severity of security incidents is proposed in [3,6]; this approach evaluates privacy infringements by quantifying deviations from the intended usage of data. These solutions, however, are generic and not tailored to analyze data leakages within database environments. As a consequence, they do not propose a systematic and comprehensive approach to assess the severity of data breaches within database environments.
Data leakage quantification is studied in the field of quantitative information flow [5,40]. These solutions measure the amount of information leaking from a high confidentiality input to a low confidentiality output. Leakages are usually quantified in terms of bits, using metric based on information theory and information entropy. Quantitative information flow has also been applied to quantify leakages at network level [9]. In particular, it has been used to measure the amount of leaked information (measured in bytes) in the hypertext transfer protocol. Another approach to data leakage quantification is presented in [10]. This approach quantifies alerts of data leakages with respect to their anomaly level, allowing security analysts to focus on the most abnormal cases. The major drawback existing data leakage quantification approaches is that they do not consider the semantics of the leaked information to quantify the criticality of data leakages. In particular, the sensitivity of leaked data is not considered in the calculation of the severity of a leakage.
To the best of our knowledge, M-score [20] is the only proposal that uses semantic information to compute the severity of data leakages. In particular, M-score measures the severity of leakages in database environment on the basis of the amount and sensitivity of the data leaked. However, M-score is not able to accurately distinguish data leakages. In this work, we have presented a data leakage quantification approach that considers the semantic information related to the leakage and is able to properly distinguish data leakages. Experimental results show that our approach provides a better characterization of the severity of leakages compared to M-score.
Conclusion
In this work we have presented a novel approach for the quantification of data leakages with respect to their severity. The assessment of the severity of data leakages considers the amount and sensitivity of the leaked information together with the ability to identify the individuals related to the leaked information. To specify and reason on data sensitivity, we defined a data model representing the knowledge in a given domain. We validated the approach by analyzing data leakages in a typical healthcare environment.
Our data leakage quantification metric uses a distinguishing factor to determine the level of data anonymization. This factor is based on the number of occurrences of quasi identifiers in the dataset. An interesting direction for future work is to evaluate the impact of the distinguishing factor on the severity of data leakages by considering more sophisticated approaches to data anonymization like differential privacy. Moreover, the alerts generated by a DLD solution may not correspond to data misuses, i.e. alerts may turn out to be false positive. Therefore, the severity of a leakage may not correspond to its risk level (risk is usually defined as the combination of the severity and probability of an event). An interesting direction for further investigation is the integration of our approach with DLD solutions able to determine the probability that an alert is indeed a data breach. This would allow a risk-based ranking of leakages.
Footnotes
Acknowledgment
This work has been funded by the Dutch national program COMMIT under the THeCS project.