
Abstract
Many network security systems analyze large scale data collected from multiple collaborating domains or aggregated network vantage points. Scale is clearly beneficial for these systems, however it also makes them difficult to design and test. Large scale data sets can be difficult to acquire and may not contain important meta-information (e.g. ground truth). Further, their limited availability can make it extremely difficult to understand how well experimental results would reproduce in different conditions, or at different networks. In this article, we discuss using simulation to overcome these challenges. We present an augmented version of LESS, our recently proposed agent based simulator for evaluating large scale network security systems. LESS uses publicly available data sets and high level parameters to generate synthetic traffic that models large scale, multi-network scenarios. Essentially, LESS allows researchers to “scale up” the data and statistics about networks and attacks that they have access to, so that they can be used to test large scale network security systems. Researchers can also tune LESS’s high level parameters to better understand the sensitivities of their systems, and the reproducibility of their results. The version of LESS that we discuss in this article is extended to allow researchers to study an additional factor of system performance related to reproducibility: deployment location; by modeling the global Internet topology at the Autonomous System level. We demonstrate the applicability and benefits of LESS by tuning it with publicly available traces and then using generated records to reproduce and extend results from several recently proposed large scale security systems. In new experiments, we use LESS to study how deployment location affects large scale security systems. Our results demonstrate that LESS can evoke realistic performance from these systems with minimal tuning and provide insight into the network and topological factors that may affect the reproducibility of their evaluations.
Introduction
Many recently proposed network security systems leverage scale [5,10,20,37,40]. By analyzing data sets with communication records from many administrative domains, a network security system can identify macroscopic host behavior patterns that cannot be observed at the local network level. Although beneficial, the scale of such proposed techniques also results in a high bar for advancement and investigation from the general research community [2,33]. Internet- or ISP-scale data sets appropriate for studying large-scale security systems are difficult to acquire and share. Furthermore, data sets of sufficient scale that are publicly available often lack context that is important for meaningful evaluation, such as ground truth about which traffic is malicious. These data limitations make reproducing results difficult, and also limit the ability of researchers to study how their proposed large scale network security systems would perform when deployed at different locations across the diverse and heterogeneous Internet.
In other areas of network research, simulation is an effective tool to overcome similar data challenges. However, available simulation tools do not model host usage and behavior patterns in a way well suited for evaluating large scale security systems. In previous work, we proposed a simulator for this specific domain:
In our previously published work [32], we validated LESS and used it to study the reproducibility of four large scale network security system evaluations. We focused on answering the following questions about the reproducibility of these systems:
Can we qualitatively reproduce the results of the original evaluations with traces that LESS generates when tuned with publicly available traces and statistics about the original data sets?
How sensitive are the security systems to changes in simulation parameters?
The extended version of LESS that we describe in this article also allows us to study another aspect of reproducibility:
How much does the performance of these security systems depend on their deployment location?
This article contains new results related to this question, and all of the results from our original evaluations with LESS.
Our results suggest that domain-specific simulation, and LESS in particular, is a vital tool for studying the reproducibility of large scale network security systems. In summary, our contributions are:
An overview of LESS: an agent based simulator for evaluating large scale network security systems.
The design and implementation of an Internet topology model for LESS, for evaluating the effects of deployment location on large scale network security systems.
Simulation based reproductions and extensions of results from four large scale security system evaluations.
In the remainder of this article, we examine the intersection of large scale security systems and simulation based analysis. First, in Section 2, we discuss related simulation techniques. Next, in Section 3, we summarize the four large scale network security systems that we study with LESS in this article. We discuss the implementation of LESS, and our topological modeling extension in Section 4. Then, in Section 5, we use LESS, along with publicly accessible data sets, to reproduce and extend the evaluations of the surveyed security systems. Finally, we discuss possible future extensions to LESS in Section 6, and conclude in Section 7.
Related work
Simulation offers many benefits for computer network related research [15]. Discrete event simulators [28] and virtual networks [22] provide frameworks for simulating many network connected devices on a single machine, and are useful for evaluating distributed systems. However, these tools require users to completely specify the actions of each simulated device, making them ill-suited for evaluating large scale security systems, which are designed to detect or prevent specific types of malicious activity based on usage patterns. Our work is complementary: LESS models inter-host communication patterns and behaviors, but not the physical devices that connect hosts.
Traffic generators, such as [38] generate synthetic packets to be carried on real or virtual networks. These systems model packet and payload level features, and are used to evaluate techniques that are sensitive to these features, such as congestion control [21]. However, large scale network security systems are sensitive to flow level features, such as traffic dispersion or host communication patterns. LESS is orthogonal to synthetic traffic generators, in that it models these higher level properties and is better suited for evaluating large scale security systems.
User behavior modeling has been proposed to generate specific classes of non-malicious Internet traffic, such as HTTP traffic [8]. LESS differs in two important ways from these systems: first, it models behavior patterns at the host level; second, it allows users to augment hosts with malicious behaviors that model large scale security threats such as worm outbreaks [25], correlated attackers [20], and bot communication networks [16]. Thus, LESS applies similar behavior modeling techniques, but in a way better suited for evaluating large scale security systems.
Simulation techniques tailored for specific classes of security systems have been proposed; Sommers et al. [31] craft flow payloads to evaluate and tune intrusion detection systems, and Chen and Gray [9] propose a simulator for evaluating worm outbreaks in a peer-to-peer network. These techniques are complementary to LESS in scope and scale, but motivated by the common observation that other network simulation techniques are ill-suited for security research.
Testbed systems, such as Lariat [30], are platforms that use real or virtualized networks along with complex models of host behaviors to evaluate security systems of varying scale. Testbeds require careful tuning: the authors of Lariat, for example, estimated that configuring their system to test a new intrusion detection system takes approximately four months [30]. In contrast, LESS uses more general models that can be automatically fit to and validated against real traffic traces. Simpler models also lead to quicker run times: each simulation that we ran to generate experimental results for Section 5 executed in one hour or less. LESS and security testbeds could be used complementary: for example, the preliminary evaluation of a new technique could be done using LESS, followed by a testbed evaluation of the system in a specific scenario.
LESS applies two general classes of simulation techniques to large scale security system experimentation. First, agent based simulation [6], in which complex systems are modeled as a set of agents that interact with each other based on individual decision processes. Second, stochastic simulation [29], in which systems are analyzed with inputs drawn from statistical distributions of real observations. More specifically, LESS models usage in a large scale network from the perspective of a collection of host agents that interact with each other in a client–server model to generate both background and malicious traffic. The actions and behaviors of these host agents are defined by processes that are configured stochastically, with distributions derived from real sample traces.
Large scale and collaborative security systems
In this section, we summarize four systems that demonstrate both the potential of large scale security and the data related challenges of experimentation in this domain.
Entropy based anomaly detection
Wagner and Plattner [37] observed that large scale security threats, such as worm outbreaks and high volume DDoS attacks, skew the distribution of flow level traffic features such as source and destination IP addresses. Based on these observations, they proposed a technique to detect such events by measuring the entropy of traffic features.
Wagner and Plattner evaluated their technique using large scale traces from the outbreaks of two real worms. Such traces are difficult to acquire, and do not allow researchers to analyze how worm behavior properties (e.g. inter-scan time) affect system performance. LESS allows researchers to work around these issues by generating background traffic based on parameters measured from publicly accessible samples, and malicious traffic based on parameters selected by tunable threat models.
Collaborative anomaly detection
Boggs et al. [5] proposed a technique to significantly reduce the false positive rate of anomaly detectors, by correlating the alerts generated by detectors deployed at multiple networks. Their system is based on the observation that if multiple unrelated hosts or networks observe similar anomalies, they are more likely to be due to a common attack.
Boggs et al. evaluated the proposed technique on eight weeks of traffic collected at two university web servers. Their evaluation demonstrates how challenging it is to collect sufficiently detailed data from multiple administrative domains. LESS is beneficial in this scenario because it allows users to simulate many networks based on parameters drawn from a single, more accessible traces.
Highly predictive blacklisting
The Highly Predictive Blacklisting System [40] generates blacklists customized for individual networks by analyzing the attack patterns of malicious hosts across multiple collaborating networks. The proposed approach is based on the observation that many attackers target small, stable sets of networks [20].
The authors evaluated this system on a set of over 700 million Intrusion Detection System log entries submitted to DShield [13] by over 1500 networks over a two month period of time. Although this data set is publicly accessible and large scale, it cannot be used to measure false alert rates, as IDS log entries alone do not provide sufficient context to determine the true maliciousness of the hosts causing alerts. LESS can provide perspective on how false alerts affect a system, by using well defined malicious traffic models and record sets where malicious traffic is clearly marked.
Peer-to-peer botnet detection
Coskun et al. [10] proposed a technique to detect peer-to-peer bots by correlating host communication patterns, based on the observation that the bot-hosts in a network are more likely to communicate with common external hosts.
The authors evaluate their approach by mixing a 24 hour trace collected at the boarder of a university network containing approximately 2000 hosts, and communication records from approximately 900 bots from the Nugache botnet. A data set from one botnet does not allow researchers to measure how the topology of the peer-to-peer botnet affects their systems. With LESS, however, users can estimate the effects of this factor with a tunable botnet traffic model. Further, this data set is from a single network, which makes it difficult to analyze how a security system will perform at other networks that carry different types of traffic. LESS can generate data sets based on samples of traffic from other networks, which in turn can be used to estimate how robust a security system is to diverse network conditions.
Simulation for large scale network security
An overview of LESS.
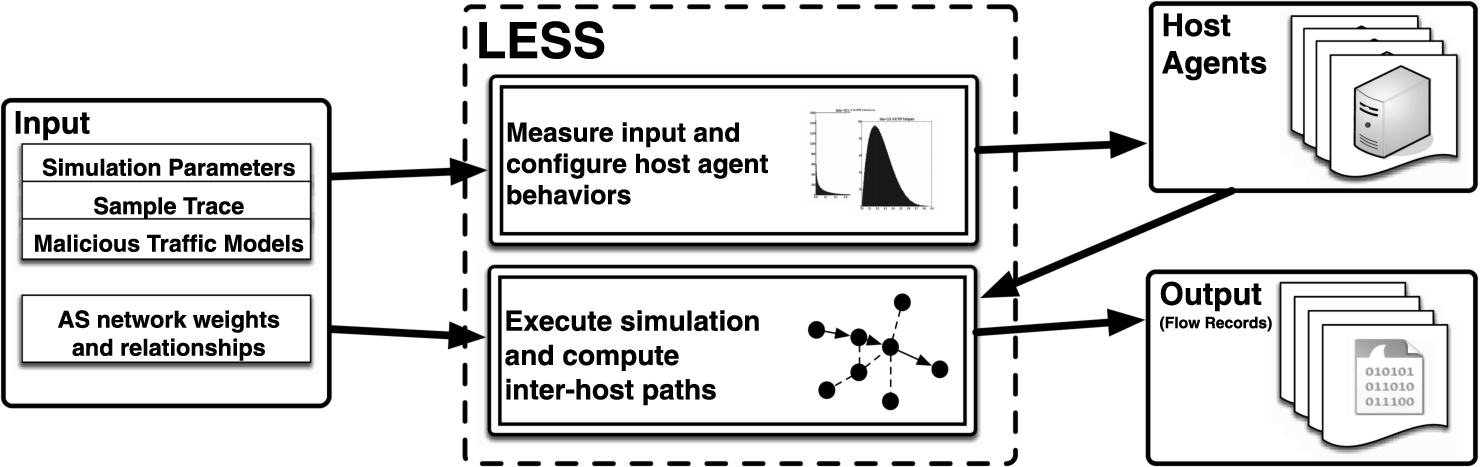
LESS, illustrated in Fig. 1, generates traces for evaluating large scale security systems by generating host agents that behave according to stochastic processes, and then recording their activities in a simulation where the host agents execute their behavior processes. A behavior process models a single host’s communication pattern using a single class of network applications (e.g. web, email, VOIP, worm). LESS configures host agents using the following inputs:
a sample trace containing representative background traffic, which LESS measures statistics from to configure non-malicious host behavior;
two simulation parameters N and T, that specify the number of host agents to generate and the duration of the simulation;
a malicious traffic model M, which LESS uses to configure malicious host behavior processes.
In addition to modeling the behavior of host agents, LESS also models the inter-network topology that connects the hosts. LESS assigns each host agent to an Autonomous System (AS), and then computes AS level paths for each pair of host agents that communicate in a simulation. LESS models AS topology with two additional inputs:
an AS to weight mapping, containing an estimate of the sizes of real or simulated autonomous systems;
an AS relationship graph, containing AS level links annotated with their business relationship.
When a LESS simulation runs, the host agents autonomously determine when to communicate and which other host agents to communicate with using their behavior processes. LESS monitors their communications and generates records consisting of timestamps, source and destination host IDs, source and destination ports, and the AS level path of the simulated traffic flow.
There are many data sets appropriate for use as input to LESS, provided by repositories such as CAIDA and predict, and reported by previous independent research. We discuss the data specific to our experiments more in Section 5.
LESS configures the background behavior processes of its host agents with measurements derived from a user provided sample trace. The sample trace can be anonymized and without payloads. In our LESS based security system re-evaluations, discussed in Section 5, we used short, publicly available traces collected by CAIDA from single Internet backbone links [7], and found that they were more than sufficient.
The preprocessing stage of LESS has three steps. First, it converts the trace into flow level records using Argus [1]. Next, it classifies the flow records based on their application type. In our current iteration, LESS classifies based on destination port; however, there are many more advanced techniques for traffic classification, such as [39]. Finally, LESS determines the client/server roles of each pair of communicating hosts. In our current version, we identify servers by port (i.e. the server is the host using a well known port below 1024). There are also more advanced techniques for identifying clients and servers that can be integrated into LESS [35]. LESS currently discards all flows in which neither port is well known.
Assigning applications to host agents
After preprocessing the input trace, LESS generates N host agents and determines which applications types each host agent will model, based on three statistic samples measured from the input trace:
client application count sample, or the number of application types each host from the input trace uses as a client;
server application count sample, or the number of application types each host from the input trace uses as a server;
application host percent sample, or the percentage of hosts from the input trace that use each application.
LESS then assigns a set of client and server applications to each host agent h with the following procedure:
draw a client count c from the client application count sample and a server count s from the server count sample; select c applications observed in the input trace randomly without repetition, weighted by the application host percent sample, and assign them to h’s client application set; select s applications observed in the input trace randomly without repetition, weighted by the application host percent sample, and assign them to h’s server application set.
Configuring background traffic generation processes
Next, LESS configures a behavior process for each client application type assigned to each host agent. A background behavior process accepts the following parameters:
connection inter-generation distribution: a distribution that defines how long the host agent waits before generating a new connection using the modeled application;
server count: a parameter that defines the maximum number of servers the host agent should connect to with the modeled application;
server weight distribution: a distribution that defines the preference of the host agent for connecting to each host agent that serves the modeled application;
community ID: a parameter that specifies which community the host agent belongs to for the modeled application;
inter-community ratio: a parameter that specifies the host agent’s preference for connecting to servers belonging to its own community.
A background behavior process consists of the following two steps, that repeat until the end of the simulation:
Connection Generation: determine when to generate the next connection by drawing a sample from the connection inter-generation distribution, and adding it to the current timestamp.
Destination Selection: when the timestamp computed in 1 arrives, determine what host agent to initiate a connection with using a decision process that narrows the range of possible destinations by first determining whether to connect with a previously contacted host or a new host (based on whether this process has reached its server count), and then determining whether to connect with a host agent inside or outside of its community (based on the process’s inter-community ratio). After removing the host agents that do not satisfy the criteria selected above, LESS selects one of the remaining host agents randomly, weighted by the server weight distribution.
LESS selects inputs for a background behavior process p that models the use of application a by a single host agent with measurements from the input trace, as follows:
LESS measures the connection inter-generation distributions and server counts of all hosts that use application a in the input trace, and randomly selects one inter-generation distribution and one server count for p; LESS measures the server weight distribution for application a, and assigns it to all processes that model a, including p; LESS groups all the hosts from the input trace that use application a into communities using the algorithm described in [4], and then selects a community ID for each process that models application a by selecting a community at random, weighted by the size of the community in the input trace; Finally, LESS selects an inter-community ratio for process p at random from the inter-community ratios of all hosts that belong to the corresponding community from the input trace.
Configuring malicious traffic generation processes
LESS also adds malicious behavior processes to host agents, based on user provided models of malicious network behavior. Below, we define the three models that we apply in Section 5 to re-evaluate large scale security systems. These models are straightforward, and based on previously published observations about malicious host behavior.
The models are also tunable, with parameters specified by the user. All of the models accept the following three parameters:
N: the number of host agents that model the malicious behavior;
I: an inter-event timing distribution for the malicious behavior processes;
T: the start time of the malicious behavior processes.
Random worm outbreak model. The random worm outbreak model, based on observations from [25], simulates the propagation of a randomly spreading worm. This model accepts inputs N, I, and T, as defined above.
To augment the hosts with this malicious behavior, LESS first selects N host agents and marks them as vulnerable to the worm. At time T, a randomly selected vulnerable host initiates the following propagation algorithm, which repeats indefinitely:
Select a target host, uniformly at random.
Send a probe to the host. If the host is marked as vulnerable, mark the host as infected and start the propagation algorithm on that host.
Select an inter-probe time from I. At time current time + selected time, repeat from step 1.
Targeted attacker model. The targeted attacker model simulates attackers that persistently target a small number of networks. This phenomenon has previously been observed in large scale alert repositories [20], and is similar in nature to Advanced Persistent Threats [19].
In addition to N, I, and T, this model also accepts an input C: a distribution measuring the number of networks targeted by each attacker.
To augment hosts with this malicious behavior, LESS first groups all hosts into networks of size between 2 and 128, chosen uniformly at random. It then selects N host agents uniformly at random, and marks them as targeted attackers. For each attacker, LESS draws a value c from C, and then randomly selects c networks for the attacker to target. Finally, at time T, the host agents marked as targeted attackers begin running the follow traffic generation algorithm:
Select a target network from the list of targeted networks assigned to this host agent.
Select a host in that network uniformly at random.
Initiate a connection to the selected host agent.
Select an inter-attack time from I. At time current time + selected time, repeat from step 1.
P2P botnet communication model. The last model simulates a network of infected hosts communicating in a peer-to-peer overlay network, which increases botnet resilience [16].
In addition to N, I, and T, this model also accepts an input G: a graph generation algorithm.
To augment hosts with this malicious behavior, LESS selects N host agents uniformly at random to mark as bots. Next, the simulator uses G to generate an overlay graph O, connecting all of the bots. Finally, at time T, the host agents marked as bots begin running the following traffic generation algorithm:
Select a bot to communicate with by choosing one uniformly at random from the host agents that the given bot shares an edge with in O. Initiate a connection with the selected host. Select an inter-communication time from I. At time current time + selected time, repeat from 1.
Assigning host agents to autonomous systems
Next, LESS assigns each host agent an autonomous system number using weighted random selection, where the weight of each AS number is proportional to the size of the real AS identified by that number. In our experiments, we used the number of address prefixes announced by the AS as the weight metric, as reported in the publicly available data set at [36].
Executing the simulation
After generating the host agents and augmenting them with background and malicious behavior processes and AS numbers, LESS signals the host agents to begin their behavior processes. To communicate with each other during the simulation, host agents interface with a centralized routing process that computes and logs the paths between the ASes assigned to each pair of communicating host agents. LESS’s routing process finds the shortest valid path between the host’s AS’s in a link-annotated AS relationship graph. Such graphs, where AS to AS links are annotated with their relationship (i.e. peers or customer-provider), are periodically assembled by CAIDA [36], and annotated using techniques such as [11]. We use the definition of a valid path provided in [11], as a path with 0 or more customer to provider edges, followed by 0 or 1 peer-to-peer edges, followed by 0 or more provider to customer edges. This notion of a valid path is economic in nature, based on the observation that in order for traffic to get from one host to another, each link must have both a payer and payee, or be a peering link; and also based on the observation that backbone ISPs all peer with each other, limiting the number of peering links on an AS level path to 1.
LESS logs the activities of host agents and generates records containing the timestamp, destination, and application involved in each inter-host communication event, as well as the AS level path between the respective communicating hosts.
LESS is currently a single threaded application written in Python, and maintains event ordering using a queue. We have found this sufficiently fast (i.e. each of our trials finishes in under an hour on an Intel i7 laptop); however, since host agents make decisions autonomously, we believe LESS is well suited to multi-process scaling.
Evaluation
In this section, we analyze the four previously discussed large scale network security systems using LESS. We present two types of results, reproduced results that validate parts of the original evaluations of these systems, but in simulations modeling data sets different than those used to originally evaluate the systems, and extended results that apply simulation to go beyond the original evaluations. These results serve multiple purposes. First, they validate LESS, demonstrating that it is capable of evoking realistic performance from large scale security systems. Second, they extend the evaluations of the studied systems and demonstrate how LESS can be used to complement existing analysis methods and study the reproducibility of large scale network security system results in different deployment environments and locations.
We summarize our experimental setup in Section 5.1, discuss results for each of the four systems in Section 5.2 through Section 5.5, and summarize the highlights of our experiments with LESS in Section 5.6.
Table 1 lists the parameters we tuned LESS with in all experiments, unless otherwise noted. LESS derives configurations for background traffic generation from 60 seconds of CAIDA’s anonymized 2012 Internet survey [7], a trace containing approximately
To compare results from LESS based simulations with original results, we converted graphs from the original evaluations into numeric data with the Plot Digitizer tool [26]. All plots in this section labeled Original are based off of this digitized data.
A summary of the ASes modeled by LESS based on the taxonomy and statistics provided by [11]
A summary of the ASes modeled by LESS based on the taxonomy and statistics provided by [11]
For our topology dependent experiments, we derived an AS weight mapping from AS statistics collected in [11], and used publicly available AS relationship graphs from the ongoing CAIDA AS relationships study [36]. Table 2 summarizes the ASes in the data, based on AS classifications and statistics from [11]. The AS classes in this data set include:
Enterprise ASes, or large edge networks that interconnect individual organizations;
Educational ASes, or ASes connecting universities to the Internet, usually larger than enterprise class AS networks;
Network Information Centers (NICs), or ASes hosting servers with critical network infrastructure on them such as DNS;
T2 ISPs, or small Internet transit networks;
T1 ISPs, or large Internet transit networks and Internet backbone ASes.
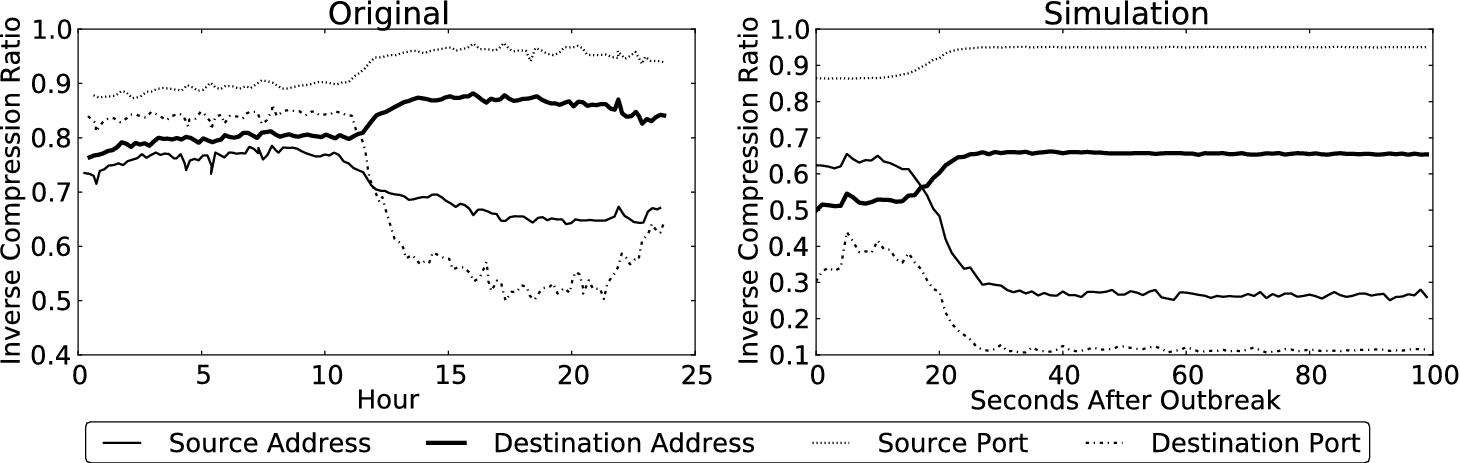
Original entropy detection results from [37], and entropy detection results in a LESS simulation.
Wagner and Plattner tested their entropy based method for detecting large scale security threats on a trace collected during the Code Red [24] worm outbreak. We were able to produce similar results using LESS and the random worm outbreak model with the following parameters:
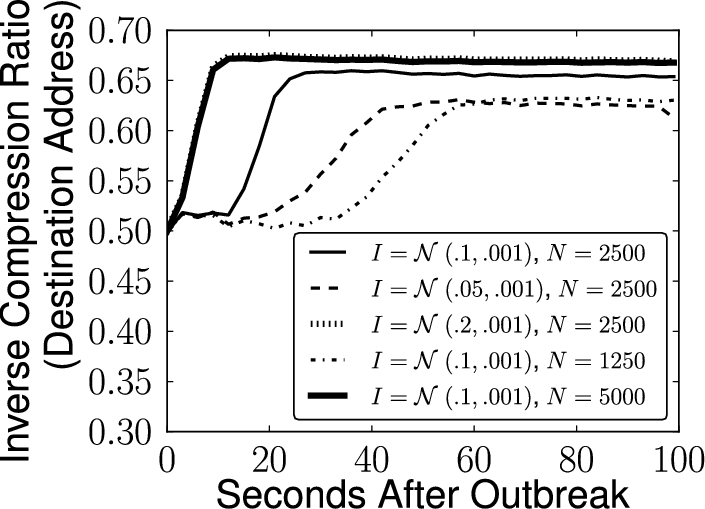
Extending the results of [37] with LESS, by measuring the technique’s sensitivity to different worm outbreak behaviors.
There are several quantitative differences between the results. First, the simulated outbreak reached the maximum entropy more quickly, due to the shorter time scale of the simulation. Second, the baseline entropy values differ significantly. We validated that the baseline entropy values in the simulated experiment corresponded to the average entropy values from our source CAIDA trace.1
Average source IP entropy: 0.6133, average destination IP entropy: 0.5618, average source port entropy: 0.9289, average destination port entropy: 0.3518.
The quantitative differences illustrate that LESS is useful for reproducing initial large scale network security system results when additional data sets cannot be obtained. By deriving the traffic model from a recent CAIDA provided trace, we were able to investigate how a system proposed when background network conditions were significantly different would perform in a present-day scenario.
Another important benefit of simulation in this domain is the ability to evaluate large scale security techniques under different threat conditions. Figure 3 shows the results of a set of experiments where we used LESS to compare the destination IP address entropy rate during the outbreaks of worms with different average scan per second rates (I) and vulnerable population sizes (N). Scan rate and vulnerable population size both increase the entropy rate and make the change more sudden. However, according to our simulation there is an upper bound on both the maximum entropy rate and how rapidly the change can occur.
We also found that how quickly the system detected a worm outbreak depended on which AS it was deployed at, and that detection time was strongly correlated with the AS’s class. Figure 4 shows how soon after the outbreak ASes from each class detected a 25% change in the entropy of different traffic features, on average. The AS classes that corresponded to larger networks detected the outbreak more slowly, because they carried traffic that was from a large number of hosts and thus more random; this was especially true for ASes that corresponded to transit networks (i.e. T1 and T2 ISPs).
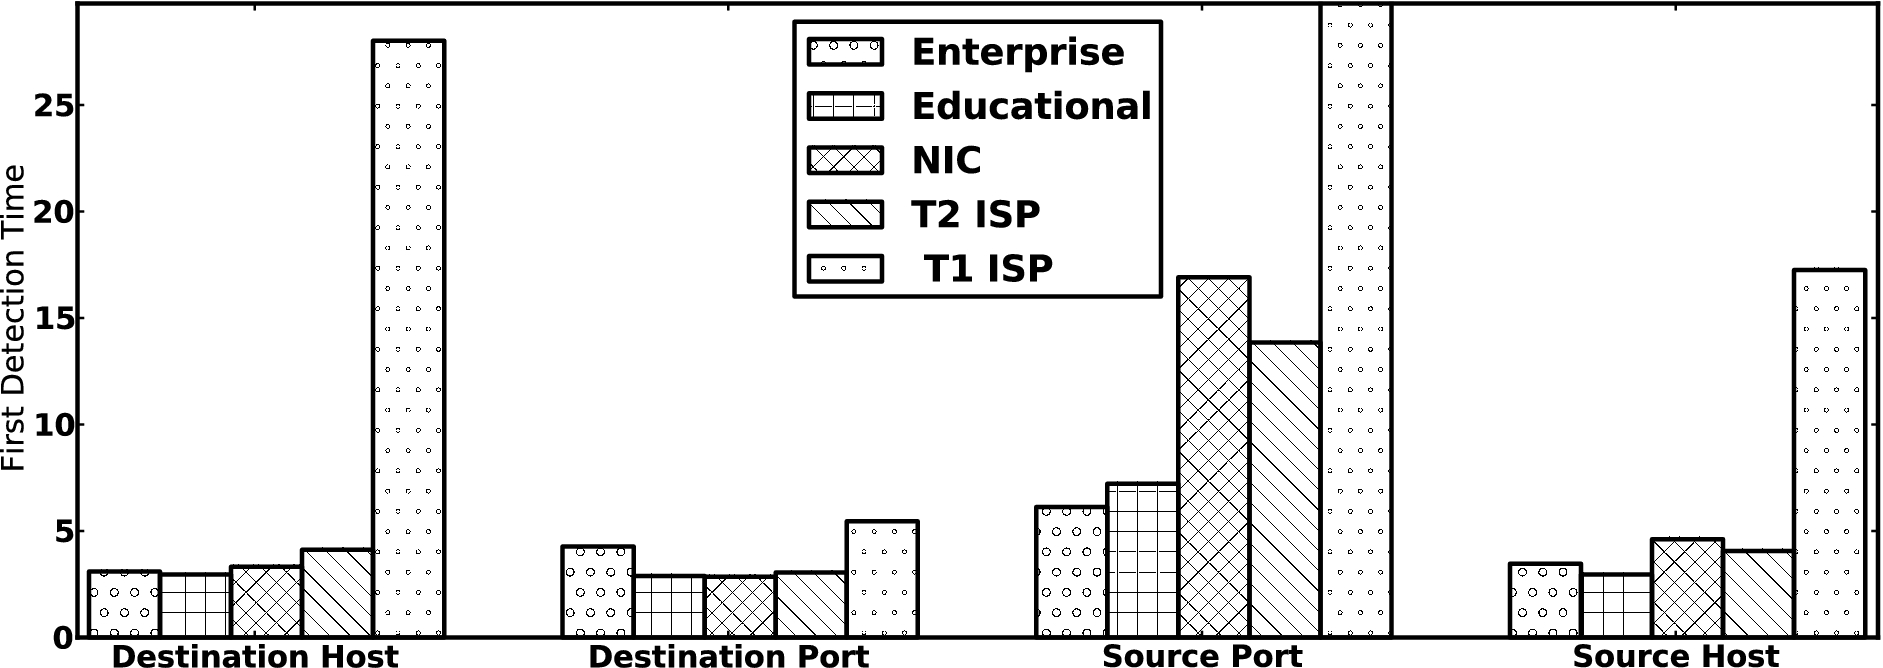
How quickly different classes of ASes detected the worm outbreak, using the entropy based anomaly detector [37], on average.
Average p-values for entropy measurements taken after alerts were generated, at different classes of ASes (standard deviation of p-values in parenthesis)
We also measured the confidence of potential anomaly alerts generated by different classes of AS networks, by comparing the entropy levels observed after the threshold was reached at each AS with the entropy levels observed before the threshold was reached. Specifically, we modeled the entropy levels before the alert with a normal distribution, and then computed the average p-value of measurements taken after the alert, with respect to the pre-alert distribution. Table 3 summarizes the p-values observed by the ASes in each class. A low p-value corresponds to higher statistical confidence in the alert’s claim that the entropy level no longer fits the previous distribution. The AS classes that correspond to transit networks produced alerts with lower p-values and thus higher significance. Based on our results, there is a trade-off with respect to the placement of the entropy detector: when placed at smaller ASes on the edge of the Internet, it can detect quicker, but when placed at transit and core Internet networks, it can detect more confidently.
Zhang et al. compared the performance of blacklists generated using their HPB system to blacklists generate using a baseline GWOL system by measuring blacklist hit rates, or the number of IP addresses blocked/the length of the blacklist. They used data from the Dshield repositories for their experiments, so to re-evaluate their system we configured LESS using statistics about Dshield repository logs measured in [20]. We selected values for C, the target count distribution, and I, the inter attack timing distribution, based on their measurements. We used the first half of generated records as input to the blacklist generators, and tested the resulting blacklists with the second half of the generated records.
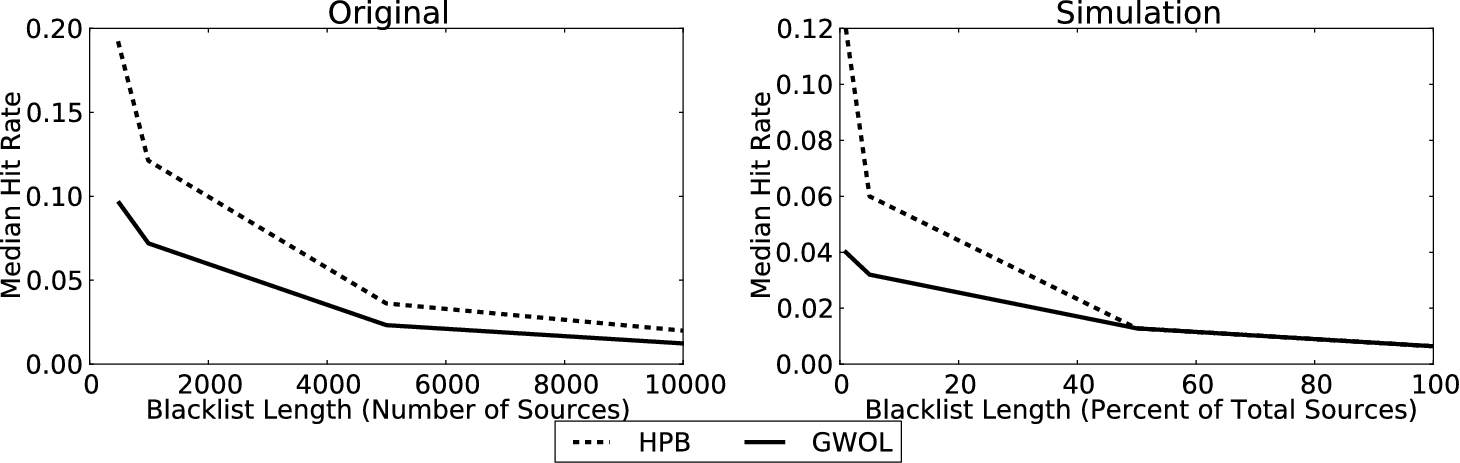
Predictive (HPB) and Global (GWOL) blacklist hit rates as blacklist length increases, from the original HPB evaluation [40], and simulation experiments with LESS.
Figure 5 shows the median hit rates for blacklists generated by the HPB system, and the baseline GWOL alternative, as blacklist length varies, for both the original evaluation and our simulation based re-evaluation. The relative difference between HPB blacklists and GWOL blacklists were similar in both the real and simulated data sets. However, there were quantitative differences: the scale of the hit rates for both types of blacklists were different, and the blacklist hit rates converged sooner in simulation. We believe that there are two primary causes for these differences. First, our simulation likely differed with respect to the number of attackers, as we were unable to determine how many attackers the original data set contained. Blacklist hit rate is very sensitive to this parameter, as it directly affects the number of attacks a network is likely to observe. Additionally, our parameters were derived from measurements of the DShield repository taken approximately 3 years before the HPB system was proposed; the threat landscape, and likely DShield itself, has changed significantly in that time.
Qualitatively, however, our results reproduced the original analysis, but in a simulation modeling different sets of data that were not previously used to evaluate this system. Reproducing these results in a different environment would be very difficult without simulation, given the scale of data needed for these experiments.
We extended the evaluation of HPB by studying the detection rate (i.e. percentage of attackers detected by a blacklist) and false alert rate (i.e. percentage of non-attacker hosts that the blacklist generates alerts for) of generated blacklists. Figure 6 illustrates an experiment where we varied the number of false alerts provided to the HPB and GWOL generators, and measured the true and false positive rates of the resulting blacklists. In our experiment, the HPB system was much more robust against inaccurate input than the GWOL system: as the number of input false alerts increased, the false alert rate of HPB generated blacklists increased much more slowly than the false alert of GWOL blacklists. Based on additional analysis, we believe that this is due to the predictive nature of HPB: when inaccurate input causes a non-malicious host to appear on a blacklist, it only appears on the blacklists of a few networks that the host is correlated with; on the other hand, the GWOL system generates one blacklist for all networks, so each “mistake” caused by inaccurate input affects the blacklists given to every collaborating network.
Although this experiment was straightforward to perform with LESS, it was impossible using the original data set, which is composed of IDS alert logs that lack sufficient information to determine the true maliciousness of the hosts that caused alerts.

Extending [40] with LESS: the true and false positive rates (TPR & FPR) of blacklists as the false positive rates of input IDSes varies.

AS size vs. average difference between HPB and GWOL blacklist hit rates.
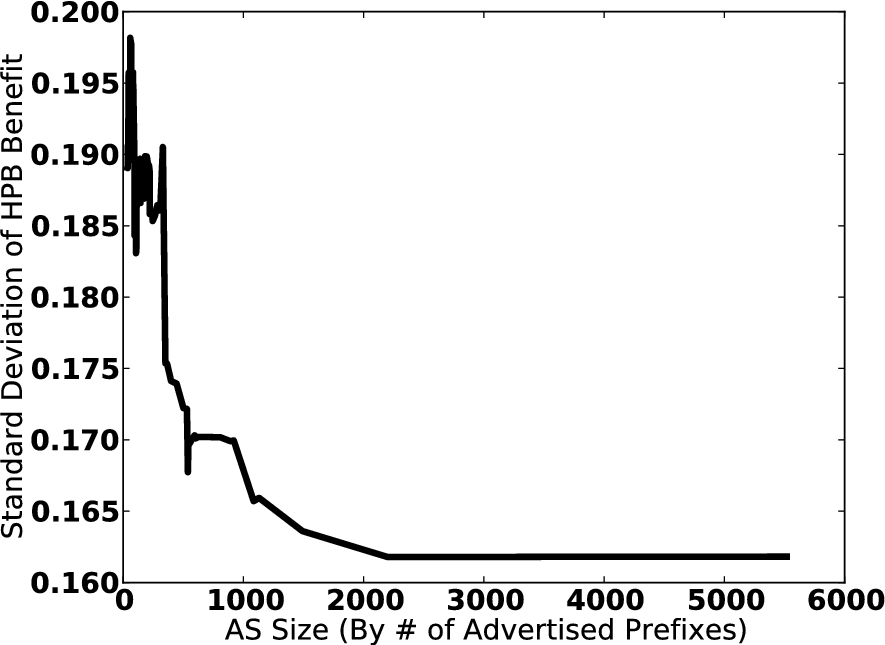
AS size vs. rolling standard deviation of difference between HPB and GWOL blacklist hit rates.
We further extended the evaluation of HPB by using the topological modeling of LESS to simulate a scenario where each AS network submitted logs to the HPB and GWOL systems, and measured the percentage of attackers detected by blacklists of length 100 at the AS networks. Figure 7 plots AS size against the difference between the HPB and GWOL detection rates. Approximately 92% of the networks benefited from using HPB instead of GWOL in this experiment. We observed no significant correlation between AS class and detection rate for either type of blacklist, and no statistically significant correlation between AS size and benefit of using HPB over GWOL. However, we did find a significant correlation between AS size and standard deviation of benefit. Figure 8 plots AS size against the rolling standard deviation of difference between HPB and GWOL detection rates: an x value in this graph is an observed AS size, and the corresponding y value is the standard deviation of HPB-GWOL rates across the AS and the 100 next smallest ASes. Although larger networks did not obtain greater benefits from using HPB over GWOL, they were more likely to obtain the expected benefits.
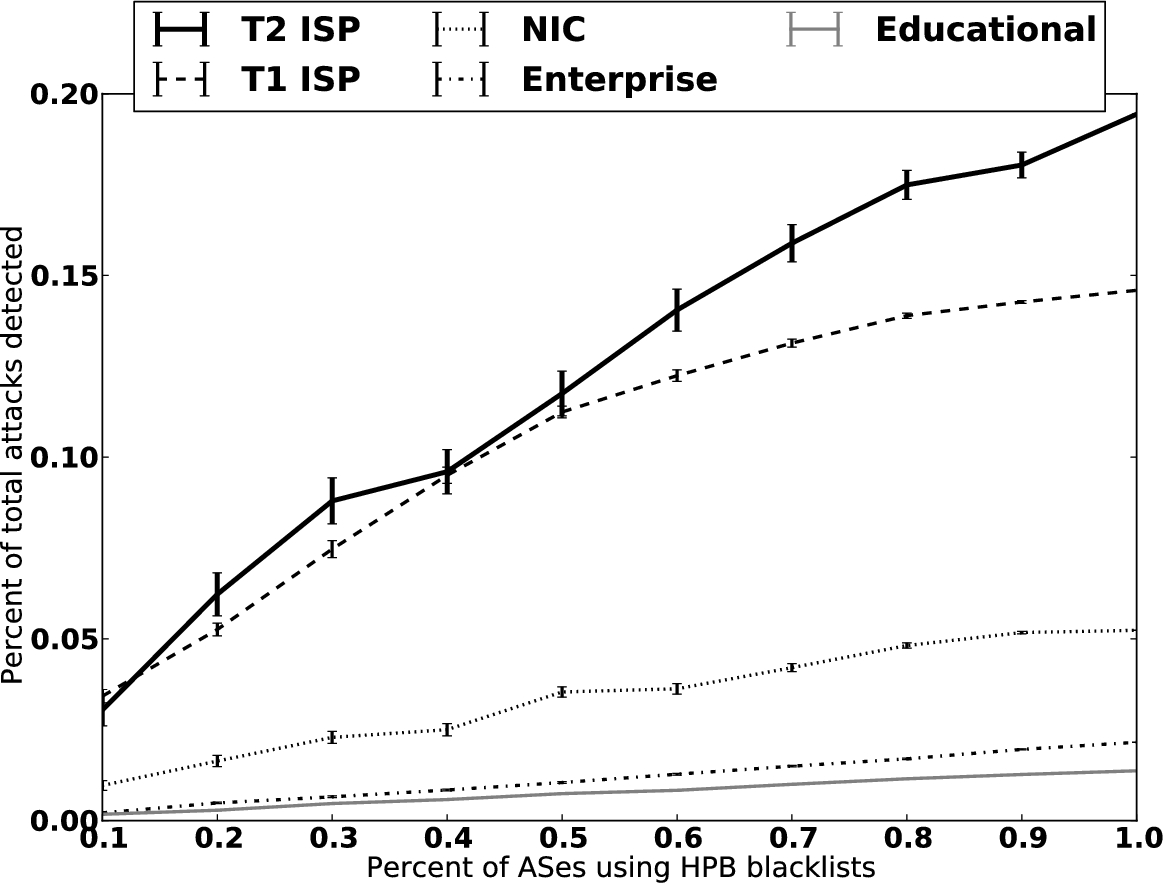
Percentage of ASes participating in HPB (by class) vs. percentage of attacks observed, globally.
We also measured the percentage of attacks detected when different numbers of ASes used HPB, by performing experimental trials where we selected between 10% and 100% of the ASes in each AS class. In each trial, we submitted the flows observed by the selected ASes during the training period to HPB, and then measured the percentage of total attacks detected when the selected ASes deployed HPB blacklists during the testing period. Figure 9 plots the average global detection rates as the percentage of ASes randomly selected varied, for different classes of ASes. Each average is across 200 trials, and the error bars show the standard errors for each trial set. In our experiment, the transit networks (T2 and T1 ISPs) detected a significantly larger percentage of the total attacks, for two reasons: first, transit networks observed more attacks during the training period, and so the HPB system was able to more accurately predict which attackers were targeting which networks; second, the transit networks also observed a larger percentage of the flows sent during the testing periods, thus blacklists deployed there detected more attacks. The T1 ISPs offered the most benefit per deployment location. On average, HPB was able to generate better blacklists using the data from one T1 ISP than data from all of the NIC, enterprise, or educational ASes. Further, approximately 100 T2 ASes needed to use HPB to detect the same percentage of attacks as a single T1 AS, on average. However, if a significant percentage of T2 AS networks used HPB, they obtained a detection rate higher than any other class of AS because many attacks traveled through one or more T2 ISPs without traversing a T1 ISP.
Coskun et al. evaluated their peer-to-peer botnet detector with traffic from approximately 900 Nugache bots grafted into a 24 hour trace collected at the border of a university network containing approximately 2000 active hosts.
To evaluate this system with LESS, we used the peer-to-peer malicious traffic model to augment 904 host agents with malicious behavior. We set the malicious timing distribution
We then replicated the original experimental procedures with the generated data set, selecting M of the 904 agents augmented with the bot behavior at random, to act as the bot nodes in the simulated evaluation network, and

Number of bots and non-bots detected by the system proposed in [10], in the original evaluation and our LESS based re-evaluation.
Figure 10 shows measurements taken in both the original re-evaluation, and our re-evaluation with LESS, of the number of bot and non-bot hosts detected by the system as M, the number of bots grafted into the trace, varied. Despite our background traffic being modeled after data collected from a different network, our results were very similar to the original results, suggesting that their approach would generalize well to other networks.
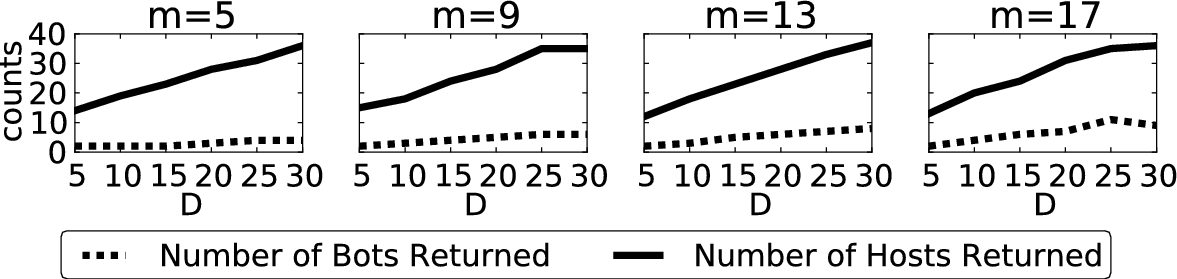
Extending [10]: evaluating the performance of the botnet detector as bot structure, parameterized by (D), varies in LESS simulations.
We also extended the results from the original evaluation, by analyzing the technique’s performance as D changes. Figure 11 shows how the number of bots detected and number of hosts returned change, for different M values, as D varies between 1 and 21. This result demonstrates that the density of the botnet communication overlay graph has a large effect on the effectiveness of the system: as the density decreased, so did the accuracy of the detection technique, particularly for larger M values.
Also, this result demonstrates that LESS allows researchers to work backwards from a published result to determine properties that the underlying data set is likely to have. As an example, in our preliminary research with the bot detection technique, we first generated botnet communication graphs using preferential attachment [3] and Erdos and Renyi [14] models, based on previous results that suggested these models fit peer-to-peer overlay networks. However, we found that these models led to less accurate reproduction of the original results, leading us to conclude that the random regular graph generation algorithm is a better fit for the communication network of the Nugache bots used in the original evaluation.
Boggs et al. tested their proposed cross-domain anomaly detection technique on a small deployment involving 3 HTTP servers located at different administrative domains. Using LESS, we examined the potential for larger scale deployment of a similar correlation technique. We implemented a simple threshold based anomaly detector, that monitors all the hosts in a network and generates an alert whenever an external host initiates more than T connections with hosts inside the network in a 1 second period of time. Each network determines T independently, by measuring the distribution of external to internal connections per second in a training data set, and then setting T to the 75th percentile value.
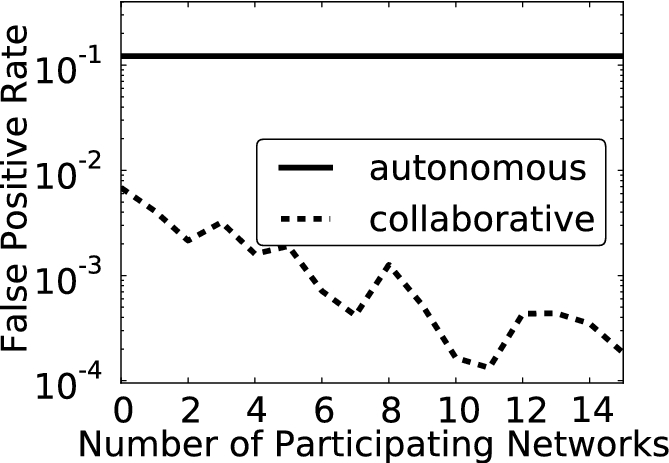
Extending [5]: evaluating the benefit of cross-domain collaborative anomaly detection when used at scale, in a LESS simulation.
For this experiment, we ran LESS with the worm outbreak model and parameters set to
The benefits of collaboration increase very rapidly, with orders of magnitude fewer false alerts when under 20 networks participate in the collaborative system, suggesting that even a small deployment would have large benefits. There are many other questions about collaborative defense which we do not address here due to space constraints (e.g. who should collaborate? what kind of information should collaborators share? how does scale affect detection rate?). Such questions are relevant to all the systems we have studied. LESS allows researchers to explore these issues, without facing the often impossible challenge of acquiring a large scale data set, or data sets from many different administrative domains.
Below, we summarize highlights of our experiments with LESS.
Qualitatively Similar Results All of the large scale security systems performed qualitatively similar in both the original evaluations, and the LESS evaluations, when LESS was tuned with parameters that reflected the original evaluation scenarios. This validates LESS and also confirms the reproducibility of the original evaluations. Simulation Reveals New Sensitivities By tuning the simulation parameters of LESS, we found unreported factors that influenced the effectiveness the systems. The Entropy Based Worm Detector took over 4 times longer to detect worms that scanned more slowly and targeted fewer hosts (Fig. 3). The Highly Predictive Blacklisting System was robust against false alerts, but the Global Worst Offenders heuristic for generating blacklists amplified the effects of false alerts (Fig. 6). Sparsely connected botnets greatly reduced the accuracy of the Peer-to-peer botnet detector (Fig. 11). Finally, the collaborative anomaly detector produced orders of magnitude fewer false alerts when more networks collaborated (Fig. 12). Bigger is not Always Better Analysis with LESS suggests that deployment location can provide a trade-off between reaction time and detection confidence. When the Entropy Based Worm Detector was placed at smaller ASes on the edge of the Internet, it could detect quicker, but when placed at transit and core Internet networks, it could detect more confidently (Fig. 4 and Table 3). Incentive to Collaborate We found that the Highly Predictive Blacklisting System benefited networks of all sizes (Fig. 7), suggesting that most network operators have incentive to participate in collaborative defense. However, we also found that high detection rates were difficult to achieve without the participation of larger networks (Fig. 9), demonstrating that their participation can be critical to the success of a collaborative defense system.
Discussion
In this section, we discuss current limitations and potential extensions to LESS.
Long term temporal dynamics and system evolution. LESS only takes short term temporal properties into account, such as flow inter-arrival time. However, the Internet is a dynamic, evolving network: new hosts connect to it and network applications are launched; hosts change IP addresses and networks; and user behaviors follow diurnal patterns [15]. These, and other long term dynamics, could potentially affect the performance of security systems. By integrating evolutionary network models [12] and parameters that describe longer term dynamics into host agent models, LESS could be used to evaluate their effects.
Flow payloads and packets. LESS is designed to evaluate network security systems that do not analyze traffic content or payloads, and so LESS does not generate traffic records that contain these details. However, LESS hosts’ traffic generation processes could be augmented with payload and packet generation techniques such as [38]. This would allow LESS to evaluate a broader class of security systems, and provide a platform to investigate the benefits of large scale collaboration and data sharing for security systems that inspect content.
Scalability and testbed integration. Our current implementation of LESS is single threaded. However, each host agent behaves autonomously, deciding, on its own, when to generate traffic and which other host agents to communicate with. Due to the decentralized nature of this process, LESS’s architecture is well suited for deployment on a physical or virtual testbed [22,28]: each device, or simulated device, would simply execute one of the agent based models generated by LESS. This would allow LESS’s modeling approach to test in-line network security software that processes packets and flows as they pass through the network. It would also distribute the workload across multiple processors, which could reduce the time taken to execute a simulation.
Additional malicious models. The malicious models that we described in this paper can be used as templates to build many other additional models of malicious traffic to load into LESS. For example, our worm propagation model could be extended to simulate hit list worms [23] that pre-select victims before propagating. Each host agent marked as vulnerable to the attack would receive a copy of the hit list, which it would then use to select targets. As another example, the botnet model could be extended to simulate botnets that communicate via non peer-to-peer networks (e.g. the web), by using a different graph generation algorithm, such as the Barabas`i and Albert model [3], which can generate graphs representative of standard web based communication. Future attack models could also be multi-staged, for example to simulate drive-by-downloads that propagate from web servers [27], or botnets that perform DDoS attacks.
Traffic mixture models. LESS currently uses a simple heuristic to select which applications each host agent uses that does not take inter-application correlation into account. In practice, some combinations of applications are more likely than others. Extending LESS to account for this could produce more realistic results, particularly if LESS was extended to generate traces with full packet payloads, or modeled attacks that were closely correlated with the use of specific applications.
Conclusion
Large scale and collaborative security systems demonstrate great potential. However, scale also presents data related research challenges. Although simulation is an effective tool for overcoming these data challenges in non-security domains, existing simulation tools are not well suited to evaluating large scale security systems. We propose a simulator designed specifically for the large-scale security system domain, LESS, which generates host agents, configures them with stochastic behavior processes, models the AS level topology that connects them, and monitors their activities throughout simulations to collect experimentation data sets. Although LESS generates synthetic data, it does so based on real data sets and previously published high level statistics. We validated LESS by using it to reproduce results from previous evaluations of four large scale network security systems. We also used LESS to gain insight into reproducibility issues related to how sensitive the systems were to both environmental parameters and deployment location. We believe that LESS, and future specially designed simulation tools, can greatly assist researchers in improving and understanding the reproducibility of their large scale network security system results.
Footnotes
Acknowledgments
This material is based upon work supported by the National Science Foundation Graduate Research Fellowship under Grant No. 1406177 and Grant No. 1406225. Any opinions, findings, and conclusions or recommendations expressed in this material are those of the author(s) and do not necessarily reflect the views of the National Science Foundation.