Most past work on honeypots has made two assumptions: (i) they assume that the only defensive measure used is a honeypot mechanism, and (ii) they do not consider both rational and subrational adversaries and do not reason with an adversary model when placing honeypots. However, real-world system security officers use a mix of instruments such as traditional defenses (e.g. firewalls, intrusion detection systems), and honeypots form only one portion of the strategy. Moreover, the placement of traditional defenses and honeypots cannot be done independently. In this paper, we consider a Stackelberg-style game situation where the defender models the attacker and uses that model to identify the best placement of traditional defenses and honeypots. We provide a formal definition of undamaged asset value (i.e. the value that is not compromised by the attacker) under a given defensive strategy and show that the problem of finding the best placement so as to maximize undamaged asset value is NP-hard. We propose a greedy algorithm and show via experiments, both on real enterprise networks and on ones generated by the well-known network simulation tool NS-2, that our algorithm quickly computes near optimal placements. As such, our method is both practical and effective.
There has been a tremendous amount of work on the design and placement of honeypots to protect enterprise networks [5,37,42]. At the same time, there has been a great deal of work on the use of game theoretic models for protecting enterprises [3,17,29,30,39,49].
In this paper, we consider a first step towards what we call hybrid adversarial defense. There are obviously multiple ways in which we can defend an enterprise. Examples include honeypots as mentioned above, but also include more traditional defenses such as multilevel access control, firewalls, and intrusion detection systems. Past efforts on the placement of honeypots within a network have two major drawbacks.
First, they largely assume that honeypots are the only form of defense. This was a reasonable assumption to make in early works. But in the real world, honeypots form one part of an ensemble of defenses. These traditional defenses include firewalls [4], intrusion detection systems [28], and mandatory access control schemes [35]. In this paper, we present a unified framework in which traditional defenses can be seamlessly deployed in conjunction with honeypots.
Second, most past work on honeypot placement [5,37,42] does not model the attacker’s behavior – even though there has been much work in security in general on modeling the behavior of intelligent attackers [17,30,49]. In this paper, we present a mathematical model of an attacker who seeks to maximize the (expected) damage she causes. The model is capable of taking various possible attacker behaviors into account – for instance, it can consider attackers that seek to minimize the likelihood of discovery. Based on this, we identify methods to simultaneously place both honeypots and traditional defenses in the presence of an attacker model.
The framework presented in this paper overcomes these drawbacks of past work and, to our knowledge, is the only work that identifies a mechanism to optimally place both traditional defenses and honeypots in the presence of an attacker model. Of course, others have developed other types of intelligent attacker models in other cybersecurity contexts [17,30,49].
Moreover, the framework allows modeling subrational attackers that do not behave in a fully optimal way, i.e. they do not carry out attacks that maximize their utility, and unskilled or unexperienced defenders that act suboptimally in the detection process, i.e. under- or over-estimate the likelihood of detecting attacker actions. Our framework proves to be robust in providing appropriate defenses even when dealing with subrational attackers and unskilled defenders.
The paper is organized as follows. Section 2 starts off with an analysis of past work in this area. We provide an initial set of definitions about the environment in Section 3 – this section introduces the notion of an enterprise network and a system vulnerability dependency graph from past work [41]. Section 4 defines the important concept of an Attacker Belief Evolution Tree which captures how the attacker’s beliefs about the network change with time and analyzes the attacker’s behavior. Section 5 then develops the technical material explaining how the defender strategy is formulated, i.e. where the defender chooses to simultaneously place traditional defenses and honeypots so as to minimize the maximal expected damage the attacker can cause. We also show that this problem is NP-hard. Section 6 develops an exact algorithm (H_Exact) which solves the optimization problem exactly – but of course, this is a time consuming algorithm. We therefore develop the polynomial-time H_Greedy algorithm. Section 7 reports the results of detailed experiments showing that H_Greedy reflects significant run-time savings compared to H_Exact. In addition, we show that in practice, H_Greedy delivers placements of traditional defenses and honeypots that are near optimal, typically well over of the optimal value. In conclusion, our proposed framework provides theoretically grounded and practically deployable mechanisms for use by system security officers.
Related work
The problem of defending enterprise networks is well studied in the literature from a wide variety of perspectives. We will evaluate past work from three perspectives: (i) Does the work consider honeypot placement together with the installation of traditional security software? (ii) Does the work include an attacker model? (iii) Can the model take into account the tendency of the attacker to reduce the probability of discovery? Table 1 shows past work and the criteria they fulfil. The reader can readily see that the only work satisfying all three criteria is the current paper.
One body of work studies automatic patching of vulnerabilities, and when this is not possible, the extreme solution is the deactivation of products containing vulnerabilities (see [41]). [12,13,36] consider the problem of finding plans for patching vulnerabilities, that are tradeoffs between cost and risk, by using Pareto analysis. No honeypots are considered. [13] also defines a problem involving a game theory-based solution which assumes that the attacker does not know the strategy of the defender (in our paper, we assume that the attacker can potentially detect the defender’s strategy through one or more network scan operations, which is consistent with the way attackers maneuver through the network). Moreover, they do not consider deception via the intelligent placement of honeypot nodes.
Much work has been done on honeypot networks. A comprehensive report about existing implementations [37] analyzes and compares the advantages and the weaknesses of several implementations. Many of these are able to emulate the honeypot network on just one machine as opposed to an enterprise network. Though this solution is less expensive than generating real honeypot nodes, the attacker who probes the network can easily detect fake nodes. Moreover, honeypots that look too vulnerable might raise the suspicion of attackers. Therefore there is a need to strategically deploy a honeypot network that carefully considers attacker behavior. One example is related to data leakage, i.e. the distribution of private data to unauthorized entities (a survey can be found in [42]). In [5], fictitious data called “honey tokens” are automatically generated, then verified through a Turing test to determine if a human (in this case an attacker) will be able to recognize them as honey tokens or not.
The use of game theory in cybersecurity is not new [29,41]. For instance, [20,23] study different game models that address strategies for deploying honeypot networks. They define basic honeypot selection games where the defender chooses the properties of the network, plus an extension where the attacker can also probe the network, and a final version where the attacker strategies are represented by an attack graph. These game models make restrictive assumptions such as the perfect rationality of the attacker. Moreover, they assume that honeypots are the only defensive mechanism used. [10] analyzes a game framework to evaluate the identification time of a decoy node w.r.t. a real one. In particular they study the benefit of randomizing the space of node IPs (when the specific application allows this option) on the detection of decoy and real nodes. [38] presents a dynamic model capturing progressive attacks on a computer network. They define a supervisory control problem with imperfect information, modeling the computer network operation by a discrete event system and provide the best policy for the defender. A similar but more general optimal control approach (not only based on a computer network) focused on information security is provided in [44]. For a complete and vast survey about game and network security, see [30].
[43] highlights the importance of honeypot networks not just for the ability to attract the attacker but also to delay her. They define the concept of distraction chains, i.e. sequences of decoy systems used to entice an adversary to explore useless information in order to distract her from the real network. They study the problem of creating the distraction chains and embedding them in the network. As in the preceding case, they do not consider the impact of using traditional defensive software along with honeypots.
Moreover, none of the above works considers how the attacker can react in detail. One important tendency today is to spread out attacks over a long period in order to decrease the likelihood to be discovered. This is typical of Insider Threats [11] and Advanced Persistent Threats [6] – our framework can model the tendency of the attacker to reduce the likelihood to be discovered according to her beliefs.
[27] defines a game-theoretic model of the interactions between nodes in wireless networks. Each node is a player with a reputation score – a node can decide whether to attack a neighbor or not, but also decide whether to increase or decrease the reputation scores of its neighbors depending on whether they are malicious or not. Nodes decrease the reputation of other nodes via a rumor algorithm to communicate this reduction to other nodes. If the reputation of a node goes below a threshold, no other devices will provide services to it. The best policies to govern these interactions are captured via an equilibrium. [45] provides a comprehensive review of research combining radio networks and game theory.
In summary, our framework differs from past works because it tries to defend an enterprise network by:
simultaneously adding honeypot nodes and traditional security software in order to minimize the expected damage;
considering much more realistic attacker behaviors than those considered in past work;
modeling each player’s beliefs on the other – for instance, at each action the attacker maintains her belief about the possibility to be detected by the defender, and her whole behavior will be conditioned by this belief;
considering subrational adversaries and situations where the defenders may have widely different skill levels;
providing an efficient approximate solution to the problem of computing the best defender strategy, in some cases with a fixed approximation ratio of . This property makes our work especially effective in situations of “high dynamism” where attacker strategies evolve rapidly and always-new vulnerabilities and patches appear and will be easily known on the (dark) web.
Preliminaries
In this section, we formally define enterprise networks and system vulnerability dependency graphs (SVDGs) – both concepts defined by us previously in [41].
We assume the existence of some universe of software packages and some set of known vulnerabilities – we do not consider zero-day vulnerabilities. Though it may seem apparent that known vulnerabilities should be patched, the actual real world patching behavior of enterprises is astonishingly poor. Different studies have shown different statistics on the time gap between when a vulnerability is discovered and when it is patched. For instance, Infosecurity Magazine lists this time gap as 100–120 days on average.2
Irrespective of which of these numbers is correct, it is clear that these time gaps for patching are too long. CSO Magazine [16] states that patching is difficult for a multitude of reasons including: (i) too many patches are released every day for security officers to handle the load, (ii) legacy vulnerabilities that existed before a given security officer joined an organization cause problems, (iii) the ability to patch certain code is limited to vendors rather than an enterprise and these vendors are not patching the code, (iv) patching often interrupts the smooth 24/7 operation of an enterprise leading to delays. As an example, a patch5
for the CVE-2017-0147 vulnerability was released several months before the infamous WannaCry ransomware of 2017 unleashed considerable damage in the US and beyond – victims of WannaCry had not patched this vulnerability. In general, there exist many vulnerabilities that are not patched or cannot be patched in enterprise systems.
A software vulnerability mapping associates a set of vulnerabilities with each piece of software. We use to denote the impact of vulnerability if it is successfully exploited by an attacker. There are several publicly available databases which capture all of these quantities – examples include NIST’s National Vulnerability Database [34] and their Common Vulnerability Scoring System [31], and MITRE’s Common Weakness Scoring System [32].
(Enterprise Network).
An enterprise network is a triple where N is a set of enterprise nodes, is a set of edges, and is a set of compromised nodes.
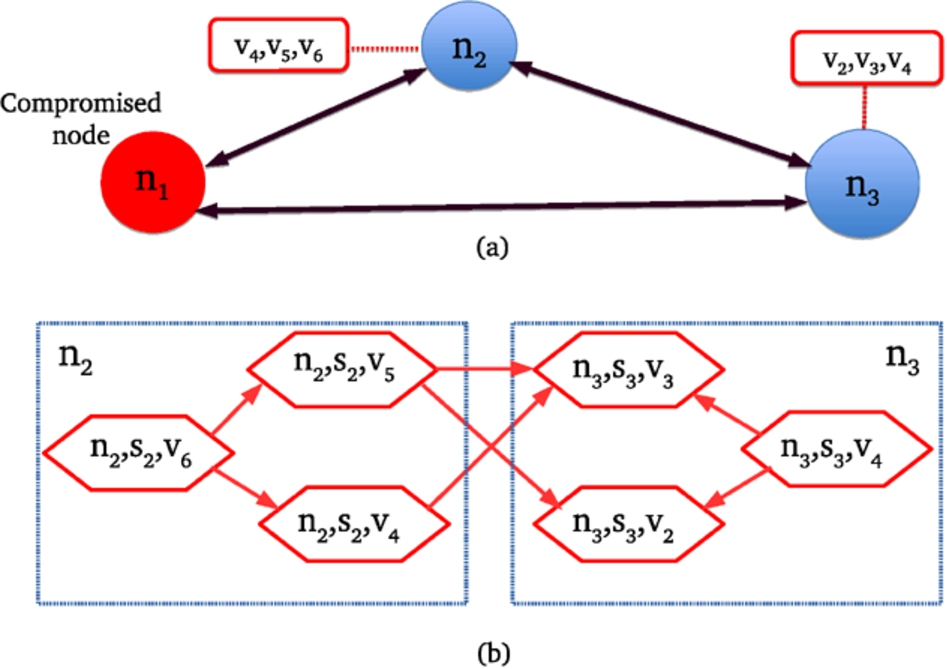
Figure 1(a) shows an example enterprise network which serves as a running example. Here, we have , , and .
A schematic diagram of an enterprise network (a) and a system vulnerability dependency graph (b).
Suppose and are enterprise networks, with . The union ofand, denoted , is the enterprise network .
Attackers frequently attack networks by compromising one node (by exploiting some vulnerability in a piece of code running on that node) and then launching an attack on another vulnerability in a neighboring node (or within the same node). In order to capture this “hopping” behavior, we define the notion of a “system vulnerability dependency graph” (SVDG).
(System Vulnerability Dependency Graph (SVDG)).
Given an enterprise network , a system vulnerability dependency graph is a directed graph where:
is the set of vertices such that if then ;
is the set of edges such that if then .
Intuitively, a vertex means that node n runs software s with vulnerability v, whereas an edge means that once the attacker has exploited v on node n she can then exploit on node .
As said before, NIST’s NVD documents known vulnerabilities in software, which allow us to automatically create the nodes of an SVDG. Attack graphs [19] are a variant of SVDGs and there are several tools to automatically create such graphs after scanning networks.6
https://www.open-scap.org/tools/scap-workbench
Given an SVDG, we use and , respectively, to denote the sets and , respectively.
Fig. 1(b) shows an example system vulnerability dependency graph G built on top of the enterprise network of Fig. 1(a). In this case, we have , and . We also assume that three vulnerabilities , and are present in software in node ; similarly, vulnerabilities , and are present in software in node .
Suppose and are SVDGs, with . The union of and , denoted , is the SVDG.
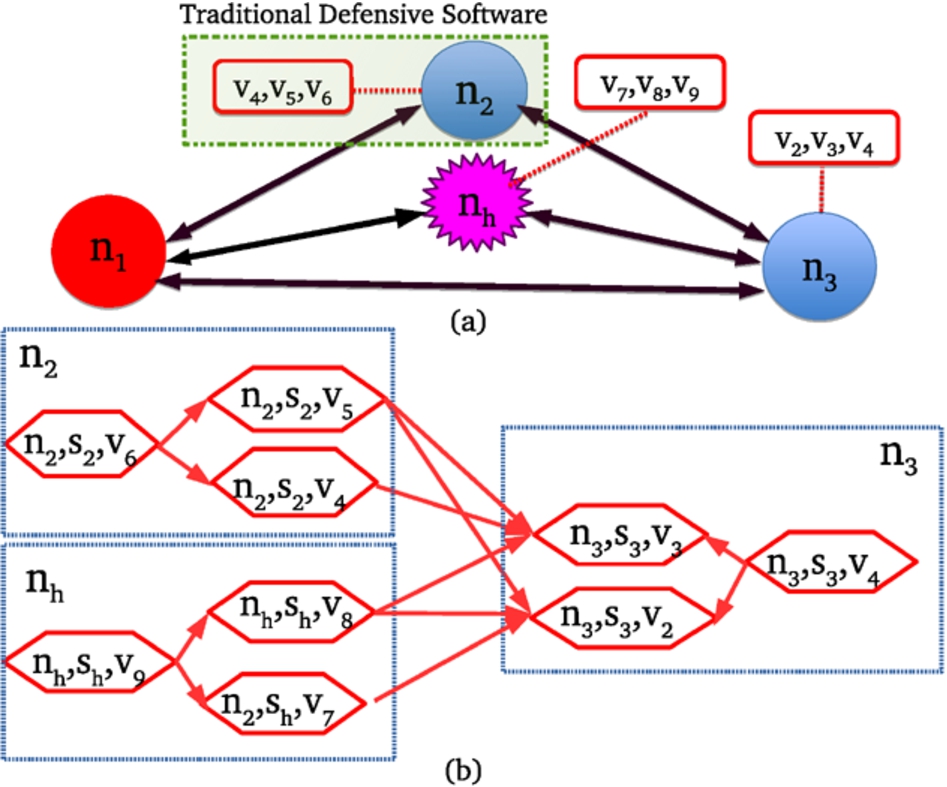
The defender can modify the enterprise network by adding honeypot nodes, as is the case for node in Fig. 2. Obvously, the SVDG associated with an enterprise network changes when changes.
The enterprise network of our running example after the addition of a honeypot node and a traditional defensive software on (a) and the updated system vulnerability dependency graph (b).
We assume that installing defensive software in a node (Fig. 2) will enable detecting any action of an attacker on that node while not changing the topology of the enterprise network and of the SVDG. We will provide more details about deploying traditional defensive software in Section 5.
Table 2 summarizes the notations used in this paper.
Notations used throughout the paper
Notation
Description
Set of software packages
Set of vulnerabilities
Software vulnerability mapping
Impact of v
Enterprise network
SVDG where and
Entire real enterprise network
Entire real SVDG
Attacker state
Valid attacker actions in state
Initial attacker state
Transition from state due to action a
Cost of action a (attacker)
ABET
Vertex of the ABET (level/time l, identity k at level l)
Probability of being detected after the actions in A (attacker)
Total cost of the actions in A (attacker)
Action selection probability (attacker)
Probability of detecting action a (attacker)
Utility of action a (attacker)
Set of honeypot nodes
Honeypot node replicates the connections of node
Defensive strategy, where and
Cost of elements of (defender)
Total cost of the actions in δ (defender)
Defender budget
DABET
Transition probability (defender)
Attacker action selection probability (defender)
Probability of detecting action a (defender)
Damage yielded by action where
Expected damage
Total asset value
Undamaged asset value
CDABET
Analysis of the attacker
Henceforth, and will denote an arbitrary but fixed enterprise network and SVDG, respectively. We assume that the attacker’s set of actions is
Observe that the attacker does not initially know the entire enterprise network and SVDG. She uses her actions to iteratively uncover more about them.
An attacker strategy is a sequence of attacker actions (without duplicates, since scanning the same node twice or exploiting the same vulnerability twice leads to no improvement). However, not all attacker strategies are feasible. For this, we first need to define the concept of an attacker’s state.
(Attacker State).
An attacker state is a triple where A is the sequence of actions taken to reach the state7
As our notion of attacker state is really about what the attacker knows, we include the history of actions A in it so that the attacker can reason about the effects of her past actions.
and and G represent the enterprise network and the SVDG known to the attacker, respectively.
The initial state of the attacker is – the set of actions the attacker has performed is ∅, and the attacker knows an initial network and an initial SVDG. In turn, where (i) is some initial set of entry points that the defender believes the attacker can use, (ii) contains the nodes in together with the nodes accessible from those in the set, and (iii) consists of the obvious edges. We initially set . Starting from this initial state, the attacker can take actions that build up her knowledge of the enterprise network.
(Valid Attacker Actions).
Given an attacker state , the set of valid attacker actions in, denoted , is the union of the following sets:
;
.
Thus, a action is valid if the attacker has not done it before and if she has not already compromised that node. An action is valid only if she has already exploited an triple that allows her to exploit . In addition, she should not have used the specific exploit before.
(State Transition after an Action).
Suppose the attacker performs an action a in state . This results in the state where:
if then , , and where and ;
if then , , and .
Simply put, a scan operation does not change the knowledge the attacker has of the enterprise network, but it allows her to augment her knowledge of the true SVDG because she can identify potential vulnerabilities in the scanned node. In contrast, an exploit action allows the attacker to uncover new nodes in the enterprise network, as well as new edges.
We assume the existence of a function that assigns a cost to each attacker action a. This function may encompass the attacker’s financial costs to carry out an action (e.g. if she has to buy an exploit) or capture her risk of being discovered, or some combination of these factors. For instance, the zero-day exploit reseller Zerodium published the cost of many exploits in November 2015. RAND Corporation published a comprehensive book on exploit prices, not just for zero-days, but also for more mundane attacks (e.g., stolen data) [2]. The MITRE CVE list of the National Vulnerability Database contains “exploitability scores” that describe how difficult it is to exploit a vulnerability – it could also be reasonable to assume that an attacker is aware of this and considers that her costs are proportional to this score. There are also other proposals (see, e.g., [46,47]), however we generally prefer CVE as it considers many different factors, such as the type and number of authentication processes, whether a system is accessible from outside or not, etc. It uses a formula that outputs values ranging between 0 and 10 – many researchers adopt these measures. In addition, MITRE keep improving their measurement method to reflect state-of-the-art attack techniques.
(Valid Attacker Strategy).
Given a maximum cost , a sequence of attacker actions is a valid attacker strategy if there exists an associated sequence of attacker states such that:
, ;
, ;
;
, .
It should be observed that the last condition in Definition 6 requires the attacker to carry out “maximal” attack strategies, in the sense that no further action can be added without exceeding the budget . However, if the attacker is believed to only use up to of her actual budget, we can simply use as the maximum cost in the definition.8
Estimating the total budget of an attacker requires the defender to consider adversaries with deep pockets in some cases, such as those involving big companies or defense departments. On the other hand, a small company with credit card data in their network may need to defend against less sophisticated attackers. We suggest that the maximal cost that the attacker is willing to bear should be anti-monotonic in the cost of mounting a defense to secure the enterprise network and anti-monotonic in the size of the adversary. Several such functions can be written down – note that while this is not a perfect solution, today’s system managers are largely not even attempting to estimate attacker costs.
Attacker belief evolution
We model the interaction between the attacker and the defender using a Stackelberg game that has two players, a leader and a follower. The leader commits to a strategy first, and then the follower optimizes her reward, by considering the action chosen by the leader. In our case, the defender is the leader and her strategy is determined by which security resources should be allocated on the network. The follower, in our case the attacker, given the defender’s configured network, will start to explore the network and exploit the vulnerabilities using a randomized greedy approach that locally maximizes the attacker’s utility – this amounts to exploring a structure called attacker belief evolution tree (ABET, see the remainder of this section). The use of a Stackelberg game also captures the fact that the defender has usually low chances to observe the reaction of the attacker – we can only emulate the strategies of the attacker to decide her best strategy, but once the defender chooses the strategy, it is difficult to observe what the attacker will do. In fact, Stackelberg-style games have been extensively used in both the cybersecurity and physical security literature in such situations. The defender uses a different structure (called DABET, see Section 5) in order to emulate the attacker’s behavior – this structure also takes in account the beliefs that the defender has about the attacker.
We now introduce the notion of ABET that enumerates all possible valid attacker strategies and represents how her belief evolves with time. This belief may or may not be identical to the real probability of detection, since the attacker does not know how well the defender might detect her. In the definition of ABET below, the superscript l denotes the level of a vertex of the tree (which corresponds to timepoint l) and subscript k differentiates the vertices at a particular level.
(Attacker Belief Evolution Tree (ABET)).
An attacker belief evolution tree is a tree where:
Each vertex is a tuple where is the attacker state, is the action that led to that state, represents whether at least one of the actions in has been detected (D) or not (),9
We assume that the detection of an action leads to immediate removal of the attacker.
is the probability of being detected given all the actions taken by the attacker to reach the current state, and is the total cost of the actions taken by the attacker until time l.
The root vertex is .
Each edge is labeled with the action that leads from to .
In an ABET, every vertex with has two children connected through the same action: one with and the other with . More specifically, for every possible action , the tree contains two edges that connect to and to , respectively, with . If any action in is detected, i.e. a vertex has , then the branch of corresponding to that action does not further grow below the vertex.
Suppose represents the probability of the belief held by the attacker that action a will be detected by the defender. This probability can, for instance, be derived from the exploitability score and remediation levels defined in the National Vulnerability Database. We recursively define as follows:
The first condition says that the probability of detecting an action at level 0 in the tree is 0 (as nothing has been done). The second condition says that the probability of detecting an action at level in the ABET is the logical OR of the current action () being detected or a previous action being detected. Here, ⊕ is any triangular co-norm [9] which is a well-known method to merge the probabilities of two events together in order to get the probability of the disjunction (or) of the two events.10
Many possible triangular co-norms exist in the literature. These include: maximum: ; Probabilistic sum: ; Lukasiewicz co-norm: ; Einstein sum: . Though all results in this paper apply to all t-conorms, we will use in all examples in the paper.
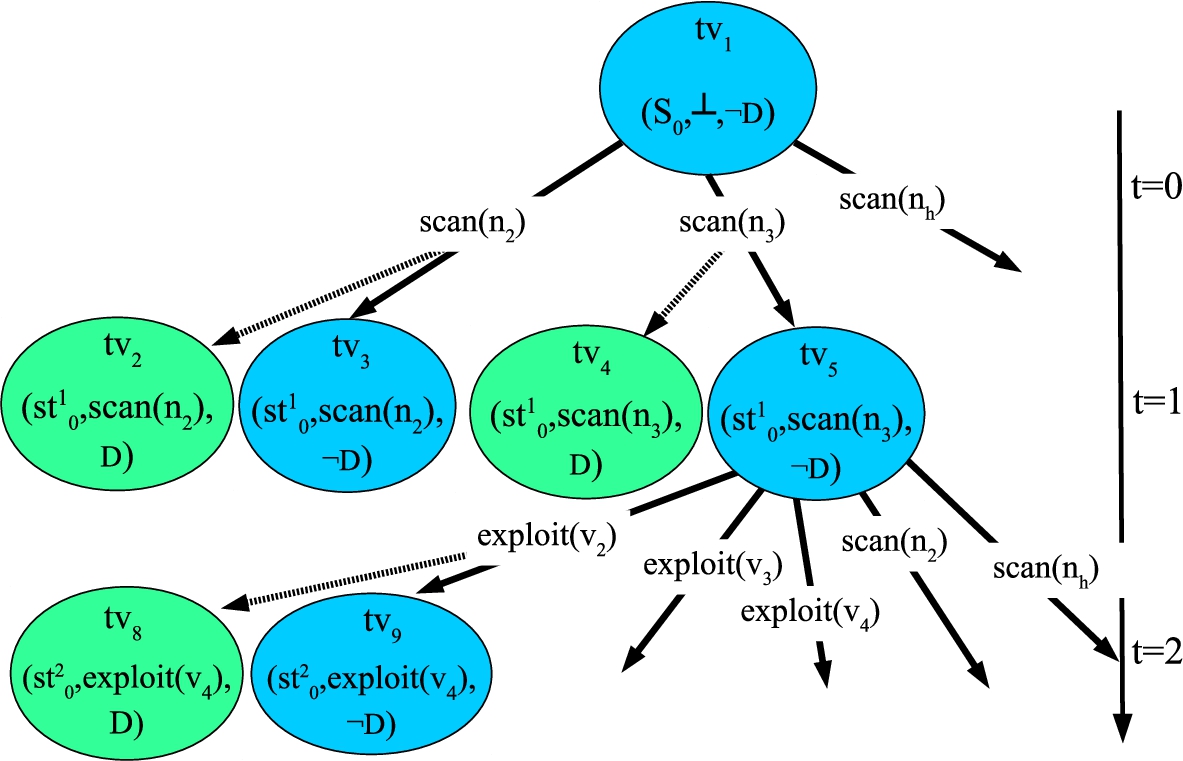
Figure 3 shows the ABET for our running example. In the rest of this paper, when clear from the context, we write as or . Observe that each path from the root (i) corresponds to an attacker strategy and (ii) ends when either at least one of the actions that have been taken till that time has been detected or when the attacker has expended her budget . For example the root represents the fact that the probability of being detected and the cost are all zeros because the attacker did nothing. After a scan on , there are two possible cases: the scan action is detected, denoted represented by the node , or is not detected, represented by the node . In the first case there is no further action, because detection implies removal from the network.
A schematic diagram of the attacker belief evolution tree for our running example. Green (blue) vertices correspond to states where the action sequence do (not) contain a detected action.
Action selection strategy
Given an attacker state , we assume that the probability of selecting action by the attacker is
where denotes the “utility” of a.
It should be observed that the denominator of this expression looks at the set of all actions that are valid for the attacker to perform in the given state, so the attacker’s probability of taking action a depends upon what actions are feasible in that state and their utility.
Our proposed model allows the security officer to assume different expected attacker behaviors through different definitions of function . For instance, we could look at the Common Vulnerability Scoring System (CVSS) of the National Vulnerability Database that associates, with each vulnerability, a quantitative impact and exploitability score, each of which is on a 0–10 scale. For instance, if we look at the sample vulnerability with CVE number CVE-2014-0160, it has a CVSS impact score of 2.9 and a CVSS exploitability score of 10. These scores can be easily converted to a utility in many ways. For instance, we might set to something that is monotonic in both impact and exploitability, e.g. or . Alternatively, by just taking , we can model an attacker who is just driven by the potential impact of her actions. On the other hand,
models the case where the attacker seeks to minimize the likelihood of discovery. In the experiments reported in Section 7 we show the results we obtained using the latter two definitions.
Suppose each scan action in our running example has utility 0.3, and each exploit action has utility . Moreover, suppose the detection probability of each scan action is 0.4, while the detection probability for each exploit action is . If the attacker uses the utility function based on the impact, then at node she randomly chooses a scan action in , since all have the same utility. Assume that she chooses and moves to . Let s be the attacker state at that point. The probabilities are , , , . But if the attacker uses the utility function based on the detection probability, then after reaching at time , the overall probability of being detected is . The attacker now has five possible actions, with the following detection probabilities: , , , , and . So the probability of choosing the various actions are , , , and .
Modeling Subrational Attackers. Note that by appropriately defining function , we can model subrational attackers that do not behave in a fully optimal way, i.e. they do not carry out attacks that maximize their utility. In the real world, this may happen for many reasons (see, e.g., the work by Tom Schelling [40]). For instance, attackers may not exactly know what the objective function is and hence, even if they act in broad agreement with it, they would not necessarily optimize. Attackers may also not have the technical capabilities needed to act optimally. We experimentally show in Section 7 that our defensive mechanisms are robust with respect to subrational attackers as well.
Analysis of the defender
In the real world, the defender can do many different things in order to protect her enterprise from attack. In this paper, we consider the case when the defender can perform two actions:
Adding a honeypot node to the enterprise network, that in turn changes the SVDG. We make the simplistic assumption that any transaction that targets a honeypot node is by an attacker who will therefore be detected. This is a common assumption. For instance, there is little reason for a legitimate user to access a node called all_passwords or something like that [1,7].
Adding traditional defensive software to an existing node, which does not change the SVDG. In this paper, we use this general action as a proxy for many more specific actions such as adding multi-factor authentication, firewalls, intrusion detection systems, and more.
We denote the set of honeypot nodes as . denotes the set of all possible honeypot node setups: a pair represents that honeypot node replicates the connections of node . Moreover, we assume that traditional defensive software ensures that any attacker action on a node protected by such software will be detected.
(Defensive Strategy).
A defensive strategy δ is a pair where and . (resp. ) means deploying a honeypot (resp. installing a defensive software on a node).
We assume the existence of a cost function for the defender, denoted , that assigns a cost to each element of . For instance, the cost for a particular defense could be the cost of that software (plus estimated labor costs involved in setting it up), and likewise, the labor cost involved in developing and deploying a honeypot node. Several techniques to estimate such costs have been proposed in the past (see, e.g., [26,47]) – however, the different attempts lead to different estimations and a standardized method is still a difficult open problem. Our idea is that we can use many estimation approaches at the same time and handle them by simply taking the worst-case scenario. This preserves all our results and does not impact the scalability of our approach.
(Valid Defensive Strategy).
Given a defender budget , a defensive strategy is valid if .
The defender’s belief w.r.t. the ABET is designed similarly to the ABET itself. However, the defender is usually unaware of (i) the transition probability from a node to another, (ii) the total budget of the attacker , and (iii) the attacker’s belief of being detected for a particular action a.
Therefore, the defender assumes an infinite budget for the attacker and tries to enumerate all possible actions the attacker can take. This is a worst case situation commonly considered in cybersecurity where it is assumed that the attacker will wreak maximal havoc. In addition, the defender knows the probability that an attacker is detected at a node after a sequence of actions, as this probability depends on the difficulty of exploiting the vulnerability and on the defender’s skills.
(Defender’s Belief on Attacker Belief Evolution Tree (DABET)).
The defender’s belief w.r.t. an attacker belief evolution tree is a tree built from where:
Each vertex of is a tuple where is the attacker’s state, is the attacker action that leads to the vertex (both are the same as the ones in the ), and is the actual detection status.
Every edge is labeled with the action that leads from to .
The transition probability fromto, denoted , is defined as follows:
where is the defender’s belief about the attacker action selection probability, is the detection probability of the defender, and is the sequence of actions that lead to .
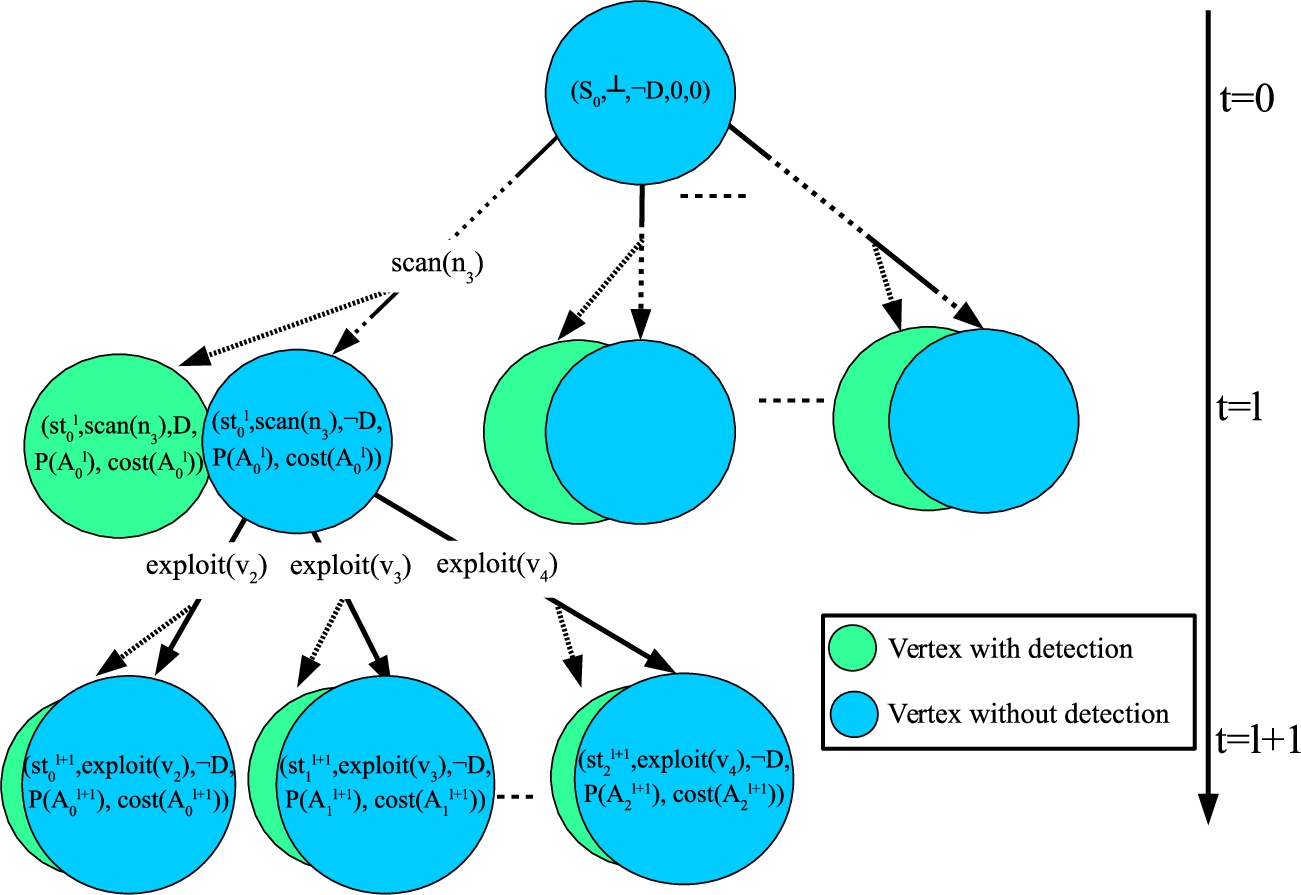
When needed, the DABET for a defensive strategy δ is denoted as . Figure 4 shows a partial DABET for our running example.
Modeling Unskilled Defenders. It should be observed that by appropriately defining the function , the model allows taking into account defenders that do not behave in a fully optimal way, i.e. the cases where the defender’s skills and experience have an actual impact on the detection process. We experimentally show in Section 7 that our framework is also capable of effectively supporting defenders with relatively limited skills.
A schematic diagram of the DABET for our running example. Green (blue) vertices correspond to states where the action sequence do (not) contain a detected action.
The defensive strategy problem
The defender constructs a DABET in order to estimate the expected damage. This quantity, which the defender wants to minimize given a certain budget, depends on the actions performed by the attacker, and these are in turn limited to the kind of network that the defender creates by applying the defender strategy.
(Expected damage).
Given a DABET , the expected damage is defined as
where:
we only consider paths starting from the root vertex in ;
, where , is the damage yielded by action (that can be defined by considering the impact from NVD or the value of data leaked though the action);
if , then and .
Consider the partial ABET for our running example shown in Fig. 5 and assume that (i) the damage of a scan is 0 and that of an exploit is 10, and (ii) , (note that because of the latter, we omitted the vertex at with ). There are two possible paths, and . We have that and . Therefore, .
A fragment of the enterprise network of our running example (a) and its corresponding DABET (b).
(Undamaged Asset Value).
Suppose the total asset value of an enterprise is and δ is a defensive strategy. The undamaged asset value provided by δ is:
It should be observed that evaluating requires the defender to estimate the value of her enterprise’s data and/or the value of “taking down” part of the enterprise network. The estimation of costs/values in a standardized manner is an important research problem by itself and is outside the scope of this paper. There are many works in the literature that have found ways to define asset criticality [8,14,21,22]. Another method, used by the US Department of Defense [24] defines the criticality of an asset in the DoD’s enterprise network by using the hierarchy of relations present in the DoD.
is obviously an expected value that the defender wishes to maximize.
(Defensive Strategy Problem).
Given a defender budget , find the valid defensive strategy δ that maximizes .
The defensive strategy problem is inEXPTIMEandNP-hard.
The problem is in EXPTIME because all the defensive strategies can be enumerated in exponential time and, for each strategy δ, it suffices to verify whether it satisfies the constraints and then compute . We prove NP-hardness by reducing the NP-hard Knapsack problem [15] to the decision problem “Given a defender budget and a threshold , does there exist a valid defensive strategy δ such that ?”. Given two real numbers C and V, a set of objects , and for each object , a cost and a value , the Knapsack problem consists in checking whether there exists a subset such that and . In our reduction we assume that and that the network contains exactly p nodes that are all disconnected and potentially accessible to the attacker. Each node is associated to object . The damage associated with each node is equal to and the cost to protect is equal to . Moreover, we set and . In addition, we assume that the utilities for the attacker are all the same, , and there is no possibility that the attacker is detected. According to these assumptions, the paths of the attacker are uniformly distributed, so the resulting undamaged asset value is the sum of the damages associated with all the protected nodes. This is exactly equivalent to the constraint of the Knapsack problem. Moreover, the cost constraint for valid defender strategies is equivalent to the constraint of the Knapsack problem. □
Because a DABET can be huge, we introduce the notion of a compacted DABET (CDABET) that is a tree built from a DABET where all the descendants of each vertex related to an action over a honeypot node are merged together along with without losing information in terms of expected damage – in other words, the DABET ensures that . More formally, a compaction operation merges a set M of vertices with one of the vertices in if the latter vertex is related to an action over a honeypot node.
(Compacted DABET).
Given a DABET , the corresponding compacted DABET is the maximally compacted tree that can be built from .
We use to denote the CDABET of a defensive strategy δ. In the partial DABET from our running example shown in Fig. 6 we can merge , , , , and into one leaf vertex because there is no damage after .
An example of DABET compaction.
Properties
In this section we show some properties that our objective function and the set of valid defensive strategies enjoy. We first show that the function increases monotonically with the size of our defensive strategy δ.
is monotonic with respect to δ.
To see why the above result is true, assume that and are two defensive strategies with (i.e. and ). This means there are more nodes protected in than , so . Observe also that, given two strategies and with , has more compacted vertices than , whereas the set of non-compacted vertices are exactly same.
The next two results provide important submodularity properties both when traditional defensive software is added and when honeypot nodes are added to a defensive strategy.
is submodular with respect to adding defensive softwares to δ.
Assume that and are two defensive strategies with , and let with . In order to be submodular, the undamaged asset value must satisfy the inequality , or equivalently, . Let be the vertex with whose action is related to node n (observe that vertices with and compacted vertices can be ignored because there is no associated damage). After installing a defensive software on n, all attacks that reach will be detected. Now let be the probability that the attacker will reach without being detected under δ. Since , , i.e. more attack attempts will reach under than under – for the same reason we have as well. The statement follows. □
is submodular with respect to adding honeypot nodes to δ.
Assume that and are two defensive strategies with , and let with . Let be the vertex in the CDABET whose becomes larger after adding h (i.e. the attacker has more options for her next action). As in the proof of Theorem 2, it holds that . Now let be the probability that the attacker will reach without being detected under δ. Again, we have that , i.e. more attack attempts will reach under than under . Since contains more actions after adding h and subsumes , if is an action related to honeypot node h, we can derive that is higher under than under . This implies that more attacks will reach and be captured in h after adding it to . □
The following result shows that, under the assumption of uniform costs, the set of all valid defensive strategies form a matroid.
Assume that, for a fixed cost c, it is the case that,. Then, the pair, whereis the set of all subsets ofthat correspond to valid defensive strategies, is a matroid.
To see why the above result is true, observe that (i) deploying nothing is a valid defensive strategy, thus ; (ii) a subset of a valid defensive strategy is valid as well, so for each , if , then ; (iii) if , , and , then there exists an element such that is also a valid defensive strategy.
The submodularity results in this section also allow us to use a famous result [33] that asserts that a simple greedy algorithm can be used to optimize a submodular function on a matroid with an approximation guarantee. More details will be provided in the next section.
As a final remark, we recall that the DABET depends on the defender strategy, and in the defender simulation involving the DABET the attacker is doing her best to maximize her utility. The attacker revisits her actions in the light of the considered defenses, but cannot reason on her tree to find the best path because we assume that she does not know the structure of the network from the beginning. In order to know the structure of the network, the attacker needs to explore it, and the goal of the defender is to make this exploration (and the following exploitation) as difficult as possible. In this context, understanding that a node is a honeypot does not allow the attacker to recognize other honeypots, so it is difficult to model the benefit of this for the attacker. A possible extension would be that of considering the possibility that the attacker runs test to verify whether a host is real or not – then, if the test is successful, the attacker will not consider any of the other vulnerabilities on that host. Of course, this kind of test will have a cost for the attacker. Another simple procedure (that is a worst case scenario for the defender) is that the attacker, after exploiting a certain number of vulnerabilities on a fake host, “automatically” recognizes that the host is fake.
Finding good defensive strategies
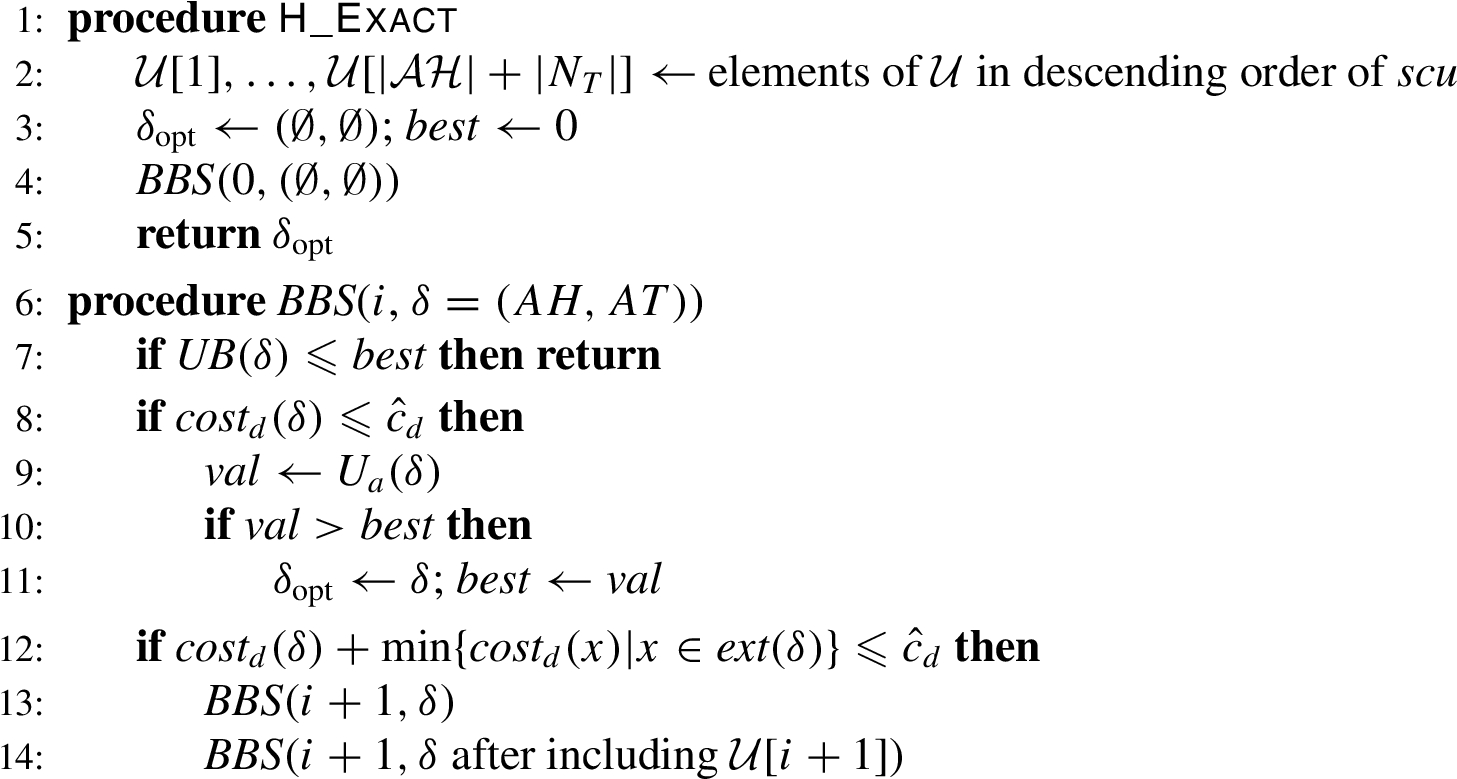
In this section, we present two methods. The first, H_Exact, finds an optimal solution to the defensive strategy problem. However, finding an optimal defensive strategy is NP-hard and hence, H_Exact is inefficient. The second algorithm applies a greedy approach which finds suboptimal solutions in an efficient way.
Exact algorithm
We propose the H_Exact algorithm that uses a branch-and-bound approach to compute the optimal solution. The pseudo-code is shown in Algorithm 1. The algorithm uses the notion of sole contribution to undamaged asset value provided by strategy δ, denoted , which is defined as .11
We sometimes abuse notation and write in place of .
Moreover, denotes the set and denotes the set .
Branch-and-bound algorithm
Initially, all defender actions are sorted in descending order of values – in the hope that the algorithm will quickly converge. Lines 13 and 14 in the branch-and-bound step (procedure BBS) are the branching steps, corresponding to the choices of skipping the th action (line 13) or including it (line 14). For the bounding part, on line 7 we compare the current best undamaged asset value with an upper bound on , denoted . If this upper bound is not promising, we prune δ immediately. The bound is computed as follows:
In the above formula, is the maximum number of defender actions that can still be added to δ, whereas is the best among all remaining actions.
Given two valid defensive strategiesand, it holds that.
Since is submodular, it also holds that . By subtracting from each element of the above equation, we obtain , that is, . Since , the statement follows. □
The H_Exact algorithm is correct.
Correctness of the branching part is guaranteed by the fact that, for each defender action in , we consider both skipping (line 13) and including it (line 14). This ensures that the algorithm will not miss any possible solution. To show that the bounding part is correct as well, we prove that returns a correct upper bound on . From Lemma 1 we know that , or equivalently, . Thus, we obtain , and as a consequence . □
Given the set of all possible defender actions, the theoretical worst-case time complexity of the H_Exact algorithm is exponential in the cardinality of – this is because the algorithm, in the worst case, explores a complete binary search tree of depth . This is expected, given our result about the NP-hardness of computing the defender’s strategy. In practice, H_Exact is an opportunistic algorithm whose practical runtime cannot be described via a simple closed formula – its runtime actually depends on how many branches are pruned in the bounding part.
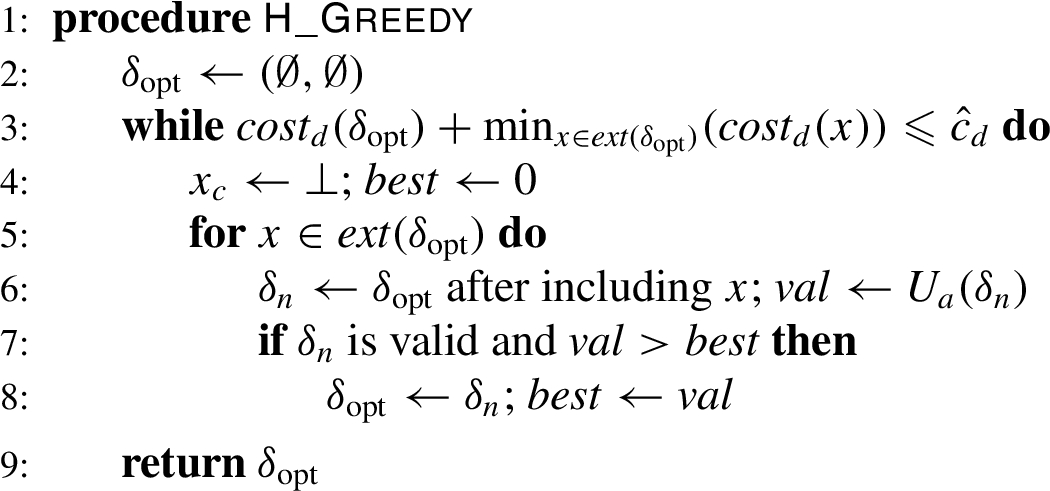
Greedy (inexact) algorithm
Our H_Greedy algorithm leverages our submodularity theorem to compute a suboptimal solution using a greedy hill-climbing approach, i.e. we start with the empty set and, at each iteration, we choose the defender action that provides the maximum gain in value. The pseudo-code is shown in Algorithm 2.
Greedy algorithm
The H_Greedy algorithm produces a valid defensive strategy.
It should also be observed that the worst-case time complexity of the H_Greedy algorithm is quadratic in the cardinality of . In fact, the algorithm executes the while loop times in the worst case and, at each iteration, it needs to find the best local choice – that means it verifies possibilities.
In addition, as discussed in Section 5.2, in the cases where the assumption about uniform costs holds, we can immediately apply a result in [33] to ensure that the hill-climbing approach used by H_Greedy provides the guarantee stated below.
Assume that, for a fixed cost c, it holds that,. Then, the H_Greedy algorithm approximates the optimum to within a factor of.
The experimental results described in Section 7 will validate our assertion that the H_Greedy algorithm is able to quickly compute high-quality solutions in general.
Networks used in the experiments
Network
Cauldron
39
157
198
2,636
NS-2 (medium)
100
177
1,270
30,759
Synthetic (medium)
118
2,343
624
11,754
Synthetic (large)
217
3,943
1,185
23,269
NS-2 (very large)
600
1,228
6,291
131,442
Parameter values used in the experiments
Parameter
Value(s)
Extracted directly from NVD
Ranges from to of
Fixed to
(option U1)
(option U2)
Fixed to ∞
Ranges from 0.5 to 1 if
and from 0.05 to 0.1 if
Ranges from 0% to 0.1% of
Fixed to
Defined as , but using
and the U1 and U2 options for
Fixed to 0
Ranges from 1 to 9
It should be observed that the use of submodularity in order to guarantee the approximation ratio of Proposition 4 is well known and other works do the same in many different domains, ranging from water distribution network design [25] to vaccine distribution [48]. However, we do not fully rely on submodularity in our proposed algorithms. In fact, (i) the proposed H_Exact algorithm is able to shortly provide an exact optimal solution, (ii) its H_Exact95 variant, which will be introduced in the experimental assessment, proves useful in providing good quality results with even faster execution times, and (iii) the H_Greedy algorithm works very well even with non-uniform costs.
Results on the Cauldron dataset.
Results on the NS-2 (medium) dataset.
As a final remark, we point out that the actual short/long term impact of defensive strategies, their cost, and the need to re-compute them periodically is a very importan issue, given the extremely rapid growth of the number of vulnerabilities and patches (see, e.g., the NVD data about the number of vulnerabilities12
). We move in a really dynamic scenario, and the defensive strategies must change with it. The ideal solution would be that of patching everything (most of the network penetration attacks are due to unpatched known vulnerabilities). Unfortunately, even the most skilled security team struggles to keep up with this huge dynamism. The costs are often mainly connected to the patching operations – configuration of honeypots is generally a less relevant cost. Consequently, we believe that, in principle, the re-computation of strategies should be done each time that there are resources available and new vulnerability/patches show up – as the experiments will show, our proposed approximation procedure is very efficient and highly scalable. In addition, it often happens that either a vulnerability exists but is not reported in NVD yet, or the patch is not available yet – for such cases, we demand the protection of our network to our deception principle, by adding temporary honeypots. An interesting and promising future work is based on the idea of using the historical evolution of the vulnerabilities and patches reported in NVD (by using, e.g., temporal data mining or sequence prediction techniques) to try to come up with a prediction their future evolution. This could provide our system with a form of “forecasting” capabilities, and hopefully save some time to a better allocation of the available resources.
Experimental assessment
In this section we describe the results of experiments we performed to evaluate the performance of H_Exact and H_Greedy in terms of both processing time and quality of the defensive strategies returned. All experiments were performed on a cluster of 64 Xeon 2.4 GHz machines with 24 GB RAM running RedHat Linux.
Networks. We used 5 different enterprise networks, whose properties are shown in Table 3. “Cauldron” is a real network with the vulnerability information associated with each node [19]. The “NS-2” networks were generated by one of the most widely-used open-source network simulators [18]. In order to include vulnerability information in these networks, we randomly picked vulnerabilities from the Cauldron network and matched them onto the NS-2 networks in a one-to-many fashion. Finally, the “Synthetic” networks were generated by extracting and replicating subnetworks from the Cauldron network.
Parameters. Table 4 shows how we chose parameter values. In the table, represents the difficulty of exploiting vulnerability v – this quantity was extracted directly from the National Vulnerability Database. When defining , we took into account the fact that in real world scenarios, an attacker’s action is not easy to detect without honeypot nodes or defensive software. So we expect to be very low. For , we assumed that the cost of deploying a honeypot node is much higher than installing a defensive software as the former requires developing a credible honeypot.
Results on the synthetic (medium) dataset.
Results on the synthetic (large) dataset.
Algorithms. In addition to the H_Exact and H_Greedy algorithms, we experimented with a variant of the H_Exact algorithm named H_Exact95 that underestimates upper bounds by 5% (i.e. we replaced with in line 7 of H_Exact). We introduced this variant in order to verify whether by relaxing the optimality property ensured by H_Exact, but still using a branch-and-bound approach, we can obtain significantly better processing times without losing much in terms of quality of the results. Moreover, we used Montecarlo simulation in order to reduce the overhead due to the computation of . By fixing the number of iterations to 500K (where at each iteration we choose the defender action according to and simulate the detection according to ), we were able to accurately estimate the actual values of .
We measured the run-times and quality obtained with all combinations of networks and algorithms using the U1 and U2 options for and described in Table 4. The results are reported in Figs 7–11.
Results on the NS-2 (very large) dataset.
Average performance improvement provided by the H_Greedy algorithm.
Average relative quality.
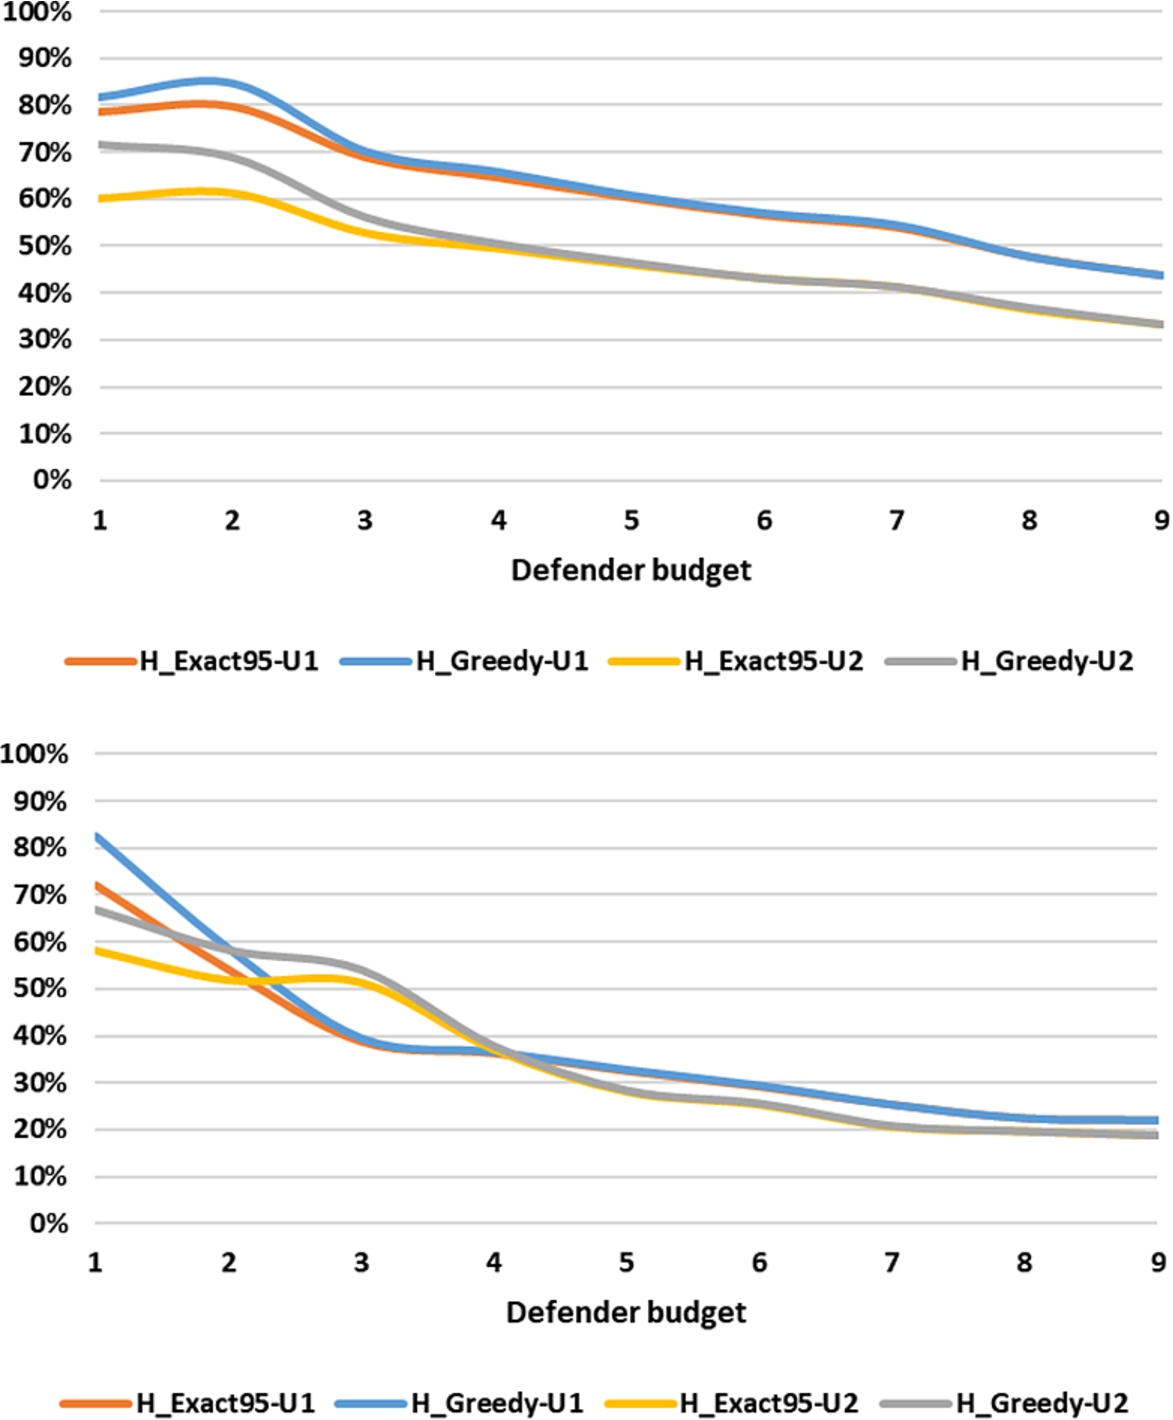
Percentage of damage on the synthetic (large) and NS-2 (very large) datasets.
Average relative value of .
Run-time. As the results show, H_Greedy is much faster than both H_Exact and H_Exact95. H_Exact timed out in 12 out of 18 cases13
Timeouts were fixed at 3 weeks.
on the synthetic (medium) network (Fig. 9), and in all cases on the synthetic (large) and NS-2 (very large) networks (Figs 10 and 11). Overall, the average performance improvements provided by H_Greedy (reported in Fig. 12) are extremely satisfying – they range from 35.8% to 84.2% with respect to H_Exact95 and from 37.6% to 99.2% with respect to H_Exact (even without counting the times H_Exact did not finish).
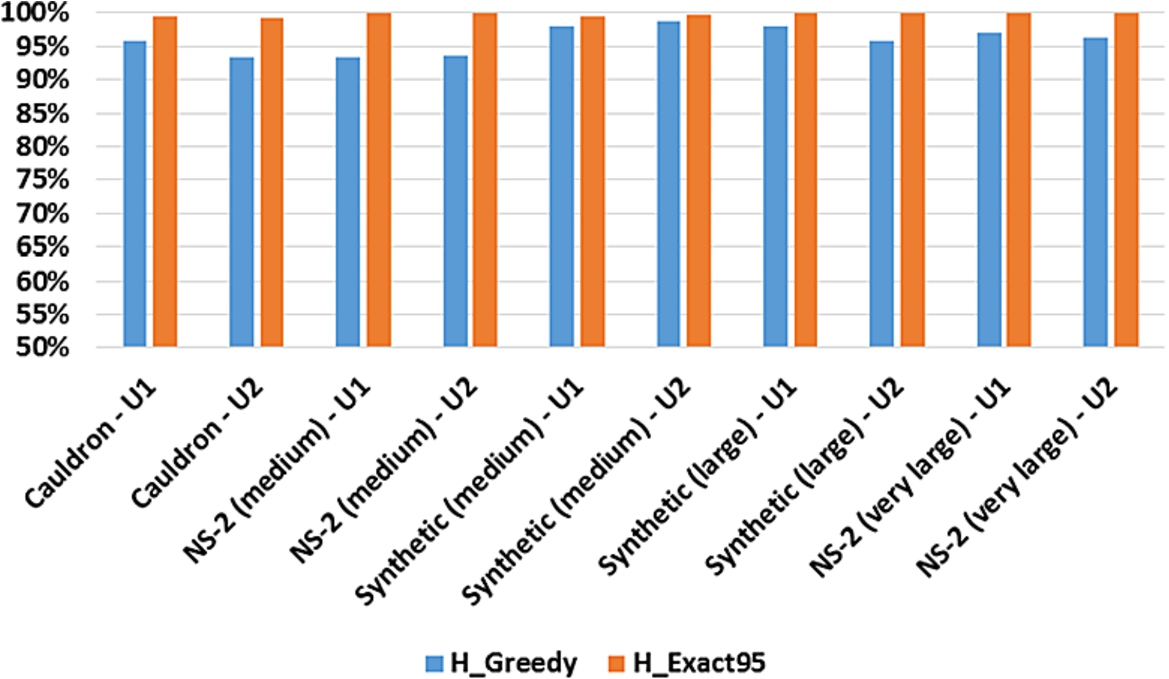
Accuracy.H_Greedy produces very high quality results in the vast majority of cases. The relative quality of its results, averaged over all defender budgets (which is reported in Fig. 13) ranges from 93.3% to 98.7% of optimal. As expected, H_Exact95 provides higher average quality because of its higher average processing times.
Absolute Damage. In addition to relative quality, we also analyzed the percentage of damage (w.r.t. the maximal possible damage) caused by the attacker when the defender uses a suboptimal method (Fig. 14). H_Exact95 shows lower damage than H_Greedy in most cases. One interesting observation is that attackers following option U2 create more damage than U1 in most cases (there are very few exceptions). For instance, U2 obtains higher damage than U1 on the NS-2 (very large) network after a fluctuation until . This is because attackers with U2 can survive longer than in the other case.
Subrational Attackers. Next, we assessed the sensitivity of our framework when the attacker shows a subrational approach by not always choosing higher utility vulnerabilities. We introduced an “attacker factor” ranging from to in the definition of (option U1). Intuitively, if the attacker factor is , this means that the attacker overestimates the utility of her actions by . Figure 15(top) reports the results (averaged over the different datasets) obtained with . In particular, the figure shows the ratio between the actual value of obtained in each case and the best value obtained over all cases. Again, the results are extremely satisfying. The differences between the case where the factor is set to zero (i.e. fully rational behavior) and the other cases are very limited – this means that our framework is robust with respect to a variety of possible behaviors the attacker might show.
Unskilled Defenders. We also considered those cases where the defender’s skills and experience have an actual impact on the detection process. To this aim, we introduced a “defender factor” ranging from to in the definition of . Intuitively, if the defender factor is , this means that the defender’s skills allow her to detect the action with a probability that is higher than the one defined in Table 4. The results with option U2 and are reported in Fig. 15 (bottom). The differences between the case (maximum defender skills) and the other cases are very low – this tells us that our framework is also capable of effectively supporting defenders with relatively limited skills.
Honeypots vs. Traditional Defensive Software vs. Joint Optimization. Finally, we address two questions: (1) In which cases do honeypots or traditional defensive software outperform the other? (2) To which extent the proposed joint optimization outperforms an optimization based on just one of the two methods?
Table 5 shows the average degree of honeypots and nodes where TDS is installed under the optimal strategies (together with their neighbor’s average degree) with U2 and (other options provide similar results).
The results show that honeypots generally outperform traditional defenses in higher degree nodes. In fact, a honeypot can protect all its connected neighbors and thus, higher degree of honeypots can provide higher cost-efficiency. Moreover, honeypots’ neighbors have lower degrees than those of the nodes with TDS. This implies a higher influx of attackers through the links between a honeypot and its neighbors, as they are more likely to choose the honeypot as their next target. In general, these results clearly suggest possible preferred choices for both available options: honeypots should be located on nodes that have high degrees and whose neighbors have low degrees.
Regarding the second question, we start by observing that the proposed joint optimization scheme theoretically subsumes both single optimization schemes, so our framework cannot show worse performances. Table 6 shows the relative quality of optimal single optimization strategies w.r.t. optimal joint optimization ones with U2 and (other options provide similar results).
The results show that, in the majority of the cases analyzed, joint optimization yields significantly better results – on average, it improves quality by around 22%.
Conclusions
Though there has been much work on honeypots (how to design them and where to place them), there has been little or no work on (i) how to simultaneously place both honeypots and traditional cyber defensive software (e.g. intrusion detection systems, firewalls) (ii) in the presence of an rational or subrational adversary. In this paper, we present a game-theoretic framework that addresses both these problems. We first model an attacker who can scan network nodes and exploit vulnerabilities and show how her beliefs about the network can be represented via a novel Attacker Belief Evolution Tree (ABET). We then formally define a Defender ABET (DABET) for the defender to reason about the attacker’s beliefs/behavior and use this to show the defender’s optimal strategy and an NP-hardness result. We propose the H_Exact algorithm to compute the optimal defensive strategy which is expectedly exponential. We then introduce the polynomial-time H_Greedy algorithm. We show that H_Greedy provides much better run-time than H_Exact, with a performance improvement that is over 37% to 99% (even if we ignore the numerous cases when H_Exact does not finish) while generating solutions that are over 93% to 98% of optimal. We further show that our system is robust in the presence of a subrational adversary and/or a defender with limited skills.
Average degree of honeypots and nodes with TDS (average degree of their neighbors in parentheses)
Network
Honeypots
Nodes with TDS
Cauldron
14.0 (17.0)
14.0 (17.0)
NS-2 (medium)
3.4 (4.3)
3.3 (4.6)
Synthetic (medium)
20.3 (18.6)
17.5 (19.2)
Synthetic (large)
17.7 (16.6)
17.7 (17.2)
NS-2 (very large)
5.6 (5.3)
4.5 (5.0)
Relative quality of single optimization strategies
Network
Honeypot-only
TDS-only
Cauldron
92%
98%
NS-2 (medium)
51%
93%
Synthetic (medium)
64%
83%
Synthetic (large)
81%
87%
NS-2 (very large)
79%
89%
Footnotes
Acknowledgments
This work was partially funded by the Army Research Office under grants W911NF-13-1-0421, W911NF-15-1-0576, and W911NF-14-1-0358, by the Office of Naval Research under grants N00014-15-1-2007, N00014-16-1-2896, and N00014-15-1-2742, by the National Science Foundation under grant IIP-1266147, and by the Ramanujan Faculty Fellowship.
References
1.
F.H.Abbasi, R.J.Harris, G.Moretti, A.Haider and N.Anwar, Classification of malicious network streams using honeynets, in: GLOBECOM, 2012.
2.
L.Ablon, M.C.Libicki and A.A.Golay, Markets for Cybercrime Tools and Stolen Data: Hackers’ Bazaar, RAND Corporation, 2014.
3.
P.Aggarwal, Z.Maqbool, A.Grover, V.Pammi, S.Singh and V.Dutt, Cyber security: A game-theoretic analysis of defender and attacker strategies in defacing-website games, in: CyberSA, 2015.
4.
E.S.Al-Shaer and H.H.Hamed, Discovery of policy anomalies in distributed firewalls, in: INFOCOM, 2004.
5.
M.Bercovitch, M.Renford, L.Hasson, A.Shabtai, L.Rokach and Y.Elovici, HoneyGen: An automated honeytokens generator, in: ISI, 2011.
C.-M.Chen, S.-T.Cheng and R.-Y.Zeng, A proactive approach to intrusion detection and malware collection, Security and Communication Networks6(7) (2013), 844–853. doi:10.1002/sec.619.
8.
K.H.Chung and H.Jo, The impact of security analysts’ monitoring and marketing roles on the market value of firms, Journal of Financial and Quantitative Analysis31(4) (1996), 493–512. doi:10.2307/2331357.
9.
P.Cintula, F.Esteva, J.Gispert, L.Godo, F.Montagna and C.Noguera, Distinguished algebraic semantics for t-norm based fuzzy logics: Methods and algebraic equivalencies, Annals of Pure and Applied Logic160(1) (2009), 53–81. doi:10.1016/j.apal.2009.01.012.
10.
A.Clark, K.Sun, L.Bushnell and R.Poovendran, A game-theoretic approach to IP address randomization in decoy-based cyber defense, in: GameSec, 2015.
11.
W.R.Claycomb, Detecting insider threats: Who is winning the game?, in: International Workshop on Managing Insider Security Threats, 2015.
12.
R.Dewri, N.Poolsappasit, I.Ray and D.Whitley, Optimal security hardening using multi-objective optimization on attack tree models of networks, in: CCS, 2007.
13.
R.Dewri, I.Ray, N.Poolsappasit and D.Whitley, Optimal security hardening on attack tree models of networks: A cost-benefit analysis, Int. J. of Information Security11(3) (2012), 167–188. doi:10.1007/s10207-012-0160-y.
14.
G.Dhillon and G.Torkzadeh, Value-focused assessment of information system security in organizations, Information Systems Journal16(3) (2006), 293–314. doi:10.1111/j.1365-2575.2006.00219.x.
15.
M.R.Garey and D.S.Johnson, Computers and Intractability: A Guide to the Theory of NP-Completeness, W. H. Freeman & Co., New York, NY, USA, 1979.
16.
R.Grimes, Why patching is still a problem – and how to fix it, CSO Magazine (2016). http://www.csoonline.com/article/3025807/data-protection/why-patching-is-still-a-problem-and-how-to-fix-it.html.
17.
Z.Han, N.Marina, M.Debbah and A.Hjørungnes, Physical layer security game: How to date a girl with her boyfriend on the same table, in: GameNets, 2009.
18.
T.Issariyakul and E.Hossain, Introduction to Network Simulator NS2, Springer Publishing Company, Incorporated, 2008.
19.
S.Jajodia, S.Noel, P.Kalapa, M.Albanese and J.Williams, Cauldron: Mission-centric cyber situational awareness with defense in depth, in: MILCOM, 2011.
20.
S.Jajodia, P.Shakarian, V.S.Subrahmanian, V.Swarup and C.Wang (eds), Cyber Warfare – Building the Scientific Foundation, Advances in Information Security, Vol. 56, Springer, 2015.
21.
R.L.Keeney, Value-Focused Thinking: A Path to Creative Decisionmaking, Harvard University Press, 1996.
22.
R.L.Keeney, Value-focused thinking: Identifying decision opportunities and creating alternatives, European Journal of Operational Research92(3) (1996), 537–549. doi:10.1016/0377-2217(96)00004-5.
23.
C.Kiekintveld, V.Lisý and R.Píbil, Game-theoretic foundations for the strategic use of honeypots in network security, in: Cyber Warfare – Building the Scientific Foundation, 2015, pp. 81–101.
A.Krause, J.Leskovec, C.Guestrin, J.VanBriesen and C.Faloutsos, Efficient sensor placement optimization for securing large water distribution networks, Journal of Water Resources Planning and Management134(6) (2008), 516–526. doi:10.1061/(ASCE)0733-9496(2008)134:6(516).
26.
R.P.-Lippmann, J.F.Riordan, T.H.Yu and K.K.Watson, Continuous Security Metrics for Prevalent Network Threats: Introduction and First Four Metrics, Technical Report, MIT Lincoln Laboratory, 2012.
27.
K.J.R.Liu and B.Wang, Cognitive Radio Networking and Security: A Game-Theoretic View, Cambridge University Press, New York, NY, USA, 2010. doi:10.1017/CBO9780511778773.
28.
T.F.Lunt, A survey of intrusion detection techniques, Computers & Security12(4) (1993), 405–418. doi:10.1016/0167-4048(93)90029-5.
29.
K.-w.Lye and J.M.Wing, Game strategies in network security, Int. J. of Information Security4(1–2) (2005), 71–86. doi:10.1007/s10207-004-0060-x.
30.
M.H.Manshaei, Q.Zhu, T.Alpcan, T.Bacşar and J.-P.Hubaux, Game theory meets network security and privacy, ACM Comput. Surv.45(3) (2013), 25.
31.
P.Mell, T.Bergeron and D.Henning, Creating a Patch and Vulnerability Management Program, NIST Sp. Publ. 800-40, Version 2.0, 2005.
G.L.Nemhauser, L.A.Wolsey and M.L.Fisher, An analysis of approximations for maximizing submodular set functions – I, Math. Program.14(1) (1978), 265–294. doi:10.1007/BF01588971.
S.Osborn, R.Sandhu and Q.Munawer, Configuring role-based access control to enforce mandatory and discretionary access control policies, ACM Transactions on Information and System Security3(2) (2000), 85–106. doi:10.1145/354876.354878.
36.
N.Poolsappasit, R.Dewri and I.Ray, Dynamic security risk management using Bayesian attack graphs, IEEE Trans. Dependable Secur. Comput.9(1) (2012), 61–74. doi:10.1109/TDSC.2011.34.
37.
F.Pouget and M.Dacier, Honeypot, Honeynet: A comparative survey, in: Institut Eurecom, 2003.
38.
M.Rasouli, E.Miehling and D.Teneketzis, A supervisory control approach to dynamic cyber-security, in: GameSec, 2014.
39.
M.Raya, M.H.Manshaei, M.Félegyhazi and J.-P.Hubaux, Revocation games in ephemeral networks, in: CCS, 2008.
40.
T.Schelling, The Strategy of Conflict, Harvard University Press, 1992.
41.
E.Serra, S.Jajodia, A.Pugliese, A.Rullo and V.S.Subrahmanian, Pareto-optimal adversarial defense of enterprise systems, ACM Trans. Inf. Syst. Secur.17(3) (2015), 11. doi:10.1145/2699907.
42.
A.Shabtai, Y.Elovici and L.Rokach, Data leakage detection/prevention solutions, in: A Survey of Data Leakage Detection and Prevention Solutions, Springer, 2012, pp. 17–37. doi:10.1007/978-1-4614-2053-8_4.
43.
P.Shakarian, D.Paulo, M.Albanese and S.Jajodia, Keeping intrudors at large: A graph-theoretic approach to reducing the probability of successful network intrusions, in: SECRYPT, 2014.
44.
G.F.Stocco and G.Cybenko, Exploiting adversary’s risk profiles in imperfect information security games, in: GameSec, 2011.
45.
L.Xiao, Y.Chen, W.S.Lin and K.J.R.Liu, Indirect reciprocity security game for large-scale wireless networks, Trans. Info. For. Sec.7(4) (2012), 1368–1380. doi:10.1109/TIFS.2012.2202228.
46.
G.Yan, Y.Kucuk, M.Slocum and D.C.Last, A Bayesian cogntive approach to quantifying software exploitability based on reachability testing, in: ISC, 2016.
47.
A.Younis, Y.K.Malaiya and I.Ray, Assessing vulnerability exploitability risk using software properties, Software Quality Journal24(1) (2016), 159–202. doi:10.1007/s11219-015-9274-6.
48.
Y.Zhang and B.A.Prakash, DAVA: Distributing vaccines over networks under prior information, in: ICDM, 2014.
49.
Q.Zhu, H.Li, Z.Han and T.Basar, A stochastic game model for jamming in multi-channel cognitive radio systems, in: ICC, 2010.