
Abstract
The administrators of a mission critical network usually have to worry about non-traditional threats, e.g., how to live with known, but unpatchable vulnerabilities, and how to improve the network’s resilience against potentially unknown vulnerabilities. To this end, network hardening is a well-known preventive security solution that aims to improve network security by taking proactive actions, namely, hardening options. However, most existing network hardening approaches rely on a single hardening option, such as disabling unnecessary services, which becomes less effective when it comes to dealing with unknown and unpatchable vulnerabilities. There lacks a heterogeneous approach that can combine different hardening options in an optimal way to deal with both unknown and unpatchable vulnerabilities. In this paper, we propose such an approach by unifying multiple hardening options, such as service diversification, firewall rule modification, adding, removing, and relocating network resources, and access control, all under the same model. We then apply security metrics designed for evaluating network resilience against unknown and unpatchable vulnerabilities, and consequently derive optimal solutions to maximize security under given cost constraints. Finally, we study the effectiveness of our solution against unpatchable vulnerabilities through simulations.
Keywords
Introduction
Today’s computing networks are playing the role of nerve systems in many mission critical infrastructures, such as cloud data centers and industry control systems. However, the scale and severity of security breaches in such networks have continued to grow at an ever-increasing pace, which is evidenced by many high-profile security incidents, such as the recent large-scale DDoS attacks caused by the Mirai Botnet on the Dyn DNS, and the cyber-physical attack on the Ukrainian power grid in 2015 [13]. The so-called zero-day attacks, which exploit either previously unknown or known, but unpatched vulnerabilities, are usually behind such security incidents, e.g., Stuxnet employs four different zero day vulnerabilities to target SCADA [16]. Therefore, administrators of a mission critical network usually need to worry about not only patching known vulnerabilities and deploying traditional defense mechanisms (e.g., firewalls, IDSs, and IPSs), but also non-traditional security threats, e.g., how to live with known, but unpatchable vulnerabilities, and how to improve the network’s resilience against potentially unknown vulnerabilities.
In fact, it is known that cybercriminals frequently leverage vulnerabilities that are not publicly known. On the other hand, even for known vulnerabilities, patching is not always a viable option. For example, a patch may not be readily available at the time of the attack (e.g. the remote exploit vulnerability CVE-2016-4502 [32]), or the system may have reached their end-of-support with no more patch available (e.g. the Atom-Bombing windows vulnerability [7]); patching a vulnerability may cause unacceptable service disruptions on a regular basis; even worse, patching a vulnerability may sometimes reintroduce other security vulnerabilities that have previously been fixed (e.g., Apache MINA SSHD 2.0.14 introduces an SSL regression previously fixed in 2.0.13 [3]).
Consequently, security professionals need to block the exploitation of such vulnerabilities through other means, such as adding, removing, or relocating services, as well as modifying firewall rules, service diversification, or access control. A critical question is How to optimally combine such options in order to both improve the security and lower the cost? To this end, network hardening is a well-known preventive security solution that aims to improve network security by taking proactive actions, namely, hardening options. However, most existing network hardening approaches rely on a single hardening option, such as disabling unnecessary services [14,34] or service diversification [9] (a detailed review of related work will be given later in Section 5). Such a solution becomes less effective when it comes to dealing with unknown and unpatchable vulnerabilities. There lacks a heterogeneous approach that can combine different hardening options in an optimal way to deal with such vulnerabilities.
In this paper, we develop such an approach to optimally combine heterogeneous hardening options in order to increase a network’s resilience against both unknown and unpatchable vulnerabilities under various cost constraints. Specifically, we first devise a unified model for heterogeneous hardening options. We also design a cost model and discuss how hardening cost may be estimated in a realistic fashion. We then formulate network hardening as an optimization problem and develop optimization and heuristic algorithms to derive optimal solutions under given cost constraints. We evaluate our approach through simulations in order to study the effect of optimization parameters on accuracy and running time, as well as the effectiveness of hardening against unpatchable vulnerabilities and for different types of networks. In summary, the main contribution of this paper is the following.
To the best of our knowledge, this is the first effort on network hardening that covers a spectrum of heterogeneous hardening options, including service diversification, adding, removing, and relocating resources, as well as firewall and access control rule modification.
In contrast to previous works, which typically assume ad-hoc hardening cost assignments, we provide a refined cost model and cost estimation criteria that take into account real world variables in calculating hardening costs.
As evidenced by the simulation results, our optimization and heuristic algorithms are efficient and effective, and hence they provide a practical solution for network administrators to improve their networks’ resilience against unknown and unpatchable vulnerabilities.
Finally, by focusing on unknown and unpatchable vulnerabilities, our work provides a more encompassing complementary solution to existing network hardening approaches that focus on fixing known vulnerabilities.
The preliminary version of this paper has previously appeared in [10]. In this paper, we have substantially improved and extended the previous version. The most significant extensions are as follows. First, in addition to the hardening options already covered in the previous version, i.e., service diversification and firewall rule modification, we have further introduced three new hardening options in this paper, i.e., adding new resources, removing existing resources, and relocating resources between given locations in the network (detailed in Sections 2.1). Integrating those new options into the existing model allows us to further improve the capability of surviving unpatchable vulnerabilities. Second, in addition to the cost model proposed in the preliminary version, we have further provided realistic methods for estimating the costs of all the hardening options we propose (detailed in Section 2.3). Third, we have provided an additional analysis on the steps taken to instantiate our metric for given networks (Section 2.4). Fourth, a new heuristic algorithm for efficiently computing the hardening metric in special cases is provided (Section 3.3). Finally, we have conducted a series of new simulations to demonstrate how our solution performs in the presence of the newly added hardening options (Section 4).
The remainder of this paper is organized as follows: The rest of this section first builds the motivation through a running example. In Section 2, we present the model and formulate the optimization problem, and in Section 3 we discuss the methodology and show case studies. Section 4 shows simulation results. Section 5 reviews related work and Section 6 concludes the paper.
Motivating example
We first consider a concrete example to demonstrate why deriving an optimal solution with heterogeneous hardening options can be a tedious and error-prone task if done manually and would therefore benefit from a systematic and automated approach, even if the considered network is of a small size. Figure 1 shows a hypothetical network for a typical cloud data center [6] based on the OpenStack architecture [18]. Despite its relatively small scale, it mimics a typical cloud network: The client layer connects the cloud network to the Internet through a router (CRS 7600); a firewall (ASA v1000) separates the outside network from the inner one; there is a security/authentication layer (authentication server, Neutron server, etc.) as well as a virtual machine (VM) and application layer (web and application servers); finally, a storage layer is separated and protected by another firewall (ASA 5500) and an MDS 9000 multilayer switch [6].
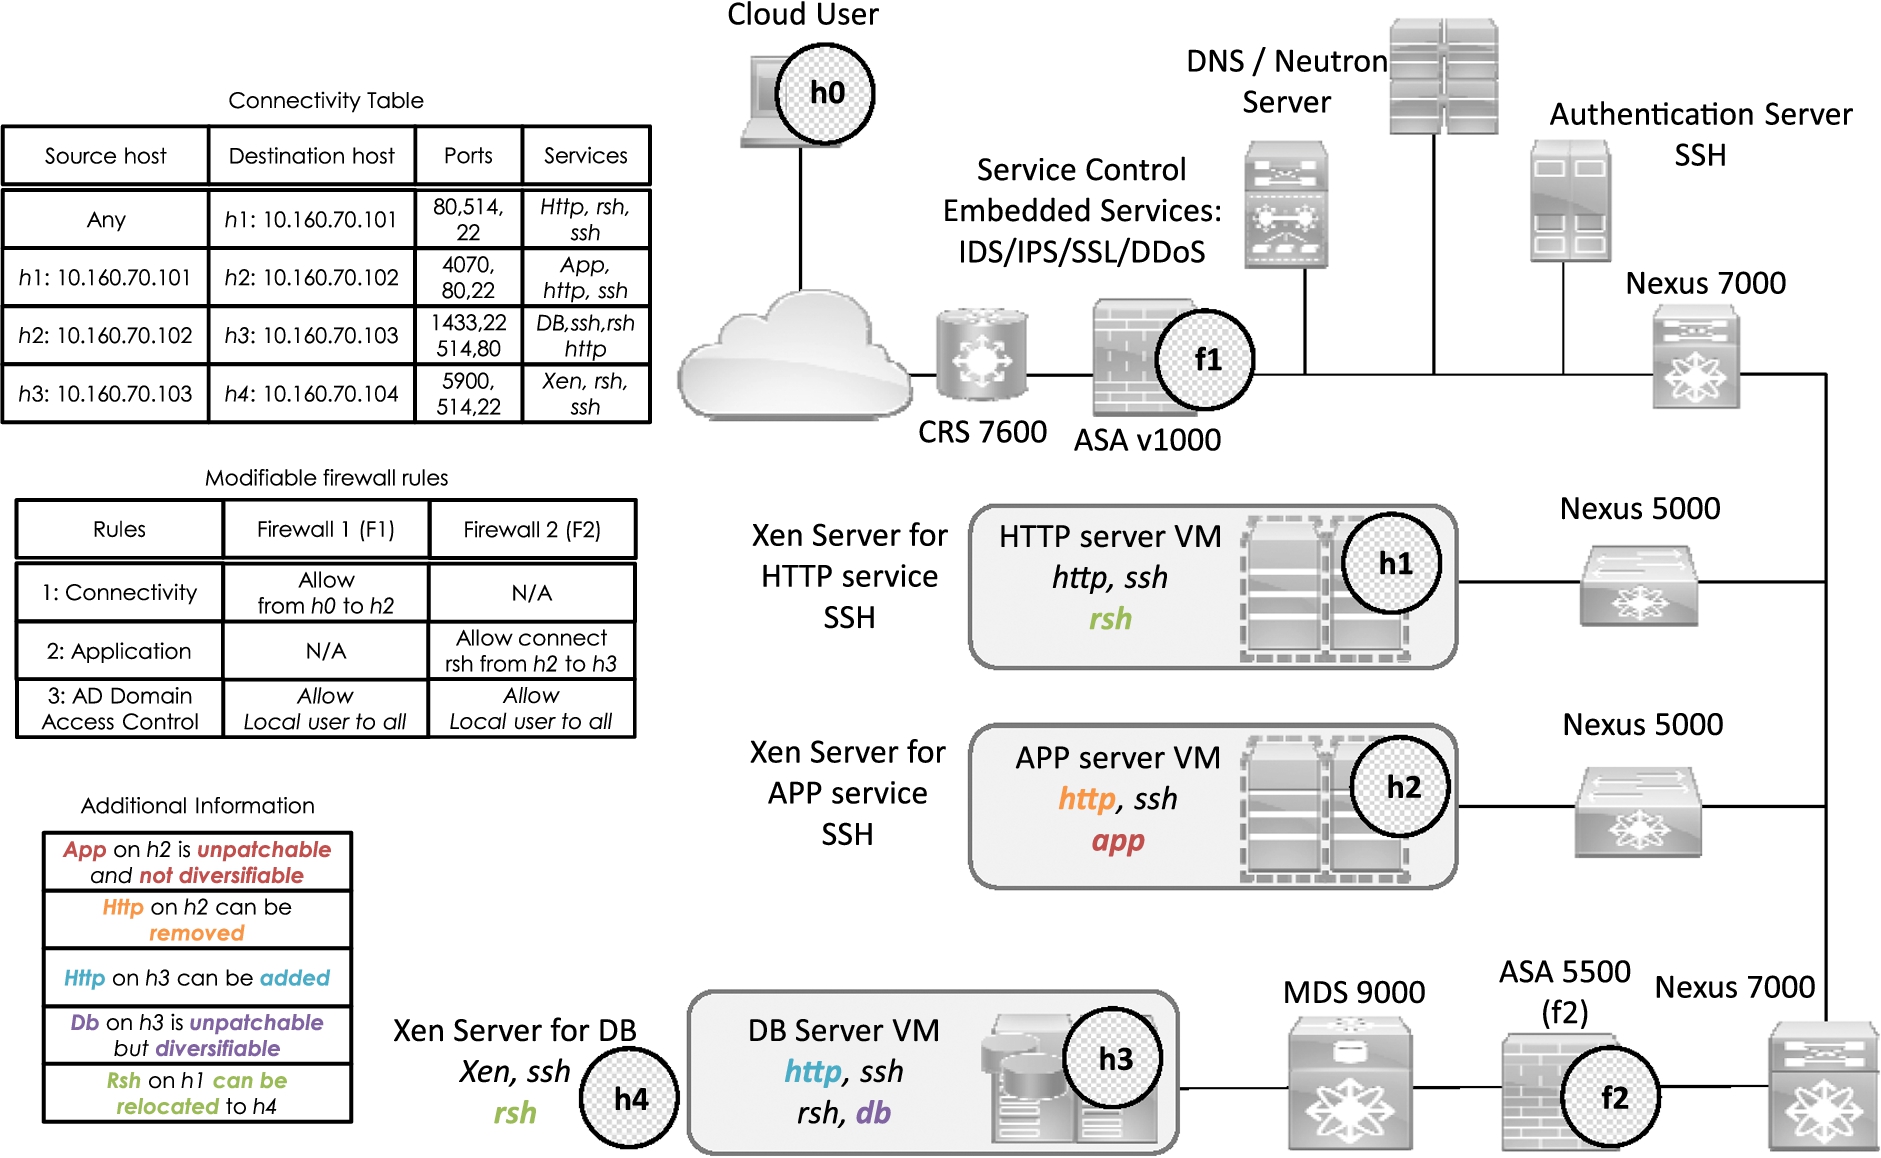
An example network.
We make the following assumptions about the network. We assume the two firewalls and other host-based security mechanisms (e.g., personal firewalls or iptables) together enforce the connectivity described inside the connectivity table shown in the figure. External users (including attackers) are represented with host
To measure the network’s resilience against zero-day attacks, we apply the h safety metric [10]. This metric counts how many distinct services must be compromised using unknown vulnerabilities before an attacker may compromise the critical asset (i.e., the number of distinct services along the shortest path) while also taking into consideration the potentially uneven distribution of distinct services along the shortest path [44,47] (e.g., a path consisting of three
For hardening options, we consider the following options: (i) adding new resources, (ii) removing existing resources, (iii) relocating existing resources from one host to another, (iv) changing the firewall or access rules, and (v) changing the service types through service diversification. More specifically,
We assume the administrator may enable or disable firewall rules on both the firewall ASA v1000 (
On
The administrator also has the option to allow local user access to the web server VM (
The firewall
The administrator has the possibility to remove the
The firewall
The administrator also has the option to relocate the
Based on above assumptions, the administrator needs to carefully analyze which of those options, if any, will help to make the network more resilient against zero-day attacks. The administrator must also consider the causal relationships between network resources (e.g., some resources can only be reached as a result of compromising other resources), the dependency between hardening options, and finally the different costs associated with different types of hardening options (e.g., the cost can vary significantly between adding, removing or relocating a resource, and also for diversifying services and changing firewall or access rules). Specifically,
How would adding a new resource, removing an existing one, or relocating a resource from one host to another, impact the overall network resilience against unknown and unpatchable vulnerabilities?
How would using different instances of a service (diversifying) help with the network resilience?
How would enabling or disabling predefined firewall rules help hardening the network?
How would the fact that some services are not patchable (whether or not they can be diversified) impact the efforts to secure the network?
How to make sure that the options that are chosen respect predefined costs?
Clearly, even with such a small scale network, to answer those questions through manual efforts or experiences would obviously be a tedious and error-prone task and thus demands a systematic and automated approach, which is the subject matter of this paper.
We first define our model to capture network services and their relationships; we then present the heterogeneous hardening control, our cost model and discussions on how to estimate costs, followed by an analysis of the metrics that we will be using, and the optimization problem formulation.
Extended resource graph
The first challenge is to model different resources, such as services (e.g., Web servers) that can be remotely accessed over the network, different instances of each service (e.g., Apache and IIS), and the causal relationships existing among resources (e.g., a host is only reachable after an attacker gains a privilege to another host). This challenge applies to both unpatchable and unknown vulnerabilities. An additional challenge is how to model the addition of new resources into the network, the removal of existing ones, and the relocation of predefined resources within the network, as well as considering any potential dependency among different options. Finally, there is also the added complexity of considering predefined firewall rules which may affect initially satisfied conditions.
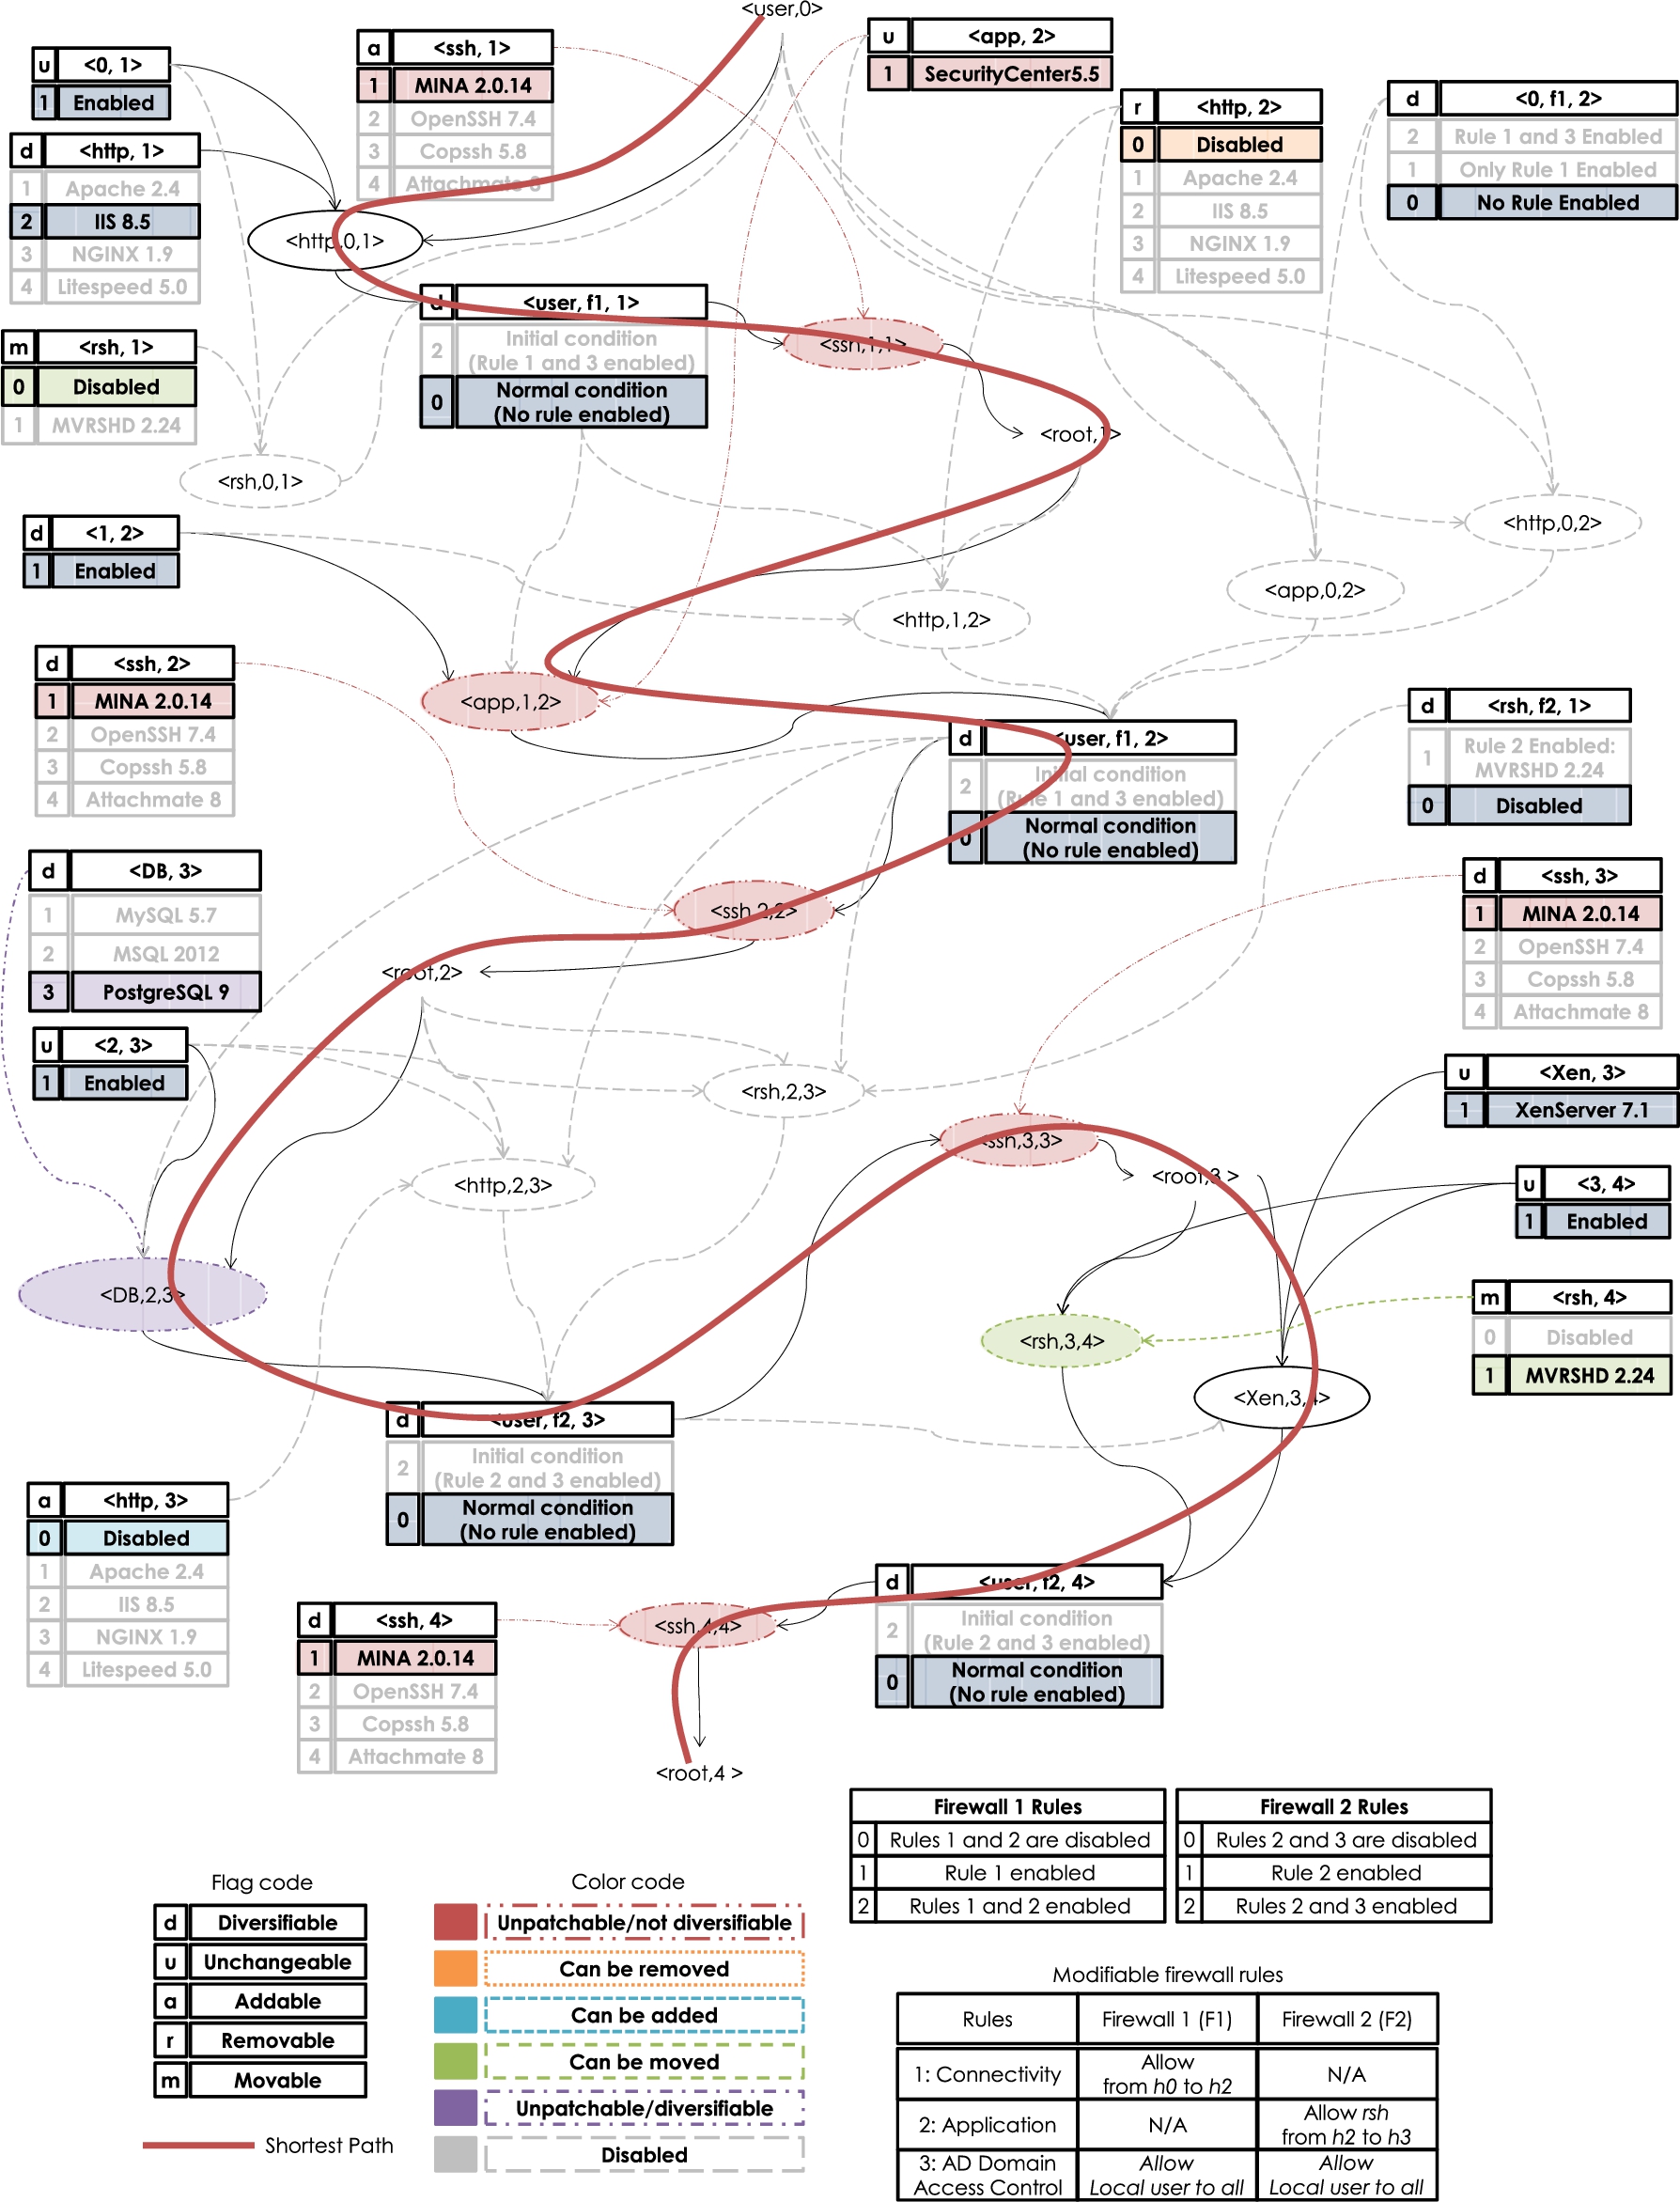
To address these challenges, we adopt the concept of Extended Resource Graph [9,10], which is syntactically equivalent to attack graphs, but models network services instead of known vulnerabilities [44,47]. This graph introduces the notion of Service Instance to indicate which instance (e.g., Apache) of a particular service (e.g., Web server) is being used on a host. Like the original extended resource graph, we only consider services that can be remotely accessed. The extended resource graph of the running example is shown in Fig. 2 and detailed below.
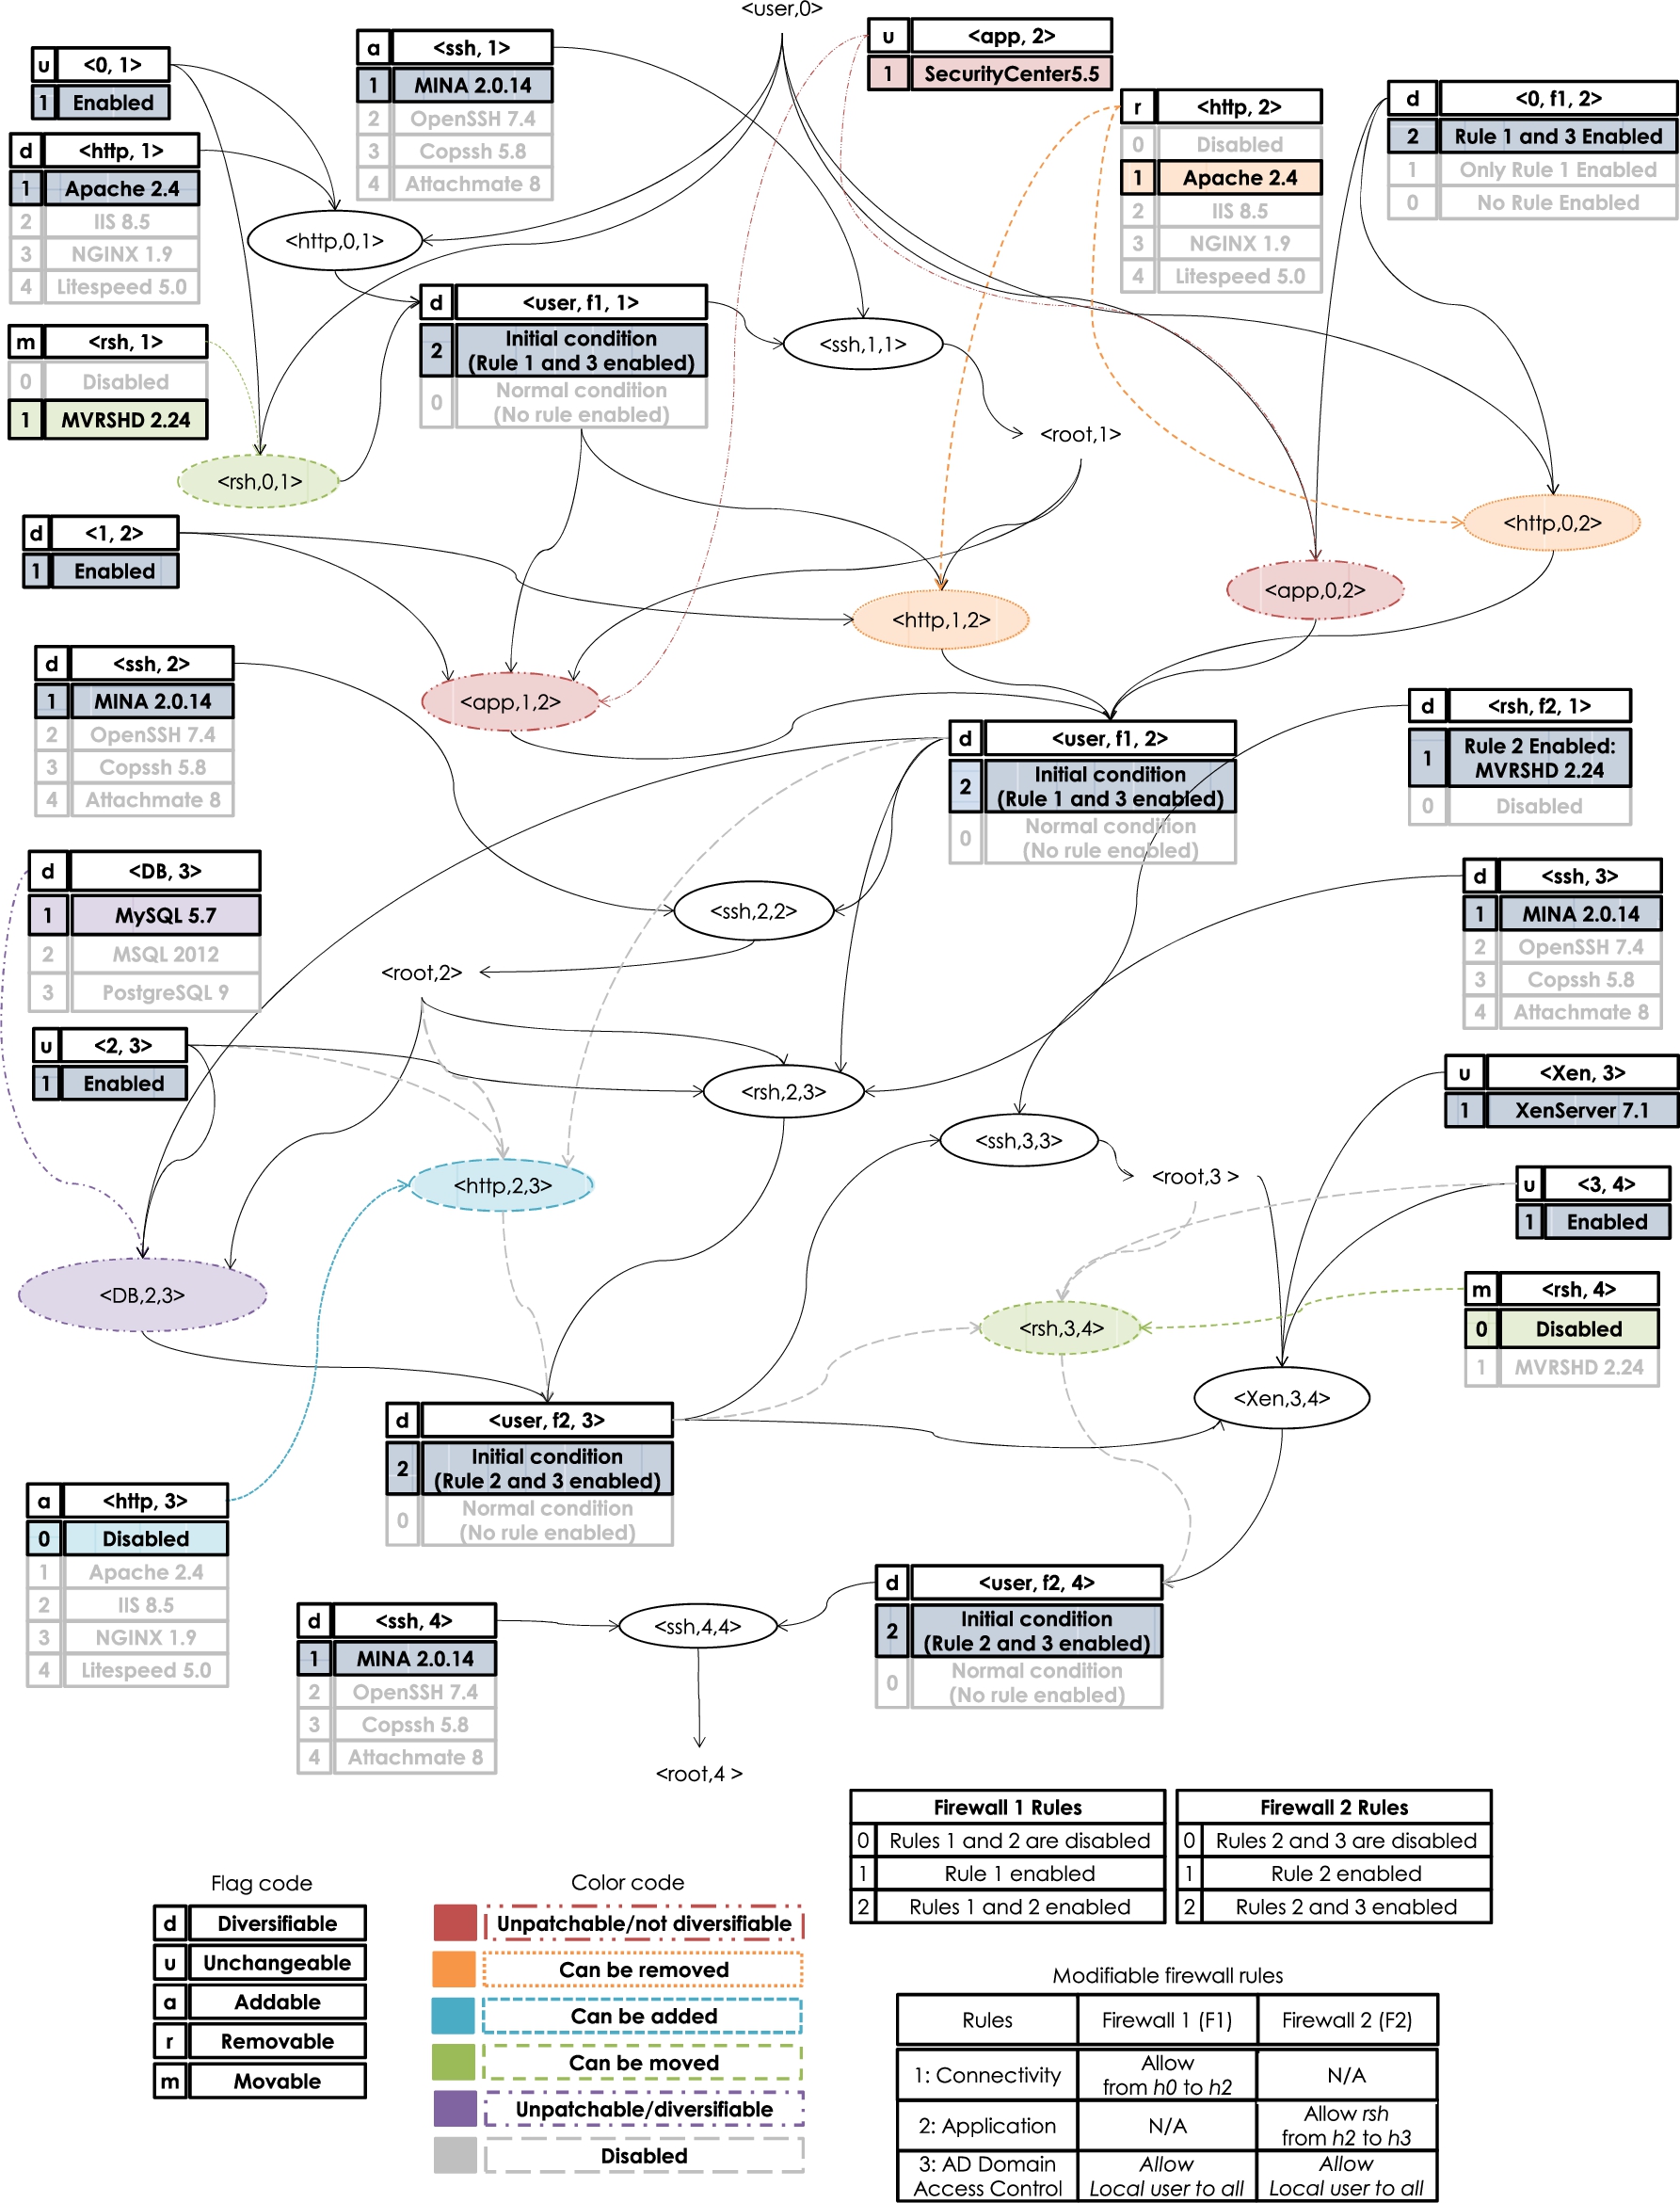
The extended resource graph of our running example.
In Fig. 2, each pair shown in a rectangle is a security-related condition. If the condition is a privilege, it is represented as
Each exploit node (oval) is a tuple that consists of a service running on a destination host, the source host, and the destination host (e.g., the tuple
We make three design choices here. First, we associate the service instance concept as a property (label) of a condition (e.g.,
The service flag has an important implication in our extended resource graph when considering the removal of existing services, the addition of services not initially present, and the relocation of services from one host to another. This flag is used to validate if a condition (and by extension, an exploit) is to be considered when optimizing the security of a network. For example, if a service that is currently enabled on the network, is removed (r service flag), then this service and the exploits associated to it, will not form part of the topology used to calculate the hardening metric. We further discuss this in Section 3.3. Additionally, because our extended resource graph models services that may not be present (due to the addition, removal, or relocation of said services), it will contain a small increase in the number of additional conditions and exploits. We believe this is acceptable if we consider that an administrator typically only deals with a limited number of possibilities to add, remove, or relocate resources. For the case of firewall rules, this would help to avoid the need for introducing new conditions and exploits into the extended service graph when firewall rules are to be disabled and hence we may work with a fixed structure of the extended service graph. Definitions 1 to 4 formally introduce these concepts.
Denote S the set of all services and
(Service flag).
Denote S the set of all services and
(Firewall rule pool and firewall rule).
Denote F the set of all firewalls and
(Extended resource graph).
Given a network composed of
a set of hosts H, a set of services S, with the service mapping the collection of service pools the collection of firewall rules a set of firewalls F, with the rule mapping and the labeling function
Let E be the set of exploits
Heterogeneous hardening control
We employ the notion of heterogeneous hardening control as a model to account for all hardening options in a network where we represent each initial condition as an optimization variable. We formulate the heterogeneous hardening control vectors using those variables as follows. The number of optimization variables present in a network will depend on the number of initial conditions that are affected by one or more hardening options (many exploits may share the same service instance, and hence the optimization variable). Since we only consider remotely accessible services in the extended resource graph model, we would expect in practice the number of optimization variables to grow linearly in the size of the network (i.e., the number of hosts). We will further evaluate and discuss the scalability of our solution in Section 4.
(Network hardening and hardening option).
Given an extended resource graph
(Optimization variable and heterogeneous hardening control).
Given an extended resource graph
Changing the value of an optimization variable has an associated hardening cost and the collection of such costs is given in a hardening cost matrix in a self-explanatory manner. Like in most existing works (e.g., [14,15,34]), we believe an administrator can estimate the hardening costs based on monetary, temporal, and scalability criteria like (i) installation cost, (ii) operation cost, (iii) training cost, (iv) system downtime cost and, (v) incompatibility cost. Taking this criteria as a point of reference, Section 2.3 provides a guideline on how our hardening costs are estimated. We define the hardening cost, hardening cost matrix, and the total hardening cost as follows.
(Hardening cost).
Given
(Hardening cost matrix).
The hardening cost matrix (HCM) is defined as a matrix in which the ith row and ith column both represent the ith hardening option. The collection of all hardening costs for all hardening options are given as a hardening cost matrix
(Total hardening cost).
Let
The above definition of hardening cost between each pair of service instances has three advantages. First, in practice we can easily imagine cases where the cost is not symmetric, i.e., changing one service instance to another (e.g., from Apache to IIS) carries a cost that is not necessarily the same as the cost of changing it back (from IIS to Apache). Our approach of using a collection of two-dimensional matrices allows us to account for cases like this. Additionally, by considering instance 0, it provides us the advantage to model disabling (or removing) a service as a special case of service diversification if the hardening option allows it. Second, our cost model concept can be used to specify many different types of cost constraints which can be added to the base formula as will be discussed in the next section. For example, an administrator might have configured service groups to group related services together (e.g., SIP, RTP, and RTSP) and a change in one service might also affect the others. In other words, the way our costs are calculated can be derived as a function of the status of other services or conditions. Finally, another advantage of our definition is the inclusion of negative costs. While at a first glance this concept may not seem self-evident, the inclusion of negative cost values can be interpreted as an incentive to opt for a specific option. For example, an administrator may want to phase out the use of
Cost estimation
Our main assumption for the values of these cost is that they are assigned by security experts or network administrators. While our cost model does consider that individual hardening costs can depend on factors such as downtime costs or the status of other services, we believe a baseline cost can be first estimated to better inform and justify the hardening costs. Therefore, we make use of Gartner’s 2003’s Total Cost of Ownership (TCO) analysis report [28] and Emerson–Ponemon Institute’s 2016’s analysis report on the cost of data center outages [33] to establish a more realistic cost estimate which a company might incur when selecting one or more hardening options. Based on Gartner’s report, a company’s costs can be divided into two main categories: base costs and ongoing costs. The base costs are mostly associated with planning costs that include, but are not limited to, server/software acquisition and installation costs. The ongoing costs are the costs of keeping a server, or a service, up and running. The ongoing costs are further divided into direct and indirect costs which include operational costs and downtime costs, respectively. A more detail list of different costs and how these may be associated with different hardening options is given in Table 1.
The association between Gartner’s TCO costs and hardening options. D: diversifying services; A: adding a new service; R: removing an existing service; M: relocating a service;
: connectivity based firewall rule;
: service based firewall rule;
: access control based firewall rule
The association between Gartner’s TCO costs and hardening options. D: diversifying services; A: adding a new service; R: removing an existing service; M: relocating a service;
Next, we apply the TCO’s ongoing costs as a reference point for estimating the hardening costs. It can be observed that direct costs (e.g., support costs, changes in upgrade costs or production control costs), as well as indirect costs (e.g., downtime cost), are costs that need to be considered when implementing a network hardening solution. Additionally, since the ongoing costs alone will incur on average around 85% of the total costs of ownership, it is reasonable estimation to use the ongoing costs as the baseline reference for hardening costs. Furthermore, since our hardening options (diversifying, adding, removing, and relocating services, as well as modifying firewall rules) mainly involve existing service instances (inside the service pool), we only consider ongoing costs for hardening and assume the base costs (acquisition and installation) are already applied before the hardening process. As seen in Table 1, because the indirect costs make up at least 50% of the total ongoing costs, we can further narrow down the base of the hardening costs as being based on the indirect costs, in particular the system downtime cost. In Emerson–Ponemon’s 2016’s [33] report on the downtime costs of a data center, the impact that downtime costs can have on a network is highlighted. Based on their industry benchmarks and insights, our hardening costs can be estimated by system administrators in making decisions about network hardening. Although the hardening cost can be defined based on system downtimes in more rigorous ways, we will adopt the simple estimation method given in [23] as follows:
Because the Fraction Employees Affected by Outage and the Fraction Revenue Affected by Outage are not values readily available, an educated guesses based on about plausible range should be considered.
To better illustrate this, we take as an example the reported 2015 revenue for Amazon. This revenue was reported at approximately $107 billion [29] with approximately 250,000 employees for that same year [37]. From this information, the approximate revenue per hour (considering that Amazon is a 24/7 business) is about $12M. Assuming an average annual salary of an employee being around $100,000 then we can have approximate yearly expenditure of $25B on salaries or approximately $471M per week for all staff. If we consider that an Amazon employee works on average 50 hours per week, then the average expenditure per salary per hour is around $9.4M per hour. We assume that if an outage for the ftp services affects 84% of the revenue, that would equate to a loss of around $10M. If it affects 85% of the employees, then that would equate to approximately $8M. Thus, the total revenue loss for an outage would be valued at approximately
The above discussions only provide a starting point for both network administrators and security to estimate hardening costs, and those can certainly be refined, e.g., by considering outage prevention mechanisms which may reduce the downtime.
The security metric used in this paper is an extension of the k-zero-day safety metric [40]. Specifically, our metric is based on the minimum number of distinct resources, excluding those with unpatchable vulnerabilities, on the shortest attack path in the extended resource graph, with the extension for considering the uneven distribution of services along that path [44,47], as well as the unpatchable services. It is formally defined below.
(h-safety metric).
Given an extended resource graph
In Fig. 3, we can see that while both paths have three unique exploits, their associated h metric will be different due to the difference in the relative frequency of each exploit. Since h is the minimum value between the two, the h value between these two paths would be equal to
Problem formulation
As demonstrated in our discussions about the motivating example in Section 1.1, hardening a network with multiple options demands a systematic and automated approach. For any data center or cloud network, to manually conduct the network hardening task is not feasible, as demonstrated earlier by the small network in our motivating example. Applying the h-safety metric (or simply the h metric) defined in previous section to Fig. 3, it is not straightforward to see how changing the number of unique exploits and their relative frequency will affect the overall value of the h metric. On the other hand, it is clear that by changing the service instances, modifying firewall rules, or adding, removing or relocating services, the network’s h metric value can likely be improved. This motivates for a systematic and automated solution. Consequently, we consider the concrete network hardening problem of maximizing the h metric value by optimally changing the hardening options, while respecting the available budget in terms of given cost constraints. In the following, we formally define this as an optimization problem.
(h-optimization problem).
Given an extended resource graph
Since our problem formulation is based on an extended version of the resource graph, which is syntactically equivalent to attack graphs, many existing tools developed for the latter (e.g., MULVAL [31] or CAULDRON [25]) may be easily extended to generate extended resource graphs. Additionally, our problem formulation assumes a very general model of budget B and cost Q, which allows us to account for different types of budgets and cost constraints that an administrator might encounter in practice, as will be demonstrated in the following section.
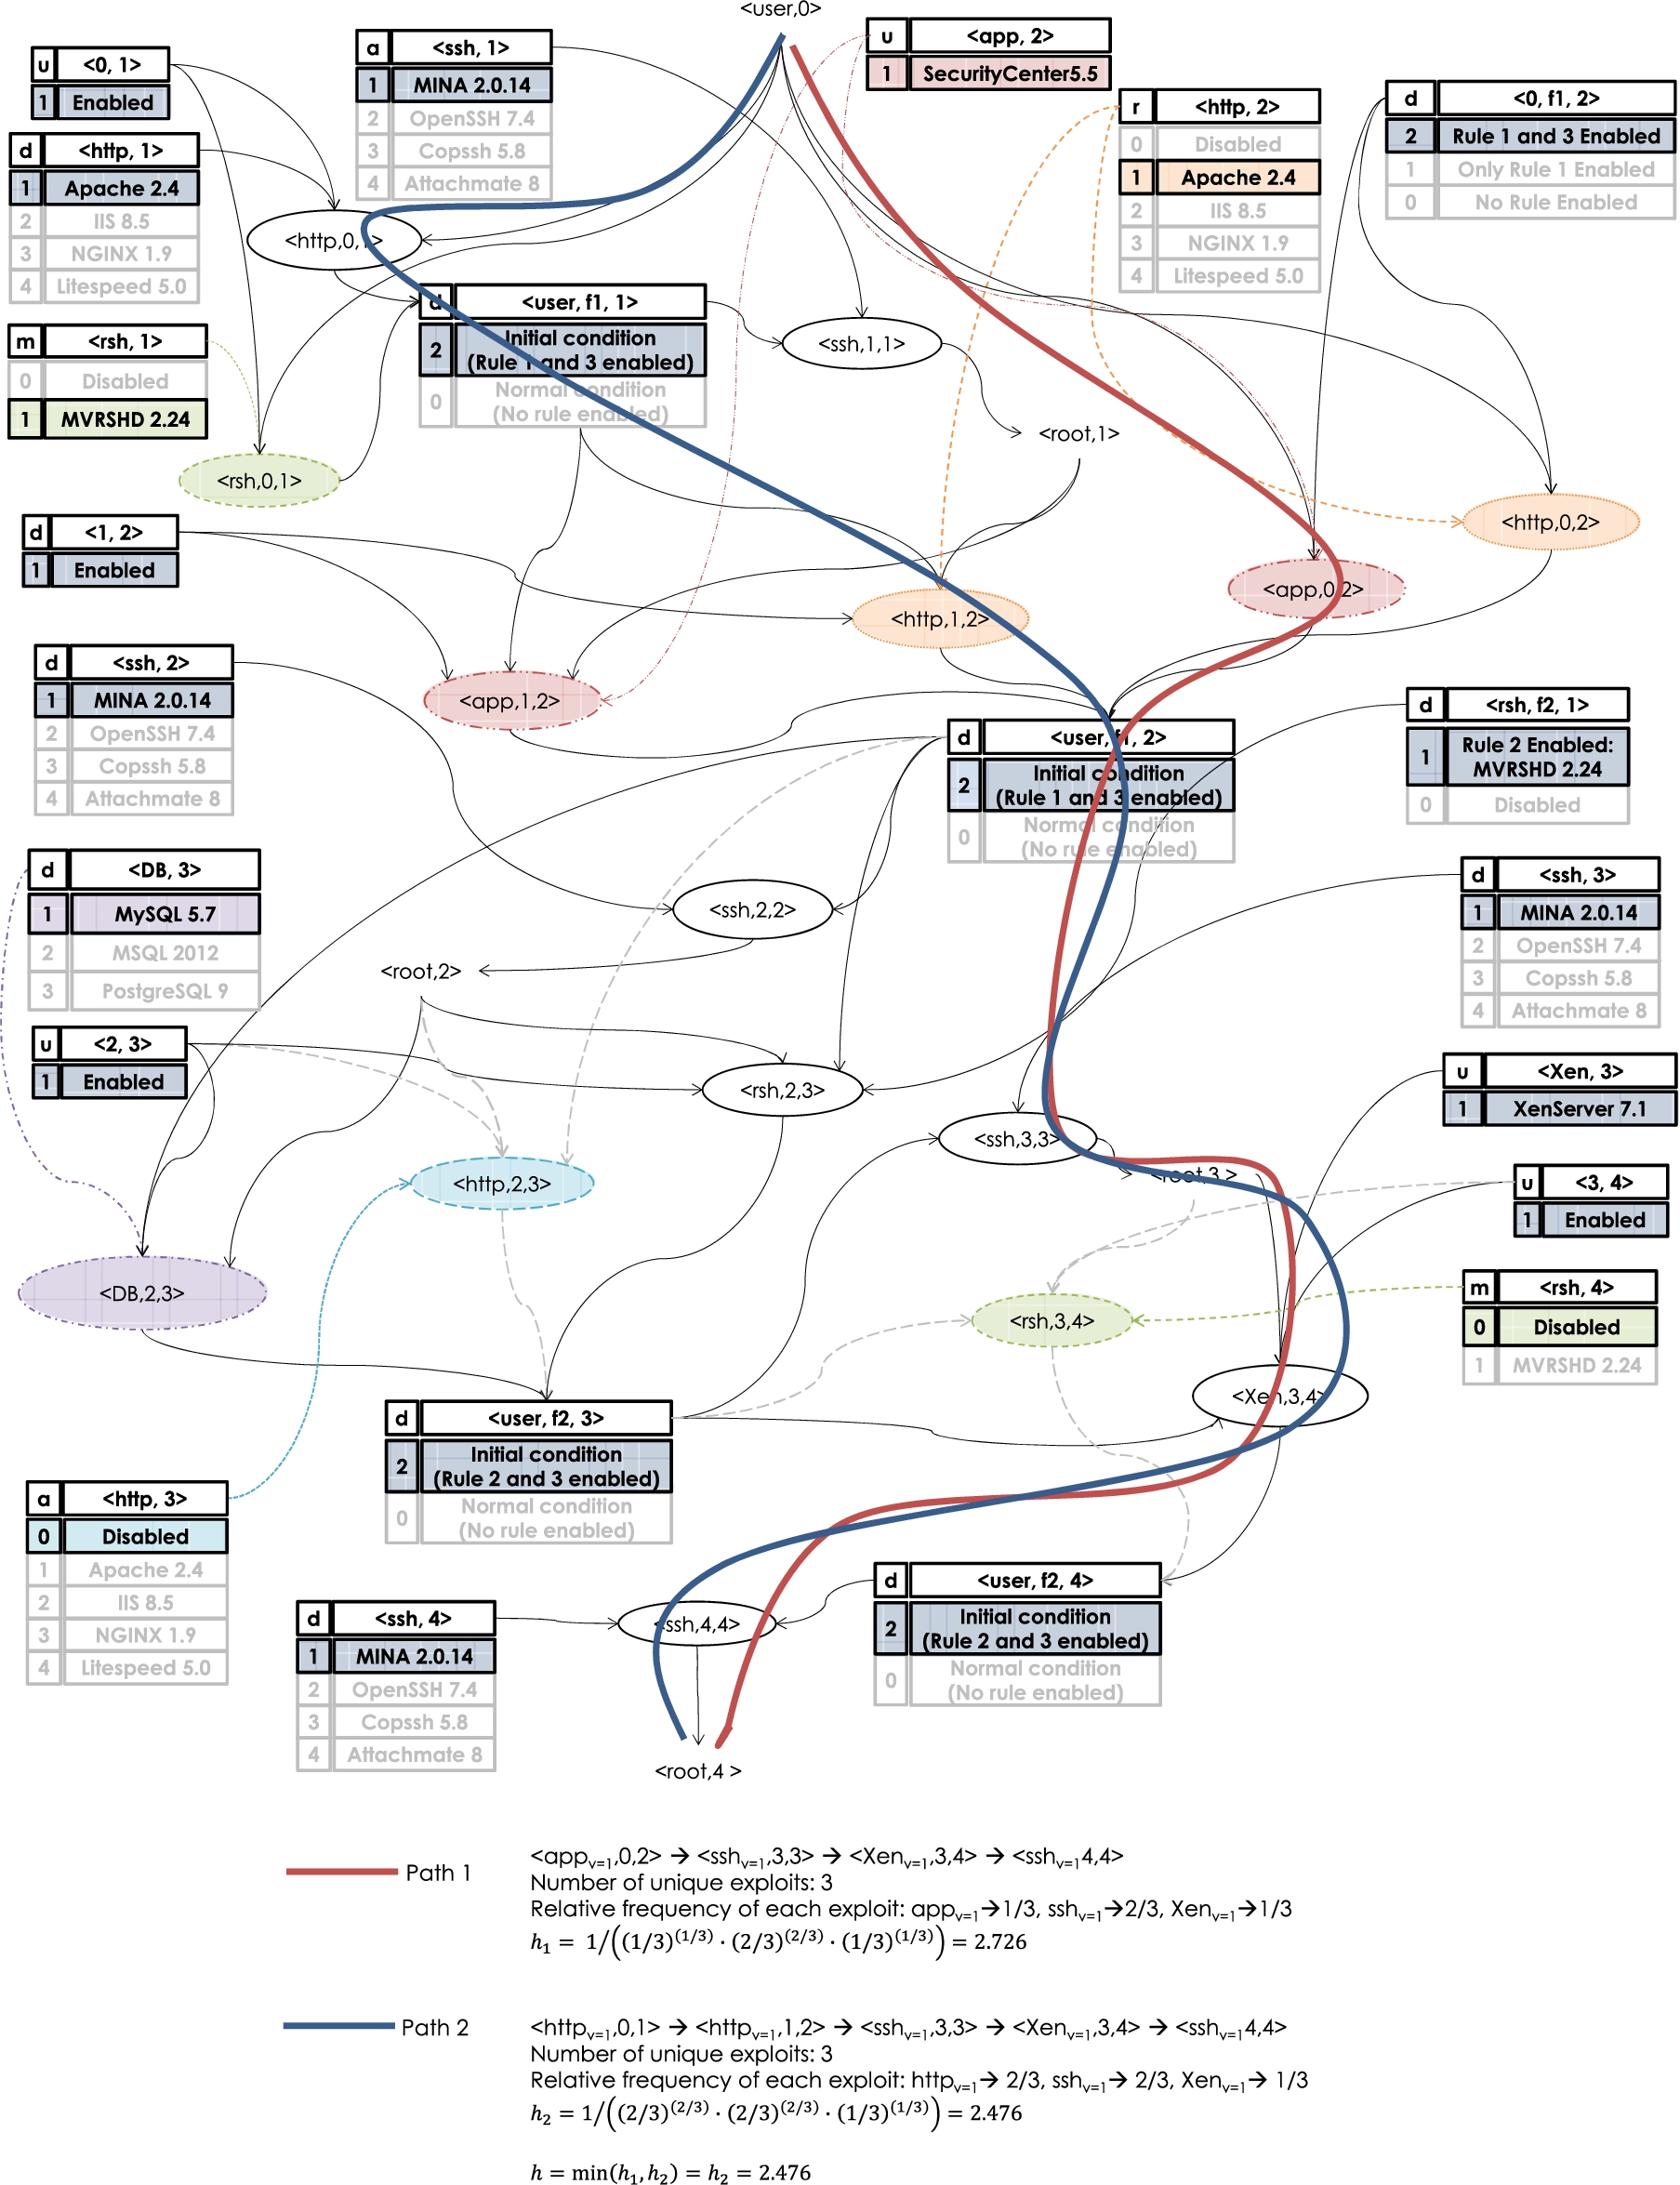
h metric example.
Finally, the problem is NP-hard since the sub-problem of finding the shortest paths (within the objective function) in resource graphs is already intractable by the well know results in attack graphs. Specifically, due to the common syntax between resource graphs and attack graphs, calculating
This section details the optimization and heuristic algorithms used for solving the formulated hardening problem and describes a few case studies.
Optimization algorithm
Our first task is to select an optimization algorithm that is suitable for solving the hardening problem. Generally, there exist mainly two types of optimization algorithms: Conventional methods or exact algorithms and meta-heuristic approaches [17]. Exact (gradient-based) algorithms, such as Lagrangian relaxation and branch and bound, consider all the solution spaces to give a global solution [5]. However, it is well known that most of these methods require to satisfy mathematical properties like convexity or differentiability [22], which are not applicable to our problem. The problem we want to solve includes different if-then-else constructs to account for the different hardening techniques used (as well as the cost constraints), and thus, an algorithm that allows to insert this construct is necessary. Meta-heuristic approaches, such as genetic algorithm, particle swarm optimization, imperialist competitive algorithm, etc., consider some parts of the solution space to reach a global optimum or near-solution optima, which provides an advantage when dealing with discrete variable spaces [5], which closely match the requirement of our hardening problem. They provide a simple and robust search method and optimization technique. Because the problem we want to solve uses variables that are defined as discrete, a meta-heuristic approach is needed.
In particular, the genetic algorithm (GA) provides a simple and clever way to encode candidate solutions to the problem [12]. One of the main advantages is that we do not have to worry about explicit mathematical definitions (which allow for a quick implementation). For our automated optimization approach, we chose GA, which is popular among the different evolutionary algorithms due to certain characteristics: It requires little information to search effectively in a large search space in contrast to other optimization methods (e.g., the mixed integer programming [5]); and that it uses both crossover and mutation operators which makes its population more diverse and thus more immune to be trapped in some local optima. While our work was inspired by [14], our main difference and contribution is that we focus on multi-option hardening and not just on disabling services.
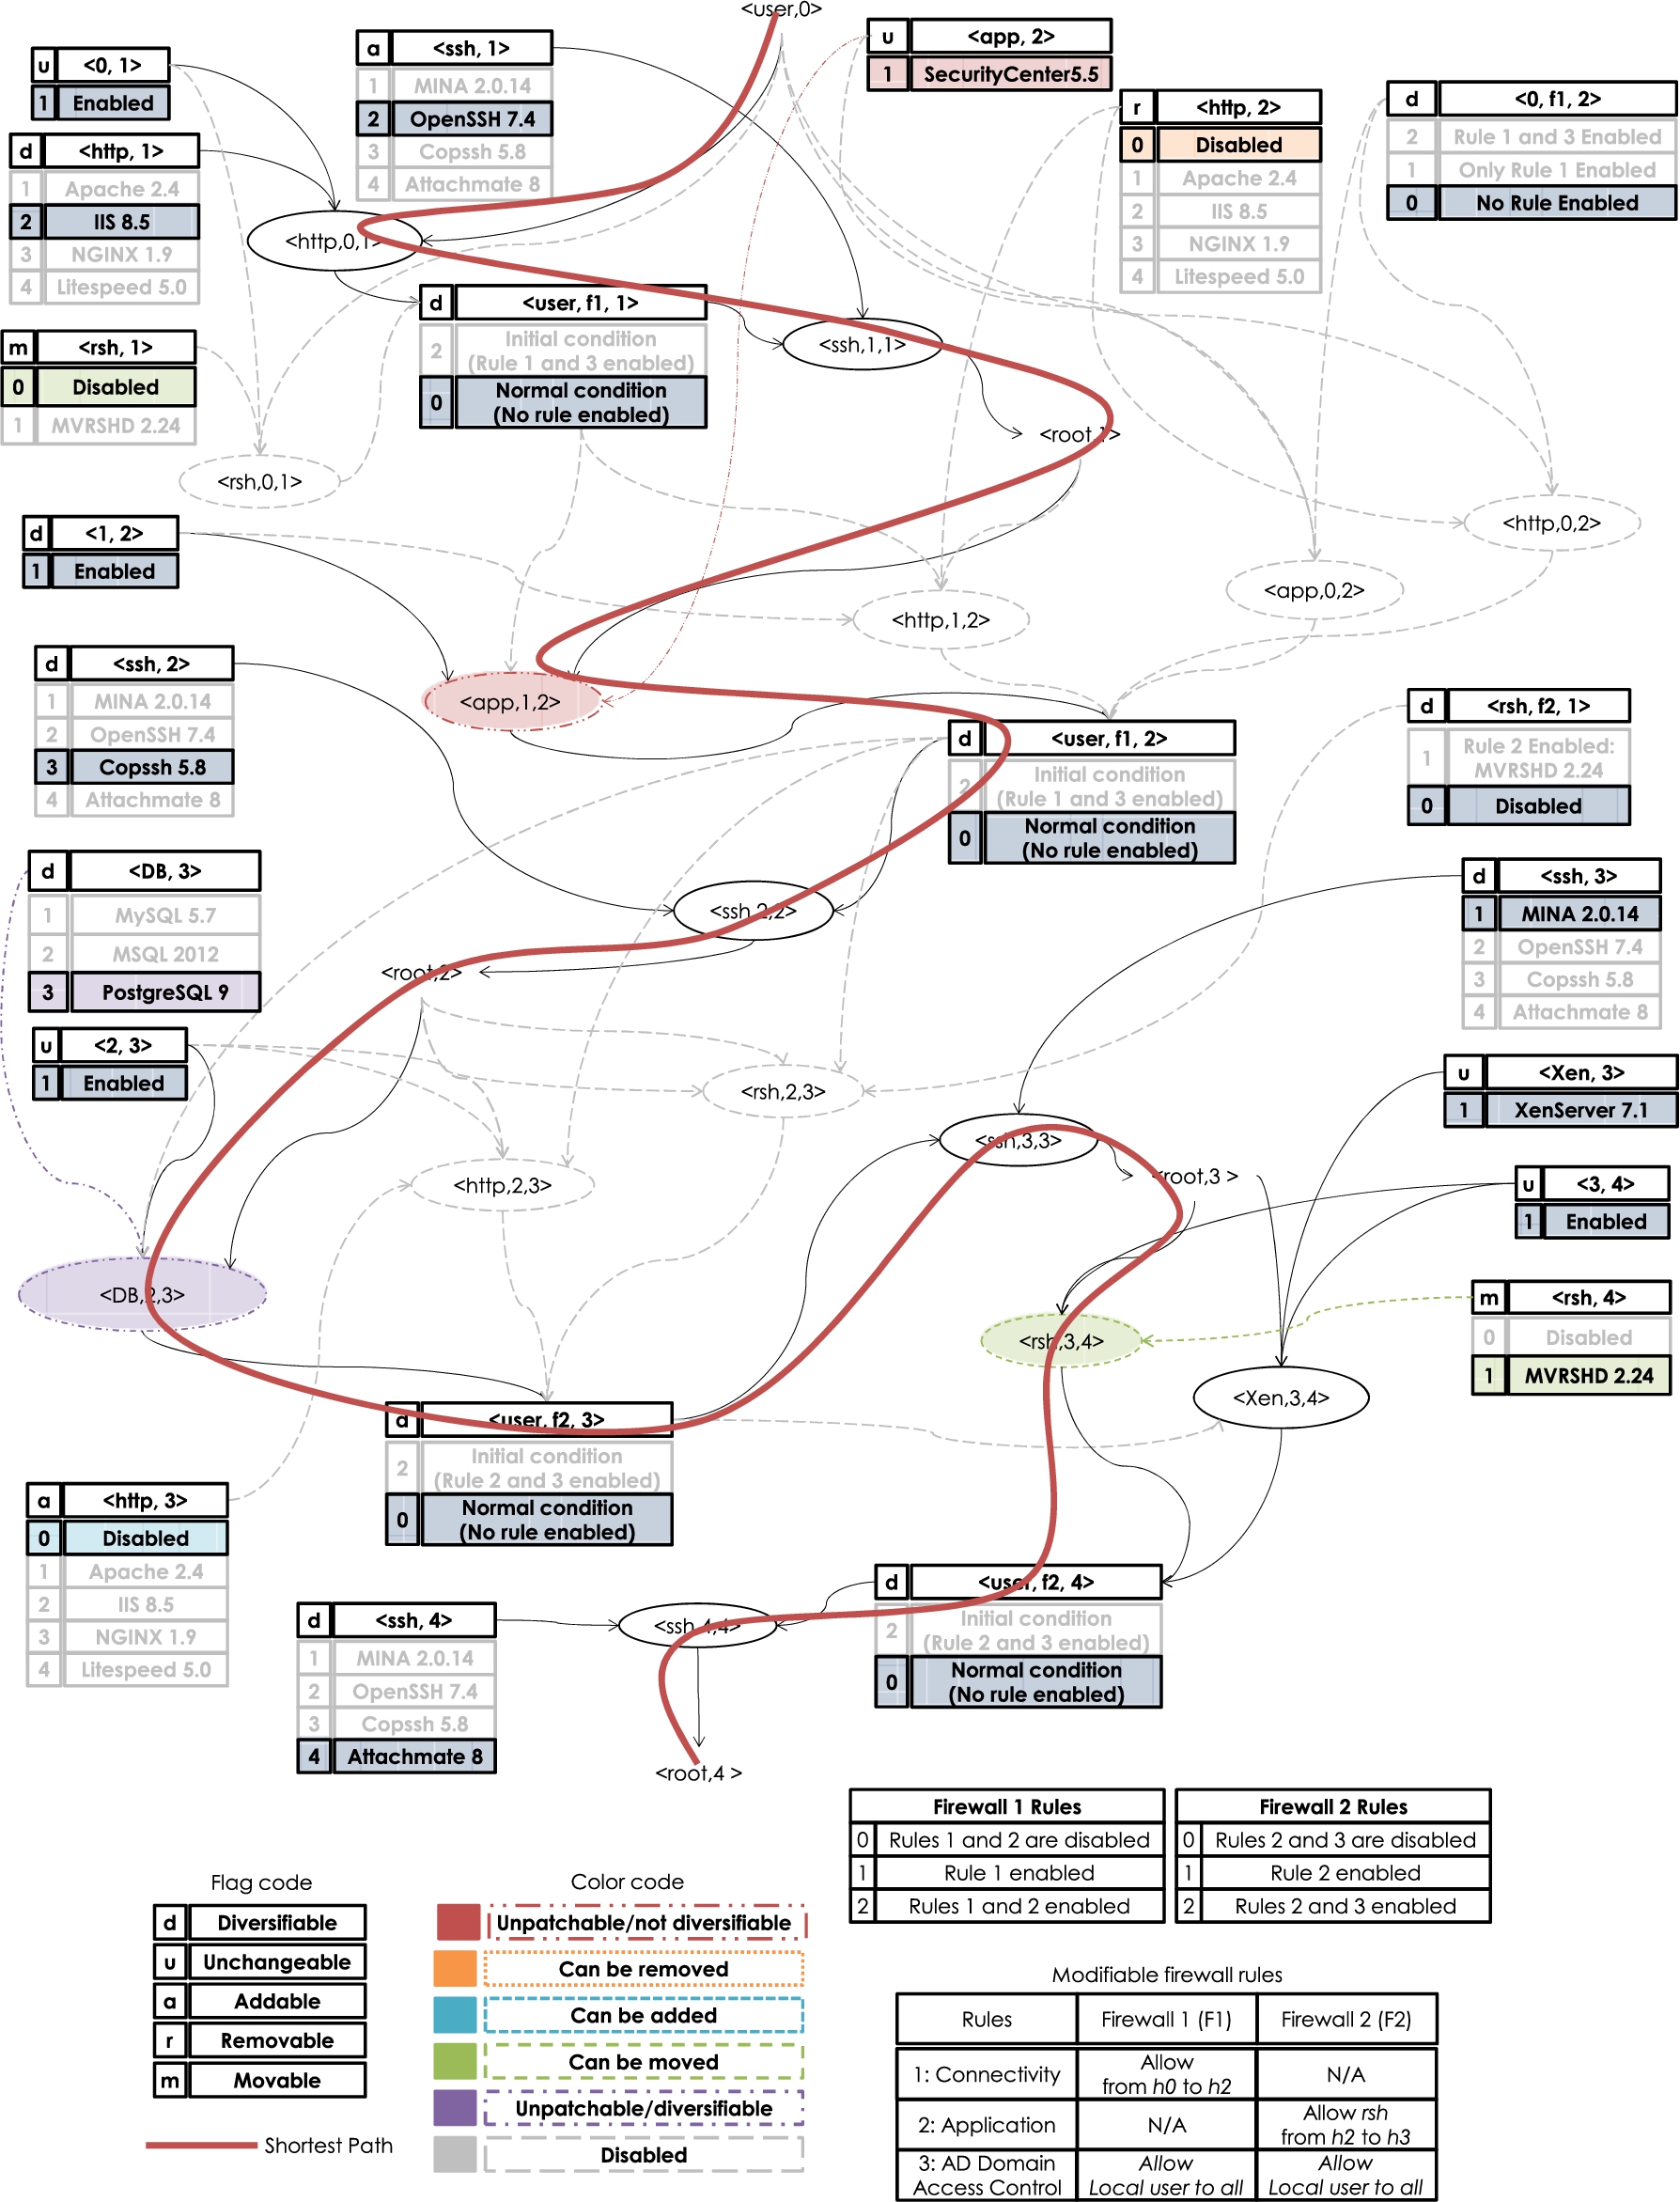
The extended resource graph is the input to our automated optimization algorithm where the function to be optimized (fitness function) is the h metric of the extended resource graph. There are two important points to consider when optimizing the h metric function on the extended resource graph for each generation of the GA: (i) the graph’s service instance labels for the chosen hardening option will dynamically change. (ii) the actual shape of the graph will dynamically change due to the firewall rules and the service flag labels which account for the added, removed, and relocated services. This in turn will change the value of h, since the shortest path may have changed with each successive generation of GA and the change in the hardening options (as well with the adding, removal, and relocation of services) will enable or disable certain conditions, vulnerabilities, and paths. Our optimization tool takes this into consideration. Additionally, if there are more than one shortest path that provides the optimized h, our optimization tool gives priority to the paths by considering the uneven distribution and relative frequency of resources in that path, thus addressing one of the limitations that was present in [9] where no priority was provided.
The constraints are defined as a set of inequalities in the form of
The number of independent variables used by the GA (genes) are the optimization variables given by the extended resource graph. For our network hardening problem, the GA will be dealing with integer variables representing the selection of a hardening option. Because
Use cases
Use Case A: Effect of modifiable hardening options and budget constraints.
Use Case B: Effect of having an unpatchable vulnerability in the network.
In the following, we demonstrate potential use cases of our method with varying cost constraints and hardening options. For these use cases, the population size defined for our tool is set to be at least the value of optimization variables (more details will be provided in the coming section). This way we ensure the individuals in each population span the search space. We ensure the population diversity by testing with different settings in genetic operations (like crossover and mutation). For all the use cases, we have used the following algorithm parameters: population size = 100, number of generations = 150, crossover probability = 0.8, and mutation probability = 0.2.
Use Case A:
The solution provided by the GA is a h metric of 8. This total hardening cost satisfies both the overall budget constraints. We can see that the hardening options enforced by the firewall rules and the relocation of services in our optimization tool can affect the optimization. Nevertheless, additional budget constraints might not allow achieving the maximum possible h value.
h metric value for different hardening options for when no unpatchable vulnerabilities are present (Use Case A), up to 4 unpatchable vulnerabilities (Use Case B)
Use Case B:
In Fig. 5, we can see that the
It is interesting to note, based on the results shown on Table 2, that not all hardening options can help increase the network’s resilience against zero-day attacks. Applying one set of options might have no effect at all and some options can even reduce the resilience of the network, as seen in values of the h metric when only firewall rules are applied. It is worth noting that our proposed solution is capable of increasing the resilience of a network even in the presence of unpatchable vulnerabilities.
As seen from the above use cases, our model and problem formulation makes it relatively straightforward to apply any standard optimization techniques, such as the GA, to optimize the h metric through combining different network hardening options while dealing with unpatchable vulnerabilities and respecting given cost constraints.
All the test cases described above rely on two main assumptions (i) that the firewall rules and relocation of service will enable or disable conditions and exploits (ii) that all the attack paths are readily available. We will design an algorithm specifically for the special cases where conditions and exploits are removed from the extended resource graph (as a result from disabling or relocating services). As to the second case, due to the well-known complexity that resource graphs have inherited from attack graphs due to their common syntax [44,47], it is usually computationally infeasible to enumerate all the available attack paths in a resource graph for large networks. Therefore, we present a modified version of the heuristic algorithm [9,10] to reduce the search complexity when calculating and optimizing the h metric by only storing the m-shortest paths at each step, and which is shown in Fig. 7.
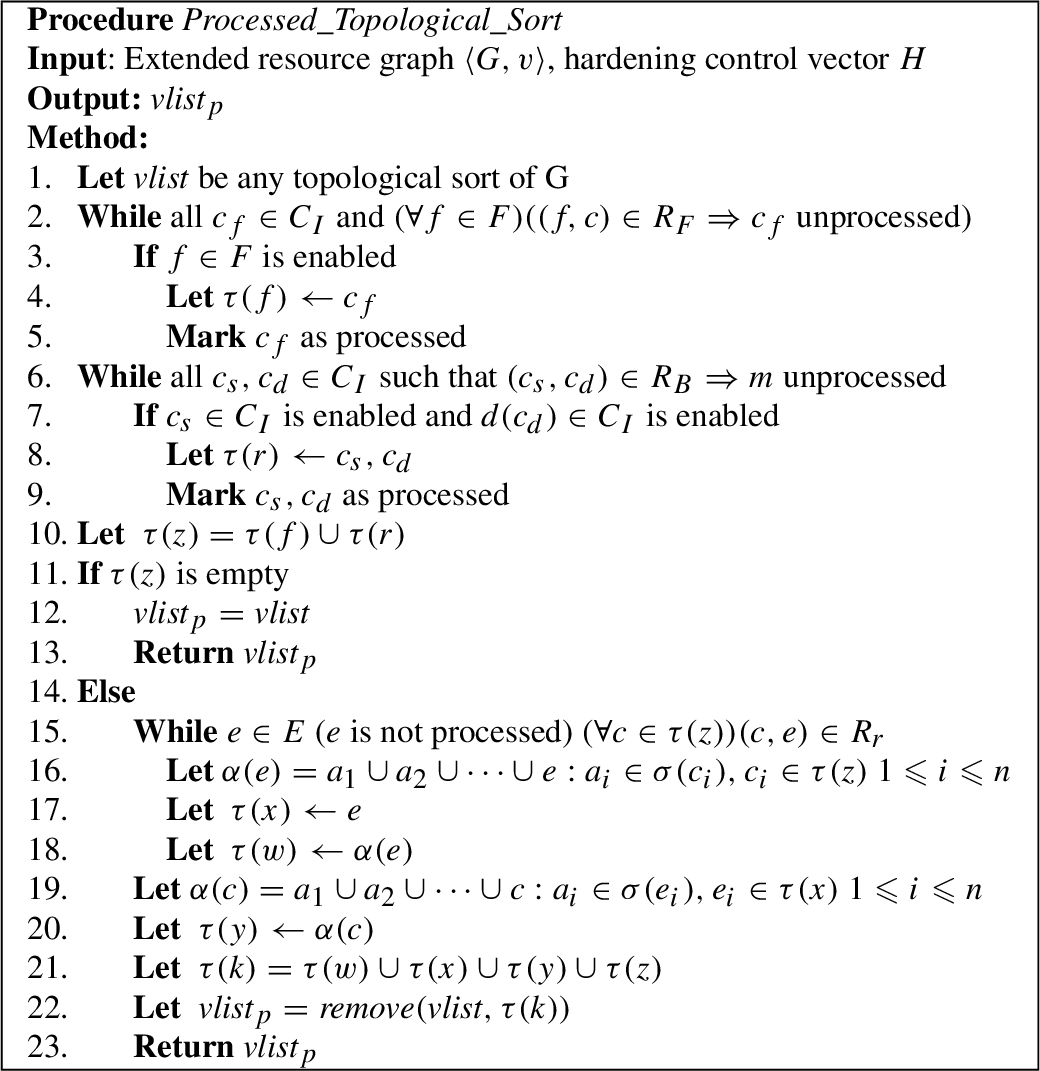
Algorithm for eliminating infeasible conditions and paths.
The algorithm in Fig. 6, which has linear complexity (
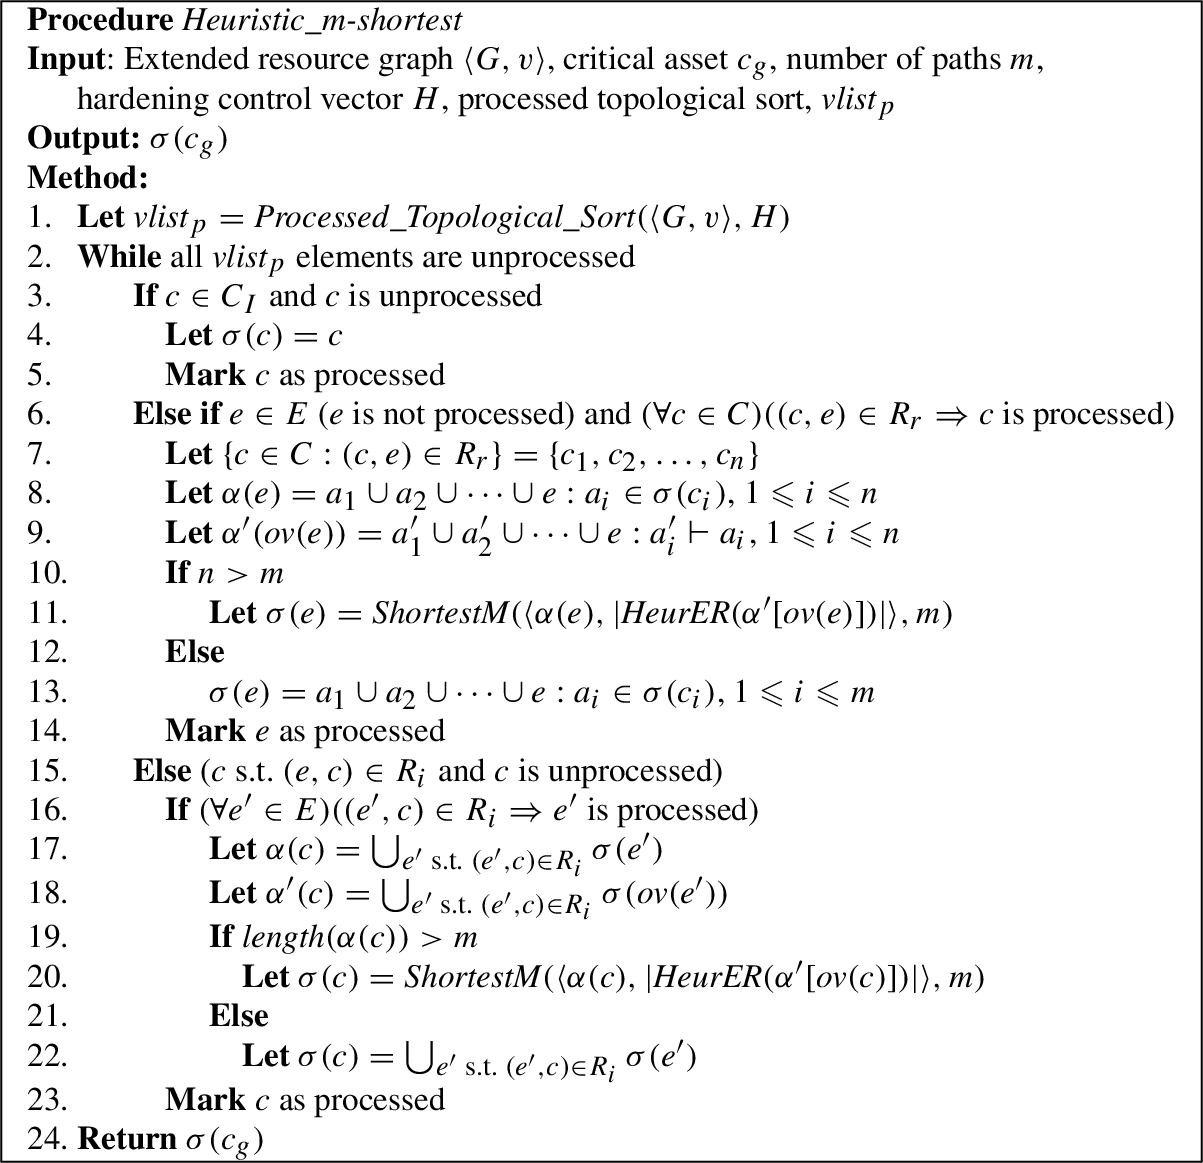
A Heuristic algorithm for calculating m-shortest paths.
The algorithm on Fig. 7 is similar to the previous one and thus also has an
In this section, we show simulation results. All simulations are performed using a computer equipped with a 3.0 GHz CPU and 8 GB RAM in the Python 2.7.10 environment under Ubuntu 12.04 LTS and MATLAB 2015a’s GA toolbox. To generate many resource graphs for simulations, we first construct a small number of seed graphs based on realistic networks and then generate larger graphs from those seed graphs by injecting new hosts and assigning resources in a random but realistic fashion (e.g., the number of pre-conditions of each exploit is varied within a small range since real world exploits usually have a constant number of pre-conditions). For the different hardening options that are implemented through firewall rules, we randomly select 10% of the initial conditions. Additionally, to analyze the effect of unpatchable vulnerabilities, our graphs include randomly assigned unpatchable services. The resource graphs are used as the input for the optimization toolbox where the objective function is to maximize the minimum h value subject to budget constraints.
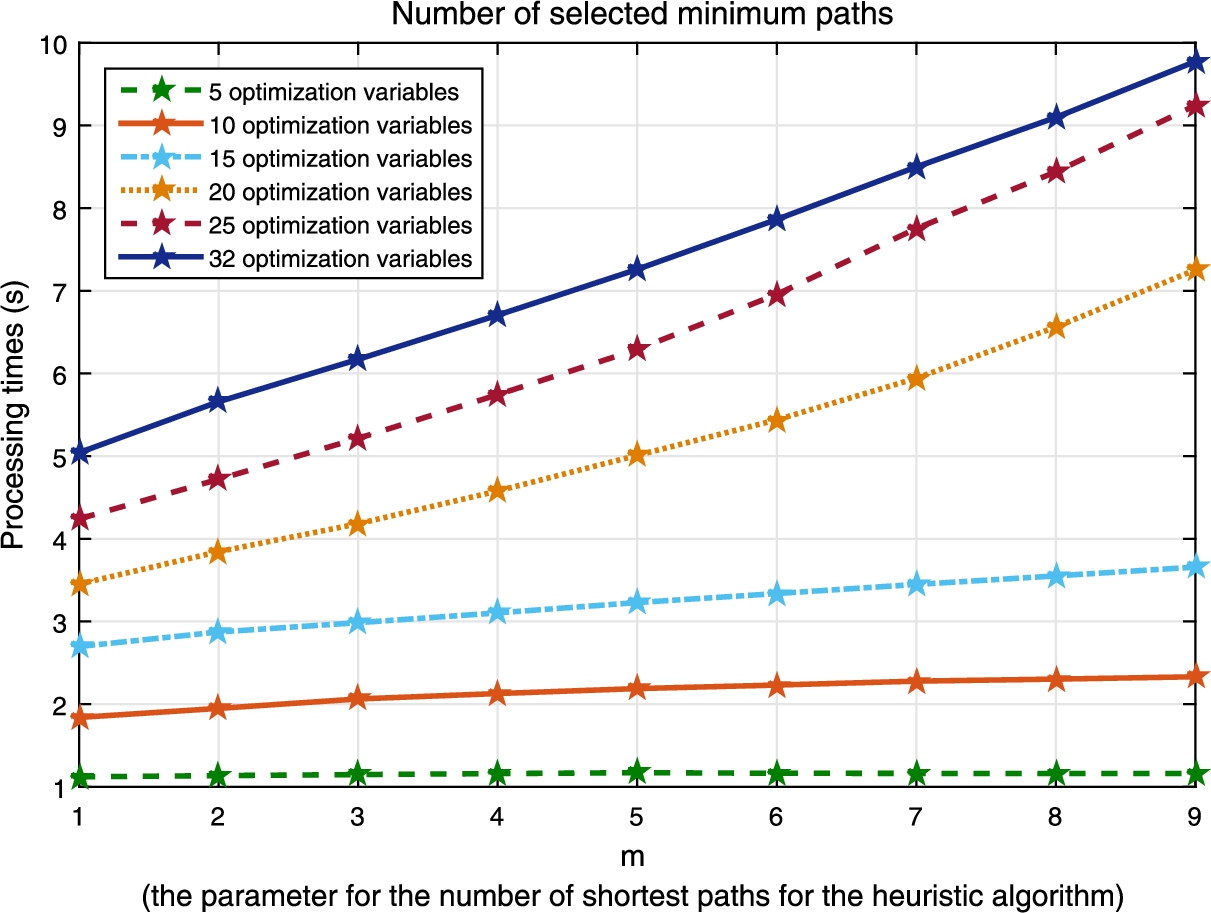
The processing time.
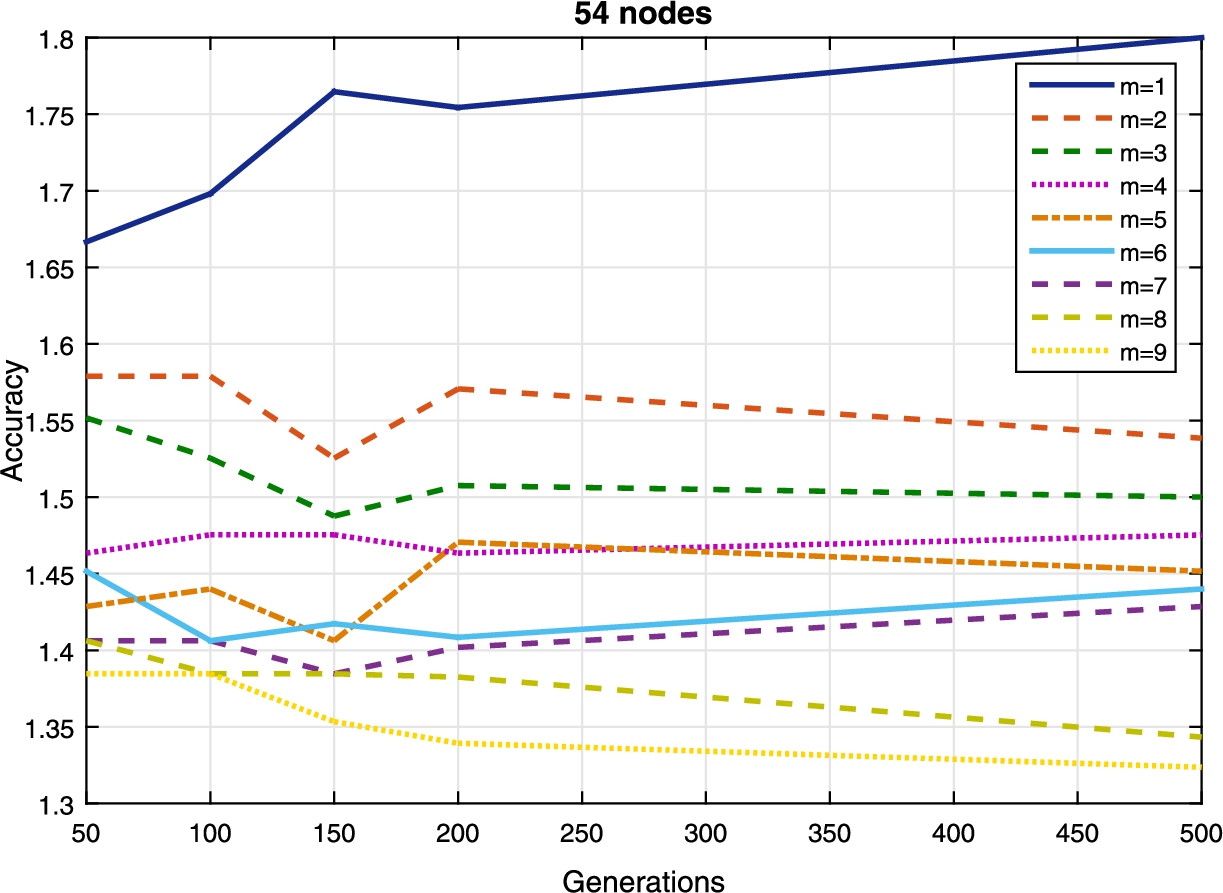
The accuracy vs m (the parameter of the heuristic algorithm).
To determine the genetic operators, we used the hill climbing algorithm. Our simulations showed that, using the GA with a crossover probability of 80%, a mutation rate of 20%, and setting the number of generations to 70 will be sufficient. Additionally, our experiences also show that, because our largest resource graph had a heterogeneous hardening control vector of fewer than 100 variables, we could set the population size equal to 200; nevertheless, we believe that when dealing with a bigger number of optimization variables, the population size that is at least twice number of variables.
The complexity of our proposed solution will depend on the objective function, the population size, and the length of hardening control vector. Since the optimization problem is NP-hard, we will rely on the heuristic algorithm presented in Section 3.3. Figure 8 shows that the processing time increases almost linearly as we increase the number of optimization variables or the parameter m of the heuristic algorithm. The results show that the algorithm is relatively scalable with a linear processing time.
The accuracy of the results presented in Fig. 8 is evaluated through simulations. This is addressed through the simulations depicted in Fig. 9. Here the accuracy refers to the approximation ratio between the result obtained for the h metric using our heuristic algorithm and that of simply enumerating and searching all the paths while assuming all services and service instances are different (
We also consider the ratio between the difference in the h metric before and after optimization, (
In Fig. 11, we analyze the average gain in the optimized results for different sizes of graphs. In this figure, we can see that we have a good enough gain for graphs with a relatively high number of nodes. As expected, as we increase the number of unpatchable vulnerabilities, the gain will decrease. However, we can also see this decrease is linear. In the case where no unpatchable vulnerabilities are present, we can see that the gain stops to increase after reaching a certain size of the graph, which can be explained as that the number of available service instances is not large enough (in contrast to the increasing size of the graph) to allow to optimize the h metric any further.
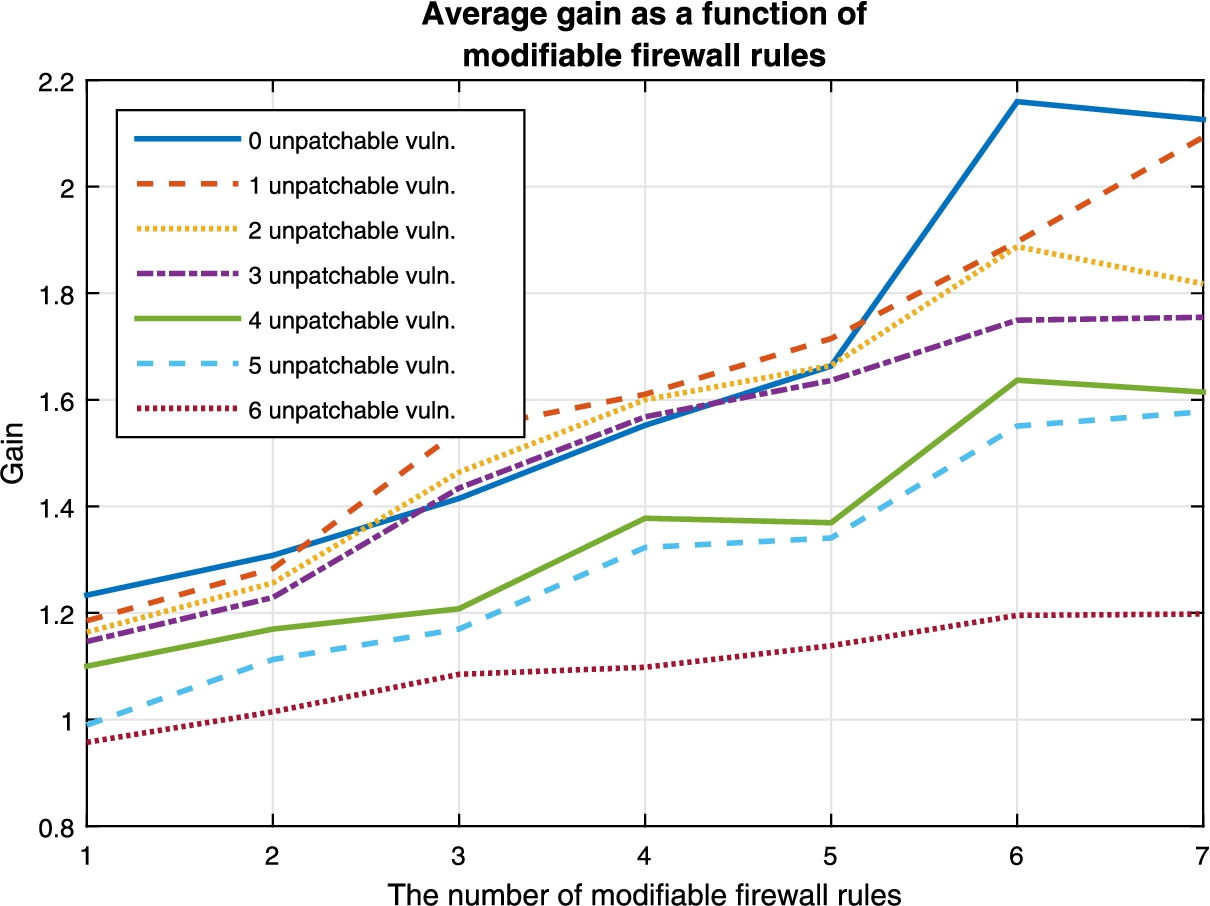
The average gain based on the number of modifiable firewall rules.
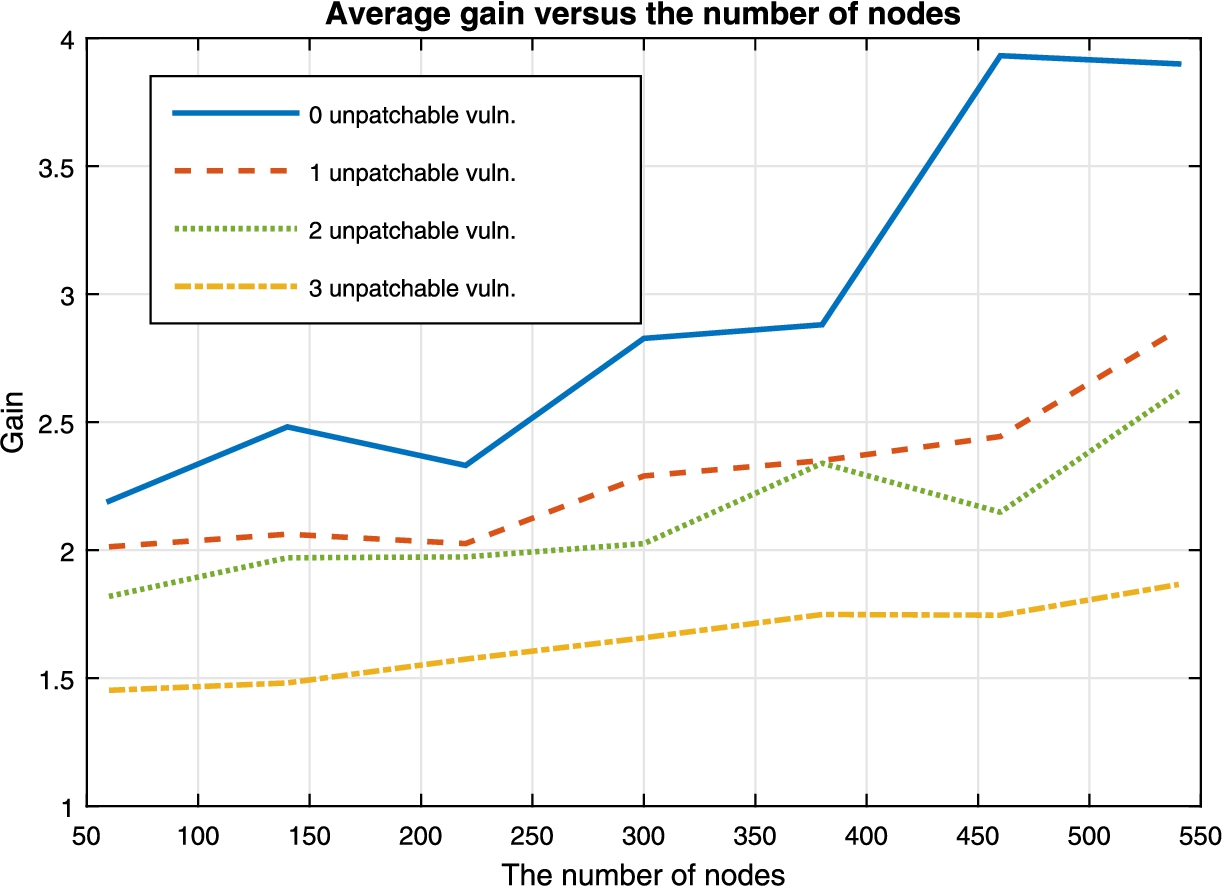
The average gain vs the number of nodes.
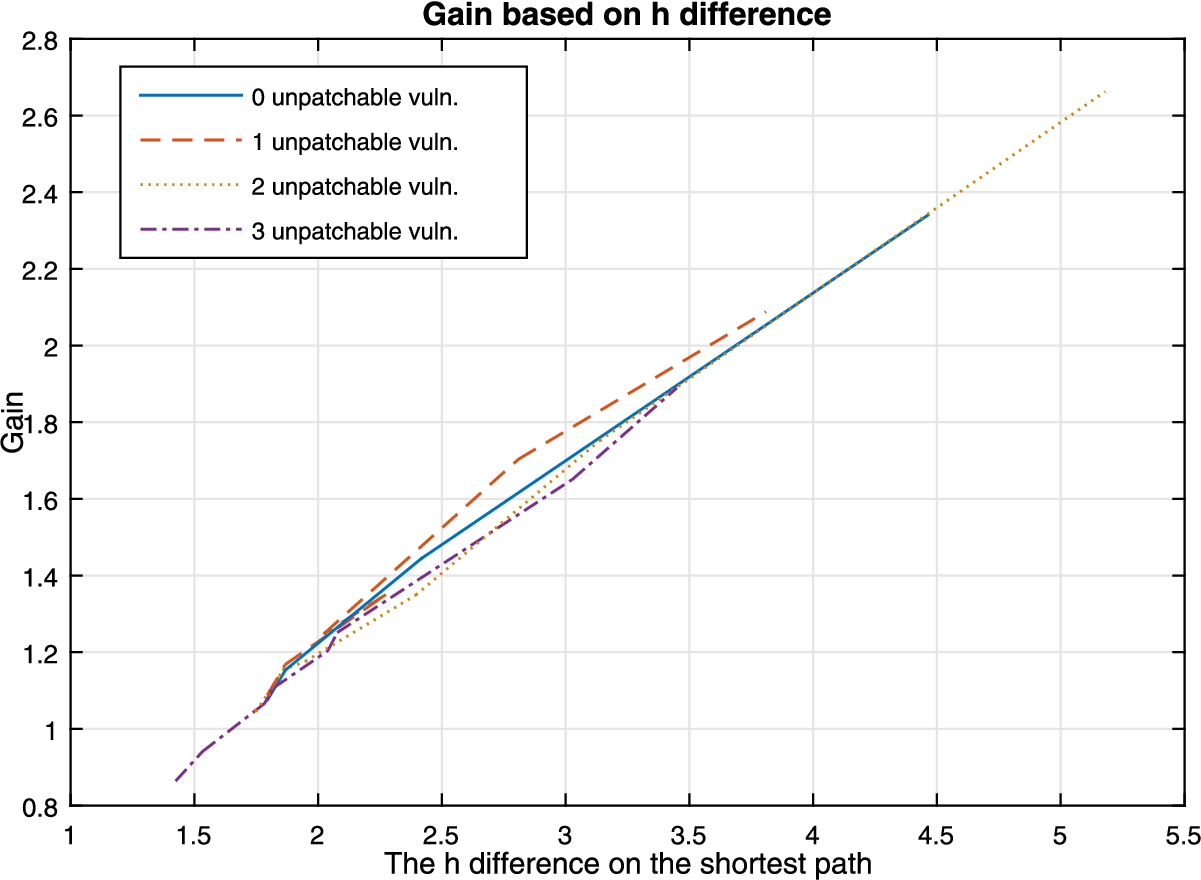
The h difference on the shortest path.
Figures 12 and 13 show the optimization results of different shapes of resource graphs in terms of depth and degree of exposure, which roughly represents the extent to which the network is protected. While it may be difficult to exactly define the depth of a resource graph, we have relied on the relative distance, i.e., the difference of the shortest path before and after all hardening options have been applied. There is a linear increase in the gain as we increase the relative distance in the shortest path. This is independent of the amount of unpatchable vulnerabilities. While this does not provide an accurate description of the graph’s shape, it does provide an idea of how much our algorithm can increase the minimum h for graphs with different depths, as shown in Fig. 13, we can see the effect of the network’s degree of exposure, which is defined as the number of exploits that are directly reachable by the attacker from the external host
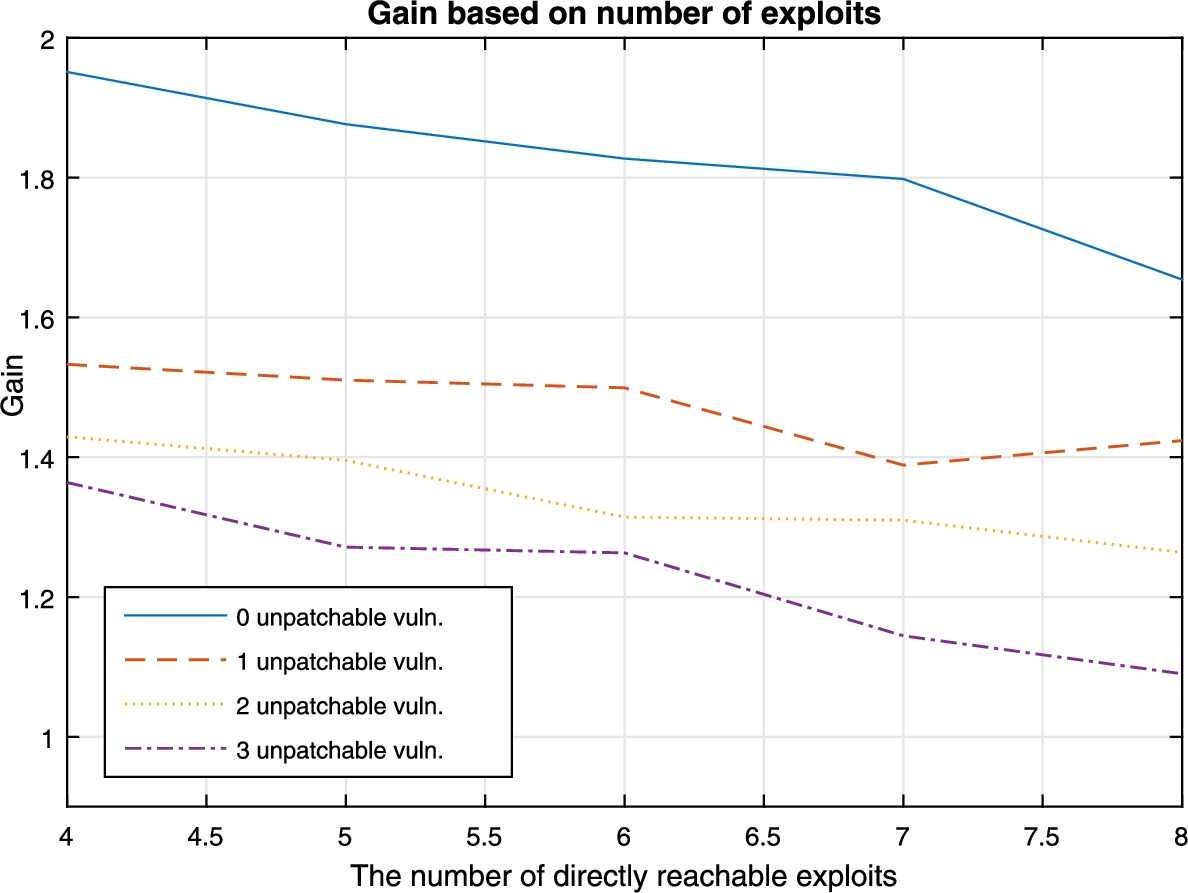
The number of directly reachable exploits.
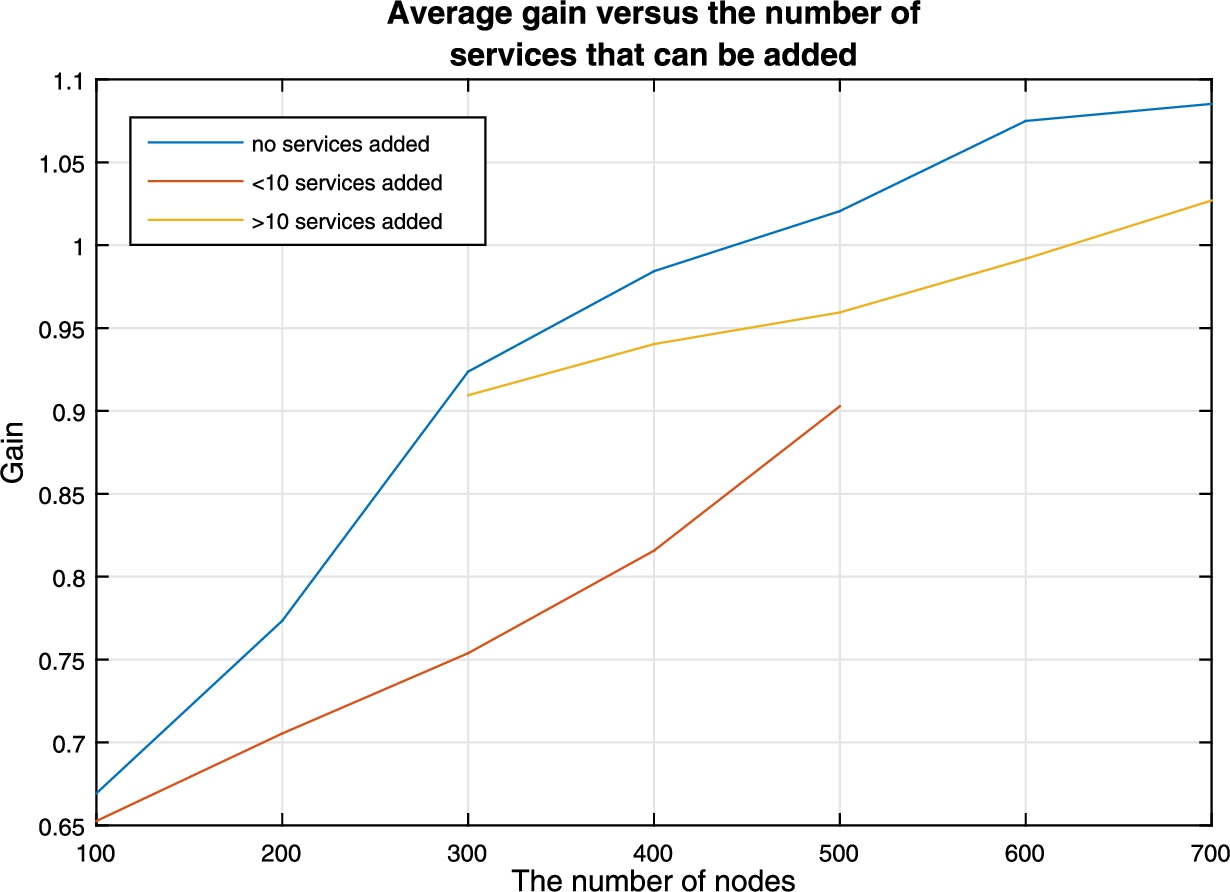
The average gain based on the number of services that can be added.
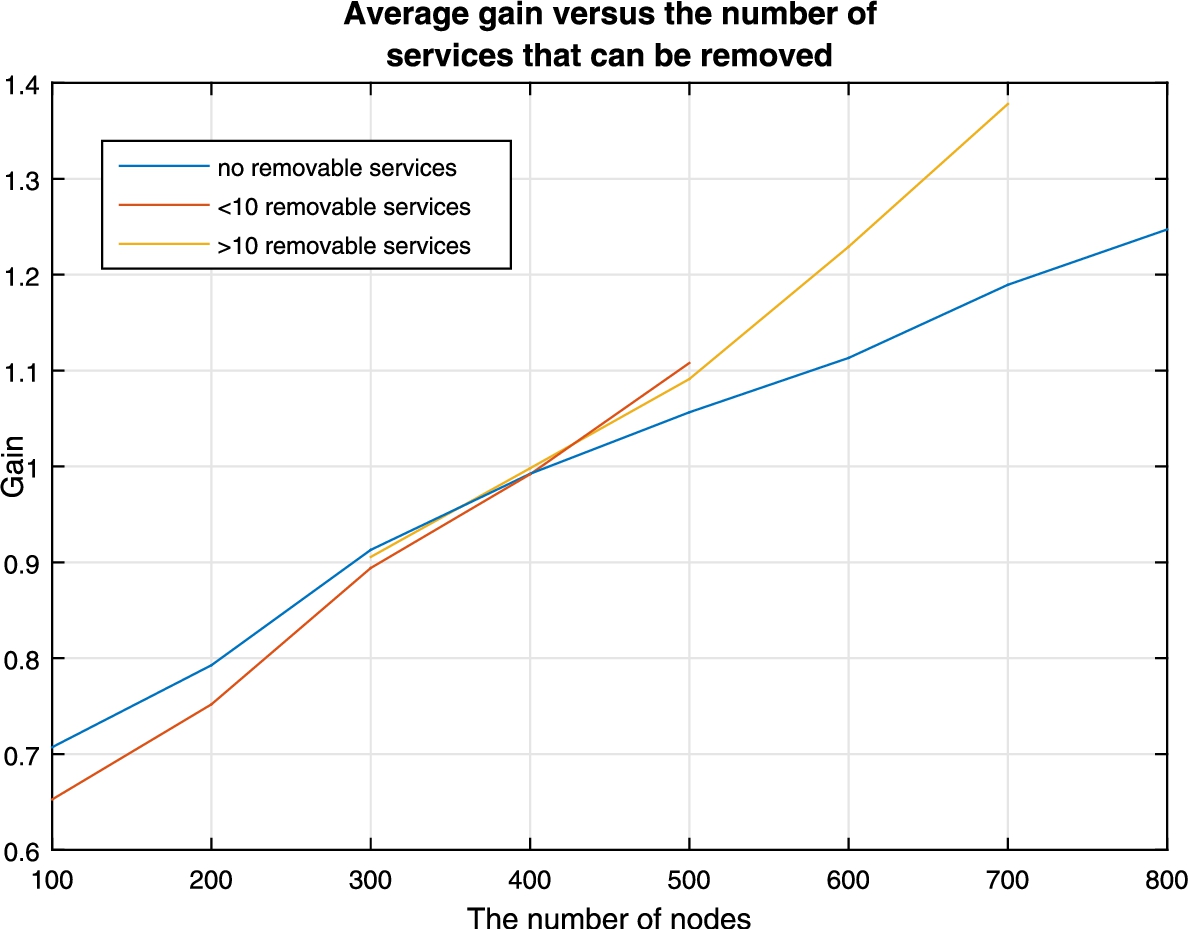
The average gain based on the number of services that can be removed.
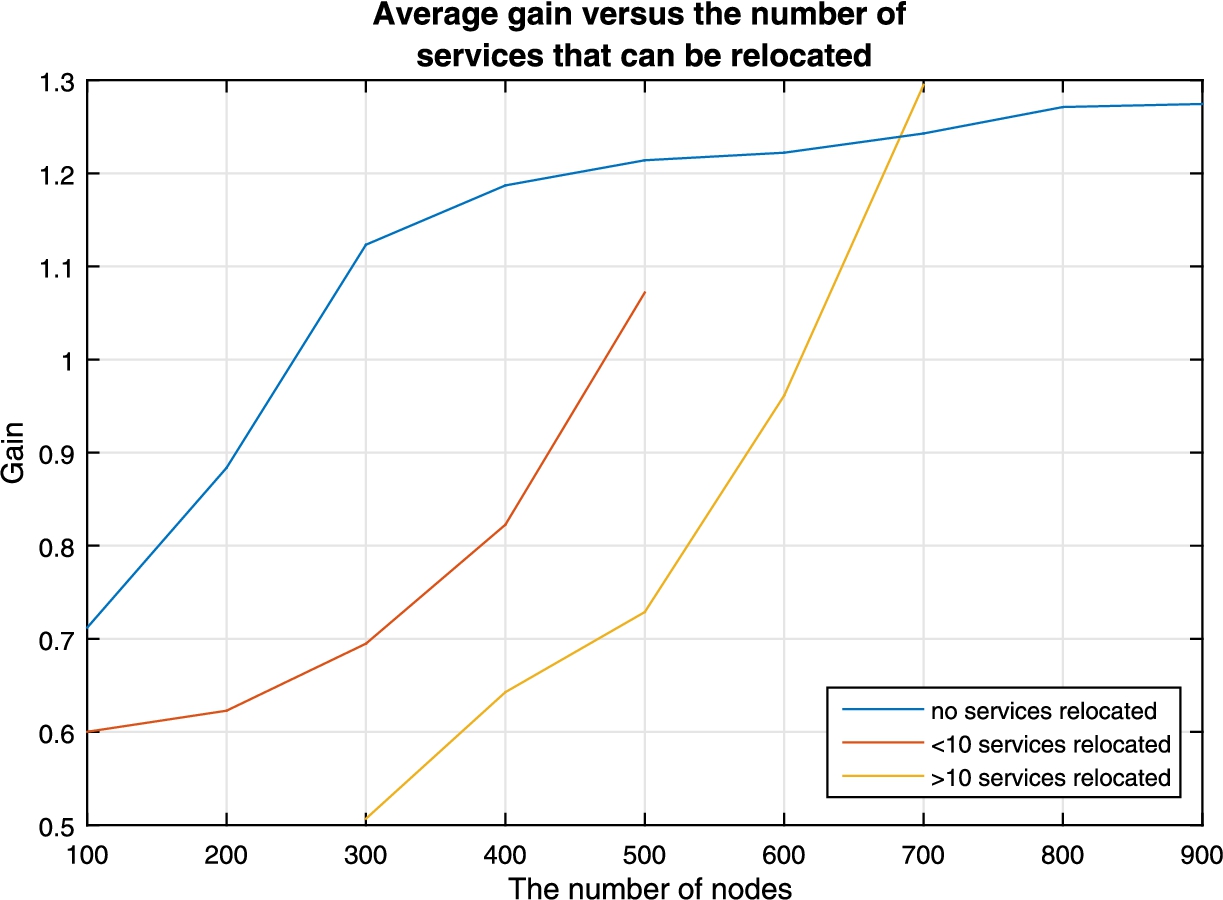
The average gain based on the number of services that can be moved.
Figures 14 to 16 show the gain is affected by the inclusion, the removal, or the relocation of predefined network services. In Fig. 14 we can see that if no services are added, we get the maximum possible gain. We can see that while there is a gain to be obtained when new services are introduced into the network, the rate at which this gain increases decreases as the number of services that can be added increases. This is to be expected since the increase of services also provides an increase in the number of optimization variables. The more optimization variables present on a network, the greater the need to have a greater amount of unique services to diversify. In Fig. 15 we can see a different case. By removing services from the network, we can see the gain increases at a higher rate. This can be explained because we are removing potential zero-day vulnerabilities, and thus rendering our network more secure. Finally, in Fig. 16, we can see the effect that moving services has on the network. We can see that, when no services are to be moved, the curve reaches a point where it flattens and where any additional service instances would be needed to continue the growth. What is interesting to note here is that moving services doesn’t have that limitation of the gain stopping when we increase the number of nodes, which could allow for further optimization when there are no more instances available to diversify.
In general, the security of networks may be qualitatively modeled using attack trees [14,15,35] or attack graphs [2,36]. A majority of existing quantitative models of network security focus on known attacks [1,43], while few works have tackled zero day attacks [40,41,44,47] which are usually considered unmeasurable due to the uncertainties involved [26]. Early works on network hardening typically rely on qualitative models while improving the security of a network [36,38,42]. Those works secure a network by breaking all the attack paths that an attacker can follow to compromise an asset, either in the middle of the paths or at the beginning (disabling initial conditions). Also, those works do not consider the implications when dealing with budget constraints nor include cost assignments, and tend to leave that as a separate task for the network administrators. While more recent works [1,46] generally provide a cost model to deal with budget constraints, one of the first attempts to systematically address this issue is by Gupta et al. [24]. The authors employed genetic algorithms to solve the problem of choosing the best set of security hardening options while reducing costs.
Dewri et al. [14] build on top of Gupta’s work to address the network hardening problem using a more systematic approach. They start by analyzing the problem as a single objective optimization problem and then consider multiple objectives at the same time. Their work considers the damage of compromising any node in the cost model to determine the most cost-effective hardening solution. Later, in [15] and in [45], the authors extrapolate the network hardening optimization problem as vulnerability analysis with cost/benefit assessment, and risk assessment respectively.
In [34] Poolsappasit et al. extend Dewri’s model to also consider dynamic conditions (conditions that may change or emerge while the model is running) by using Bayesian attack graphs to consider the likelihood of an attack. Unlike our work, most existing work on network hardening are limited to known vulnerabilities and focus on disabling existing services.
There exist many research works on extending attack trees and attack graphs to security metrics. Most of the current works deal with assigning numeric scores to rank known vulnerabilities (mostly based on the CVSS) [27] to be able to model the impact that they have on a network. This ranking is based on how likely and easily exploitable the known vulnerabilities are. This, however, is not the case for unknown vulnerabilities. Because unknown vulnerabilities cannot be modeled using the same methods used for known vulnerabilities, new metrics needed to be devised for them. The k-zero day safety metric [40,41] first addressed this limitation in security metrics. The problem with this metric is that it counts how many zero-day vulnerabilities are needed to compromise a critical asset which is not an easy task.
A probabilistic metric is applied to attack graphs to obtain an overall attack likelihood for the network [39]. A Bayesian Network (BN) based security metric applies attack graphs to measure the security level of a network [19]. The metric converts the CVSS scores of vulnerabilities into attack probabilities and then obtain the overall attack likelihood for reaching critical assets. The National Institute of Standards and Technology (NIST) highlights the importance of using some sort of security metrics on cloud systems and provides detailed frameworks and definitions [30].
There exists a rich literature on employing diversity for security purposes. The idea of using design diversity for tolerating faults has been investigated for a long time, such as the N-version programming approach [4], and similar ideas have been employed for preventing security attacks, such as the N-Variant system [11], and the behavioral distance approach [20]. In addition to design diversity and generated diversity, recent work employs opportunistic diversity which already exists among different software systems. For example, the practicality of employing OS diversity for intrusion tolerance is evaluated in [21].
More recently, the authors in [44,47] adapted biodiversity metrics to networks and lift the diversity metrics to the network level. While those works on diversity provide motivation and useful models, they do not directly provide a systematic solution for improving diversity. So far, the work done by [9], is one of the first work that has tried to provide a solution for this problem; their limitation, however, is that their metric is too simplistic and does not consider additional hardening metrics, which is the topic of this paper.
Conclusion
In this paper, we have provided a heterogeneous approach to network hardening to increase the resilience of a network against both unknown and unpatchable vulnerabilities. By unifying different hardening options within the same model, we derived a more general method than most existing efforts that rely on a single hardening option. Our automated approach employed a heuristic algorithm that helped to manage the complexity of evaluating the security metric as well as limiting the time for optimization to an acceptable level. We have addressed one limitation of our previous work by considering that not all costs are additive but they depend on other conditions. We have further discussed realistic cost estimation methods based on existing works. We have tested the efficiency and accuracy of the proposed algorithms through simulation results, and we have also discussed how the gain in the metric will be affected by the addition, the removal, and the relocation of services, as well as the number of available modifiable firewall rules, unpatchable vulnerabilities, and the different sizes and shapes of the resource graphs.
We discuss several aspects of the proposed automated optimization technique where additional improvements and evaluations can be done.
While this paper has proven that we can integrate different network hardening options under the same model, a more comprehensive approach could be developed by considering other options which might not immediately fit into this model.
This study relies on a static network configuration. A future research direction would be to consider a dynamic network model in which both attackers and defenders may cause incremental changes in the network.
We will evaluate other optimization algorithms in addition to GA to compare and potentially use them in hybrid optimization schemes when searching the most efficient solution for our problem.
Footnotes
Acknowledgments
The authors thank the anonymous reviewers for their valuable comments. Authors with Concordia University were partially supported by the Natural Sciences and Engineering Research Council of Canada under Discovery Grant N01035. Sushil Jajodia was supported in part by the National Science Foundation under grant IIP-1266147; by the Army Research Office under grants W911NF-13-1-0421 and W911NF-13-1-0317; and by the Office of Naval Research under grants N00014-15-1-2007 and N00014-13-1-0703.