
Abstract
In recent years, concerns are increasingly being expressed about the threats of side-channel attacks that exploit acoustic emanations from electronic as well as mechanical devices of daily use. With the increased level of sophistication in both hardware and applications that run on mobile phones, the number of possible ways in which their vulnerabilities can be exploited is also on the rise. In this article, we demonstrate a novel attack which uses the sound emanating from a tap made on the touchscreen of a smartphone to decipher the text being typed. The audio signal captured by the pair of microphones typically embedded in a smartphone is first processed to determine a candidate set of keys. Filters are employed to make this step robust against ambient noise. Natural language processing techniques are then used to estimate the most probable words and sentences that can be constructed from a sequence of taps. It is shown that using even off-the-shelf tools, the typed text including passwords can be guessed with reasonably high accuracy. Besides raising awareness about this potential side-channel attack, we identify the causes that allow it to succeed and suggest countermeasures.
Introduction
Over the last few years, mobile phones have become ubiquitous in their presence across all countries in the world. It is expected that mobile phone penetration will reach close to
It may be noted that, all the tasks mentioned above, involve text input using a keypad, which is typically touchscreen in nature. In this paper, mobile phones including smartphones, tablets and other similar devices, are hereinafter referred to as smartphones (or simply as phones) and they represent gadgets that have a touchscreen user interface and have features like Internet access, support for recording and storing media files, etc.
The smartphones that are popularly available today are equipped with at least two microphones. Being attached to the phone body, these microphones pick up even the slightest sound produced on the surface of the phone including the touchscreen. As a user taps on the touchscreen for entering information, a sound is produced which is often not quite audible to the human ear due to the presence of ambient noise and is ignored. These tap sounds can, however, be easily captured using the microphones of the smartphone itself. An unsuspecting user hardly ever denies microphone use or Internet access permission to an app while installing the same. An app is also not suspected to be malicious unless it asks for some unusual combination of permissions. Microphone and Internet access permissions are so common that they do not normally raise any suspicion. However, we show that even these two seemingly innocuous permissions can be judiciously exploited to decipher the text being typed on the smartphone, thus causing a security breach.
In the literature, there is some limited reference to work that recover text using acoustic emanations from mechanical keyboards [1,10,14,30]. External microphones are typically employed to capture the sound, which is then used to train a classifier for differentiating between sounds produced by different keys. It has also been reported that smartphones equipped with various forms of sensors like accelerometer and gyroscope can be used for text extraction [17,20,21]. However, the possibility of exploiting the audio signal captured by the built-in microphones to decipher the typed text has never been studied, to the best of our knowledge.
This paper presents a novel methodology for side-channel attack using acoustic emanations from the touchscreen keypad of a smartphone and that too using readily available tools. The approach makes use of phone geometry and key pad layout, while applying signal processing and natural language processing (NLP) techniques for word and message deciphering. We have significantly expanded our work recently presented at a conference [11] by introducing methods to suppress ambient noise and using the proposed methodology for password guessing, while carrying out more comprehensive experimental studies and strengthening of approaches for countering the attack.
The rest of the paper is organized as follows: Section 2 describes our methodology and the associated algorithms in detail. Specifically, we discuss noise reduction and identification of potential character sets being keyed in, word and sentence inferencing from the character sequences and usefulness in password guessing. Section 3 provides the complete workflow of an implemented system including possible alternative implementation strategies and their relative advantages. Section 4 presents the results of an extensive experimental study. Performance of the proposed methodology is reported in terms of accuracy, robustness against noise as well as execution time. Related work is reviewed in Section 5. Several preventive measures to counter the attack along with their feasibility are discussed in Section 6. Finally, Section 7 concludes the paper and identifies scope for future research.
Attack methodology
In this section, we describe the complete attack methodology, which can be broadly divided into two phases. The first phase involves processing of audio signals captured in the two microphones of a smartphone to determine the probability of entering a character in each tap. To achieve this, the nature of the two signals received at the microphones as well as the phone geometry and touchscreen keypad layout are exploited. This phase can be further divided into two stages, namely, noise filtering and tap key identification. In the second phase, NLP techniques are used to extract the most probable sequence of words corresponding to a tap sequence by processing the output of the first phase.
Of the two phases mentioned above, the activities of the first are partially carried out in the target phone itself. The rest of the processing is carried out on a remote server. A trojan app installed in the phone does the task of recording of the tap sound and sending it to the server. Once the data is available at the server end, relatively more computation intensive steps can be carried out at the convenience of the attacker. A detailed description of the complete implementation is provided later in Section 3.
Threat model
Any study on attacks and their prevention methods is based on an underlying threat model. Such a model is typically developed keeping in mind the operational conditions, user awareness, computational feasibility and attack goals. Our threat model includes the following components. First of all, as mentioned before, we consider that the target smartphone has stereo recording capability along with Internet connectivity. It is also assumed that the trojan app to be used for recording of the key taps can be installed in the phone without raising user’s suspicion. The goal of the attack is to read message texts and also passwords being typed in by the user. Even though the attack methodology is developed without making any assumption on the orientation of the phone, we consider for the sake of brevity that the target phone is held in landscape mode. Such assumptions and dependencies are discussed in greater detail in later sections along with supporting justifications.
Character sequence extraction using microphone data
Modern day smartphones almost invariably come with more than one, typically two, microphones providing stereo recording capability. Indeed, the iPhone 5 onwards, three microphones have been present in the iPhone. However, since the vast majority of smartphones have two microphones, in the rest of this work, we simply work with two, though the same methodology can be extended to three as well. When a user taps on the touchscreen to enter any text, a sound is produced for each tap. This tap sound is captured by the microphones, which are located near the touchscreen surface. As a result, and due to the fact that the microphones are solidly attached to the phone body, there is hardly any damping. However, there is a possibility of picking up ambient noise besides the tap sounds. In this subsection, we first explain the details of how the delay in arrival of the tap sound at the two microphones can be used to estimate the location of the tap and hence the tapped key and then show how the ambient noise can be eliminated to make the approach more robust.
Identification of key tap position
When a touchscreen key is tapped, there is a finite difference in the distances traveled by sound to reach the two microphones. As a result, from the captured key tap sound, the time difference of arrival (TDoA) [12] of audio peaks in these microphones can be computed. For each TDoA, the locus of a point of tap having constant difference in its distance from the two microphones (also approximated as points due to their small size with respect to the phone dimensions) forms a hyperbola, with the two microphones at its two foci. The sign of TDoA determines which half of the hyperbola (i.e., the semi-hyperbola) needs to be considered for a given key tap. The cross correlation based method proposed in [4] is used for computing the TDoA between the two audio signals recorded at the two microphones as explained below.
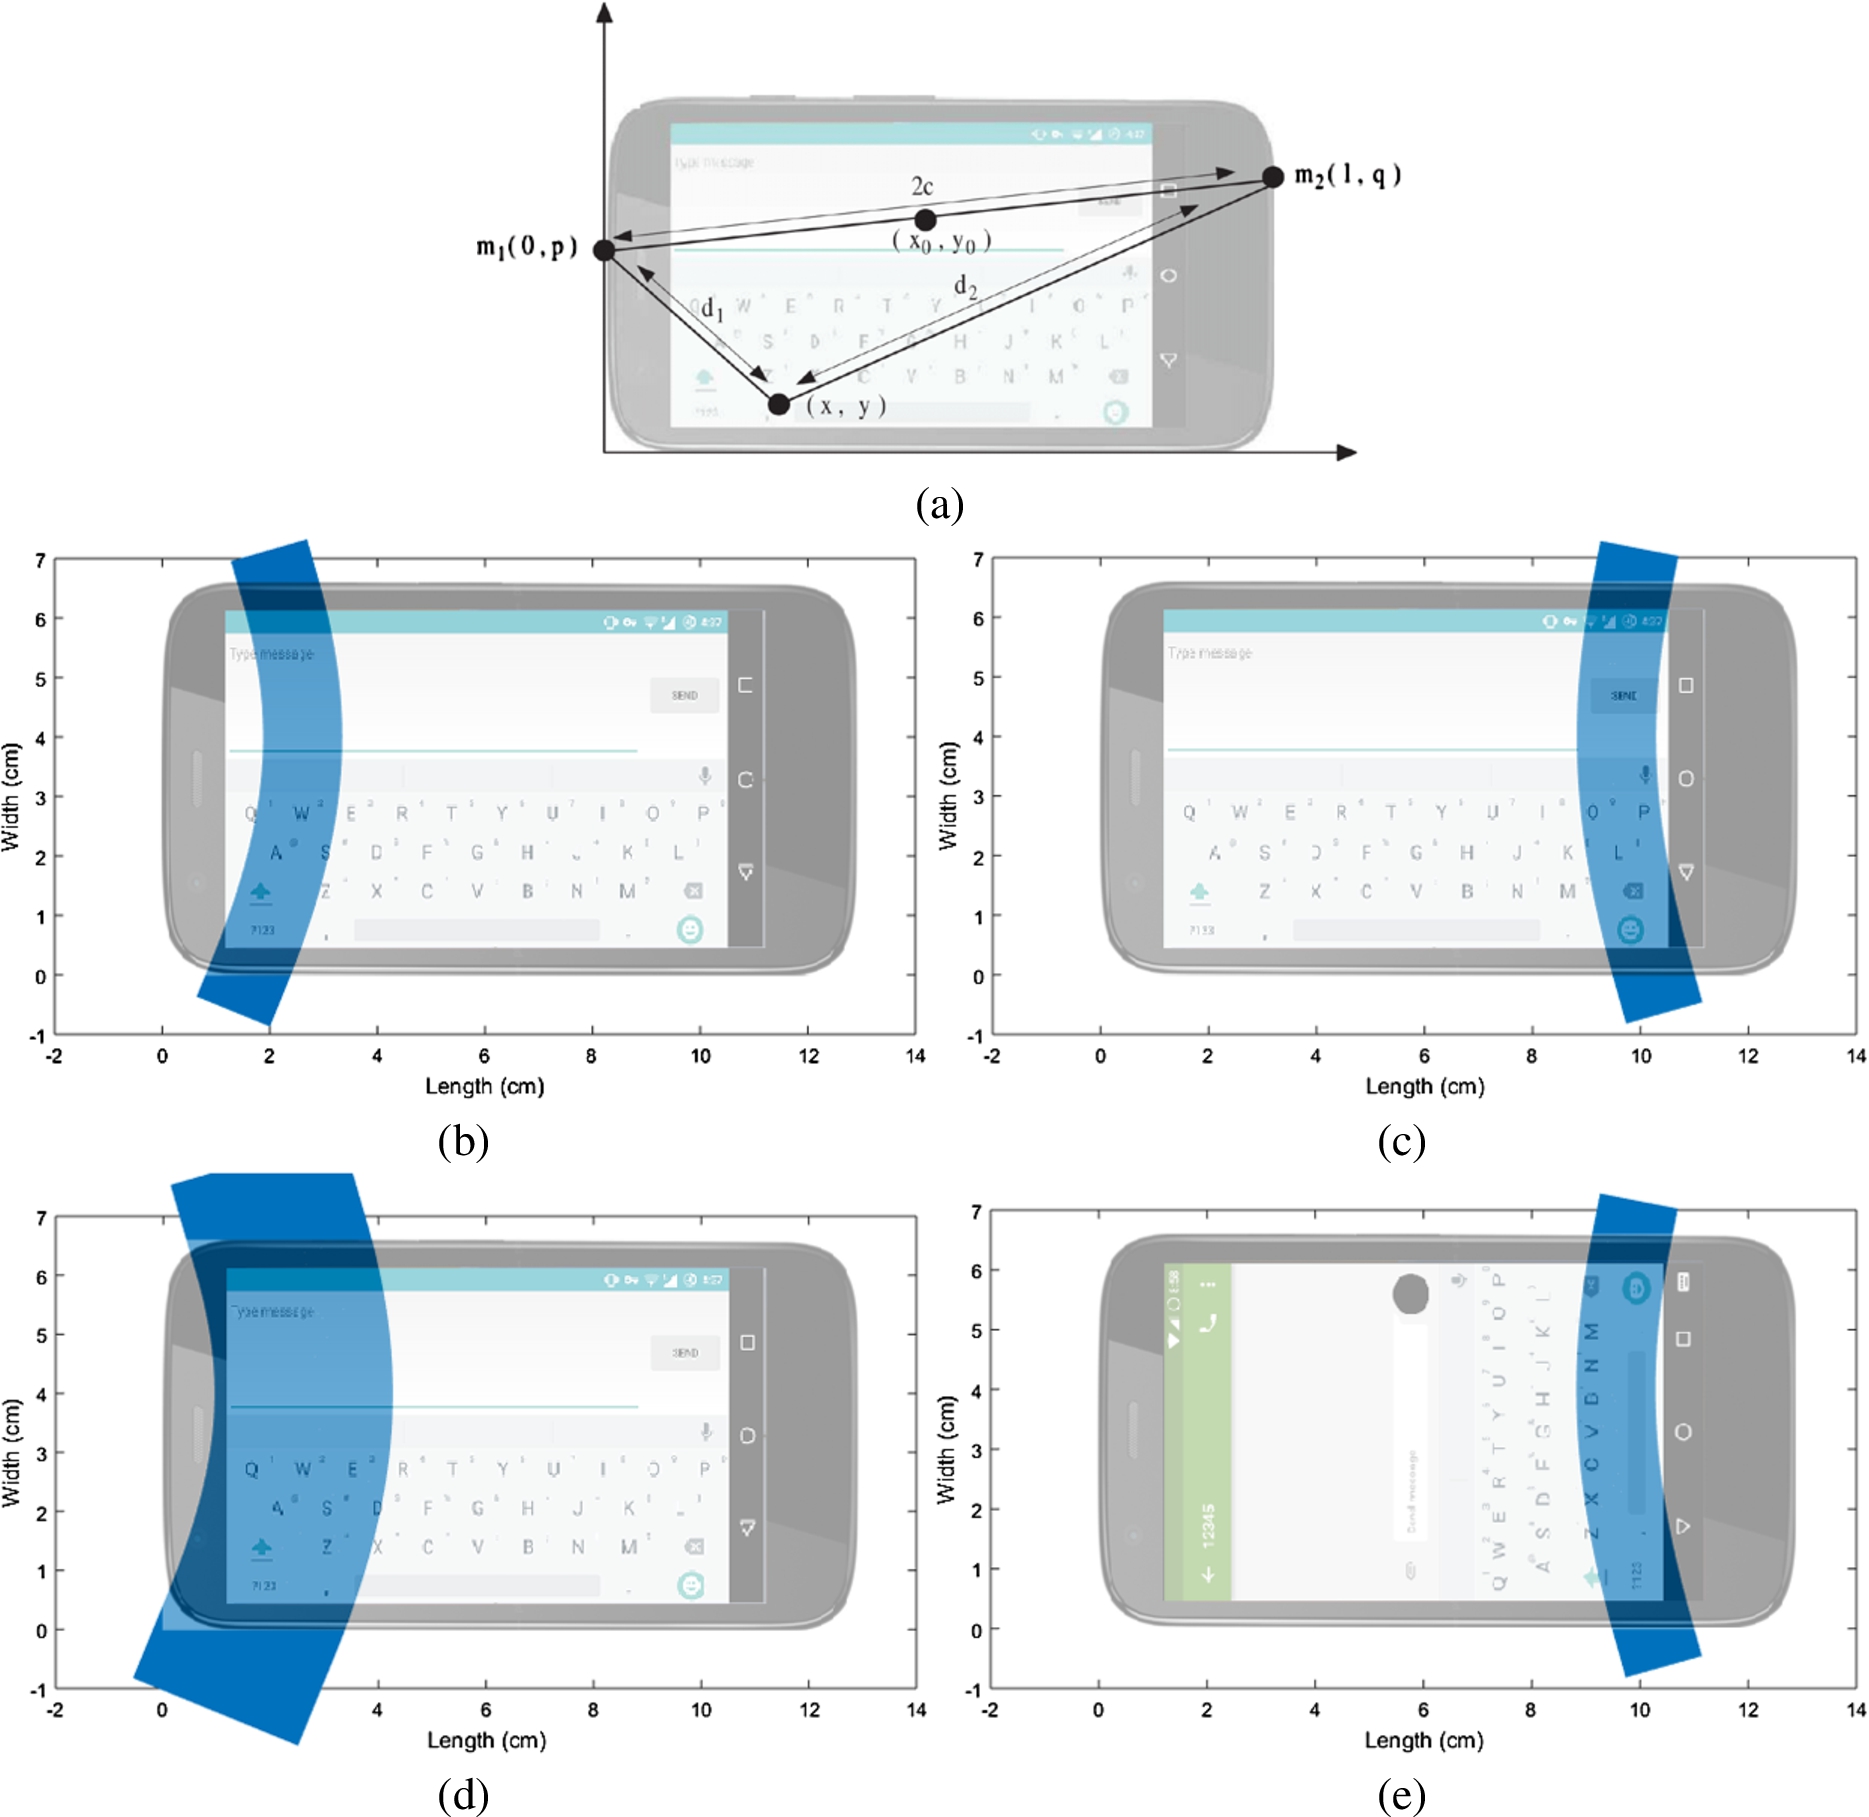
(a) Key pad layout superimposed on the chosen co-ordinate system (b) Hyperbola coverage on the left side of key pad with
We first define the co-ordinate system as follows. Holding it upright facing front, the origin coincides with the top left corner of the phone and the x-axis is parallel to the left edge. In such a co-ordinate system, one of the microphones (denoted as
In Equation (1),
By substituting and solving for x in terms of y from Equation (1), we can write:
Based on the above discussions, it is observed that by computing the value of TDoA, we can characterize the desired hyperbola. Thus, the problem of determining hyperbola parameters reduces to that of estimating the TDoA (or sample offset
From the captured audio signals at the microphones, the first task is to determine the tap instants (detect peaks in the corresponding signal). Hence, we propose a scheme for automatic peak detection, the details of which are presented as the
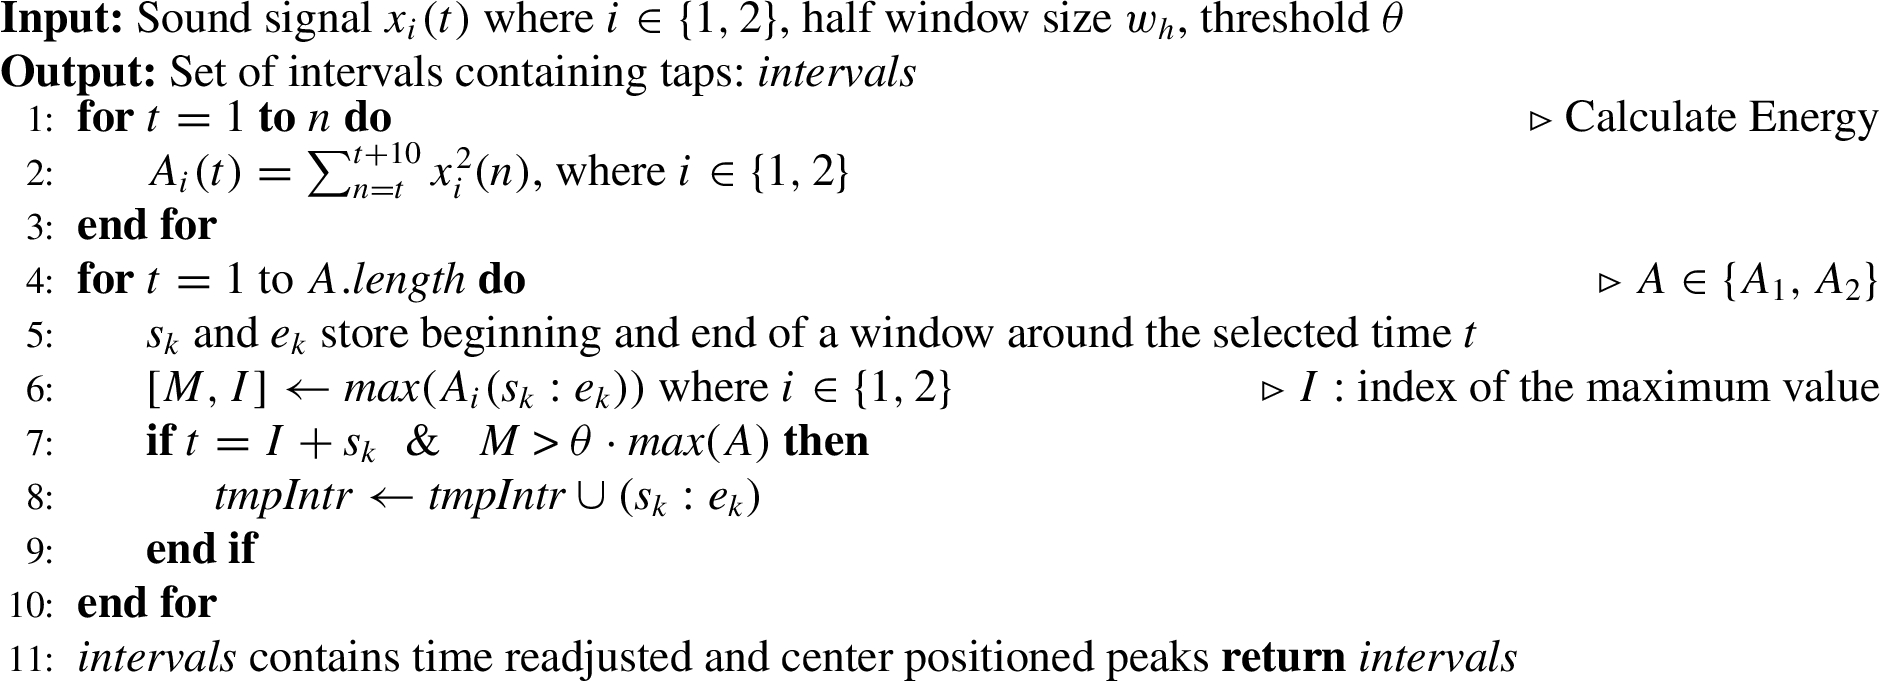
In Algorithm 1, the for loop of Lines 1–3 computes the energy levels of the signal by accumulating 10 sample points together. Next, in the for loop of Lines 4–10, for each sample point, the beginning and end points of the interval window are set in the variables
It can easily be seen that Algorithm 1 runs in
As mentioned above, the output of Algorithm 1 is a set of time intervals, each containing a tap. These intervals are next processed to get the TDoA corresponding to each tap. The algorithm presented next (Algorithm 2–
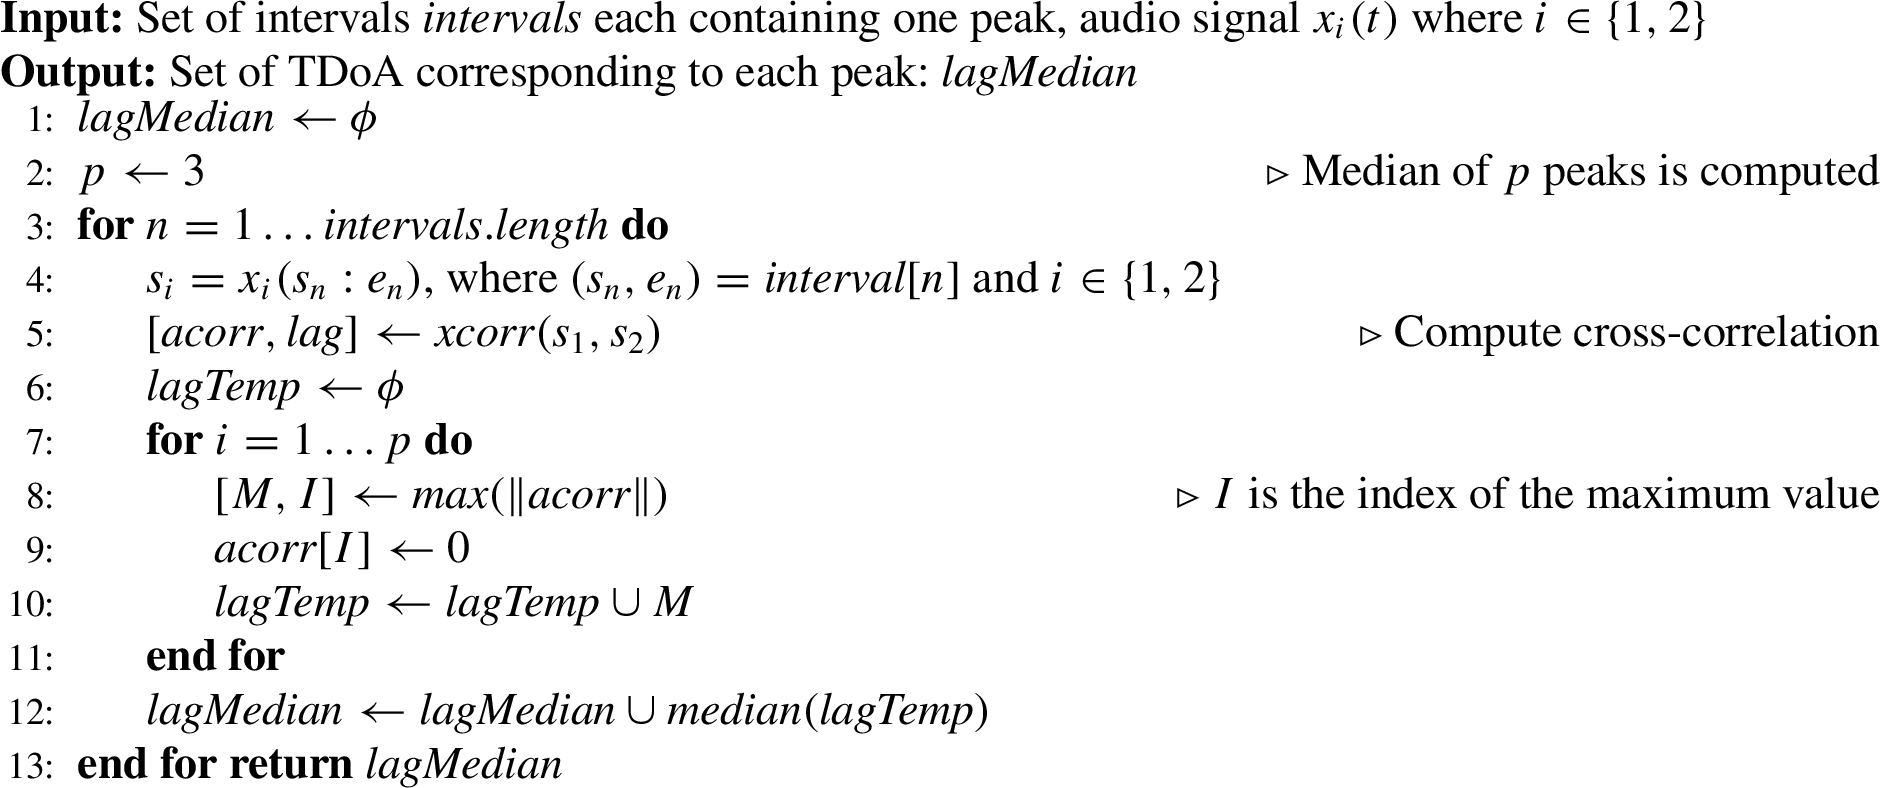
In this algorithm, the for loop of Lines 3–13 selects each interval from the set of intervals one at a time. Next, the for loop of Lines 7–11 selects the top p peaks (typically set to a value of 3) from the cross correlation values. Line 12 adds the computed median to the set
The probability that a given key is tapped, i.e., an individual character entered by the user, is considered to be inversely proportional to the shortest distance of the key from the semi-hyperbola. Thus, we can obtain the top k most probable characters for each TDoA and hence, corresponding to each key tap. For example, Fig. 1(b) shows this situation when the left semi-hyperbola is selected with three letters in the landscape mode of the phone falling on the locus. Figure 1(c) depicts the same situation with the right semi-hyperbola selected. If we expand the locus to include six letters instead of three, and the left semi-hyperbola is selected as shown in Fig. 1(d), the keys q, w, e, a, s, z form the candidate set of keys that might have been tapped. Instead of holding the phone in landscape orientation, which usually makes text entry more convenient, if it is held in portrait mode, more number of keys get covered for the same width of the semi-hyperbola as shown in Fig. 1(e). However, this does not have any impact on the basic methodology for obtaining the candidate set. Further, whether the user uses one or both the thumbs to tap in the text does not affect the efficacy of the proposed approach except for the fact that the sounds corresponding to consecutive taps would arrive at the microphones faster.
The orientation in which a smartphone is held, i.e., portrait or landscape can be sensed and accordingly the candidate set is adaptively decided. It may be noted that, the trojan application to be used to carry out the attack, can send the smartphone information like its model number, based on which the geometric parameters can be determined either using a lookup table or through Internet search. Further, several of the operating system parameters, including currently active window information, are made available through appropriate Application Programming Interfaces (APIs) for user-developed apps to operate efficiently. From this information, the trojan can determine the type of app like messaging, gaming, browser, etc., that is currently being used. Accordingly, it decides whether to process the tap sounds or not. For example, if the currently active app is a video game, it would not be processing the audio signals corresponding to the taps any further. On the other hand, message entry and filling up of information in form fields through a browser are applications for which the audio files would be transmitted. It can also be tuned to process data only for one particular type of application.
So far, we have considered an ideal setup for carrying out the attack with clean audio signals reaching the two microphones. However, in real-life situations, the recorded audio signals invariably contain noise. To take this factor into account, we first discuss how the performance of the methodology proposed in the last subsection is affected by the presence of noise. We then present a filtering technique that is used to improve its accuracy even when there is ambient noise.
To systematically study the impact of noise, white Gaussian noise of varying degree is added to the recorded audio signals. This results in a variation in the signal to noise ration (SNR). Higher the SNR, lower is the noise and clearer is the tap sound. Figures 2(a)–(c) show the effect of adding noise to a clean audio signal.
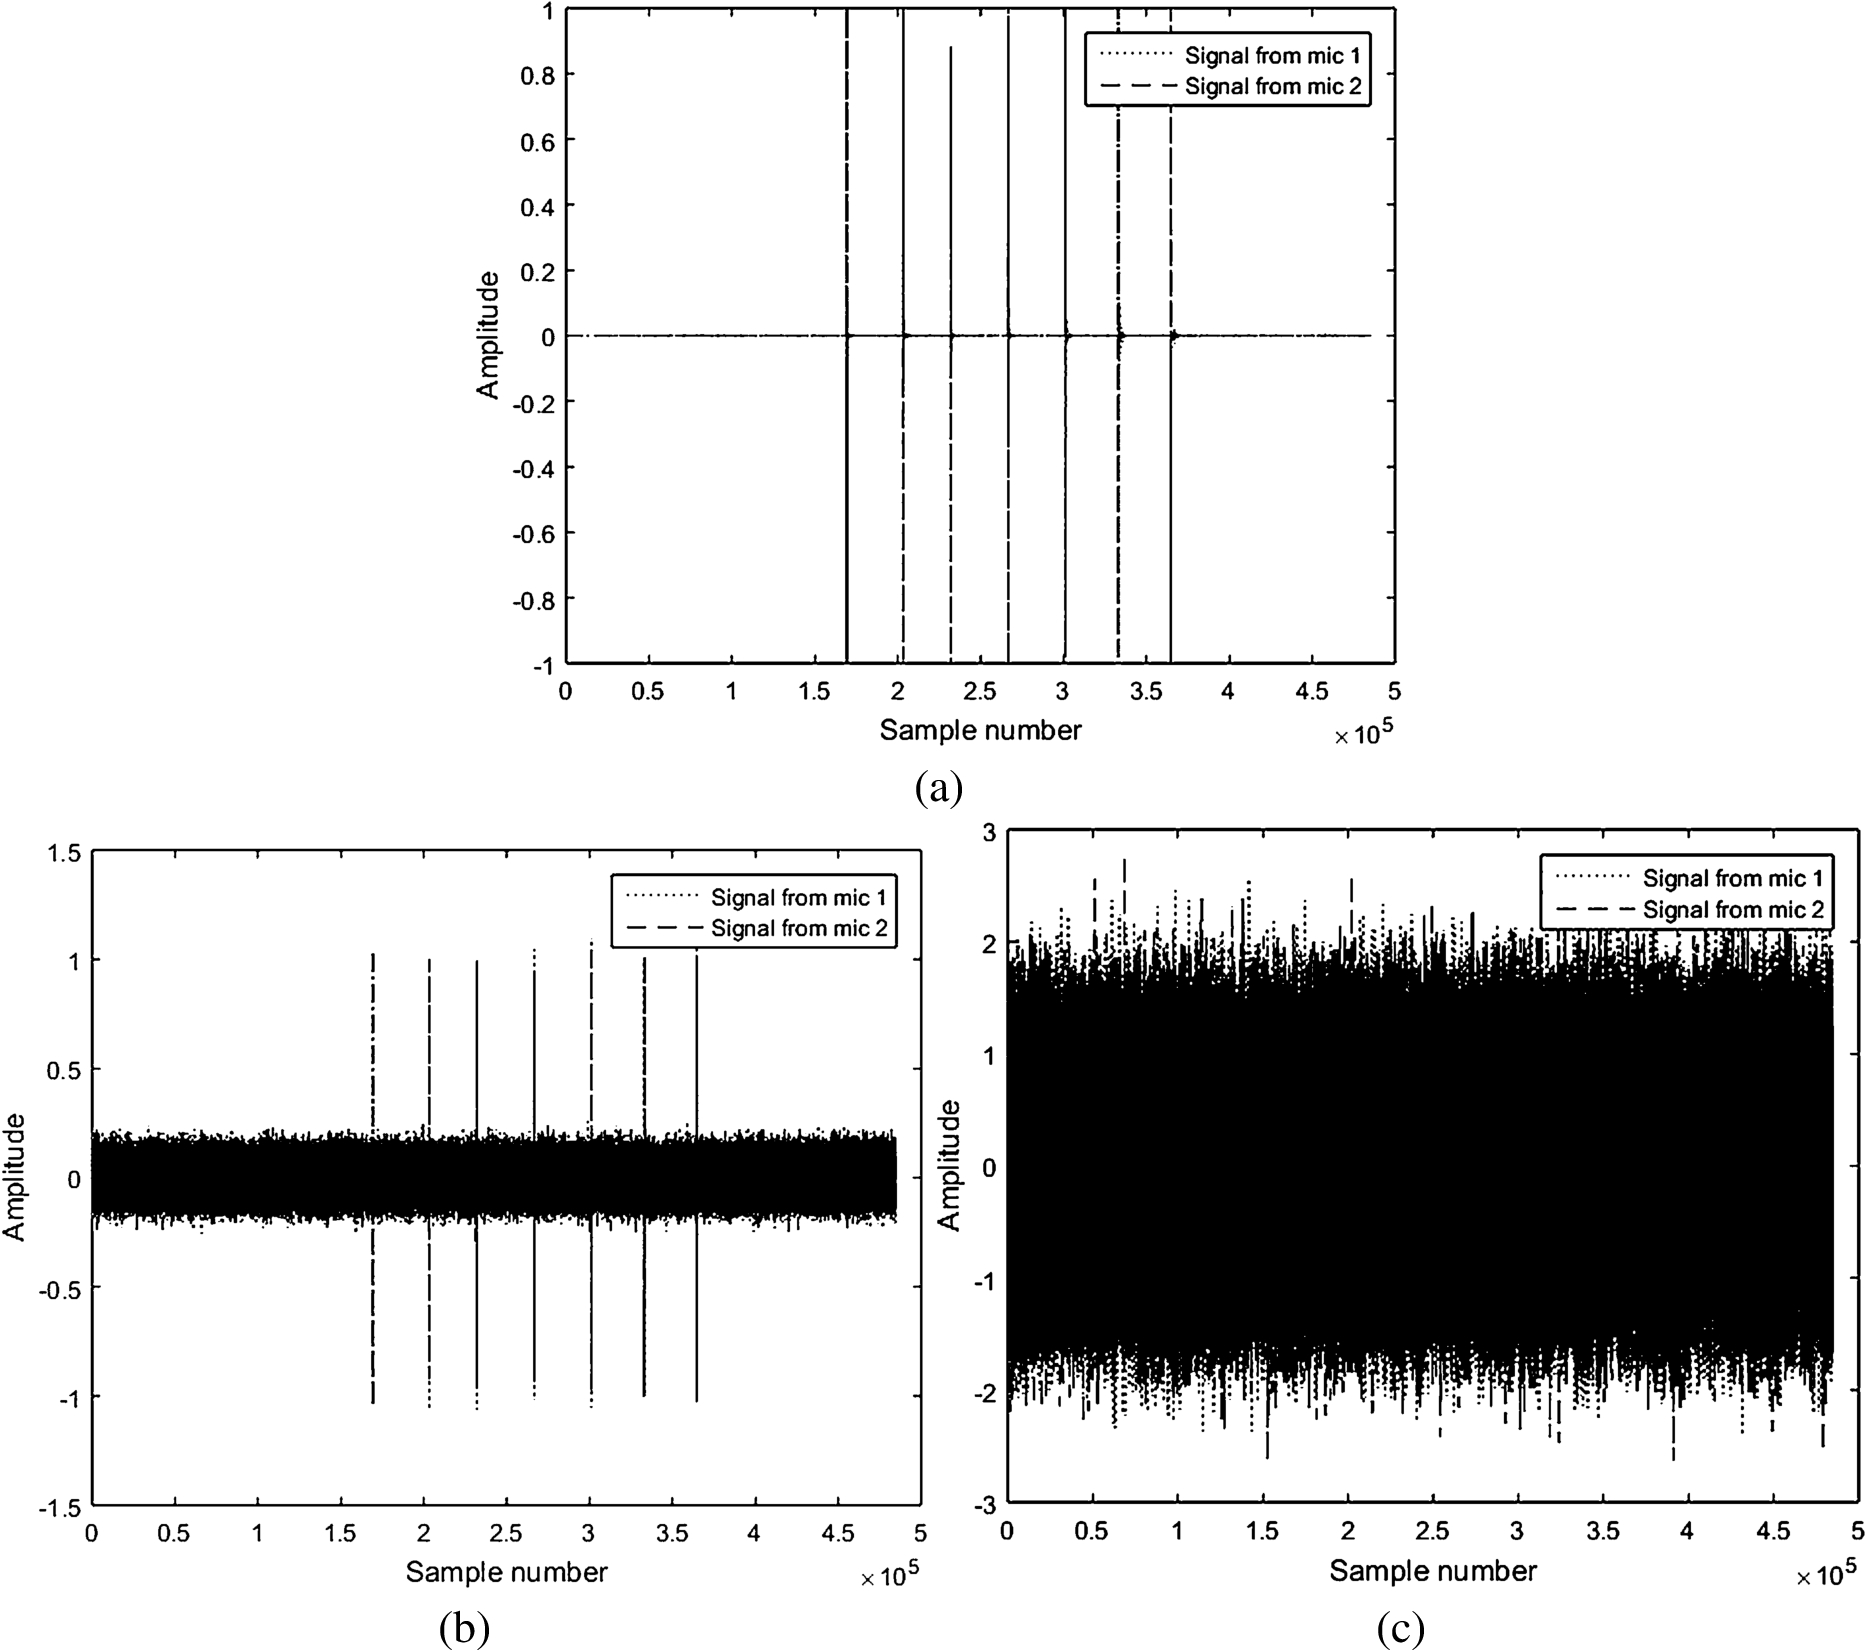
Time domain representaion of audio signal corresponding to text “dplhffr” (a) without adding noise and (b) after adding noise with
It is seen from the figure that increased addition of noise to a clean audio signal distorts it gradually. The original SNR for the example audio signal is 35 dB. At this level of noise, the methodology presented in the last subsection works well. However, as further noise is added and the SNR falls below 20 dB, its performance degrades. It is observed from the figures that when sufficient noise is added to bring down the SNR to 10 dB, the noise amplitude becomes almost equal to that of the actual tap sound and hence it is hard to locate the taps from the audio signal. In fact, with this level of noise, the peak-detection algorithm detects numerous peaks erroneously throughout the signal. As a result, the attack fails when the background noise SNR
The first step towards noise reduction is to analyze the frequency spectrum of the clean audio with respect to the noisy signals. The frequency spectra are presented in Fig. 3.
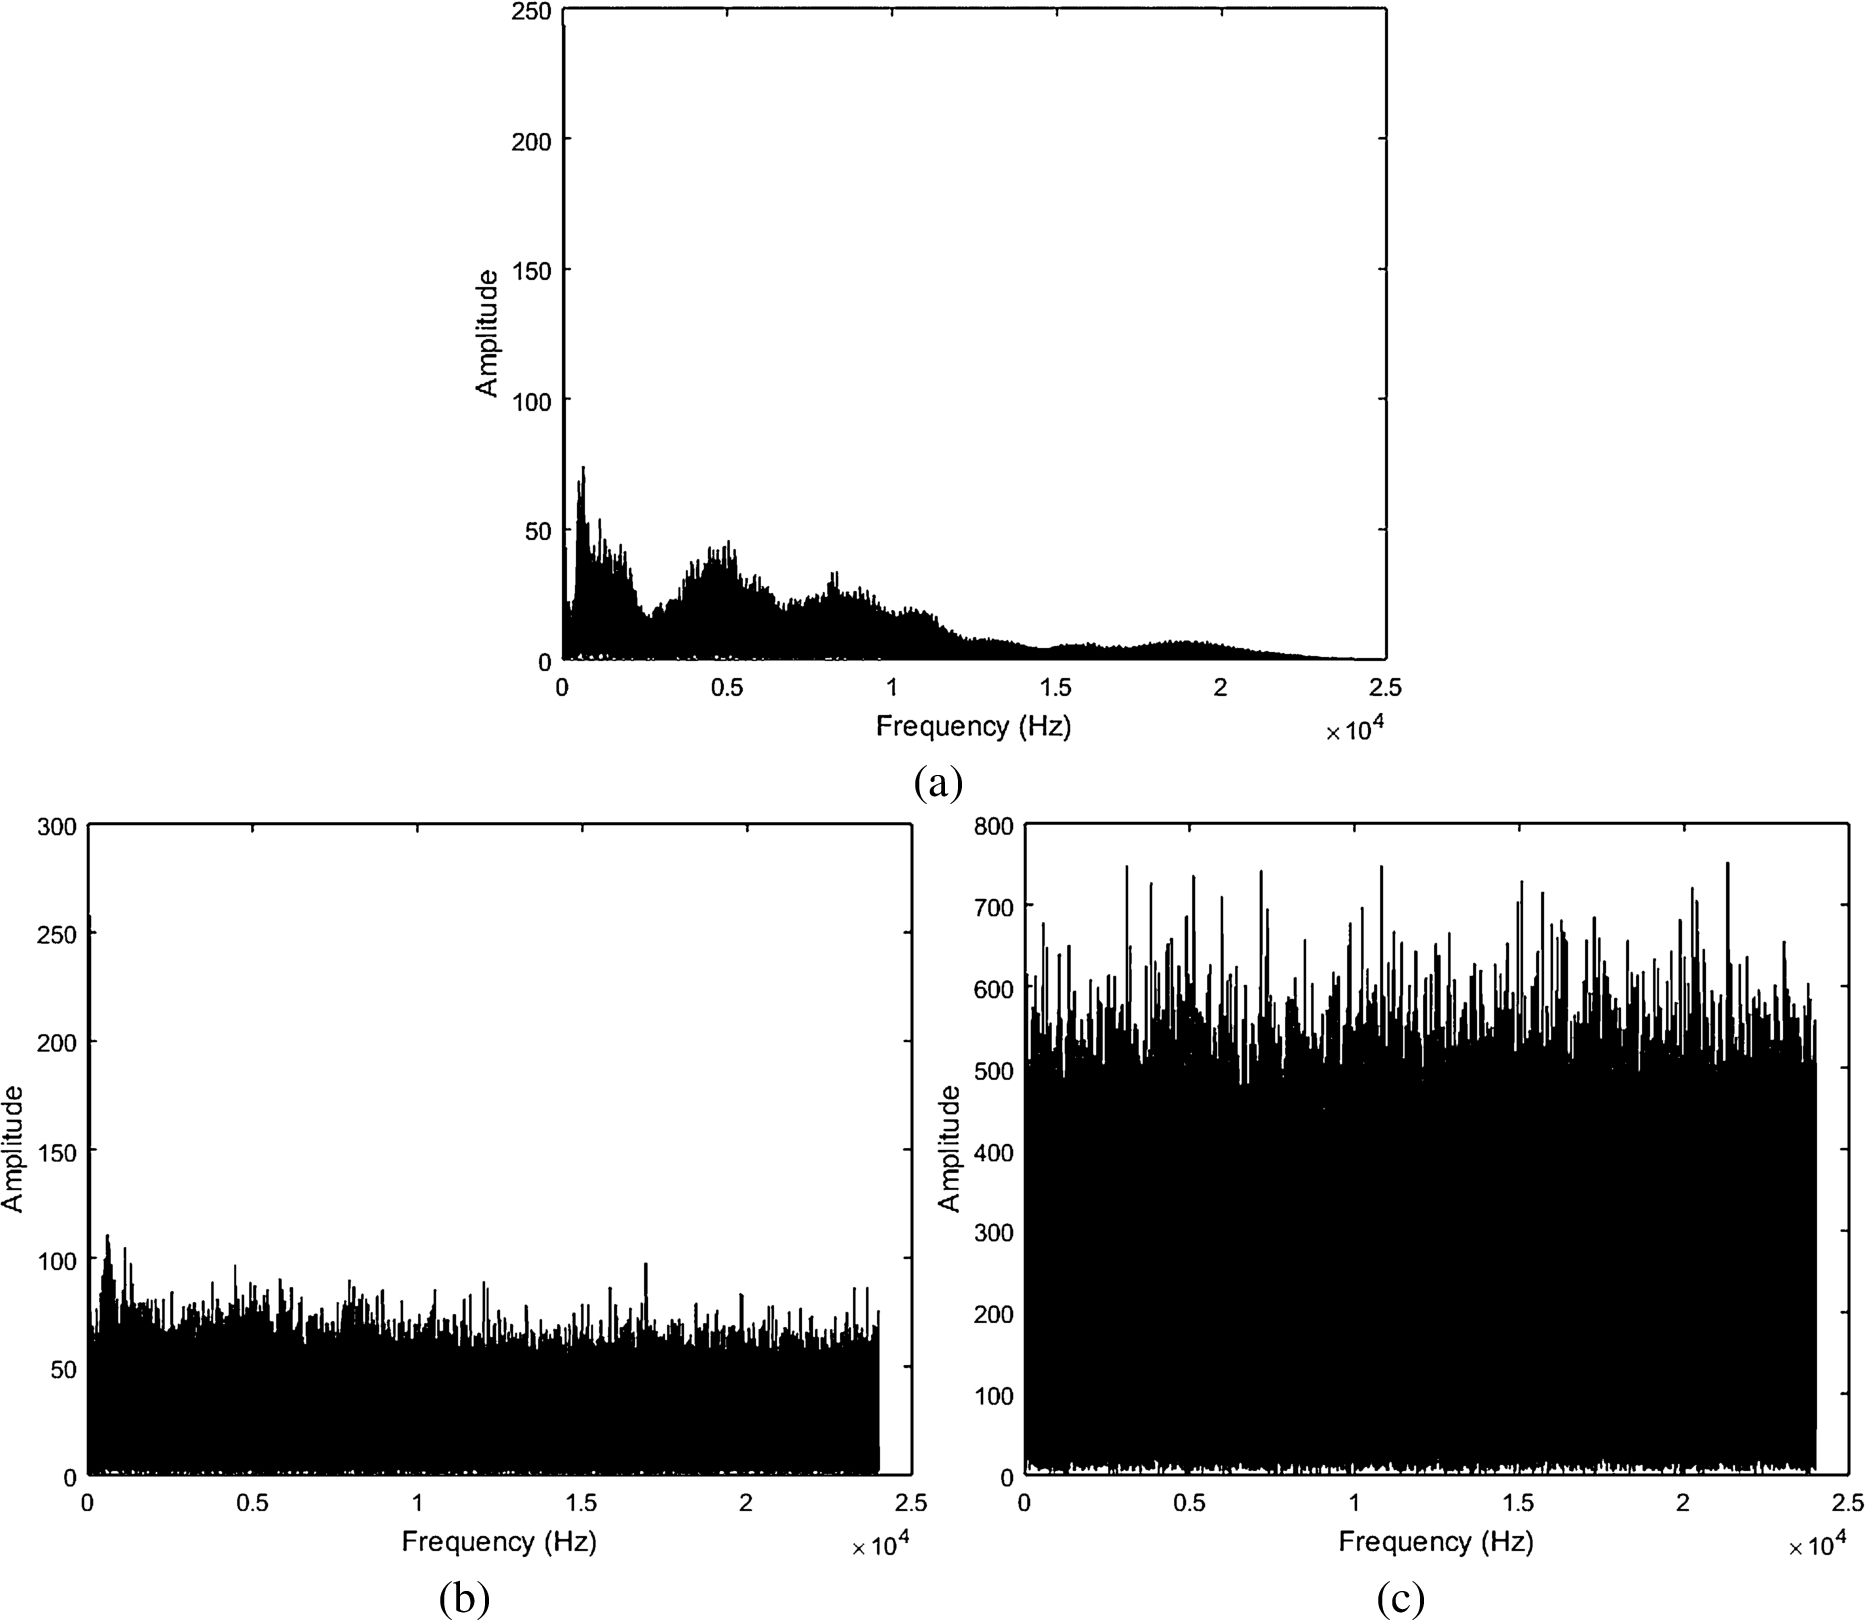
Frequency domain representation of audio signal corresponding to the text “dplhffr” (a) without adding noise (b) after adding noise with
It is seen from Fig. 3(a) that the tap sound is characterized by the presence of frequencies around 5 kHz and 8.3 kHz. Figure 3(b) is the frequency spectrum of the sound presented in Fig. 2(b), where it is observed that even though most of the characteristics of the spectrum are affected by noise, still the overall trend is maintained and hence, noise removal is actually not necessary. However, for a further degraded signal as presented in Fig. 3(c), noise removal becomes necessary for the attack to succeed.
It may be noted from the spectra that there is a particular frequency range for the key tap sounds and hence use of a frequency domain band-pass filter [22] is considered to be appropriate to remove the frequencies that are spurious and mostly contain noise. We have, therefore, designed a band-pass filter with the low and high cutoff frequencies set at 700 Hz and 12 KHz, respectively. When such a filter is used to process the noisy audio signal shown in Fig. 3(c), the resulting signal as shown in Fig. 4 is obtained.
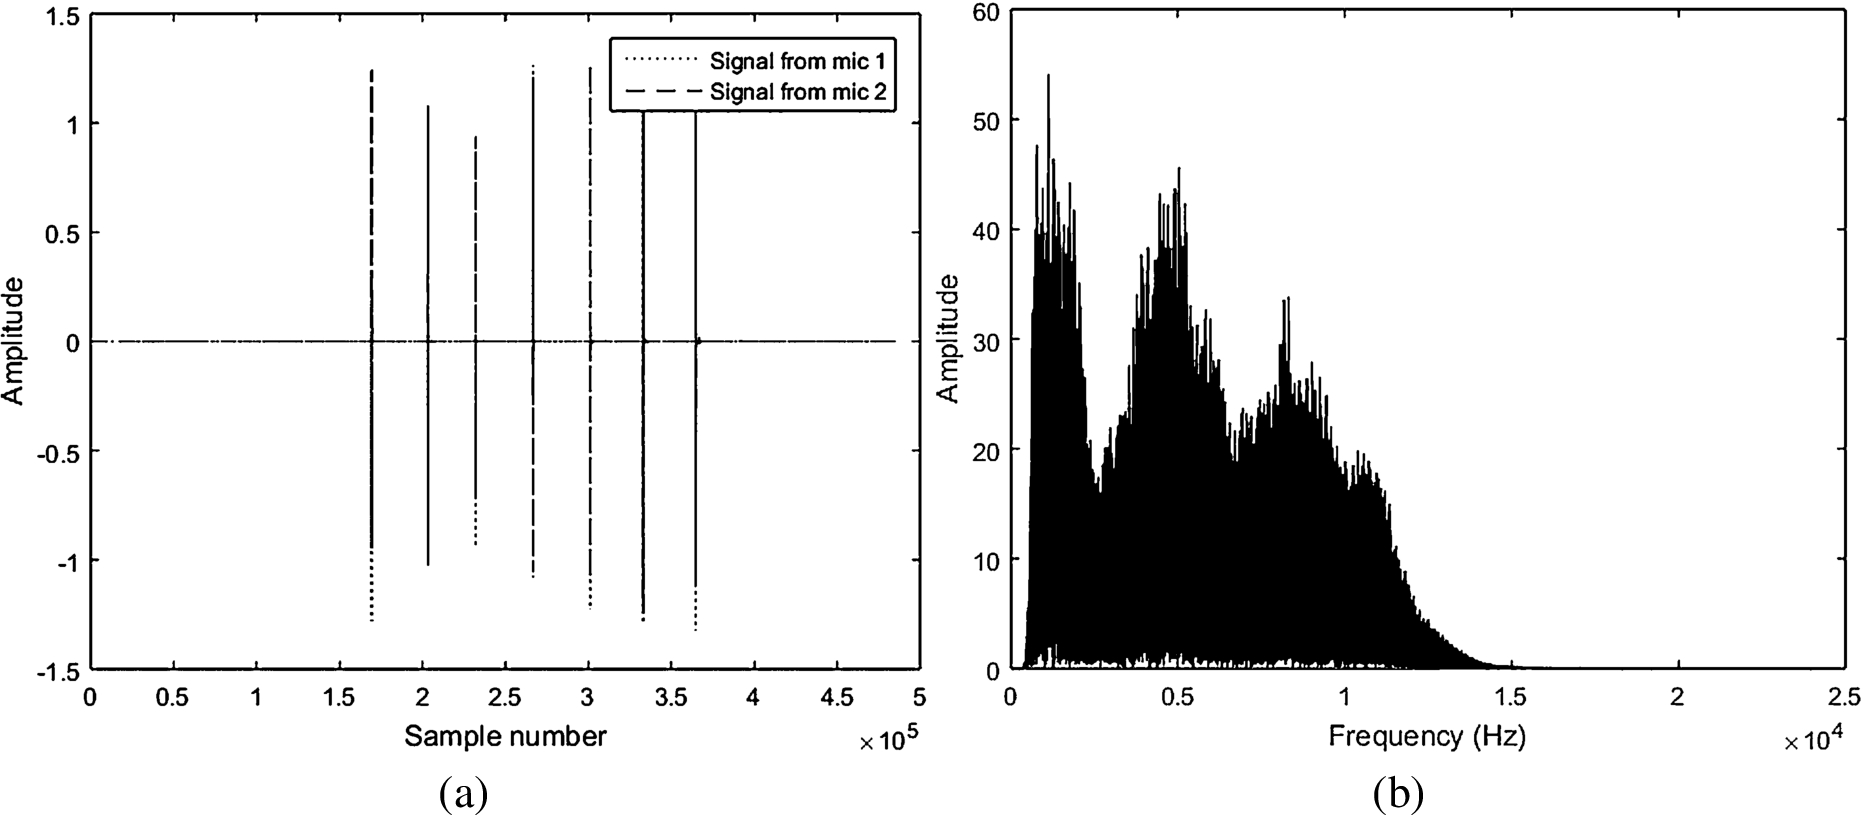
(a) Time domain and (b) Frequency domain representation of audio signal corresponding to the text “dplhffr” after removing noise of
It is seen from the time and frequency domain representation inf Fig. 4(a) and (b) that, on using the band-pass filter, the recovered audio signal has characteristics quite close to that of the original signal. Although not evident quite from the time-domain representation, the difference of this cleaned signal from the original signal can be clearly seen in the frequency spectrum. The cleaned audio retains its similarity with the original signal near frequencies 5 kHz and 8.3 kHz. When these band-pass filtered audio signals are subjected to the attack, the accuracy improves significantly. The detailed results are presented in Section 4.
In this subsection, we describe our proposed methodology for constructing words and sentences from the sequence of characters obtained using Algorithm 2 of Section 2.2.1.
In any given language, a valid sequence of n characters is called an n-gram. Each language including English has a well-studied set of n-grams and their probability of occurrence in written text. Once the k most probable characters are obtained using the algorithms presented in Section 2.2.1, we make use of the uni-gram, bi-gram and tri-gram probabilities of the language. We initially assume that the message that a user is tapping in, is written in English. It forms the basis for learning the language model that helps to reduce the search space and determine the most probable sentence. Other language models can also be similarly used without changing the basic steps. The character-level n-grams as well as word-level n-gram counts are learned from the widely used e-mail corpus1
Enron Mail corpus:
The probability of a particular n-gram is the count of that n-gram divided by the total number of n-grams in the language. Since the number of n-grams is usually a very large number, the probability value comes out to be too small. To compute the probability of occurrence of a string of characters, we need to multiply all the n-gram probabilities. If we use the actual probability values, the product might cause an underflow. On the other hand, taking the product of the count of n-grams results in an overflow. Hence, to avoid both underflow and overflow, instead of using the probabilities directly, we introduce the notion of
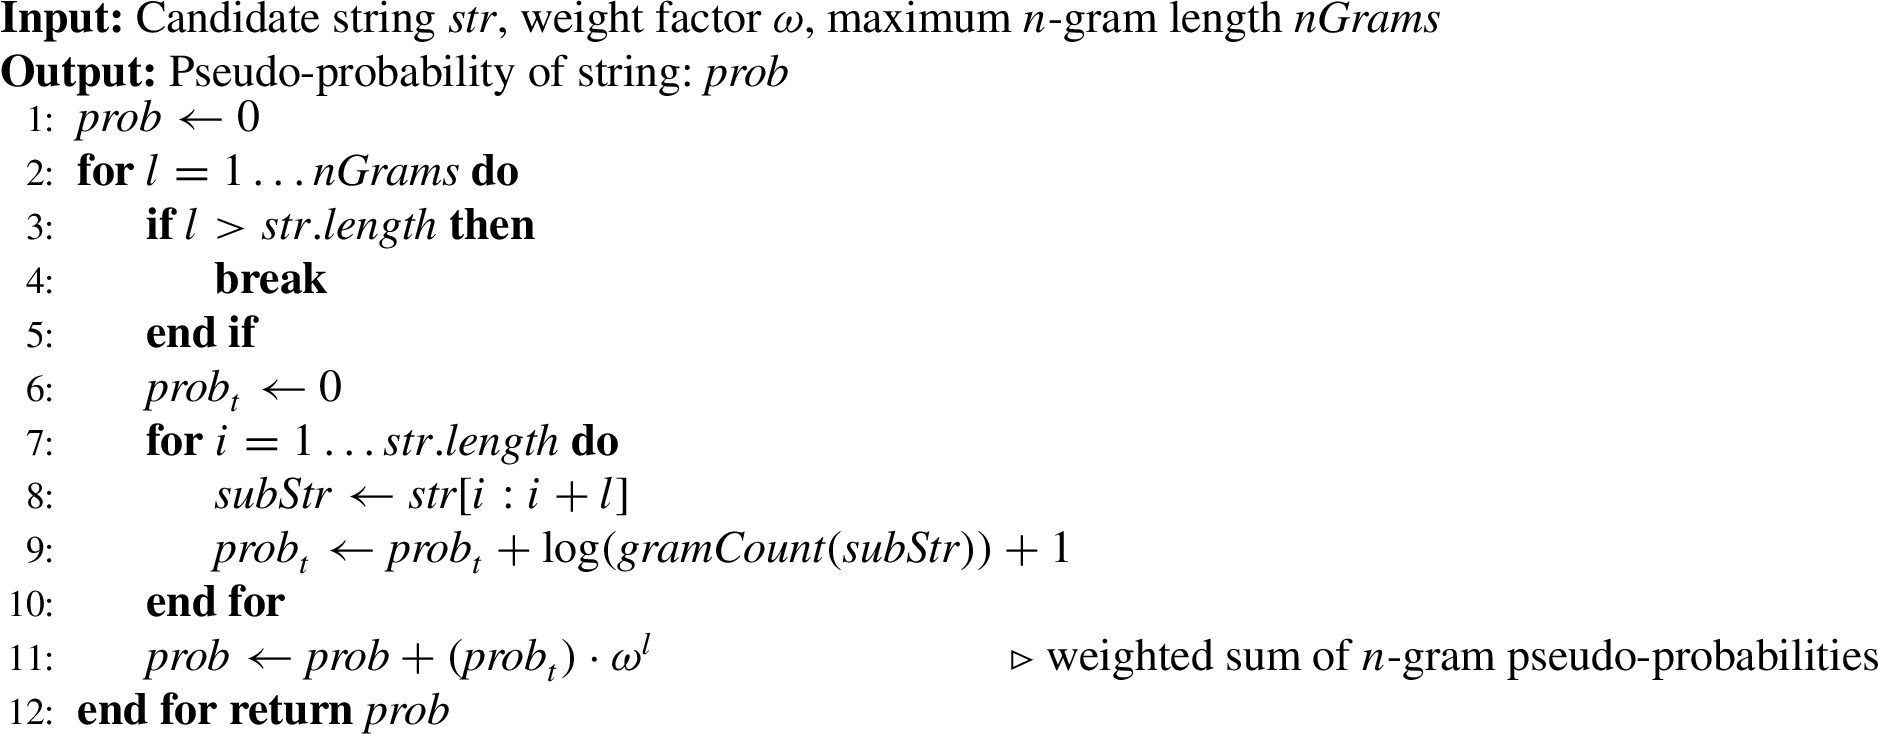
There are two loops in Algorithm 3. The outer loop runs n times if n-grams are used for the computation, while the inner loop runs in the order of the length of the string, denoted here as l. Hence, the overall time complexity is
From the computed score of strings, we build an inference tree to determine the most probable text that was typed. The language model is based on n-gram and inference based tree [7,29]. The character-level n-grams are used to construct a word-level inference tree. At each level, we include the next set of probable characters and recompute the probabilities of the strings thus obtained. Only the top k nodes are retained and the rest are pruned. This prevents the tree from expanding exponentially. In the last level of the tree, we are left with k most probable words that can be constructed using the character sequences obtained from the algorithms presented in Section 2.2.1.
The node used to create the tree is a three-tuple represented as
We propose an algorithm
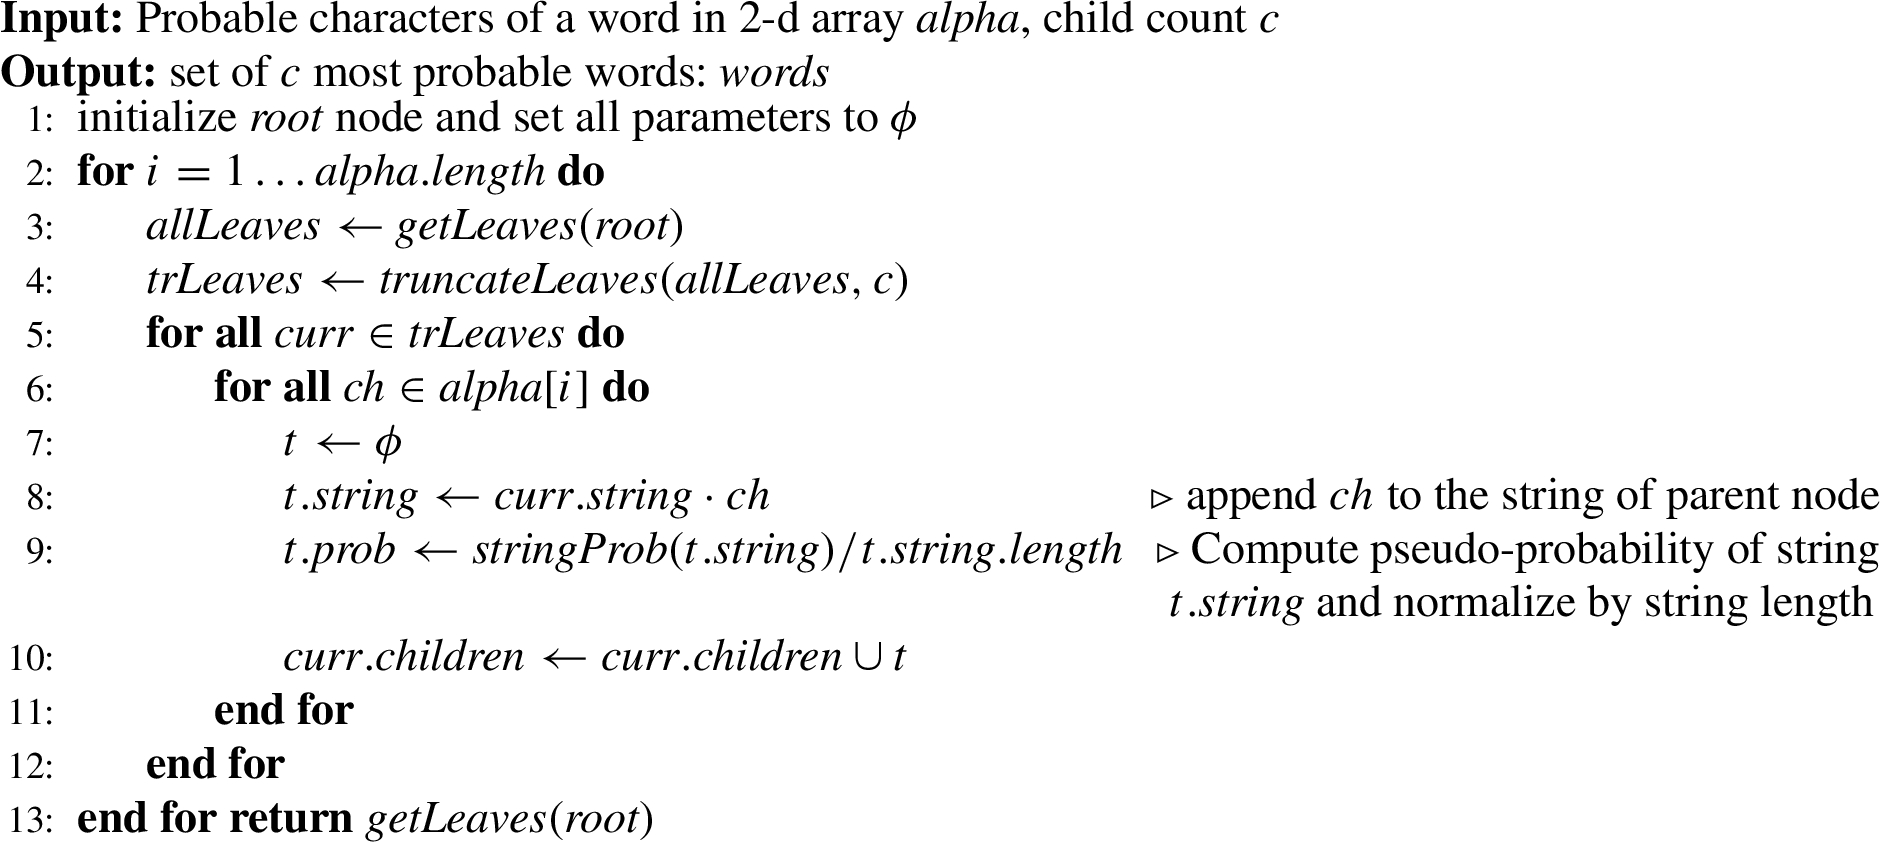
This algorithm builds the inference tree one level at a time. Each level of the tree adds to the tree, the set of probable characters corresponding to the next tap. The outermost
There are three nested
A similar approach is used to build a sentence-level inference tree based on the most probable word sequence. As in the word-level inference tree, at each level, we prune all the nodes except the top k (based on the pseudo-probability value). In the last level, we are left with the top k most probable sentences that can be constructed from the set of probable words and hence from the set of probable characters.
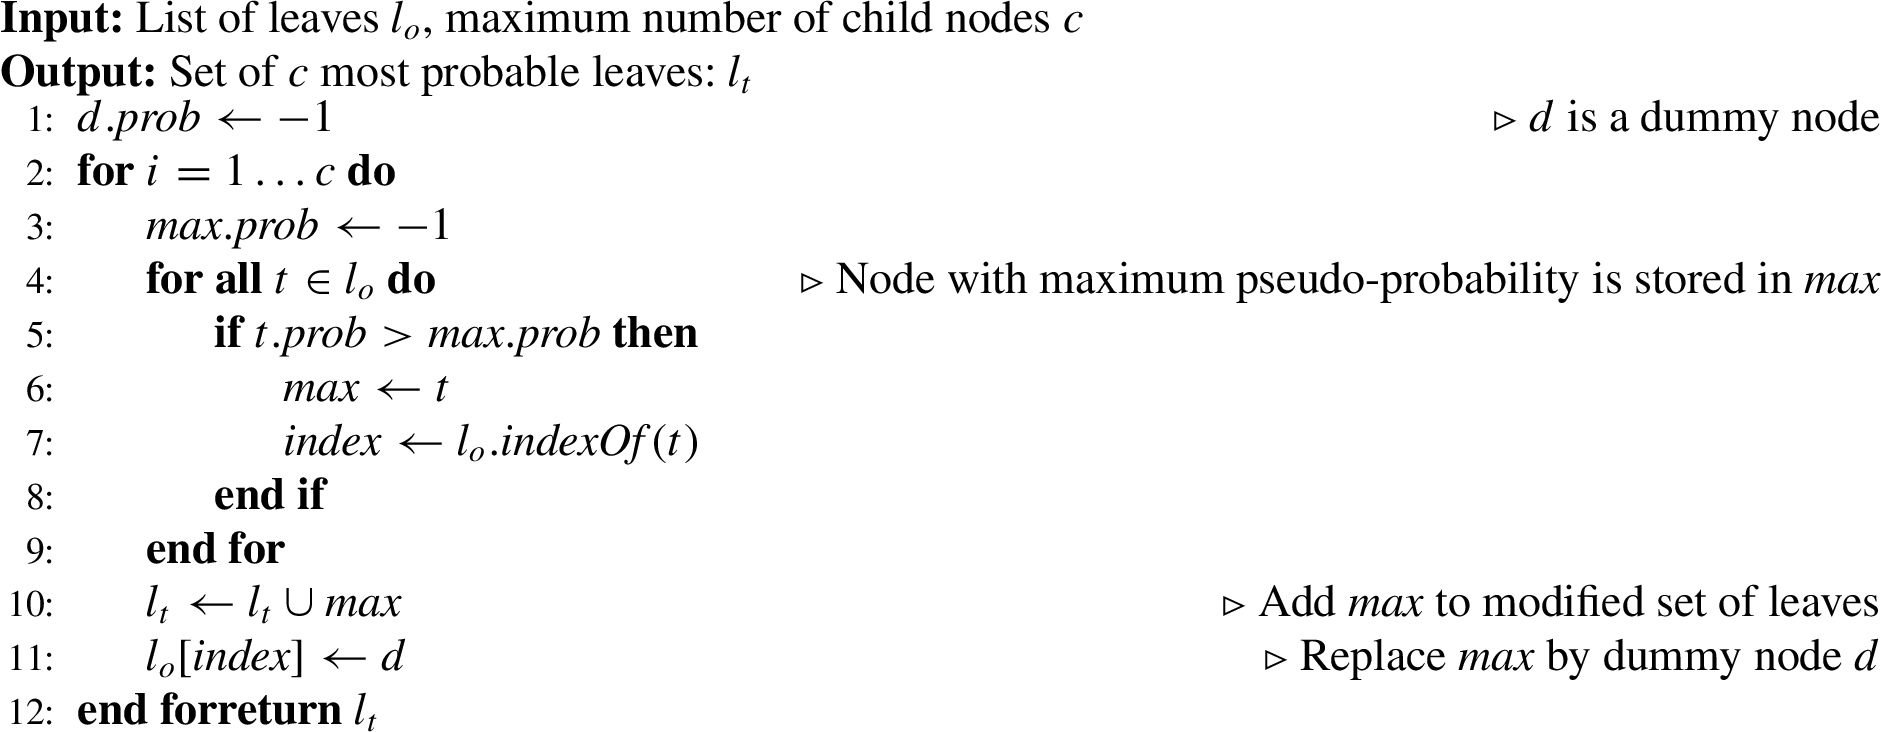
Both the word-level as well as sentence-level inference trees use leaf pruning to prevent exponential expansion of the tree. The pruning algorithm
The attack methodology as described above can not only be used to infer dictionary words but also non-English strings, such as passwords. The contemporary password standard is Payment Card Industry Data Security Standards (
Length of
Approximately
Lowercase letters dominate the majority of characters with about
Numbers, if present, only appear in one or two digits with only single digit occurrence in over
Significant similarity between default password and username.
These findings point to the fact that the passwords that are normally set, are not too long, not overly complex and have similarity with other information that can be obtained easily (e.g., default password, username, etc.). Thus, with the help of audio signals in reducing the password search space, dictionary attacks can be carried out very efficiently. This subsection presents ways in which passwords can be inferred using the TDoA computed from the recorded audio signal and phone geometry.
A brute force dictionary attack would iterate through all possible combinations of the allowed characters to find a password. Although it is very inefficient and takes a lot of resources, in the absence of any other information regarding the password, this is the only way to guess the password. The number of guesses to be tried is given by
A basic improvement that can be made using the proposed attack methodology is to use the audio signal to detect only the number of taps a password entry needs. Thus, if the password length is determined to be q from the number of key taps detected, the attack will take
The attack can be made significantly more efficient if the TDoA extracted from the audio signal to generate a candidate set for each tap is made use of. As discussed in the previous subsections, the candidate set contains the most probable characters corresponding to each tap, in decreasing order of probability. The collection of candidate sets corresponding to all the taps is then used as the search space for the passwords. Assuming that the length of the candidate set for each tap is k, the time complexity of search becomes
In this section, we have explained the two phases of the proposed attack methodology and the algorithms used to carry out the attack. The next section presents the details of implementation of a complete system for carrying out such an attack.
In this section, we describe a complete implementation of the attack flow as proposed in the last section, from recording of sound to extraction of estimated typed text. A trojan app installed in the potential victim’s smartphone generates audio files from the tap sounds received at the two microphones and sends them to the attacker’s server as shown in Fig. 5. The only privileges required are microphone access permission during installation and Internet access during execution for sending the audio files to the attacker’s server for further processing.
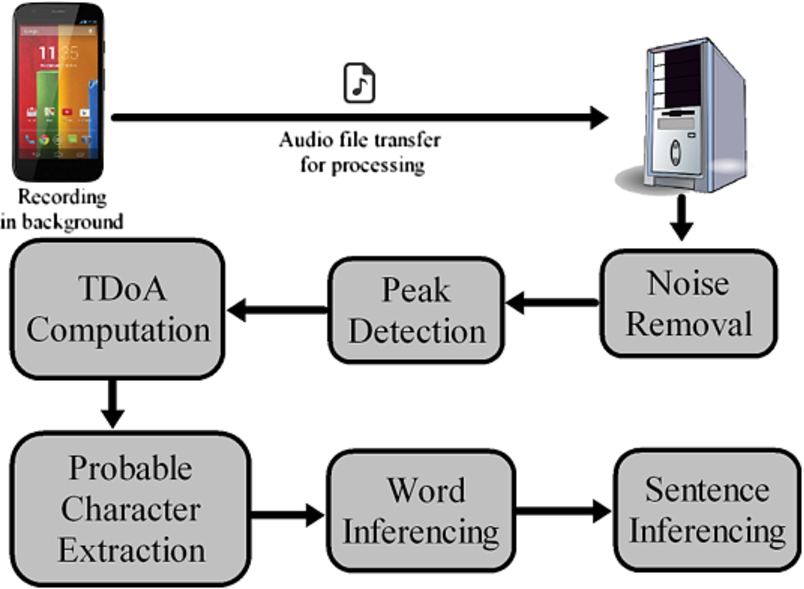
Complete block diagram of the attack flow.
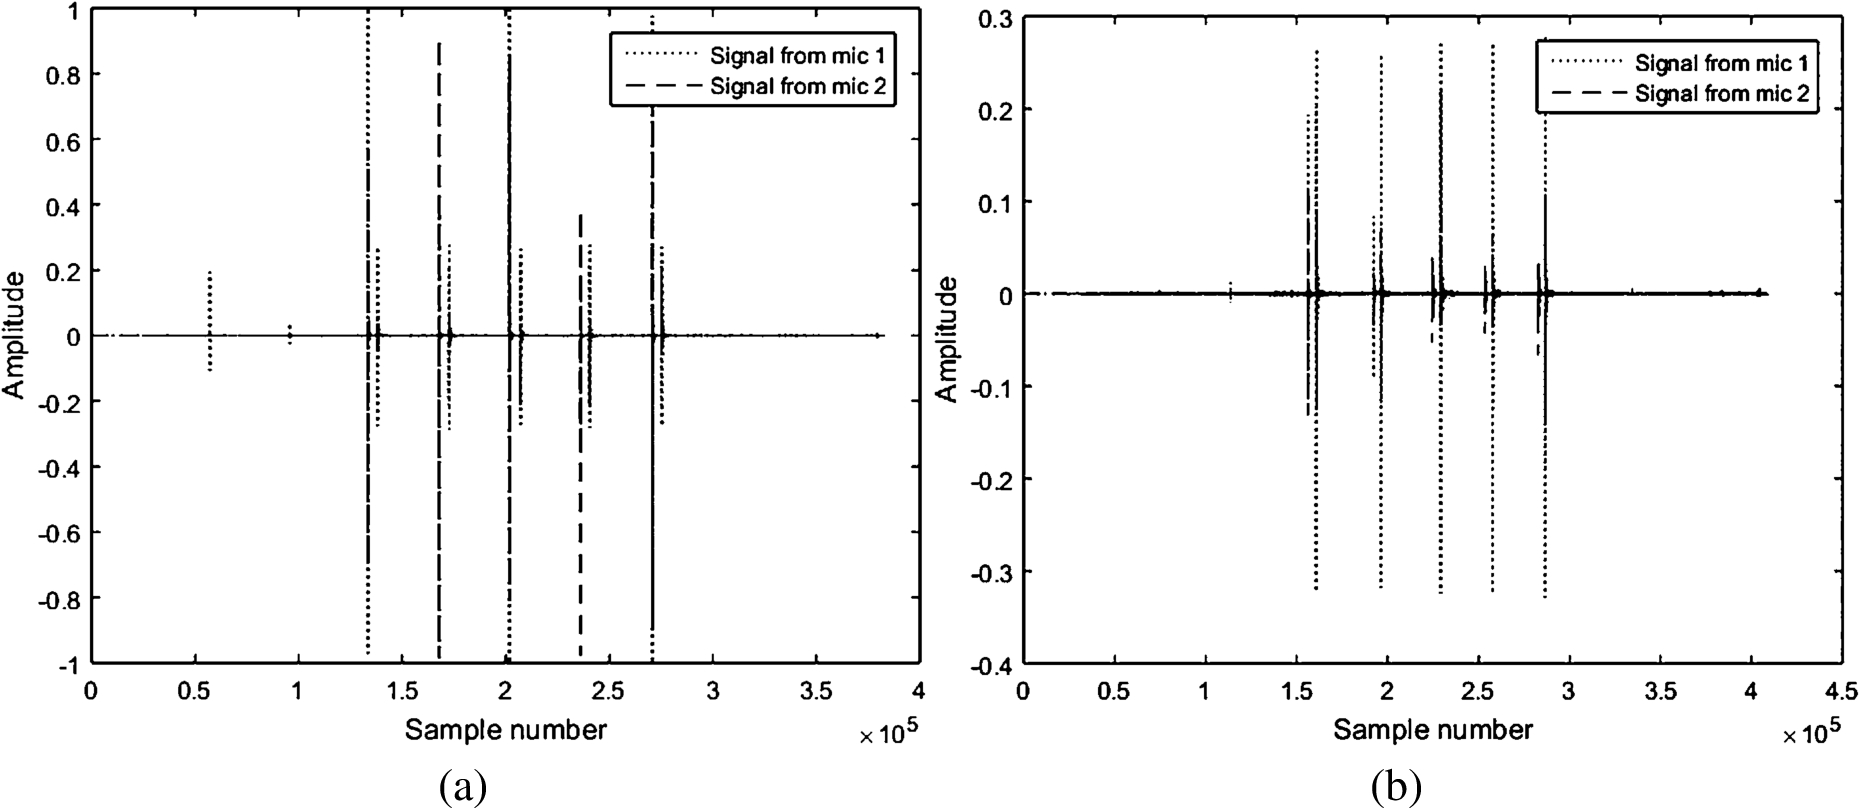
The first module at the server end processing in the overall block diagram of Fig. 5 takes the raw audio file as input and runs the noise filtering step to remove ambient noise. The next step generates the list of time intervals that contain peaks (taps on the touchscreen). The list of peaks serves as input to the next module, which computes the cross correlation between the sound waves from the two microphones as explained in Algorithm 2. Figure 6(a) shows the energy spectra of the audio signals received at the two microphones for each tap. As seen in the figure, the taps produce sharp peaks, preceded and followed by low signal amplitude. This property of the microphone captured signal is used to extract peaks from the audio files. A noticeable shift exists between the two audio signals received at the two microphones as observed from their time domain representation in Fig. 6(b). An expanded view of the same is shown in Fig. 7(a). Cross correlation is next computed for these two signals, whose peak is the estimated value of their TDoA. The TDoA value thus computed serves as a parameter for defining the hyperbola that corresponds to the candidate region on the touchscreen where the tapping was done. Another important observation from Fig. 6(a)–(b) is that, one of the signals has higher amplitude than the other. This fact is used to select the valid semi-hyperbola, i.e., left or right as depicted in Fig. 1(b) and (c). Instead of amplitude difference, the sign of TDoA can also be used to arrive at the same decision. For instance, if microphone
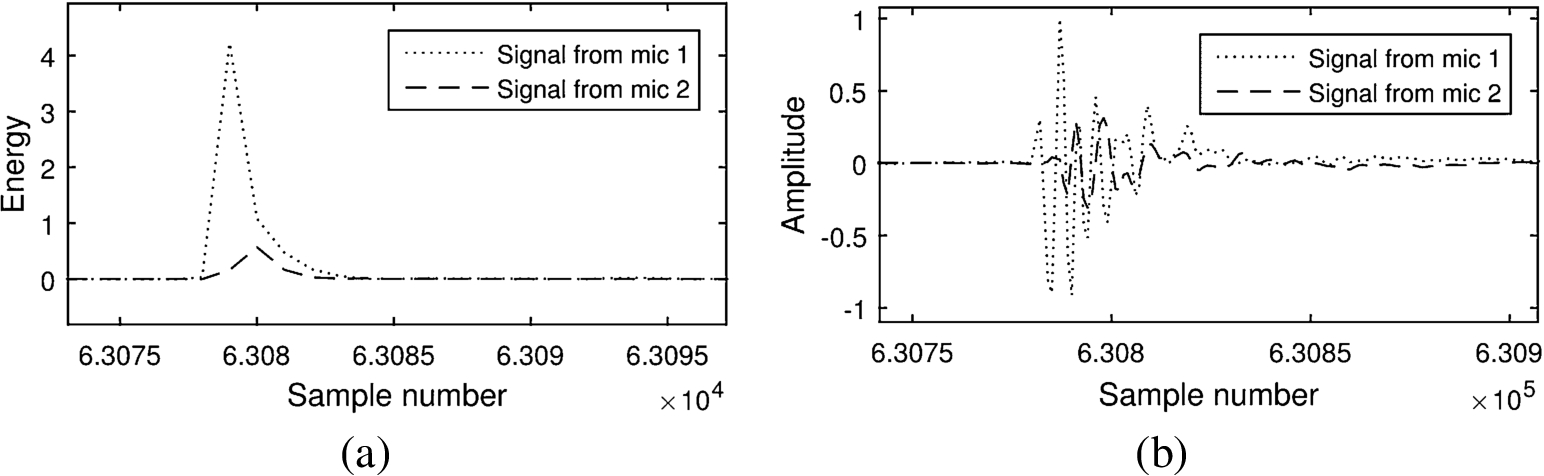
(a) Energy spectrum of the input signal corresponding to a single tap. (b) Input signals in time domain corresponding to a tap.
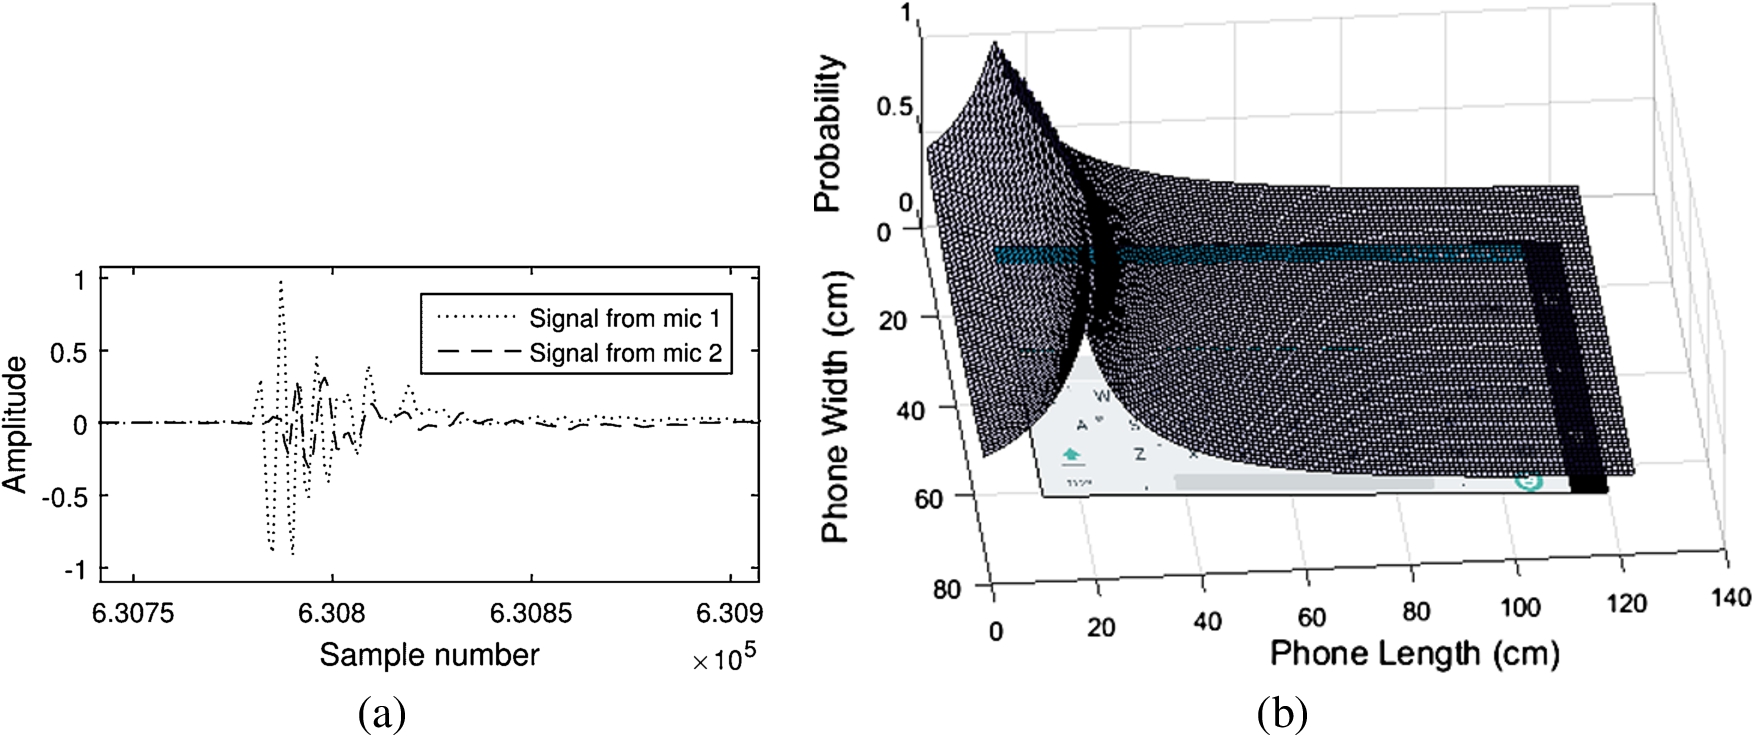
(a) Shift between two signals captured by the two microphones in time domain. (b) Overlay of hyperbola region on phone keyboard.
The TDoA magnitude is next used to determine the probable touchscreen region where the tap occurred, as shown in Fig. 7(b). In this example, the key a was tapped on the touchscreen and the computed TDoA is used to plot the correct semi-hyperbola while the other half is discarded. It is observed that the most probable region passes over the letter a. In a similar manner, for every tap, the most probable region on the touchscreen can be determined. To obtain the k most probable characters, the width of the band can be set in such a way that a total of k number of keys fits inside the semi-hyperbola band. The
The final step of text inferencing from the candidate set is done by building an inference tree and appropriately pruning leaves at each level as explained in Algorithms 4 and 5. The same approach is used for both word and sentence level inferencing of Fig. 5.
In Table 1, we show a sample input-output combination. The user had entered the text “hello world” by tapping the appropriate keys on the touchscreen. The output, which represents the possible characters corresponding to each key tap, keeping the thirteen top possibilities is shown next to the input. It is observed that all the correct letters are present in the output character set. The word and sentence inferencing steps easily identify the correct words as “hello” and “world” from the candidate characters. It is also observed that the characters returned for each tap are located in the same vicinity of a standard QWERTY key pad layout. While we show the result here for a situation where thirteen characters are retained for each key tap, for all except one of the letters (letter r), the first six options contain the correct letter. Thus, working with six characters would have sufficed with the error correction done using a spell checker.
Sample input and corresponding output for the complete system
It may be noted that, in our implementation, we have considered all the steps to be carried out in the server end (refer to Fig. 5). This enables the attacker to deploy all the computing power available at his disposal to decipher the text. However, it also implies that the sound files have to be transmitted to the attacker’s server using the Internet connectivity of the smartphone. An alternative to this approach is to carry out a part or all of the steps depicted in Fig. 5 in the smartphone itself and then send back the deciphered text to the attacker’s server. We next explore the implications of the two approaches.
Carrying out all the processing steps at the server end is apparently beneficial to the attacker. This is not only due to the possibility of deploying more computing power, but also the amount of time the attacker can spend in the process and the potential for deploying newer strategies as and when developed. However, the issue of transferring large audio files needs to be looked into. Table 2 provides the size of audio files in two formats, namely, .wav and .mp3 for several words (typically passwords) of varying length. The corresponding estimated time for transmitting the .mp3 files in 3G and 4G networks are also shown. It is observed that, if .mp3 file is used, the actual transmission time is negligible and is not likely to raise suspicion of the user. However, if the message size is large, the overall transmission time would be higher. For such cases, it would be more prudent to execute the code corresponding to Algorithms 1 and 2 in the trojan app embedded in the smartphone itself, each of which does not take much time to execute as explained later in Section 4. Our code for these two algorithms is now developed using Matlab libraries. However, they may be ported in Java and tested on Android platform for exploring the viability of this alternative approach.
Variation of different audio file sizes with text length
The system implementation described in Section 3 was used to carry out a set of extensive experiments. In this section, we highlight the important observations made and present quantitative results on accuracy, execution time, potential for password guessing and impact of noise.
Audio processing results
In Fig. 8, we plot various TDoAs measured in terms of number of sample points and the corresponding character sets. In one of the phones used in our experiments (layout shown in Fig. 1(b)),
Character sets for different values of TDoA.
(a) Computed values of TDoA obtained from cross-correlation for 100 taps of a. (b) Distribution of the computed TDoA.
We next plot the distribution of the computed value of TDoA for a given letter (a in this case) in Fig. 9(a). The set of top k most probable characters contain the typed character with very high accuracy as seen in Fig. 9(b). In this example, using
In Fig. 10(a), we show how word occurrence frequency and word level accuracy vary with change in word length. A test set of 30 messages of varying sizes was selected and the deciphered text was compared with the actual typed text. The twin vertical bars represent their occurrence frequency and correct recovery frequency. On the other hand, the piecewise continuous line represents accuracy. It is observed that accuracy becomes close to 1.0 for word length
(a) Accuracy for different word lengths (b) Variation in accuracy with message size.
Next, Fig. 10(b) shows how accuracy of deciphering a complete text varies with message size. The same data set considered in Fig. 10 is also used in this study. From the figure, it is seen that accuracy lies in the range of
While we have analyzed the time complexities of the algorithms in Section 2, we also report the actual execution time in this subsection. The algorithms were implemented and tested on an Intel i5 3.2 GHz CPU with 8 GB of RAM. Matlab libraries were used to implement the basic operations. For this configuration, the noise filtering step took 7 milliseconds while Algorithms 1 and 2, i.e., peak detection and TDoA computation, took 0.2 second and 8 milliseconds, respectively. It may be noted that these steps are carried out for each tap sound and hence, the results are independent of the actual length of the message being typed.
Table 3 presents the time taken by the text inferencing algorithm to get the most probable text that can be built using the candidate set provided by the signal processing units. In the table, the message length in number of words is shown along with execution time in seconds. It can be seen from the values of running time that it closely follows an
Execution time of the text inferencing algorithm for different message lengths
Execution time of the text inferencing algorithm for different message lengths
As discussed in Section 2.4, other than deciphering message text, the proposed attack methodology can also be used to guess passwords. We first present the details of the data set used to carry out the password guessing experiments and then report results on its accuracy. To test the password guessing performance, 374 passwords were generated that are random strings consisting of lowercase English letters. We consider the lowercase letters since as discussed in Section 2.4, most of the passwords contain only lowercase letters and those that have other characters also contain the lowercase characters in majority. The letter distribution of the password data set is depicted in Fig. 11. In the data set, there are passwords of different lengths ranging from 4 to 14 with equal number of passwords of each length.
Distribution of letters in the password data set.
The TDoA values obtained from the audio signals corresponding to each tap were used to guess individual letters of the password. To study the performance, different candidate set sizes were considered. The accuracy thus obtained is presented in Table 4. Each value in the table represents the accuracy with which letters were detected for passwords of a certain length (represented by the row). The columns represent the candidate set sizes which are considered for analysis. For instance, the accuracy with which letters can be detected for a password of length 9 taking the candidate size to be 10 can be found following the row corresponding to password length 9 and the column corresponding to the candidate set size 10. From the table, it is observed that using a candidate set size of 11 gives the most promising result. This is because the average password length is usually around 9 to 10 and the accuracy figures for that password length with a candidate set size of 11 are
Variation of password guessing accuracy with respect to different password lengths and candidate set lengths
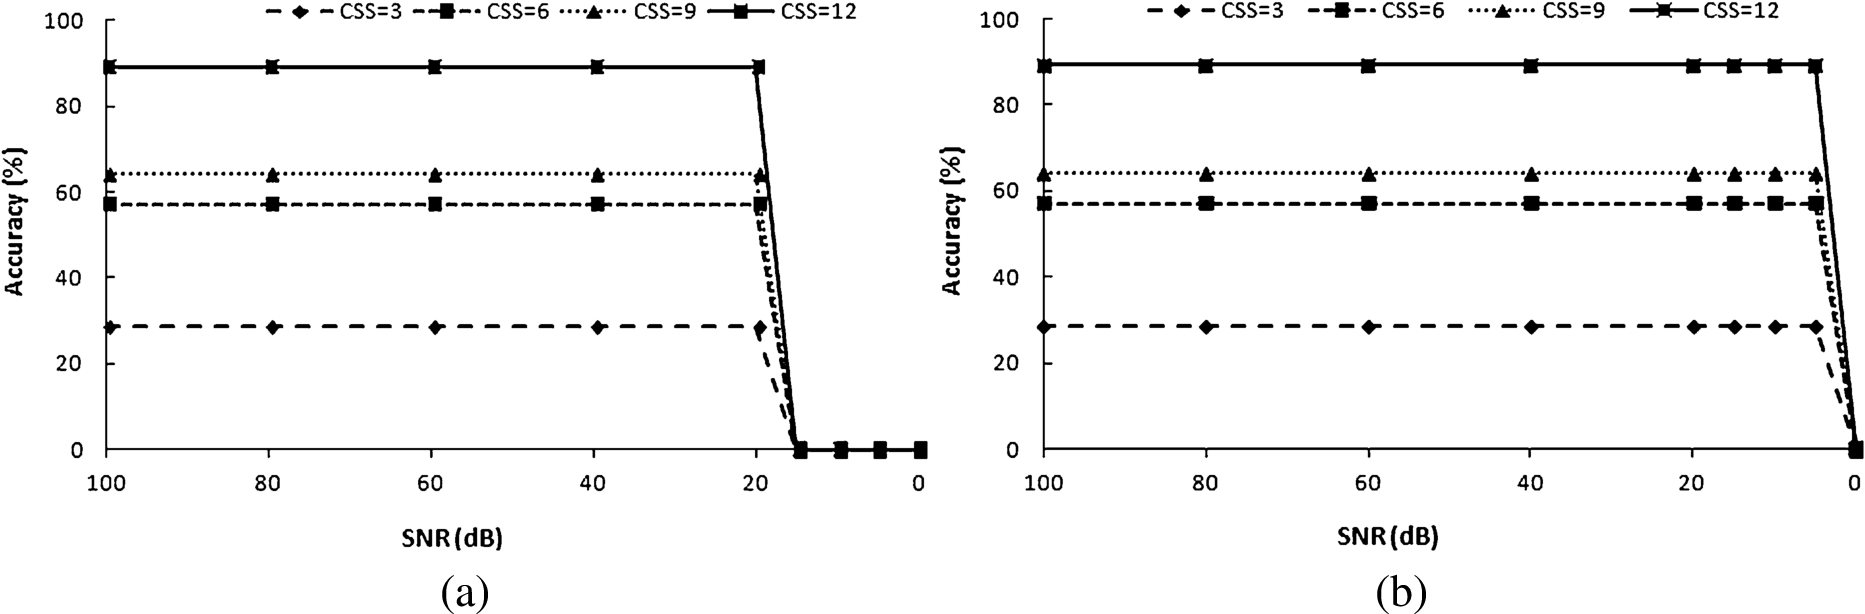
Performance of the proposed approach for varying SNR and candidate size (CSS) (a) without noise filtering (b) with noise filtering.
As discussed previously, the attack methodology proposed in Section 2.2.1 is robust against ambient noise upto a certain extent. Figure 12(a) shows the variation in accuracy as the SNR is lowered from 100 dB to 0 dB through addition of white Gaussian noise. The results have been shown for varying lengths of candidate set size (CSS). It is observed that the accuracy of the basic methodology does not degrade till SNR falls to 20 dB, beyond which due to a high level of noise, its performance begins to suffer. Also, as expected, accuracy is higher for longer candidate set size as compared to smaller ones. Although a fall in SNR to 20 dB implies a substantial degree of ambient noise, we used the noise filtering step proposed in Section 2.2.2. The impact of this pre-processing step on accuracy is depicted in Fig. 12(b). It is seen that upto 5 dB of SNR, there is no degradation in performance. Thus, the methodology can work even in a very noisy environment. It also shows that if a user taps in gently making the tap sound less loud as compared to others who tend to use hard taps, the proposed methodology would work with high accuracy. This is due to the fact that, for the same level of ambient noise, although a light tap lowers the SNR, the proposed methodology would perform equally well.
While our recent work [11] is the first ever approach that exploits the built-in microphones of a smartphone to decipher text from touchscreen key taps, there is some related work in the literature that address similar problems. There are several possible ways of launching side-channel attacks using the various forms of emanations from electrical and mechanical devices, thereby revealing information associated with the source. The attack path heavily depends on the type of emanation and the ease of capturing the same [5,13,19,24]. In particular, threats that exploit acoustic emanations constitute an important field of research. This is due to the fact that almost all devices, including mechanical, electrical, electronic or computing devices, generate some form of sound either as they operate or when a user interacts with them. Some attempts have been made in recent years where methods were designed to recover information from acoustic emanations of devices.
Asonov et al. [1] show that the keyboard strokes can be detected from the sound generated by mechanical keyboards. It is argued that, although the variation in keystroke sound for different keys is imperceptible to human ear, proper signal processing techniques followed by a well-trained classifier can distinguish between them. They use Fast Fourier Transform (FFT) to extract a feature set from the received sound signal and multi-layer perceptron as a classifier. Their experiments show that on an average there are
Zhuang et al. [30] took a relook at the above issue and presented a novel technique for recovering even random keystrokes. Unlike the approach followed in [1], which needs labeled data for supervised learning, this methodology makes use of the statistical constraints of the English language for unsupervised learning. Instead of FFT, cepstrum features are used as they show higher discriminating power. Clustering is done by keeping the number of clusters slightly greater than the actual number of keys to be detected. This is done to account for the imprecision of the clustering algorithm. Next, Hidden Markov Model (HMM) is used to get the acoustic class that a stroke belongs to. To extract text, further spelling and grammar checking is carried out. A feedback based training methodology is followed using the corrected output from previous rounds of detection. It is shown that Gaussian mixtures and Linear classification perform better than neural networks. A maximum character level accuracy of
With the growing popularity of mobile devices and the number and variety of sensors they come equipped with, the problem of exploiting emanations needs to be addressed in a more general way. Several attack techniques that tend to succeed with a moderately high accuracy have been proposed. Meng et al. [18] demonstrate the use of mobile phones to enhance the Kinect [27] experience. They propose that mobile sensors like gyroscope, accelerometer and microphone can be used to broaden its view as well as to improve its accuracy and hearing capability. Kinect typically suffers from the problem of occlusion, while the sensors of a phone can send data associated with the player even when he is out of the viewing range. It is shown that the quality of Kinect sensor output tends to improve when multiple sensor data is fused. A related work by Dagon et al. [8] presents an overview, including a nomenclature, of the various attacks that can be carried out using mobile phones. Preventive measures are also suggested for minimizing the risk from the identified threats.
Since the work reported in this paper aims at deciphering text being typed in smartphone touchscreen, we discuss some related work in this specific field. Miluzzo et al. [20] identify the possibility of using accelerometer and gyroscope sensors and present ways to recover the tap position along with the typed text. They argue that different values of linear and angular acceleration are produced from different points on the screen as they are tapped, which can be captured using the phone sensors. The extracted feature set comprises both time and frequency domain features. A labeled data is used to train a number of classifiers, namely, k-nearest neighbor, multinomial logistic regression, support vector machines, random forests and bagged decision tree. For inferencing, an ensemble technique is used, which finds consensus among the results returned by the individual classifiers. Experiments were carried out to infer the clicked icon as well as the key clicked while typing. In the icon tapping experiment, the average accuracy is reported to be
On a different note, Zhu et al. [28] use mobile phones as devices for recording the keystroke sounds generated by a mechanical keyboard. The mobile phones are placed in the vicinity of the keyboard being typed on. With a sufficiently large number of such external microphones, the keystroke region can be identified with good accuracy. For further generalizing the scope of the attack, the orientation of the keyboard is made unknown. Reconstruction of the keyboard orientation is framed as an optimization problem and the proposed algorithm is expected to return the most likely keyboard layout. The keystrokes are finally recovered from the sound captured by the mobile phones. It is reported that this methodology can recover more than
There is, however, no known work beyond the initial attempt made by us [11], that can decipher the key taps from touchscreen mobile phones. We feel that this attack methodology works in a more realistic setting unlike the contrived situations considered in some of the existing approaches. For example, placing several mobile phones in the vicinity of a keyboard is likely to evoke suspicion. Similarly, use of special applications in mobile phones for launching an attack is often not feasible since the users take special care while using them. External microphones for recording tap sounds on smartphone touchscreen also cannot be meaningfully used due to two reasons. First of all, their position relative to the sound source can vary with time and secondly, these will be susceptible to ambient noise.
Since the proposed methodology uses the microphones already attached to the smartphone, they can silently record and transmit the audio signals to the attacker’s server for further processing. A limited amount of pre-processing like compression can also be carried out in the phone itself before transmission. It also does not require on-line connectivity when the data is being captured. The recorded sound files can be transmitted at a later time when the user connects to the Internet. Unlike some of the other methods for acoustic emanation based attack, which require supervised learning, the proposed methodology does not use any learning stage. The dependency on the phone layout in determining the candidate set of characters for each tap can be resolved by merely sending the phone model through the trojan app to the server, which can be easily obtained. This is made available to all apps as they optimize their performance by setting several of their parameters like aspect ratio, viewing format, etc., using this information.
Preventive measures
From the results reported in Section 4, it can be seen that the attack methodology proposed in this paper works with fairly high accuracy both for deciphering message text as well as passwords. The goal of this paper so far has been to raise awareness that such an attack can indeed be carried out. In this section, we present some preventive measures by which this attack can be thwarted or at least its impact can be minimized.
The first step would be to block evaluation of TDoA and a plausible approach is to deactivate one of the microphones. This would imply that no candidate set can be generated for each key tap. However, this also means that either the stereo recording capability remains unused or the user has to selectively turn the two on when such a requirement arises.
The second approach is broadly based on fudging the tapping sound. One possibility is for the user to keep the key-press tone ON. For each tap, an additional sound will be generated that can partially mask the actual sound created by the tap. The sound produced in this manner is generated by the speaker of the phone and its frequency is also constant for all the keys. Such a sound, even if recorded, will return a TDoA that points to the location of the speaker of the phone. Table 5 shows the candidate sets that are generated when the background key tap sound is ON corresponding to the same input string “hello world” used in Section 4. Rows in the table represent each input letter corresponding to the word “hello world”. The columns represent volume of the background system-generated sound for each key tap. The effect was studied for different volume settings for this background sound. It is observed that, when the volume is in the
Candidate sets for the input string “hello world” for different volume levels of background key tap sound
Candidate sets for the input string “hello world” for different volume levels of background key tap sound
Time domain signal of taps with background key tap tone volume set to (a)
The presence of this background sound can be verified from the time domain audio signal shown in Fig. 13(a) and (b). It is observed in the figures that, near each peak that represents a tap, there is also another peak corresponding to the background key tap sound. When the volume of this sound is set to
A third direction to minimize the success of the attack is to ensure that the OS displays notifications (using icons) to alert the user about which of the devices are being used in the background. As a result, the user will be notified if the two microphones or any other available sensor is currently running. The OS can also be made to display the apps that are currently using the sensors. While this approach cannot be made to prevent the attack, it can act as a deterrent since the user becomes aware of background apps that are trying to eavesdrop and possibly terminate the same to prevent the attack from succeeding. Such measures, however, demand additional OS features as well as a certain level of maturity and knowledge on part of the user.
Another potential countermeasure could be to prompt about device usage or to deactivate the microphones. The user may also be notified when an attack as suggested in this paper becomes viable. This may be achieved by detecting when the user starts typing in while the microphones are still active. Since these two activities (stereo recording and typing) do not always seem to occur simultaneously for regular users, this can be a promising prevention measure under certain situations. However, it need not always be effective as the microphone is almost always ON while typing, trying to pick up keywords that activate voice commands, e.g., “Okay Google”. It is also possible that the user has installed certain custom keyboard apps having voice activated data entry features and most of the voice controlled functions require and use both microphone and Internet simultaneously. Thus, it would be difficult to judge the legitimacy of an app simply by looking at the devices that it is trying to use. What can be done instead is to develop a small footprint monitor that would run in the background to study the behavior of each app and assign a
The primary goal of this paper is to raise awareness about the vulnerabilities of touchscreen phones, which can be exploited by off-the-shelf tools and techniques to devise a side-channel attack methodology that succeeds with high probability. The unique strength of this attack is that, no form of encryption can help to prevent it since the tap sounds are recorded at the time of keying in itself. Extensive experiments show the efficacy of the approach in deciphering text of different lengths as well as in guessing passwords. It works even in the presence of a significant amount of ambient noise since frequency domain filtering can retain only the frequencies corresponding to the tapping sounds and remove the rest of the spectrum.
There are several possible directions for improving the proposed attack methodology. First of all, the signal processing unit can be enhanced. As discussed in Section 3, the signal processing unit consists of three units, the
The second area of improvement is in word and sentence inferencing. Other NLP techniques [3,23,25] may be explored for enhancing the performance of this step. This includes a better language model and use of a larger corpus for determining accurate n-gram frequencies. In Section 2.3, we have used the unigram, bigram and trigram
It would be an interesting exercise to try to implement the attack on the mobile device itself instead of sending the sound files over the Internet to another server for further processing. Given the rich processing capabilities of modern smartphone ARM processors and various tool APIs as well as open source DSP libraries available for development, it might be feasible to implement the processing of audio file to extract the TDoA in the smartphone. If such an implementation succeeds, it would make the attack stealthier. This will additionally evade the detection of attack by analyzing the network pattern in correlation with key strokes.
Finally, we plan to experiment further by including data from more number of sensors (both microphones as well as others) and see if fusion of information helps in improving the performance. For instance, there are phones equipped with more than two microphones and data captured by an increased number of microphones is expected to improve the accuracy of tap localization. One possible way to achieve this would be to generate candidate sets for each pair of microphones and take their set-intersection/union as the final candidate set. Moreover, sensors such as gyroscope and accelerometer are present in almost all popular smartphones. For each key tap, the accelerometer and gyroscope values would vary. Although this data is a bit more difficult to make use of as compared to the microphone data, still it is a possibility that is worth exploring to see how the attack performs.
Footnotes
Acknowledgments
Research reported in this publication was supported by the National Science Foundation under awards CNS-1564034 and CNS-1624503. The content is solely the responsibility of the authors and does not necessarily represent the official views of the agencies funding the research.