Security compliance auditing is a viable solution to ensure the accountability and transparency of a cloud provider to its tenants. However, the sheer size of a cloud, coupled with the high operational complexity implied by the multi-tenancy and self-service nature, can easily render existing runtime auditing techniques too expensive and non-scalable. To this end, a proactive approach, which prepares for the auditing ahead of critical events, is a promising solution to reduce the response time to a practical level. However, a key limitation of such approaches is their reliance on manual efforts to extract the dependency relationships among events, which greatly restricts their practicality. What makes things worse is the fact that, as the most important input to security auditing, the logs and configuration databases of a real world cloud platform can be unstructured and not ready to be used for efficient security auditing. In this paper, we first propose a log processing technique, which prepares raw cloud logs for different analysis purposes, and then design a learning-based proactive security auditing system, namely, . To this end, we conduct case studies on current log formats in different real-world OpenStack (a popular cloud platform) deployments, and identify major challenges in log processing. Later, we design a stand-alone log processor for clouds, which may potentially be used for various log analyses. Consequently, we leverage the log processor outputs to extract probabilistic dependencies from runtime events for the dependency models. Finally, through these dependency models, we proactively prepare for security critical events and prevent security violations resulting from those critical events. Furthermore, we integrate to OpenStack and perform extensive experiments in both simulated and real cloud environments that show a practical response time (e.g., 6 ms to audit a cloud of 100,000 VMs) and a significant improvement (e.g., about 50% faster) over existing proactive approaches. In addition, we successfully and efficiently apply our log processor outputs to other learning techniques (e.g., executing sequence pattern mining algorithms within 18 ms for 50,000 events).
Security threats such as isolation breach in multi-tenant clouds cause persistent fear among tenants while adopting clouds [73]. To this end, security auditing in clouds can possibly ensure the accountability and transparency of a cloud provider to its tenants. However, the traditional approach of auditing, a.k.a. retroactive auditing, becomes ineffective with the unique nature (e.g., dynamics and elasticity) of clouds, which means the configurations of a cloud is frequently changed and hence, invalidates the auditing results. To address this limitation and offer continuous auditing, the intercept-and-check approach verifies each cloud event at runtime. However, the sheer size of the cloud (e.g., 1,000 tenants and 100,000 users in a decent-sized cloud [58]), can usually render the intercept-and-check approach expensive and non-scalable (e.g., over four minutes for a mid-sized cloud [9]). Since the number of critical events (i.e., events that may potentially breach security properties) to verify usually grows with the number of security properties supported by an auditing system, auditing larger clouds could incur prohibitive costs.
To this end, the proactive approach (e.g., [47]) is a promising solution and specifically designed to ensure a practical response time. Such an approach prepares for critical events in advance based on the so-called dependency models that indicate which events lead to the critical events [47,91]. However, a key limitation of existing proactive approaches (including our previous work [47]) is that their dependency models are typically established through manual efforts based on expert knowledge or user experiences, which can be error-prone and tedious especially for large clouds. Moreover, existing dependency models are typically static in nature in the sense that the captured dependencies do not reflect runtime patterns. A possible solution is to automatically learn probabilistic dependencies from the historical data (e.g., cloud logs). However, the log formats in current cloud platforms (especially, in OpenStack [59], which is one of the most popular cloud management platforms) are unstructured and not ready to be fed into different learning tools. Furthermore, due to the diverse formats of logs in different versions of the cloud platform, the log processing task becomes more difficult. Therefore, to enable log analysis (e.g., learning dependency models for proactive auditing), the need of a log processing approach addressing different real-world challenges (which are discussed in Section 3.2) and preparing raw logs for different learning tools is evident.
To address those limitations, our key idea is to design a log processor, which prepares the inputs for different learning techniques, to learn probabilistic (instead of deterministic) dependencies, and to automatically extract such a model from processed logs. Based on these dependency models, we propose a learning-based proactive security auditing system, namely, . We describe our implementation of the proposed system based on OpenStack [59], and demonstrate how the system may be ported to other cloud platforms (e.g., Amazon EC2 [3] and Google GCP [24]). Finally, we evaluate our solution through extensive experiments with both synthetic and real data. The results confirm our solution can achieve practical response time (e.g., 6 ms to audit a cloud of 100,000 VMs) and significant improvement over existing proactive approaches (e.g., about 50% faster), and our log processor can be adopted by different learning techniques efficiently (e.g., only 18 ms to execute different sequence pattern mining algorithms for 50,000 events).
In summary, our main contributions are threefold.
To the best of our knowledge, this is the first approach for processing OpenStack logs for identifying event sequences to learn dependencies. First, our study investigates cloud logs from both real and testbed clouds, and enumerates all challenges in log processing. Second, our log processing technique addresses these challenges, and supports different learning techniques (e.g., Bayesian network and sequence pattern mining).
We propose an automated learning-based proactive auditing system, namely, , which automatically learns probabilistic dependencies using the proposed log processor to allow handling the uncertainty that is inherent to runtime events, and hence, addresses the major limitations of existing proactive solutions. As demonstrated by our implementation and experimental results, provides an automated, efficient, and scalable solution for different cloud platforms to increase their transparency and accountability to tenants.
Unlike most learning-based security solutions, since we are not relying on learning techniques to detect abnormal behaviors, we avoid the well-known limitations of high false positive rates; any inaccuracy in the learning phase would only affect the efficiency, as will be demonstrated through experiments later in the paper. We believe this idea of leveraging learning for efficiency, instead of security, may be adapted to benefit other security solutions.
A preliminary version of this paper, covering learning probabilistic dependency models and conducting pre-computation-based verification, has appeared in [48]. In this paper, we significantly extend our previous work, which was mainly based on synthetic data and simulations, by examining the practical challenges of obtaining useful inputs from real world clouds to the learning module and consequently providing a comprehensive log processing solution. Specifically, our major extensions are as follows: i) we present demonstration cases on the formats and contents of logs from different cloud deployments including a real community cloud (in Section 3.1);
ii) we enumerate real-world challenges in log processing for different analysis purposes including learning probabilistic dependencies (in Section 3.2);
iii) we propose a new log processing approach which supports different formats of cloud logs and addresses all previously identified challenges (detailed in Section 3.3);
iv) we demonstrate that the new log processing solution can facilitate other learning techniques (e.g., sequence pattern mining) including learning Bayesian network parameters (in Section 7.2);
v) we re-design the architecture based on the new extensions (in Section 6.2);
vi) we design new algorithms based on the above-mentioned extensions and implement the newly proposed log processor for OpenStack (in Section 6.3); and
vii) finally, we conduct new experiments with both real and synthetic data to measure the efficiency of the log processor and to show its applicability in other learning techniques beyond (in Section 7.2).
The remainder of the paper is organized as follows. Section 2 provides an overview of . Section 3 describes the demonstration cases on cloud logs and its results, and presents the log processor. Section 4 discusses the methodology of our learning system. Section 5 details our proactive verification system. Section 6 provides the implementation details, and Section 7 presents the experimental results. Section 8 discusses several aspects of our approach. Section 9 reviews related works. Section 10 concludes the paper.
overview
In this section, we present a motivating example, describe the threat model, and provide an overview of our proposed solution.
Motivating example
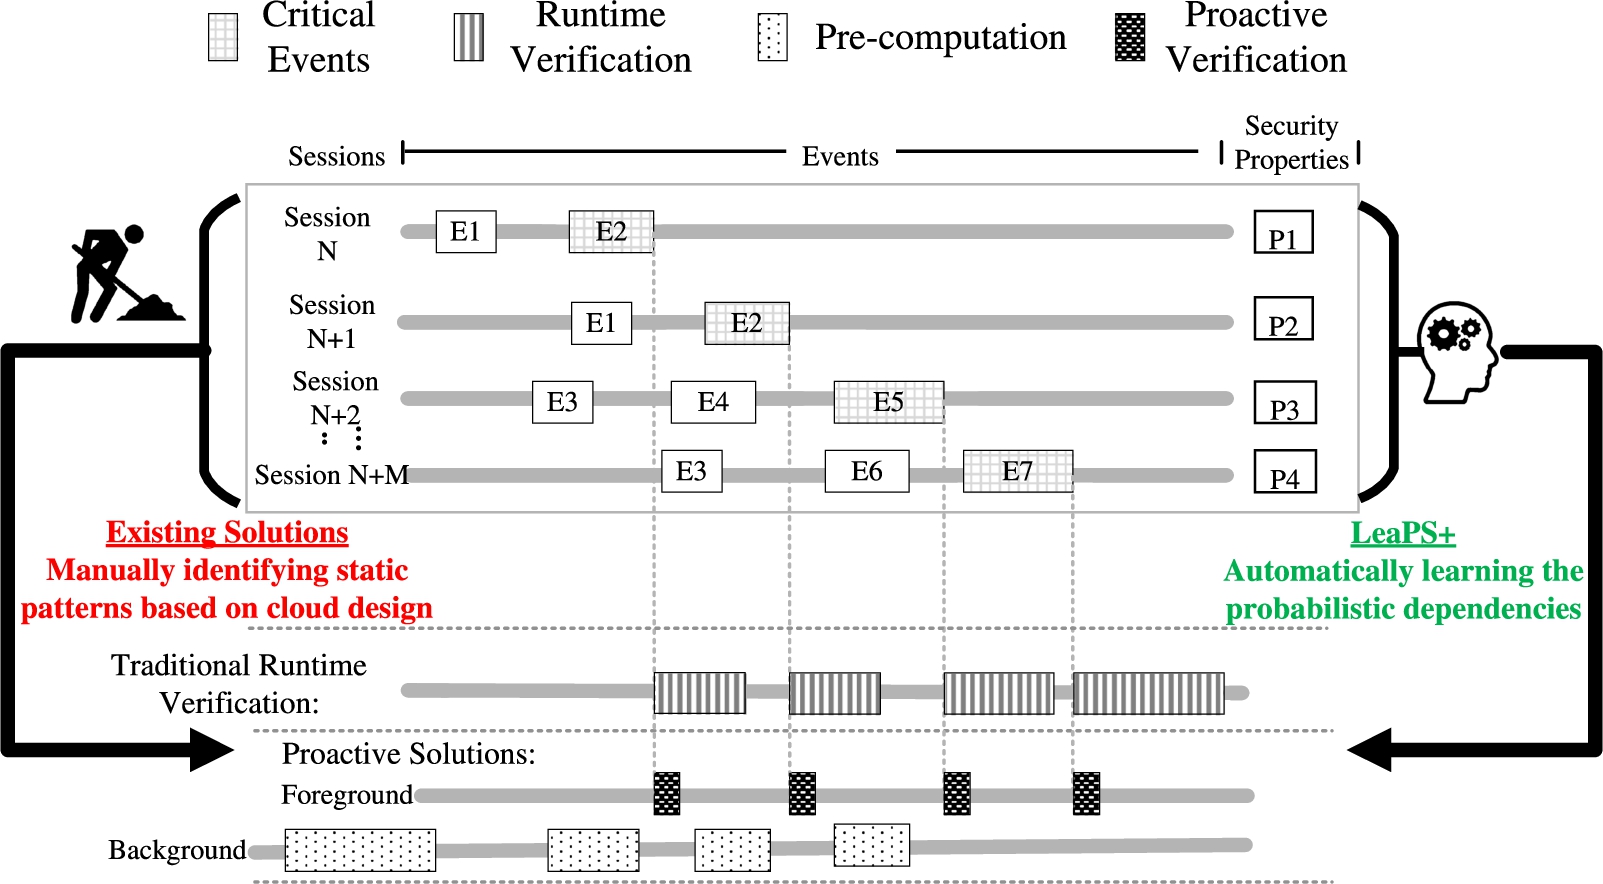
The upper part of Fig. 1 depicts several sequences of events in a cloud (from Session N to Session ). The critical events, which can potentially breach some security properties, are shown shaded (e.g., , and ). The lower part of the figure illustrates two different auditing approaches of such events. We discuss their limitations below to motivate our solution.
Identifying the main limitations of both traditional runtime verification and existing proactive solutions, and positioning our solution.
With a traditional runtime verification approach, most of the verification effort (depicted as boxes filled with vertical lines) is performed after the occurrence of the critical events, while holding the related operations blocked until a decision is made; consequently, such solutions may cause significant delays to operations.
In contrast, a proactive solution will pre-compute most of the expensive verification tasks well ahead of the critical events in order to minimize the response time. However, this means such a solution would need to first identify patterns of event dependencies, e.g., may lead to a critical event (), such that it may pre-compute as soon as happens.
Manually identifying patterns of event dependencies for a large cloud is likely expensive and non-scalable. Indeed, a typical cloud platform allows more than 400 types of operations [59], which implies 160,000 potential dependency relationship pairs may need to be examined by human experts.
Furthermore, this only covers the static dependency relationships implied by the cloud design, whereas runtime patterns, e.g., those caused by business routines and user habits, cannot be captured in this way.
Another critical limitation is that existing dependency models are deterministic in the sense that every event can only lead to a unique subsequent event. Therefore, the case demonstrated in the last two sessions (, ) where the same event () may lead to several others ( or ) will not be captured by such models.
Threat model
We assume that the cloud infrastructure management systems a) may be trusted for the integrity of the API calls, event notifications, logs and database records (existing techniques on trusted computing may be applied to establish a chain of trust from TPM chips embedded inside the cloud hardware, e.g., [6,42]), and b) may have implementation flaws, misconfigurations and vulnerabilities that can be potentially exploited by malicious entities to violate security properties specified by the cloud tenants. The cloud users including cloud operators and agents (on behalf of a human) may be malicious.
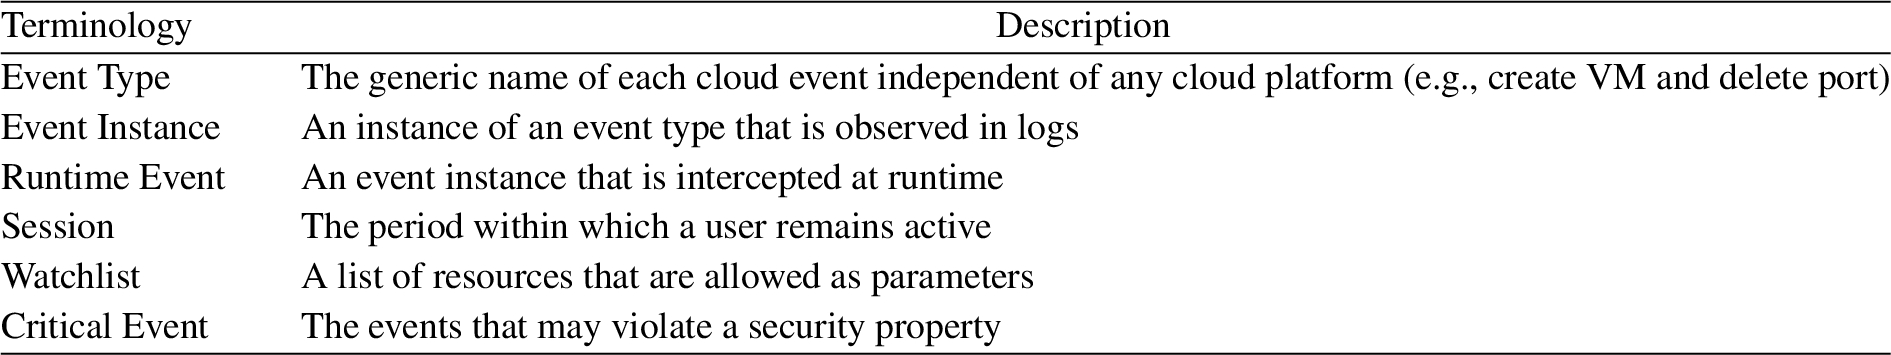
The out-of-scope threats include attacks that do not violate the specified security properties, attacks not captured in the logs or databases, and attacks through which the attackers may remove or tamper with their own logged events. We also assume that the logging system of different services in the cloud is synchronized. We assume that, before our proactive approach is launched, an initial auditing is performed and potential violations are resolved. However, if our solution is added from the commencement of a cloud, obviously no prior security verification is required. This work focuses on attacks directed through the cloud management interfaces and more specifically cloud management operations (e.g., create/delete/update tenant, user, VM, etc.). Any violation bypassing the cloud management interface is beyond the scope of this work. We assume a comprehensive list of critical events are provided upon which the accuracy of our auditing solution depends (however, we provide a guideline on identifying critical events in Section 8). Table 1 describes the terminologies that we frequently use in this paper. To make our discussions more concrete, the following shows an example of in-scope threats based on a real vulnerability.
Description of frequently used terminologies in this paper
An exploit of a vulnerability in OpenStack [60], leading to bypassing the security group mechanism.
Running Example. A real world vulnerability in OpenStack,1
OpenStack [59] is a popular open-source cloud infrastructure management platform.
CVE-2015-7713 [60], can be exploited to bypass security group rules (which are fine-grained, distributed security mechanisms in several cloud platforms including Amazon EC2, Microsoft Azure and OpenStack to ensure isolation between instances). Figure 2 shows a potential deployment configuration which might be exploited using this vulnerability. The pre-requisite steps of this scenario are to create VMA1 and VMB1 (step 1), create security groups A1 and B1 with two rules (i.e., allow 1.10.0.7 and allow 1.10.1.117) (step 2), and start those VMs (step 3). Next, when Tenant A tries to delete one of the security rules (e.g., allow 1.10.0.7) (step 4), the rule is not removed from the security group of the active VMA1 due to the afore-mentioned vulnerability. As a result, VMB1 is still able to reach VMA1 even though Tenant A intends to filter out that traffic. According to the vulnerability description, the security group bypass violation occurs only if this specific sequence of event instances (steps 1-4) happens in the mentioned order (namely, event sequence). In the next section, we present an overview of our approach and show how we automatically capture probabilistic dependencies among cloud events for proactive security auditing.
Approach overview
In the following, we briefly describe our learning-based proactive auditing techniques used by .
First, it parses raw cloud logs into a structured format after marking each field of log entries so that log processing in the next step can be efficient.
Next, it processes these parsed logs to interpret event types, aggregate log entries from different services (e.g., compute and network), and prepare inputs (as event sequences) for learning techniques.
Then, it learns probabilistic dependencies between different event types captured as a Bayesian network from sequences of events processed from different cloud logs.
Afterwards, based on the decreasing order of critical events’ conditional probabilities in these dependency models, incrementally prepares the ground for the runtime verification.
Finally, once one of these critical events is about to occur, we simply verify the parameters associated with its event instance with respect to the pre-computed conditions of that event, and enforce the security policy according to the verification result.
An overview of log processing, learning and auditing mechanisms.
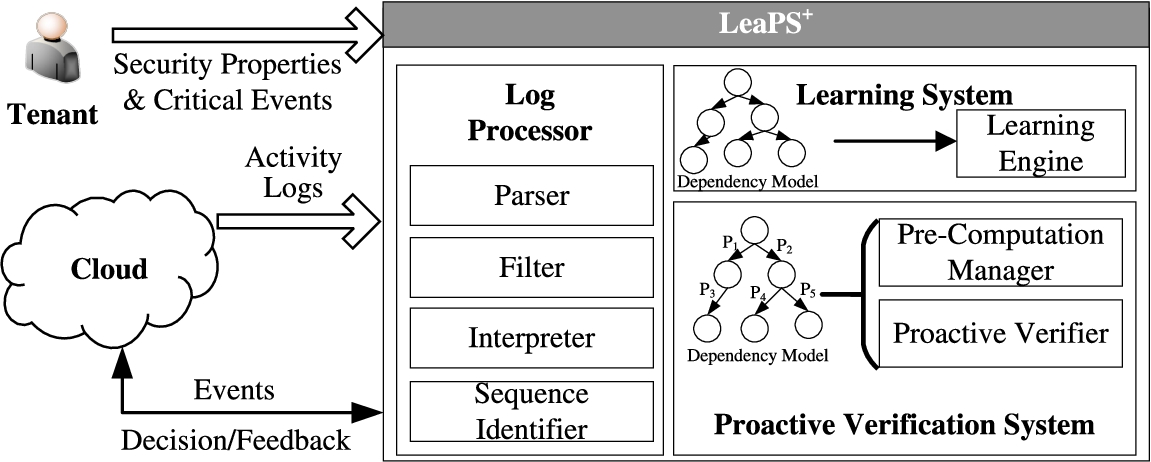
Figure 3 shows an overview of . It consists of three major modules: log processor, learning system and proactive verification system. The log processor is related to processing the unstructured and incomplete raw log files, which will be detailed in Section 3.1, and prepares the data to be used by the learning system. Our log processor consists of four major parts. The parser is responsible to identify fields for each log entries and parse them into a structured format. The filter extracts the relevant log entries and groups them based on tenant IDs. The interpreter is to mark event types for each log entry. Finally, the sequence identifier is responsible to extract the sequence out of those log entries and prepare inputs for various learning techniques. The learning system is dedicated for learning probabilistic dependencies for the model. The proactive verification system consists of two major parts. The pre-computation manager prepares the ground for the runtime verification. At runtime, a light-weight verification tool (e.g., proactive verifier [47]), which basically executes queries in the pre-computed results, is leveraged for the verification purpose. Based on the verification result, provides a decision on the intercepted critical event instance.
Demonstration cases and log processing
In this section, we detail our approach for processing unstructured raw cloud logs and present the challenges and lessons learned from the analysis of the formats of real world cloud logs in OpenStack [59].
Demonstration cases on real-world cloud logs
As a first step, we conducted an investigation on how the executed operations at the cloud management level are logged in OpenStack [59], one of the major cloud management systems in today’s cloud environments. To this end, we used two different OpenStack deployments; a real-life community cloud hosted at a real data center of a large telecommunication vendor and a cloud testbed managed within our institution. All sensitive information in the logs is anonymized based on the data owner’s policies.
Identification of useful information in one of the logs collected from the real cloud.
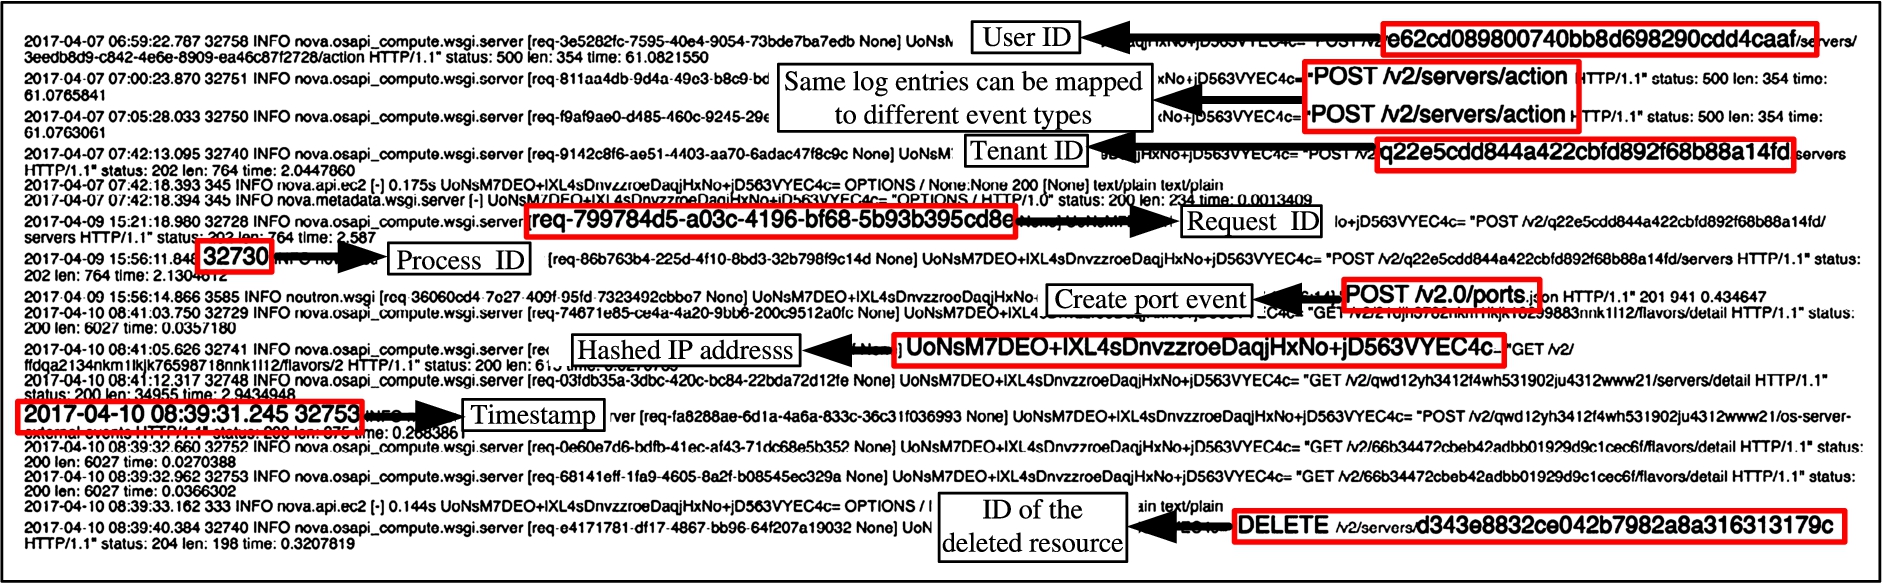
Background on OpenStack Logging. OpenStack [59] logs different user and system actions performed within the cloud. The most commonly used log format in OpenStack services starts with the timestamp, process ID, log level, the program generating the log, an ID, followed by a message field, which might be divisible into smaller informative segments such as request method and URL Path. Furthermore, different OpenStack services write their log files to their corresponding subdirectory of the /var/log directory in the node they are installed in. For example, the log location of Nova is /var/log/nova. Figure 4 depicts an excerpt of the logs collected from a real cloud highlighting the useful information stored in these logs.
Selecting Sample Logs. In the following, we describe how we select different sample logs for our demonstration cases from both real and test-bed environments. We mainly include logs from two major cloud services: network and compute for the following reasons. Firstly, these two services are always present in any cloud deployment. Secondly, the formats of logs from other services (e.g., storage and identity management) are quite similar to the format of logs of those two services. Therefore, our approach can be easily applicable to other services. Furthermore, the selected logs contain user requests (e.g., API calls to the cloud management interface) and system-initiated events (e.g., inter-module procedure calls) with event information at different levels (e.g., DEBUG and INFO) similarly as the syslog format. In our demonstration case, we mainly focus on user requests logged at the INFO level, because our targeted log analyses are to observe user behavior, and this level of logging is less verbose and also set by default in OpenStack.
Investigated Factors. In the following, we describe different factors in the logs that are relevant to automate the learning of dependency models in .
i) Layouts. The first factor that we investigated is the general layout of logs. While comparing the layouts of the logs, we found that there are different attributes in each log entry, and those attributes vary based on the version and the logging service of OpenStack. This was exasperated by the lack of detailed documentation describing the meaning of these attributes. Through our study, we identified 11 fields are used in OpenStack logging: timestamp, process-ID, log-type, method, request-ID, user-ID, tenant-ID, IP address, API URL, HTTP response and request-length. Apart from common layout issues, we also observed discrepancies in layouts of the logs collected from the two different cloud deployments as both environments were managed by different versions of OpenStack.2
We avoid disclosing the exact version details for the sake of security.
The following example depicts the latter observation.
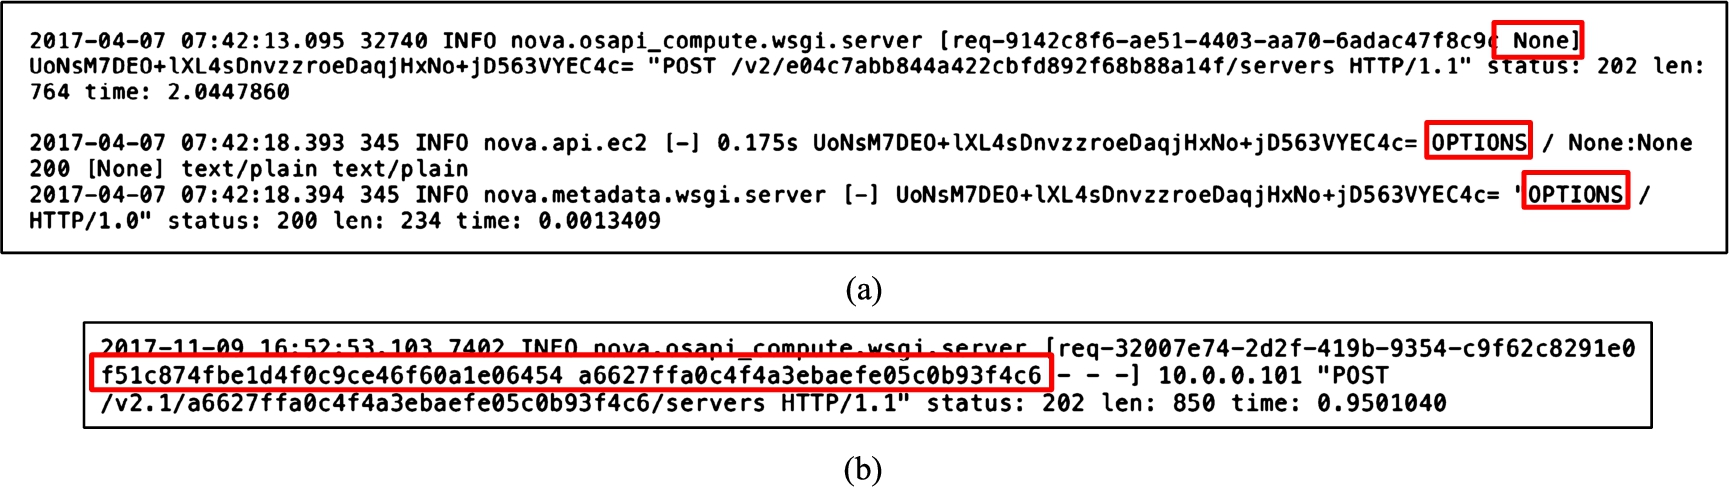
Excerpts of unique fields and entries found only in either studied version of OpenStack in (a) real cloud or (b) testbed cloud.
Figure 5 shows three examples of fields that are only present in one of the studied versions3
Despite that the studied versions are directly consecutive, there are multiple differences in the logging system.
of OpenStack i) The logs from the real cloud does not have any user IDs; instead they store none; ii) the real cloud logs have entries starting with OPTIONS; and iii) the testbed log entries contain user-ID and tenant ID.
ii) Log Entries. After identifying these differences in the layout, we scrutinize each log entry to enable the understanding of the meaning of these entries and their related attributes. We observe that OpenStack logs a wide-range of system-initiated events related to the coordination between different cloud services (e.g., compute, network and storage). Such events are usually logged with a special tenant ID (tenant-service). The first row of Table 2 shows an example of such a log entry, where the ID of the tenant-service is dsfre23de8111214321def6e1e834re31. Moreover, there are requests to list resources or their corresponding details, which are made with GET in their method field. For instance, the second row of Table 2 shows a logged event for the tenant ID (77c433dsf43123edcc12349d9c16fcec) to render the Flavors (the component to show different resource consumptions by a VM). Both resource rendering and system-initiated logged events has no effect on changing cloud configurations, and therefore, these events are not useful for the auditing purpose.
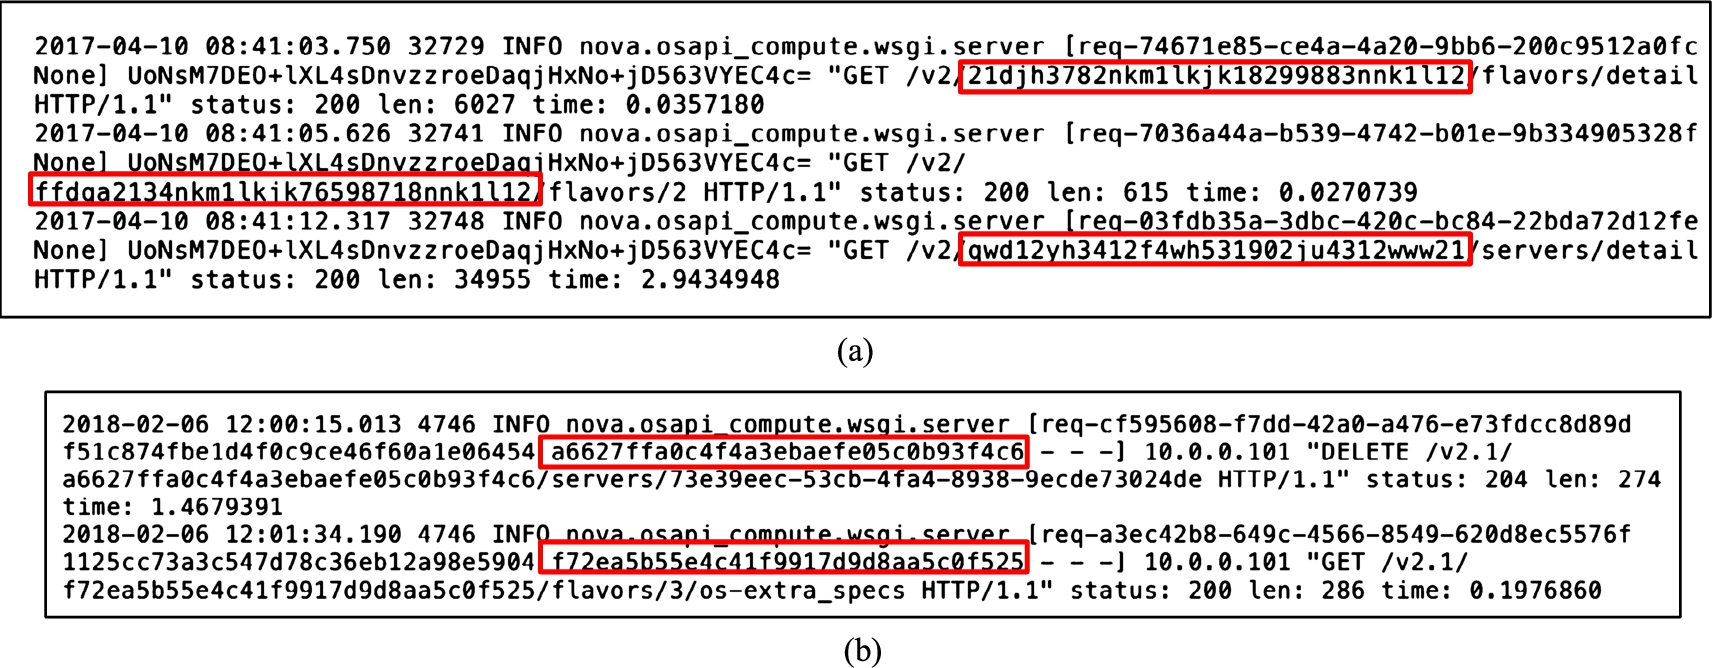
Additionally, we notice that user-generated requests made under different tenants, are jointly logged into the same log file. Furthermore, their log entries could be distinguished from each other based on the associated tenant ID field identifying the tenant initiating the request. Figure 6 highlights the different tenant IDs present in some entries within the log files of both real and testbed clouds.
Parts of log entries belonging to different tenants (highlighting corresponding tenant IDs) in (a) real cloud or (b) testbed cloud.
An excerpt of the log entries corresponding to system-initiated events in the real cloud
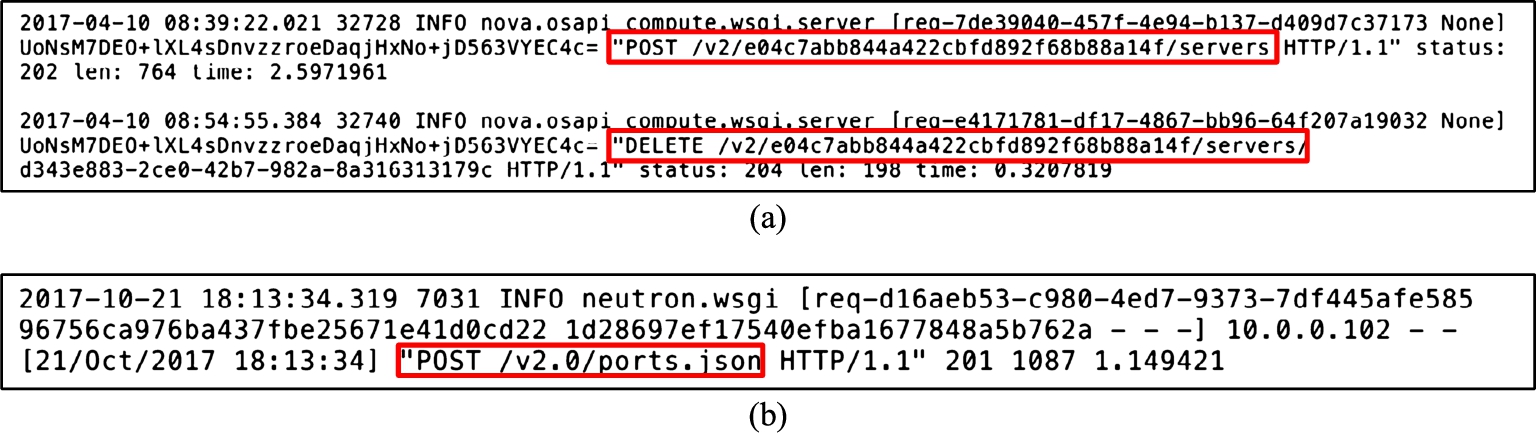
iii) Type of Events. In this part of the demonstration cases, we investigate the process of identifying event types from user-generated requests. Usually, OpenStack user requests are transmitted to the server as REST API calls. Thus, our next step is to obtain the event type from each log entry. However, relying only on the REST methods (e.g., POST, GET, PUT, etc.) does not help as it does not uniquely map to a specific event type. Therefore, we study the API documentation of OpenStack to identify specific path information along with the REST methods (called URL path) to pinpoint each corresponding event type. Figure 7 shows examples of log entries highlighting URL paths corresponding to different event types. The URL paths in the figure actually refer to the event types create VM, delete VM and create port, respectively. However, there are event types for which we observe the same URL paths. For instance, Table 3 shows three examples of such URL paths from some log entries in the real cloud. Even though the three rows in the table correspond to three different events, their URL paths look identical except the VM ID field, which indicates that these are VM related events, but does not help to uniquely identify the event type. As a result, using only those URL paths to identify their corresponding event types is insufficient.
The format (highlighted URL paths as REST APIs) of OpenStack logs collected from (a) real cloud and (b) testbed cloud, to show different cloud events (e.g., delete VM, create VM).
Examples of similar URL paths corresponding to different cloud event types
iv) Correlations of Events. Once event types of different log entries are identified, we need to investigate the relationships between these events and how they correlate. We find out that multiple log entries in different log files of different services correspond to the same user request; which implies that to complete certain user-requests, OpenStack internally calls multiple APIs involving different services, thus generating multiple logged events. Table 4 shows an example where the actual user request is to create a VM. However, we observe at least two entries (create VM and create port) in nova-api.log and neutron-server.log log files, respectively, to complete the related request. Additionally, we notice that there are log entries in nova-api.log and neutron-server.log with the same timestamps (2017-11-01 18:17:16.345) corresponding to two different events (Add security group and Create port). Thus, distinguishing the right precedence relations between events cannot only rely on logged timestamps.
Multiple entries in different logs corresponding to the same user request (i.e., create VM)
v) Session Identification. Finally, we need to split the log files into groups of events mainly based on the contexts (e.g., same user events) or session. The main intention behind this step is to prepare inputs for different learning techniques, many of which accept inputs as a sequence of events. However, in OpenStack logs, we observe that there exists no session specific information. Moreover, most log entries do not include the requestor ID, which could have been useful to identify the context.
Real-world challenges to log processing
In this section, we summarize the main challenges in processing cloud logs, from the above-mentioned study.
Diverse Abstraction Levels: The cloud is composed of heterogeneous systems. As a result, the logs collected from these various systems at least differ in format and in level of abstraction. Second, the various cloud components (e.g., cloud management system, virtual switches and SDN controller) residing at different abstraction layers (e.g., virtual layer 3, virtual layer 2 and SDN) store event information in the logs at various abstraction levels. However, for most log analyses, homogeneous processed log is necessary. To uniform the abstraction levels in the log contents, it is required to have comprehensive understanding of these layers of clouds including the proper mapping between the contents from them. Otherwise, there is a risk of obtaining useless logs either with heterogeneous abstractions or with erroneous contents.
Heterogeneous Log Formats: Our study shows that the cloud logs may have heterogeneous formats. We observe that the log formats vary for different cloud platforms as well as for different versions of the same platform; which includes varieties of different specifications (e.g., fields or attributes). In most cases, the logged information (fields) is not explicitly labeled in the log file. As a result, it is non-trivial to interpret the log entries. Additionally, the log entries are not systematically generated. Therefore, processing such logs efficiently and storing them systematically are challenging.
Lack of Documentation on Logging Specification: Processing the above-mentioned diverse logs both in abstraction and formats are more challenging due to the lack of proper documentation on logging specification. Therefore, each log file requires a tremendous amount of manual study to identify its formats. Furthermore, any change in the log specification in a newer version of the cloud will invalidate at least a part of the previous study. Such manual process may render the log processing time-consuming, error-prone and incomplete.
Centrally Maintaining Logs for Multi-Tenant: There generally exist multiple tenants in a cloud. The number of tenants may vary depending on the size of the cloud. However, these tenants are usually considered as individual entities. Therefore, most log analyses (including our auditing model) are performed at the tenant side. To facilitate such log analyses, cloud logs must be grouped based on tenants. However, major cloud platforms store the detailed logs corresponding to actions from different tenants centrally and in possession of the cloud provider; even a single log file contains entries corresponding to multiple tenants. As a result, grouping log entries based on their corresponding tenants becomes an important and challenging task for a log processor.
Identifying In-Scope Log Entries: Due to the vast scope of the cloud, its logs store varieties of information about different events (including user requests and system-initiated events). However, usually each log analysis targets specific log information. For instance, in our auditing system, we focus on the user-initiated requests. On the other hand, a system monitor may only concentrate on the system-initiated events instead. Therefore, a log processor needs to extract the in-scope log entries based on the goal of the log analysis.
Synchronizing Logs from Different Cloud Services: Activities in different services (e.g., compute, network and storage) are logged separately. However, most log analysis efforts require logs from different services. Therefore, aggregating logs from these services is essential, but not trivial, especially because of the time synchronization issues as reported in [40] in a distributed system like clouds. In the following, we summarize the major challenges in synchronizing log entries in a cloud environment.
The clocks in different services may not be synchronized; which might result in wrong ordering between events after aggregation from these services.
The time of an event occurrence and the time of recording that event in the log may not be the same. In addition, different logging systems may have different time lags in recording the events. This situation may cause a wrong ordering between events once we aggregate logs from different logging systems.
Additionally, due to the above-mentioned lagging in logging system, the reported timestamp of an event may not be precise even within a single system and hence, an analysis may not rely on them.
In this work, we assume that the logging system of different services in the cloud is synchronized, and consider the above-mentioned problem of appropriate ordering of logs as a potential future work.
Retrieving the Semantics of Log Entries: Understanding the semantics of each log entry is mandatory to conduct log analysis. However, retrieving the semantics of an entry becomes non-trivial, mainly due to the diverse API design of different cloud platforms and even of different versions of the same platform. For instance, even though most clouds support REST APIs to request different operations (e.g., create VM, create port and update port), the event types are not obvious from the APIs and require a mapping between API calls and their corresponding event types; which can be obtained by studying the API documentation of each cloud platform. Also, in some cases, different event types are logged similarly, and hence, the above-mentioned mapping becomes insufficient to identify these events uniquely. This kind of event types may or may not be identified by performing special log processing. For instance, in OpenStack, we leverage a special log option called request body to distinguish them. We detail the solutions to this challenge in Section 3.3.4.
Facilitating Various Log Analysis Techniques: The main purpose of log processing is to prepare the raw logs for varieties of log analysis techniques. However, these analysis techniques may expect different formats of inputs, and therefore, a log processor must pre-process the log entries to extract information in the required format. For instance, many learning techniques (e.g., Bayesian network, sequence pattern mining and time series prediction) accept sequence of events as inputs. Therefore, there is a need for a log processor to identify sequences of events from processed logs without changing the semantics of the data (e.g., preserving transitions and their relative order). To this end, we propose a custom algorithm to identify sequences of events, in which all transitions and their relative orders of the actual log entries are preserved, and formats of different learning techniques are maintained. More details on this solution are presented in Section 3.3.6.
Our solution: log processing
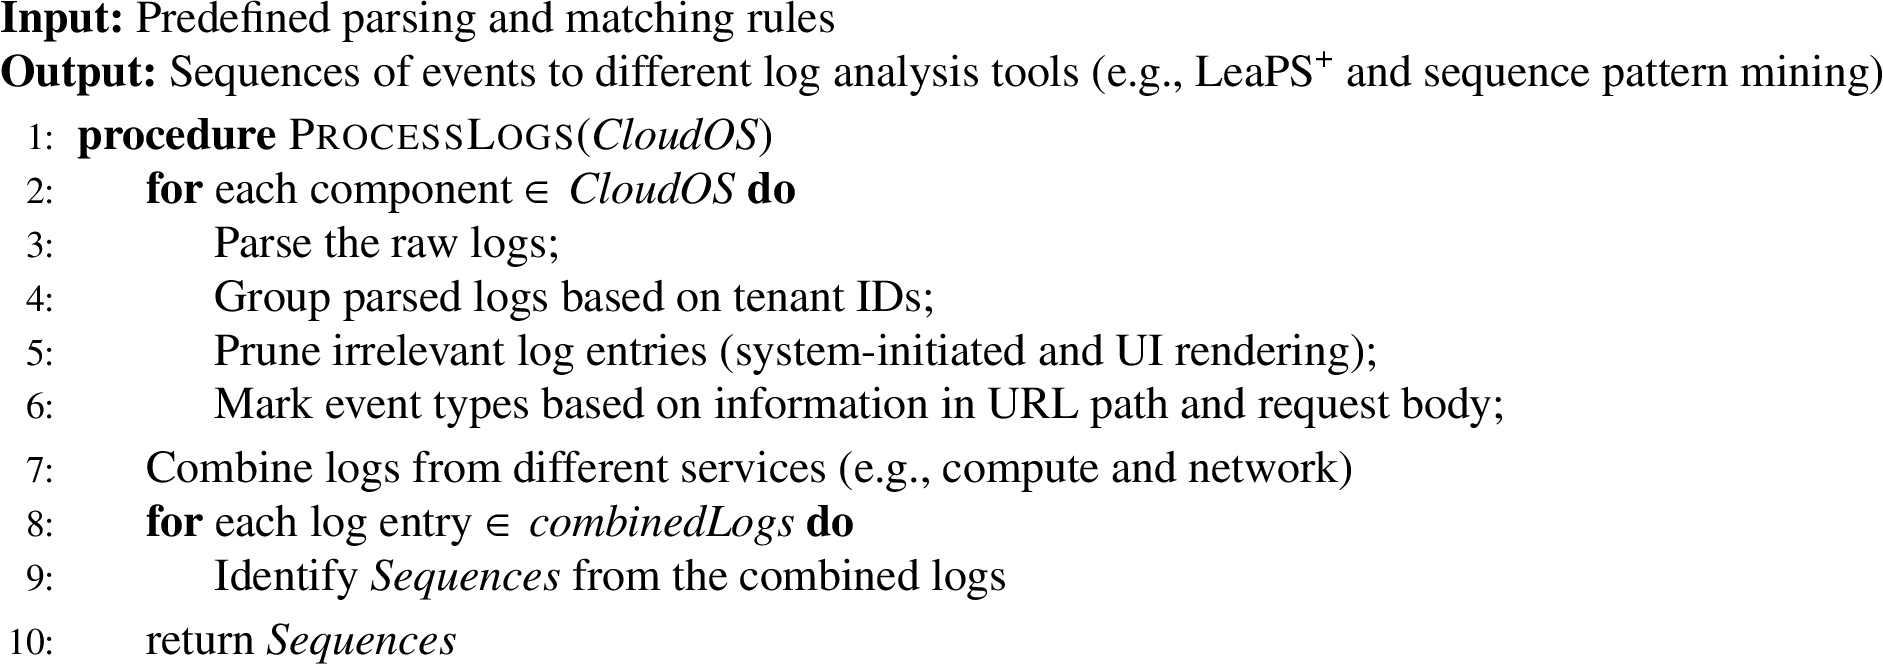
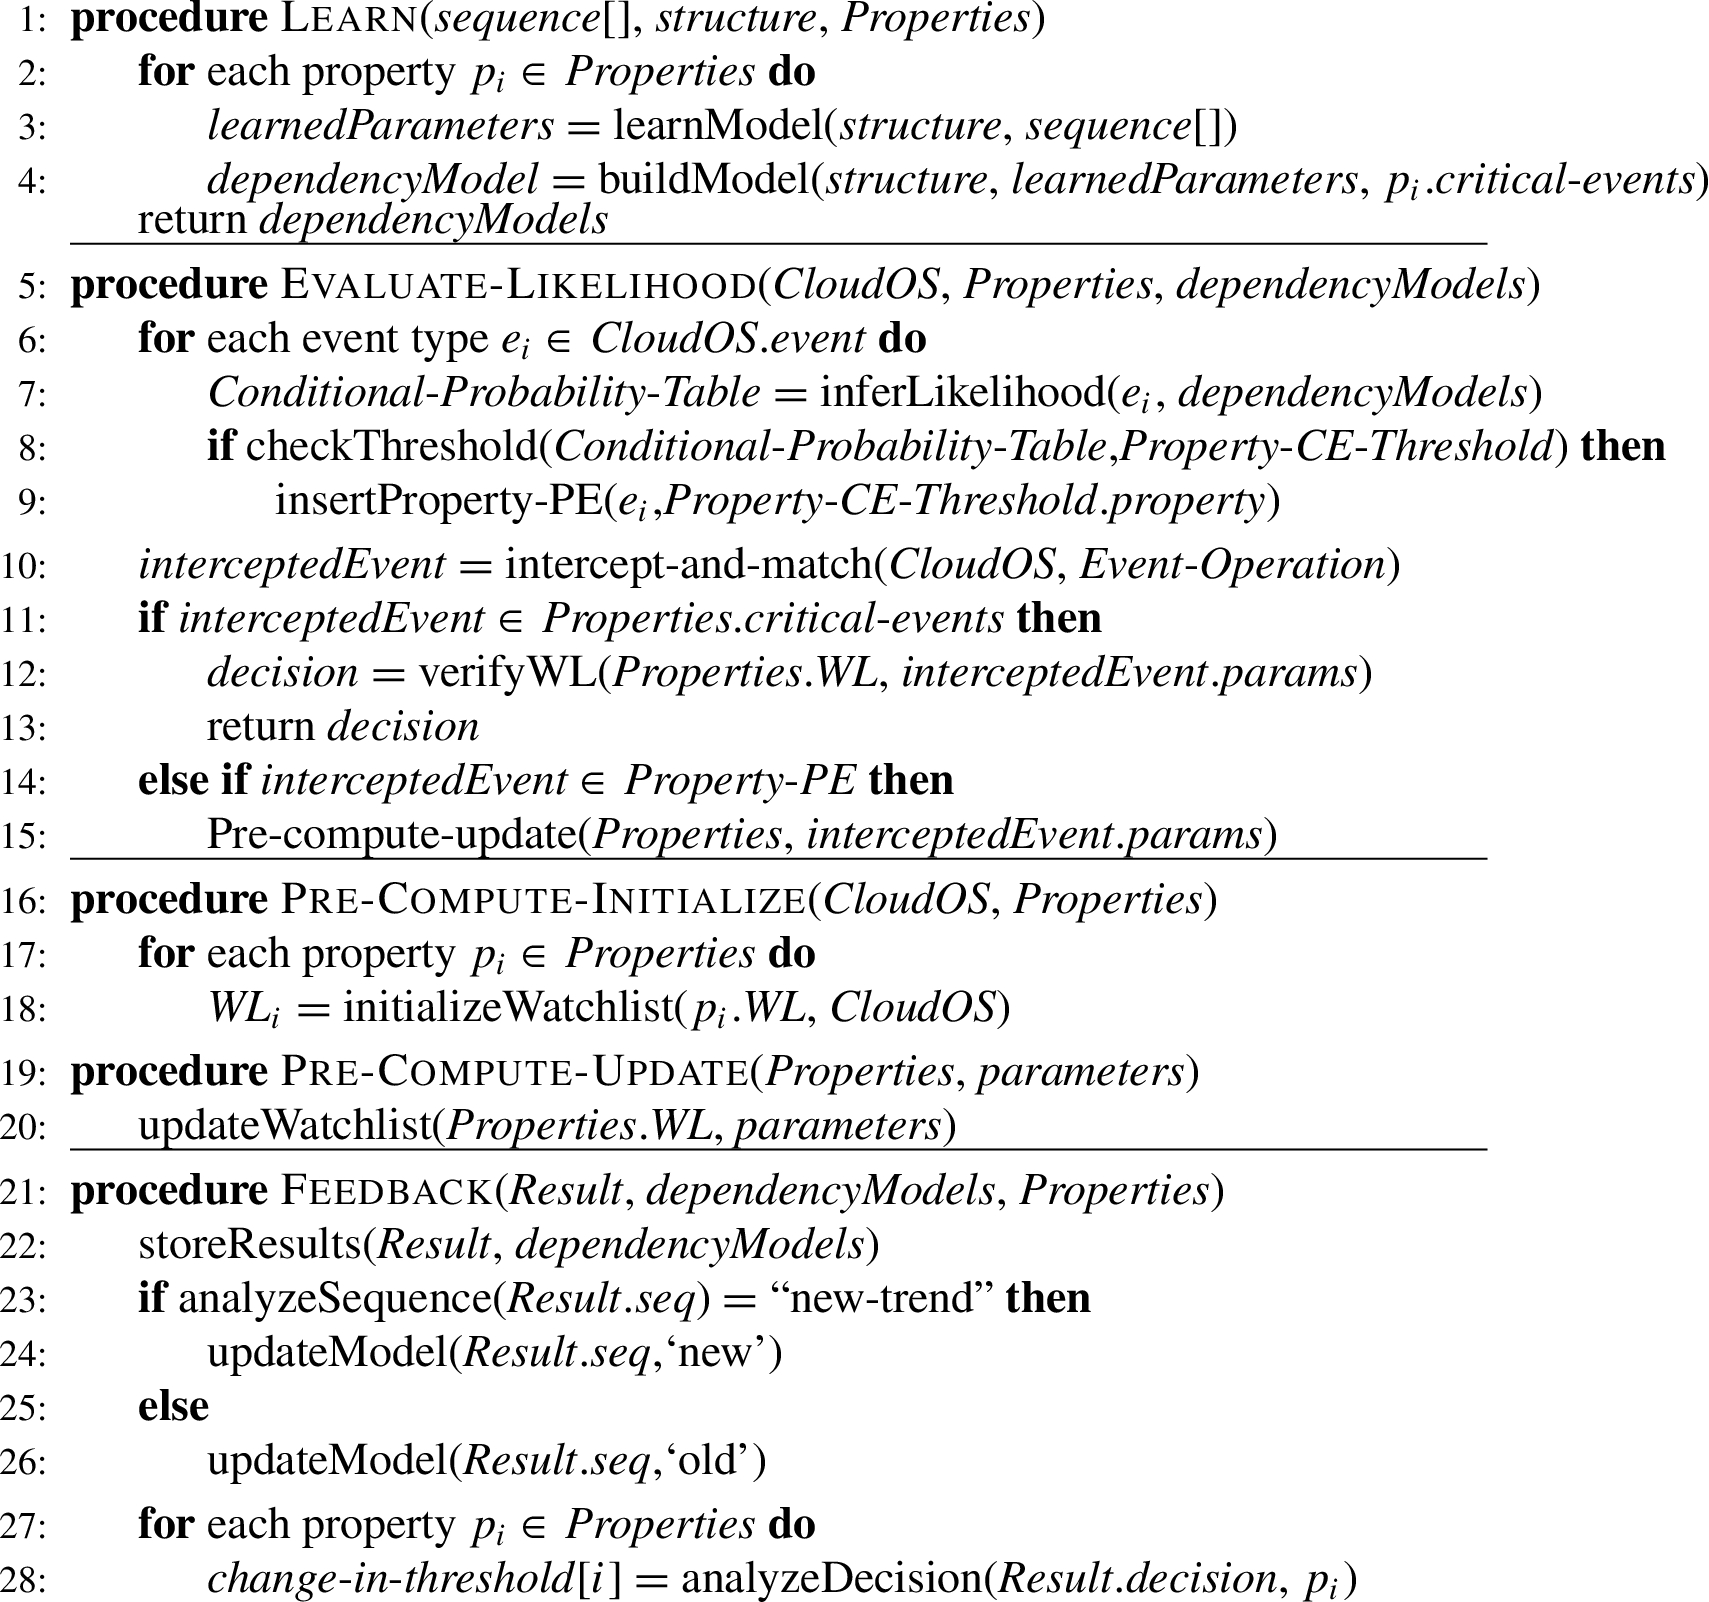
In this section, we discuss our log processing approach, which addresses all of the above-mentioned challenges, and provides more structured and meaningful processed logs for different analyses. A high-level algorithm of our log processor is shown in Algorithm 1.
High-level algorithm of log processing
In the following, we briefly describe main steps of the log processing algorithm.
Line 3: parses raw logs into a structured format. This step extracts identified fields in the log entries and uses them together with a set of pre-defined rules to parse the raw log into a structured log (e.g., CSV) file. This allows handling the heterogeneity of log formats.
Line 4: groups parsed logs based on tenant IDs. The latter, easily identified in the obtained structured log file, allows grouping log entries based on the tenants under which the events are being logged. This tackles the issue of ungrouped events.
Line 5: prunes irrelevant log entries. System-initiated log entries can be grouped and discarded easily based on the system tenant ID (i.e., tenant-service) present in each of the related log entries. Those related to the UI rendering actions are identified by inspecting the method used in the URL (e.g., GET) in the entries related to the logged API calls.
Line 6: identifies the type of events for each log entry. We first identify event types from the method and path information available from Line 3. However, there are several event types (a.k.a. ambiguous events) which have the same method and path information. To tackle this, we further check the request body, which contains detailed information for each log entry, mainly by tuning logging options to include the missing information.
Line 7: combines logs from different services (e.g., compute, network) based on different attributes fields (e.g., tenant id, request id) and timestamps. This step draws the correlation among events logged in different services so that it can handle the challenges mentioned in Section 3.2.
Lines 8-10: constructs the event sequences based on the occurrences of events in the actual log fulfilling the requirements mentioned in Section 3.2. Our log processor provides these event sequences as outputs, which can be later used by different analysis methods (e.g., learning system in Section 4 and sequence pattern mining algorithms in Section 7.2).
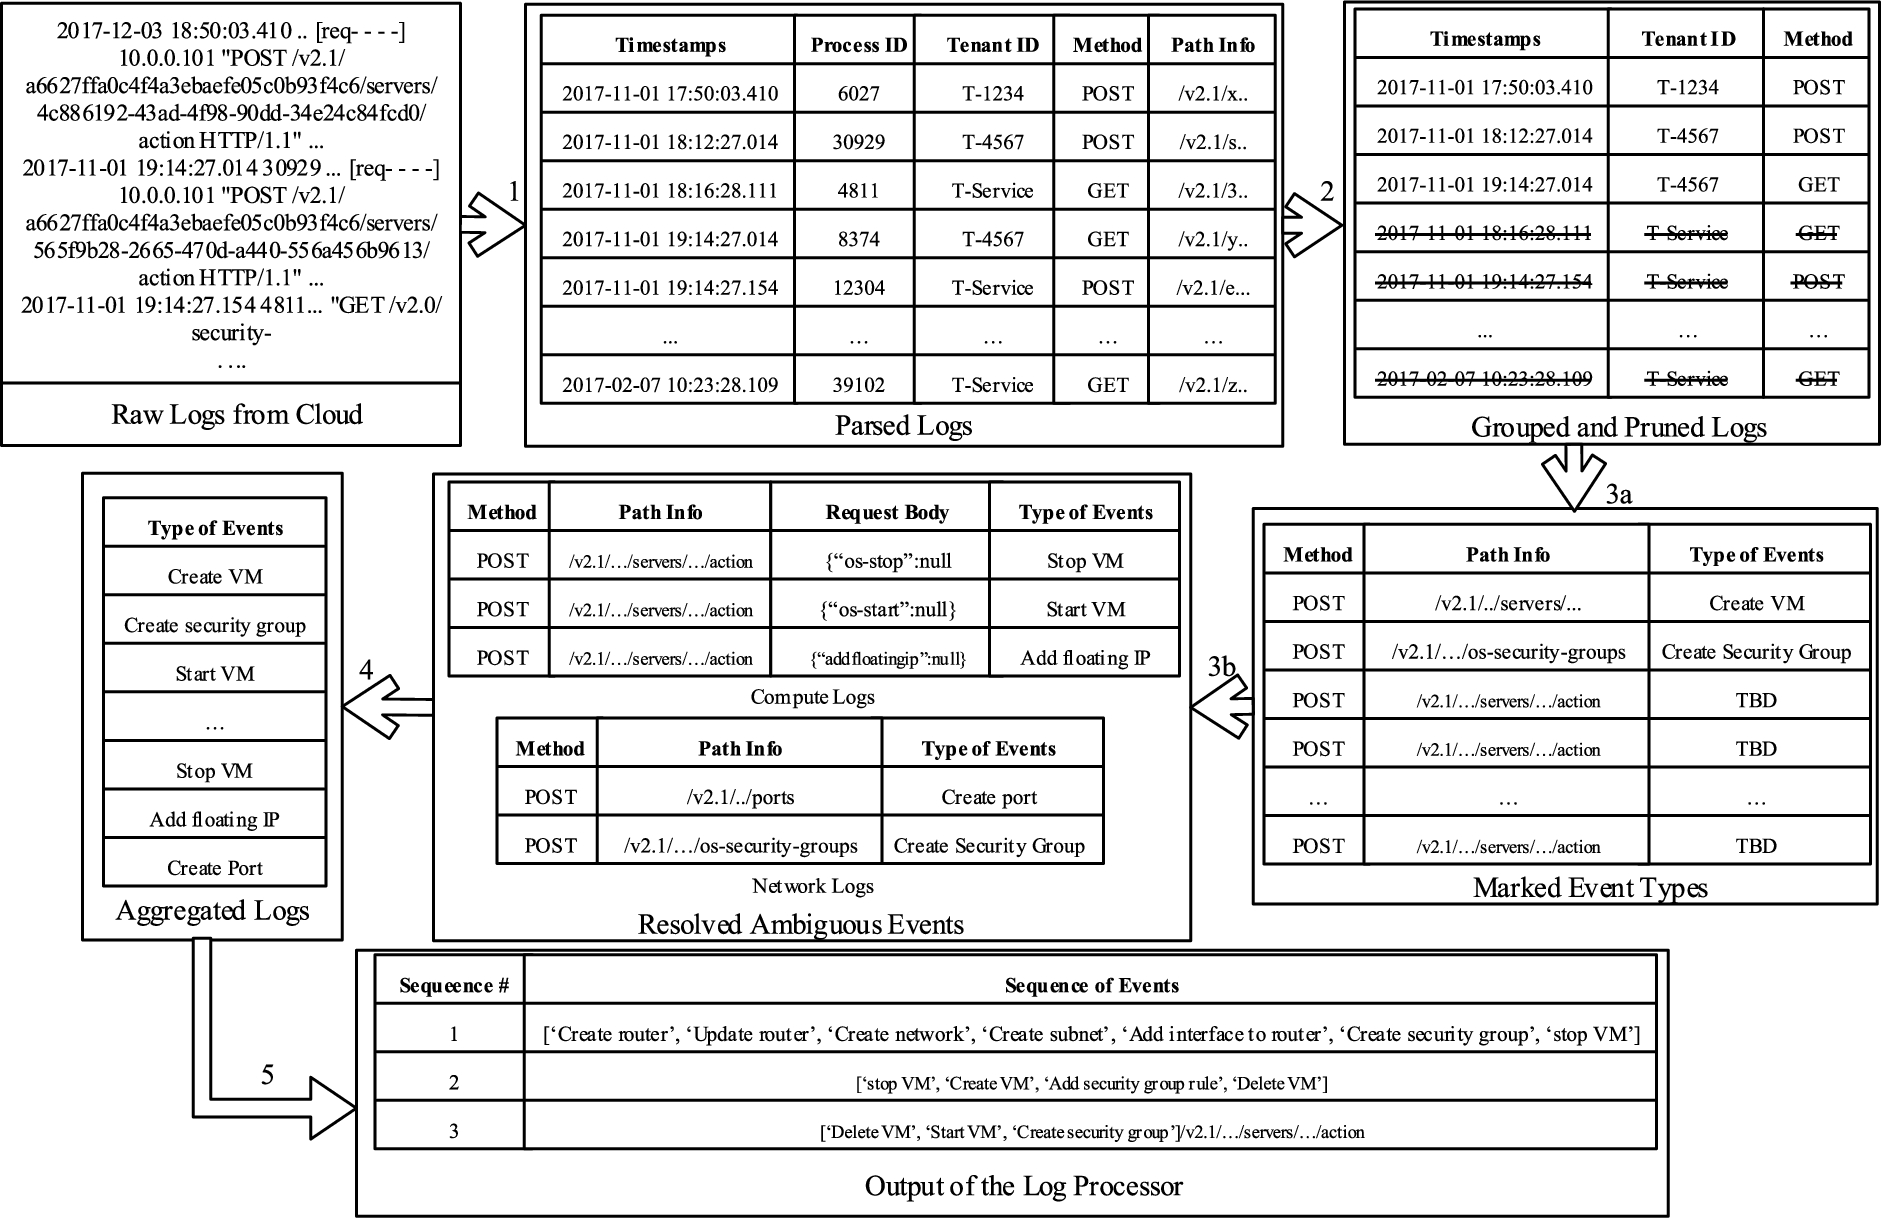
Figure 8 illustrates an example of the outputs of each of these steps. In the following, we first describe the inputs to our log processing and then provide more details on each processing step.
Inputs to log processing
Apart from raw cloud logs, our log processing algorithm requires two inputs: parsing rules to handle different log entries into a structured format and matching rules to identify the event types. Building these inputs is a one-time effort obtained from our investigations in the aforementioned demonstration cases.
Building Parsing Rules. To build the parsing rules, we first study different formats of logs and their corresponding structure. Next, we obtain different fields (e.g., timestamp, process ID and tenant ID) in the log entries and their relative positions in the logs. Finally, we build rules based on the fields and their corresponding orders in logs to support the parsing in Section 3.3.2.
Building Matching Rules. To identify the matching rules, we study the API documentation of OpenStack along with the log formats. To build a relationship between those fields in the logs and their corresponding event types. However, there exist several events for which all these fields are identical and hence, the event types of those events cannot be identified using this procedure. To tackle this, we leverage the request body, which contains detailed information for each log entry. Finally, we provide a complete mapping to identify different event types in Section 3.3.4.
Parsing logs
The main purposes of this step are to mark all useful fields of different cloud logs and store them in a more structured way to enhance log analysis effort in terms of efficiency. We achieve these purposes, by parsing logs based on the pre-defined rules so that each identified field is marked with a meaningful name, and storing the logs in a more structured manner (e.g., in CSV) converting from a text-based file. For example, as shown in Step 1 of Fig. 8, we collect OpenStack logs from compute and network services. The first log entry 2017-12-03 18:50:03.410.. [req- - - -] 10.0.0.101 "POST /v2.1/a6627ffa0c4f4a3ebaefe05c0b93f4c6/ servers/4c886192-43ad-4f98-90dd-34e24c84fcd0/ action HTTP/1.1" contains the fields timestamp, process ID, request ID, IP address, method, path info, tenant ID, respectively. The next step is to parse each entry of the logs based on these fields and their relative positions, and to store them in a table (Parsed Logs in Fig. 8).
An excerpt of outputs after each step of our log processor.
Grouping and pruning of parsed logs
Extracting the contextual information, and separating both system and user initiated activities from the logs are the main goals of this step. First, we identify different contextual information such as tenant ID and accessed resource IDs (e.g., port ID, VM ID and subnet ID). Then, we group log entries based on the tenant ID so that we can obtain tenant specific activities together. Next, we extract the accessed resource IDs by the activities of all log entries. Finally, we separate log entries of user initiated activities from that of system-initiated activities. Note that, the tenant ID field of the log entries for system-initiated events contains a special value (i.e., tenant-service) in OpenStack. However, there exist exceptions where system-initiated events are stored under an existing tenant. Therefore, we maintain a list of such exceptions and match them with the log entries while separating user-initiated events.
For instance, the Parsed Logs in Fig. 8 contain entries from tenants T-1234, T-4567, T-6789, T-Service. After Step 2, in the Grouped and Pruned Logs, we first store all entries from the T-1234 tenant, and then similarly store entries for T-4567, T-6789, T-Service. Afterwards, we identify all log entries with the tenant ID T-Service and store them separately.
Marking event types
Marking the corresponding event types using the pre-defined matching rules (as shown) for each log entry is the main objective of this step. Based on the set of fields used in marking, there are two categories of event types. For the first category, we use the URL path (which includes method, resources, etc.). For example, from the Grouped Logs in Fig. 8, we identify method, resources, resource ID and action as the potential fields which together may provide unique information about each event type. Based on this assumption, we build the matching rules as shown in Table 5. The first entry in the table shows that the fields method: POST and resources: ports indicate the create port event type. Whereas, to identify the add interface to router event type, we require the action: add_router_interface field along with the method, resources and resource ID fields. However, for the last entry in the table, these fields are not sufficient to obtain the event type, as they have the same values for method, resources, resource ID and action fields for multiple event types. These event types are considered as the second category and marked in the following manner.
An excerpt of the mapping to obtain the event types from URL-method and path_info. Note that, the term ‘NaN’ is used by OpenStack to indicate the unrepresentable value for the specific fields, and the term ‘TBD’ is to indicate that the corresponding event type is not conclusive based on the identified fields
Method
Resources
Resoruce ID
Action
Event Type
POST
ports
NaN
NaN
Create port
PUT
ports
port ID
NaN
Update port
DELETE
ports
port ID
NaN
Delete port
PUT
routers
router ID
add_router_interface
Add interface to router
PUT
routers
router ID
remove_router_interface
Remove interface to router
POST
floating-IPs
NaN
NaN
Create floating IP
PUT
floating-IPs
VM ID
NaN
Associate floating IP
POST
servers
VM ID
actions
TBD
For the second category of event types, we identify event type of a log entry, we match the request ID in the log file and request body and look into the matching rules for that particular request body. For instance, Table 6 shows examples of matching rules between request body and event types. The first and second rows of the table shows that the request body values {"os-start": null} and {"os-stop": null} ensure that the requested event types are start VM and stop VM, respectively. The third and fourth rows provide event types (Add security group and Add floating IP) along with their involved security group name (essential) and instance name (leapsVM), respectively.
Examples of identifying event types from request bodies for the event types as the last row of Table 5
In summary, we utilize the method, resource, resource id, action and request body fields to mark all event types.
Aggregating logs
Merging logs from different services (e.g., compute, network, storage) is the main goal of this step. To this end, we first combine multiple log files and sort them based on timestamp. Next, we identify entries with the same timestamp (if any), and mark them specially to later identify that they occurred at the same time in different services (if that helps any log analysis mechanism). Also, we identify any duplicate entry in different logs (as mentioned in Section 3.1 that the same event might be logged in multiple services), and only keep the corresponding log to the actual user request.
For example, Stage 5 in Table 7 shows two entries each from the compute service (Nova) and network service (Neutron), respectively. The first row of the table is for the Create VM event, which is actually initiated by a cloud user. On the other hand, the Create port event is a system-initiated event as a result of the user request. In other words, OpenStack creates a port by itself while creating a VM.
Showing part of multiple log entries in compute and network services referring to one user request (create VM)
Our log processor provides outputs as sequences of events. In this work, we mainly observe the following three requirements for identifying events sequences. First, we preserve all transitions that are present in the actual logs. Second, we maintain the relative order between events. Third, in each sequence, we avoid cycles (by starting a new sequence when there is repetition) to facilitate capturing relationships between events (e.g., dependencies in our model), flowing from top to bottom. To validate our approach, we use the generated events sequences to build a Bayesian Network and to perform sequence pattern mining in Sections 4 and 7.2, respectively.
To generate the final output (i.e., sequences of events), the log processor performs the following steps:
Read event types sorted by timestamp in the Aggregated Logs, and group event types in a sequence till any event type is observed for the second time. In other words, a sequence contains all event types from to , where the (the successor of ) has already been observed in the sequence . Thus, no sequence contains any repeated event types and hence, we avoid cycles in sequences.
Start the next sequence from the last element of the previous sequence so that all transitions within the sequences are preserved. In other words, the following sequence starts with the , which is the last event of the sequence.
In summary, our log processing approach addresses all challenges discussed in Section 3.2. As an example, it provides sequences of events as shown in Table 8. Later, these sequences will be utilized by our learning system to learn the dependency model presented in next section. The implementation details including the algorithms for our log processing are presented in Section 6.3. Also, the performance evaluation of our log processor is shown in Section 7.2.
learning system
This section first describes the dependency model and then presents the steps to learn probabilistic dependencies for this model.
The dependency model
We first demonstrate our dependency model through an example and then formally define the model. The model will be the foundation of our proactive auditing solution (detailed in Section 5).
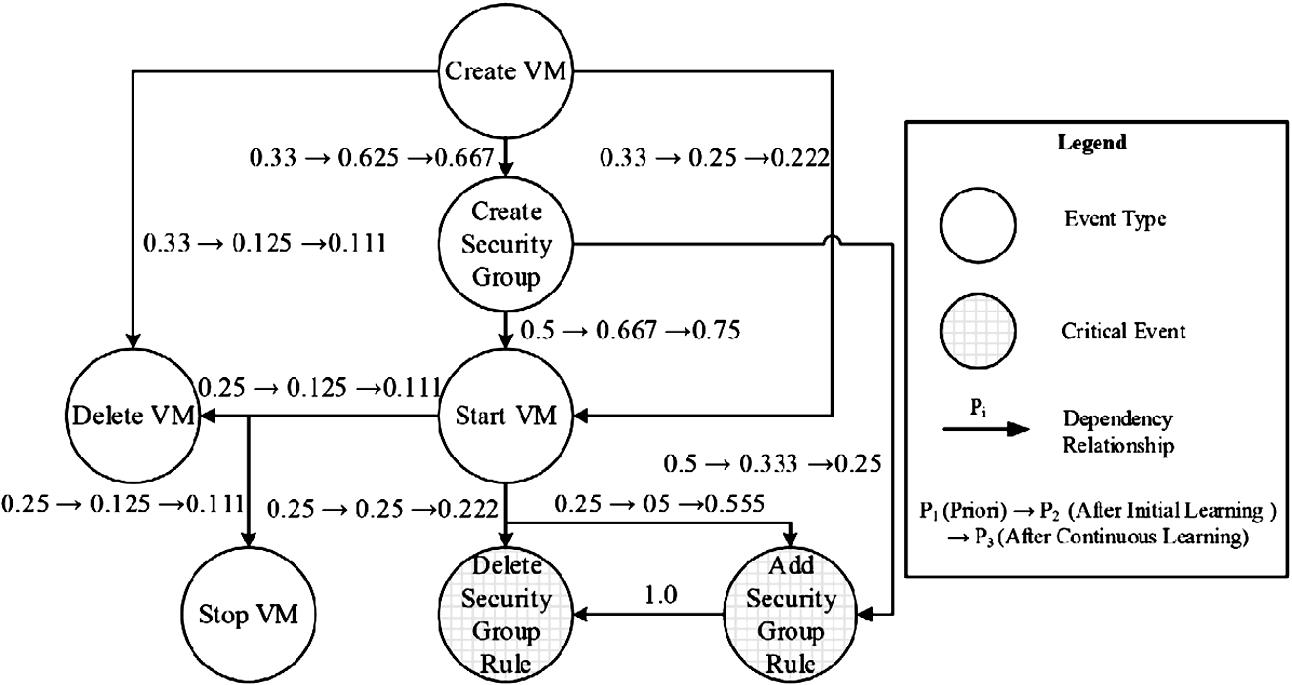
Figure 9 shows an example of a dependency model, where nodes represent different event types in a cloud and edges represent transitions between event types. For example, nodes create VM and create security group represent the corresponding event types, and the edge from create VM to create security group indicates the likely order of occurrence of those event types. The label of this edge, 0.625, means 62.5% of the times an instance of the create VM event type will be immediately followed by an instance of the create security group event type.
An example dependency model represented as a Bayesian network.
Our objective is to automatically construct such a model from logs in clouds. As an example, the following shows an excerpt of the event types event-type and historical event sequences hist for four days related to the running example of Section 2.2.
- = {create VM (CV), create security group (CSG), start VM (SV), delete security group rule (DSG)}; and
= {: , , ; : , ; : , ; : , }, where the order of event instances in a sequence indicates the actual order of occurrences.
The dependency model shown in Fig. 9 may be extracted from such data (note above we only show an excerpt of the data needed to construct the complete model, due to space limitations). For instance, in , has three immediate successors (i.e., , , ), and their probabilities can be calculated as , and .
As demonstrated in the above example, Bayesian network [67] suits our needs for capturing probabilistic patterns of dependencies between events types. A Bayesian network is a probabilistic graphical model that represents a set of random variables as nodes and their conditional dependencies in the form of a directed acyclic graph. We choose Bayesian network to represent our dependency model for the following reasons. Firstly, the event types in cloud and their precedence dependencies can naturally be represented as nodes (random variables) and edges (conditional dependencies) of a Bayesian network. Secondly, the need of our approach for learning the conditional dependencies can be easily implemented as parameter learning in Bayesian network. For instance, in Fig. 9, using the Bayes’ theorem we can calculate the probability for an instance of add security group rule to occur after observing an instance of create VM to be 0.52. More formally, the following defines our dependency model.
Given a list of event types - and the log of historical events , the dependency model is defined as a Bayesian network , where G is a DAG in which each node corresponds to an event type in -, and each directed edge between two nodes indicates the first node would immediately precede the other in some event sequences in whose probability is part of the list of parameters θ.
We say a dependency exists between any two event types if their corresponding nodes are connected by an edge in the dependency model, and we say they are not dependent, otherwise. We assume a subset of the leaf nodes in the dependency model is given as critical events that might breach some given security properties. The dependency models are built for each tenant. Furthermore, any disjoint sequences of events (i.e., output from Section 3.3.6) result a separate dependency model, because a disjoint sequence refers to a group of events which are independent from the events in the other model. Note that we currently rely on a manual effort to identify the structure of the model from these sequences.
Learning engine
The next step is to learn the probabilistic dependency model from the sequences of event instances in the processed logs. To this end, we choose the parameter learning technique in Bayesian network [28,55,67] (this choice has been justified in Section 4.1). We now first demonstrate the learning steps through an example, and then provide further details.
Figure 10 shows the dependency model of Fig. 9 with the outcomes of different learning steps as the labels of edges. The first learning step is to define the priori, where the nodes represent the set of event types received as input, and the edges represent possible transitions from an event type, e.g., from create VM to delete VM, start VM and create security group. Then, , , and other conditional probabilities (between immediately adjacent nodes in the model) are the parameters; all parameters are initialized with equal probabilities. For instance, we use 0.33 to label each of the three outgoing edges from the create VM node. The second learning step is to use the historical data to train the model. For instance, the second values in the labels of the edges of Fig. 10 are learned from the processed logs obtained from the log processor. The third values in the labels of Fig. 10 represent an incremental update of the learned model using the feedback from a sequence of runtime events.
This learning mechanism mainly takes two inputs: the structure of the model with its parameters, and the historical data. The structure of the model, meaning the nodes and edges in a Bayesian network, is first derived from the set of event types received as input. To this end, we provide a guideline on identifying such a set of event types in Section 8. Initially, the system considers every possible edge between nodes (and eventually deletes the edges with probability 0), and conditional probabilities between immediately adjacent nodes (measured as the conditional probability) are chosen as the parameters of the model. We further sparse the structure into smaller groups based on different security properties (the structure in Fig. 10 is one of the examples). The processed logs containing sequences of event instances serve as the input data to the learning engine for learning the parameters. Finally, the parameter learning in Bayesian network is performed as follows: i) defining a priori (with the structure and initialized parameters of the model), ii) training the initial model based on the historical data, and iii) continuously updating the learned model based on incremental feedbacks.
The outcomes of three learning steps for the dependency model.
proactive verification system
This section presents our learning-based proactive verification system.
Likelihood evaluator
The likelihood evaluator is mainly responsible for triggering the pre-computation. To this end, the evaluator first takes the learned dependency model as input, and derives offline all indirect dependency relationships for each node. Based on these dependency relationships, the evaluator identifies the event types for which an immediate pre-computation is required. Additionally, at runtime the evaluator matches the intercepted event instance with the event type, and decides whether to trigger a pre-computation or verification request.4
This is not to respond to the event as in incident response, but to prepare for the auditing, and the incident response following an auditing result is out of the scope of this paper.
The data manipulated by the likelihood evaluator based on the dependency model will be described using the following example.
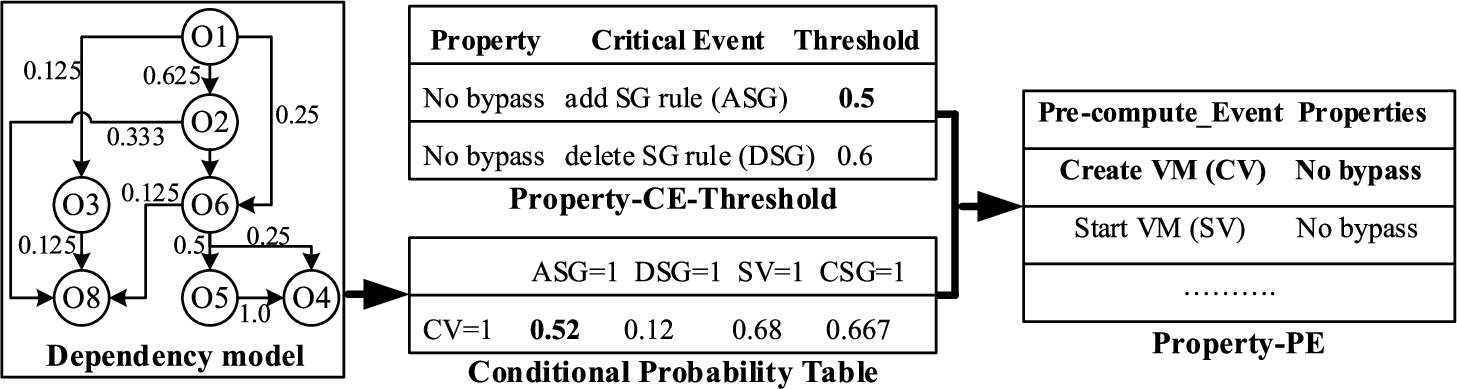
An excerpt of the likelihood evaluator steps and their outputs.
Figure 11 shows an excerpt of the steps and their outputs in the likelihood evaluator module. In this figure, the Property-CE-Threshold table maps the no bypass of security group property [11] with its critical events (i.e., add security group rule and delete security group rule) and corresponding thresholds (i.e., 0.5 and 0.6). Then, from the conditional probability in the model, the evaluator infers conditional probabilities of all possible successors (both direct and indirect), and stores them in the Conditional-Probability table. The conditional probability for ASG having CV (P(ASG/CV)) is 0.52 in the Conditional-Probability table in Fig. 11. Next, this value is compared with the thresholds of the no bypass property in the Property-CE-thresholds table. As the reported probability is higher, the CV event type is stored in the Property-PE table so that for the next CV event instance, the evaluator triggers a pre-computation.
Pre-computing module
The purpose of the pre-computing module is to prepare the ground for the runtime verification. In this paper, we mainly discuss watchlist-based pre-computation [47]; where watchlist is a list containing all allowed parameters for different security properties. Table 9 shows an excerpt of mapping between security properties and their corresponding watchlist contents. The specification of contents in a watchlist is defined by the cloud tenant, and is stored in the Property-WL table. We assume that at the time is launched, we initialize several tables based on the cloud context and tenant inputs. For instance, inputs including the list of security properties, their corresponding critical events, and the specification of contents in watchlists are first stored in the Property-WL and Property-CE-Threshold tables. The watchlists are also populated from the current cloud context. We maintain a watchlist for each security property. Afterwards, each time the pre-computation is triggered by the likelihood evaluator, this module incrementally updates the watchlist based on the changes applied to the cloud in the meantime. The main functionality of the pre-computing module is described using the following example.
A mapping between the security properties and their corresponding watchlist contents
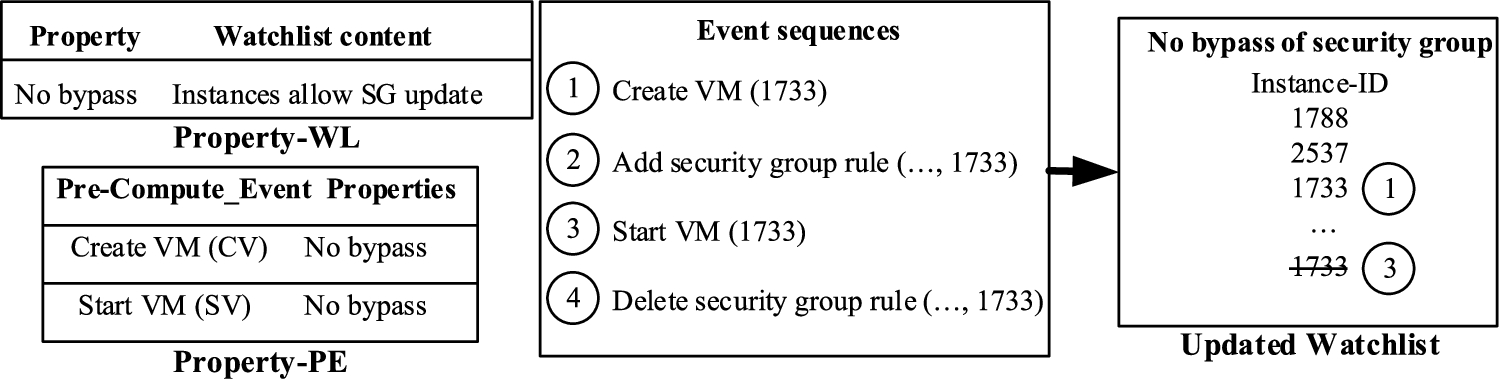
Showing steps of the updating watchlist for a sample event sequence.
Left side of Fig. 12 shows two inputs (Property-WL and Property-PE tables) to the pre-computing module. We now simulate a sequence of intercepted events (shown in the middle box of the figure) and depict the evolution of a watchlist for the no bypass property (right side box of the figure). (1) We intercept the create VM 1733 event instance, identify the event in the Property-PE table, and add VM 1733 to the watchlist without blocking it. (2) After intercepting the add security group rule (..., 1733) event instance, we identify that this is a critical event. Therefore, we verify with the watchlist keeping the operation blocked, find that VM 1733 is in the watchlist, and hence we recommend to allow this operation. (3) We intercept start VM 1733 operation and identify the event in the Property-PE. VM 1733 is then removed from the watchlist, as the VM is active. (4) After intercepting the delete security group rule (..., 1733) event instance, we identify that this is a critical event. Therefore, we verify with the watchlist keeping the event instance blocked, find that VM 1733 is not in the watchlist, and hence, identify the current situation as a violation of the no bypass property.
Feedback module
The main purposes of the feedback module are: i) to provide feedback to the learning engine, and ii) to provide feedback to the tenant on thresholds for different properties. These purposes are achieved by three steps: storing verification results in the repository, analyzing the results, and providing the necessary feedback to corresponding modules.
Firstly, the feedback module stores the verification results in the repository. Additionally, this module stores the verification result as hit or miss after each critical event, where the hit means the requested parameter is present in the watchlist (meaning no violation), and the miss means the requested parameter is not found in the watchlist (meaning a violation). Additionally, we store the sequence of events for a particular time period (e.g., one day) in a similar format as the processed log described in the learning module. In the next step, we analyze these results along with the models to prepare a feedback for different modules. From the sequence of events, the analyzer identifies whether the pattern is already observed or is a new trend, and accordingly updater prepares a feedback for the learning engine either to fine-tune the parameter or to capture a new trend. From the verification results, the analyzer counts the number of miss for different properties to provide a feedback to the user on their choice of thresholds (stored in the Property-CE-Threshold table) for different properties. For more frequently violated properties, the threshold might be set to a lower probability to trigger the pre-computation earlier.
Implementation
In this section, we detail the implementation and its integration into OpenStack along with the architecture of (Fig. 13) and a detailed algorithm (Algorithm 2).
Background
OpenStack [59] is an open-source cloud management platform that is being used almost in half of private clouds and significant portions of the public clouds (see [58] for detailed statistics). Neutron is its network component, Nova is its compute component, and Ceilometer is its telemetry for receiving event histories from other components. Each component of OpenStack generates notifications, which are triggered by predefined activities such as VM creation, security group addition, and are sent to Ceilometer for monitoring purposes. Ceilometer extracts the information from the notifications, and transforms them into events.
architecture
Figure 13 shows an architecture of . It has four main components: log processor, learning system, verification system and dashboard & reporting engine.
The first component, namely, the log processor, obtains sequences of events from the retrieved raw cloud logs. To this end, the parser module first processes the raw logs to retrieve identified fields in each log entry and systematically generates structured content stored as CSV files. Then, the filter module groups the log entries tenant-wise and separates log entries corresponding to the user initiated events. The interpreter module consults the mapping of URL paths and request body to identify the corresponding event type of a log entry. The merger module combines logs from different services (e.g., Neutron, Nova) of OpenStack. The sequence builder generates the sequences of events from the logs.
The second component, namely, the learning system, is responsible for learning the probabilistic dependencies using Bayesian network from the output of the log processing component. To this end, the appropriate input formats of the learning engine are obtained from the log processor. Then, the learning engine, which is a Bayesian network learning tool, learns the probabilistic dependencies from the sequences of events.
The third component, namely, the proactive verification system, incrementally prepares for the verification and verifies the preconditions of the security critical events that are about to occur. To this end, the likelihood evaluator consists of three modules. The interceptor intercepts runtime event instances, the event matcher obtains the event type of the intercepted event instances, and the critical event identifier detects the critical events from the intercepted event type. Triggered by the likelihood evaluator, the pre-computation manager is to initialize (by the initializer) and update (by updater) watchlists. leverages a proactive verification tool [47] to perform the runtime verification utilizing the pre-computed results. The feedback module is to analyze the previous verification results and to provide feedback to update the probabilities in the model.
The fourth component, namely, the dashboard & reporting engine, is to provide an interface to users to interact with the system and to observe different verification results.
An architecture of auditing system.
In the following, we describe the implementation details of different components of .
Log processor
The log processor first automatically collects logs from different OpenStack components, e.g., Nova, Neutron, Ceilometer, etc. We use Logstash [19], a popular open source data processing tool, for transforming un-structured and semi-structured logs into CSV format and available for further processing. To enable Logstash transformation, we use the parsing rules that we build for OpenStack logs in our case study. Afterwards, we implement filters in Python to group and eliminate log entries. Then, we build a mapping between URL paths with request body and event types, and consult this map to identify event type of each log entry. Next, we merge Neutron and Nova logs based on the timestamps while handling conflicting issues. For example, while a user requests to create a VM, the event (i.e., create port) happening at Neutron is done by the tenant-service, and is removed while dividing events into different tenant groups. Finally, to prepare the logs to be used in the learning system and for other log analysis purposes, we run a custom algorithm, which preserves all transitions in the actual logs, implemented in Python to identify sequences in combined logs.
Learning system
For learning, we leverage SMILE & GeNIe [5], which is a popular tool for modeling and learning with Bayesian network. SMILE & GeNIe uses the EM algorithm [15,41] for parameter learning. The learning module is responsible for preparing inputs to GeNIe, and conducting the learning process using GeNIe. The sequences obtained from the log processor are further processed to convert them into the input format (in.dat) of GeNIe. Additionally, the structure of the Bayesian network and its parameters are provided to GeNIe. Furthermore, we choose the uniform option, where the assumption is that all parameters in the network form the uniform distribution with confidence is equal to one. Finally, GeNIe provides an estimation of the parameters, which are basically probabilities of different transitions in the dependency model. Additionally, to execute sequence pattern mining algorithms with log processor outputs, we leverage SPMF [21], which is a popular open source data mining library. The Learn procedure in Algorithm 2 implements the learning steps of .
Proactive verification system
We intercept requests made to the Nova service as they are passed through the Nova pipeline, having the middleware inserted in the pipeline. The body of requests, contained in the wsgi.input attribute of the intercepted requests, is scrutinized to identify the type of requested events. Next, the pre-computing module stores the result of inspection in a MySQL database. The feedback module is implemented in Python. Those modules work together to support the methodology described in Section 5, as detailed in Algorithm 2.
Learning-based proactive verification (, , , )
Dashboard & reporting engine
users interact with the system through a dashboard, which is implemented using a web interface in PHP. Through this dashboard, users can enable proactive auditing so that starts intercepting cloud events and verify them. In the dashboard, tenant admins can initially select security properties from different standards (e.g., ISO 27017, CCM V3.0.1, NIST 800-53, etc.). Through the monitoring panel, continuously updates the summary of the verification results. Furthermore, the details of any violation with a list of evidence are also provided. Moreover, our reporting engine archives all the verification reports for a pre-defined period.
Experimental results
Our work focuses on making compliance auditing more practical in terms of reducing its response time, and thus our experiments are designed to evaluate the improvement in term of online response time and pre-computation effort using both synthetic and real data. In the following, we first describe the experiment settings, and then present experimental results with both synthetic and real data.
Experimental settings
Both experiments on log processor and proactive verification system involve datasets collected from our testbed and the real cloud. In the following, we describe both environmental settings.
Testbed Cloud Settings. Our testbed cloud is based on OpenStack version Mitaka. There are one controller node and up to 80 compute nodes, each having Intel i7 dual core CPU and 2 GB memory running Ubuntu 16.04 server. Based on a recent survey [58] on OpenStack, we simulate an environment with maximum 1,000 tenants and 100,000 VMs. We conduct the experiment for 10 different datasets varying the number of tenants from 100 to 1,000 while keeping the number of VMs fixed to 1,000 per tenant. For Bayesian network learning, we use GeNIe academic version 2.1. For sequential pattern mining, we use SPMF v.2.20. Table 10 describes the datasets for experiments on log processing. We repeat each experiment 100 times.
Number of events in both Neutron and Nova logs for different datasets generated in our testbed cloud
Dataset
Nova
Neutron
DS1
9,997
7,998
DS2
20,000
15,998
DS3
29,998
23,999
DS4
39,998
32,000
DS5
48,995
40,293
Real Cloud Settings. We further test using data collected from a real community cloud hosted at one of the largest telecommunications vendors. To this end, we analyze the management logs (sized more than 1.6 GB text-based logs) and extract 128,264 relevant log entries for the period of more than 500 days. As Ceilometer is not configured in this cloud, we utilize Nova and Neutron logs which increases the log processing efforts significantly.
Time (in seconds) required for different log processing steps: (a) parsing raw logs, (b) grouping log entries based on tenant IDs, and (c) interpreting event types, while varying the number of events provided in different datasets.
Results on log processor
In the following, we present obtained experiment results for our log processor both in testbed and real clouds.
Experiments with Testbed Cloud. The objective of the first set of the experiments is to measure the efficiency of our log processor for two different cloud services, e.g., compute (Nova) and network (Neutron). Figure 14(a) shows the time required (in seconds) to parse logs of different datasets. The results show that the parsing is the most time consuming step in log processing, as this step parses text-based logs and stores them into CSV files. The parsing of our largest dataset (DS5) requires around 3 minutes and around 2 minutes for Nova and Neutron logs, respectively. Figure 14(b) shows the time required (in seconds) to group the log entries based on tenant IDs and to eliminate system-initiated entries (from tenant-service). For the largest dataset of Nova, the required time remains within 80 milliseconds. Grouping Neutron logs, which is comparatively smaller in size, requires maximum 55 milliseconds. Figure 14(c) presents the results (in seconds) to interpret event types of all entries from the grouped logs for Nova and Neutron. The trend for both services shows almost a linear increase while varying the number of log entries. Interpreting event types for the largest dataset takes 16.72 seconds and 11.14 seconds for Nova and Neutron, respectively.
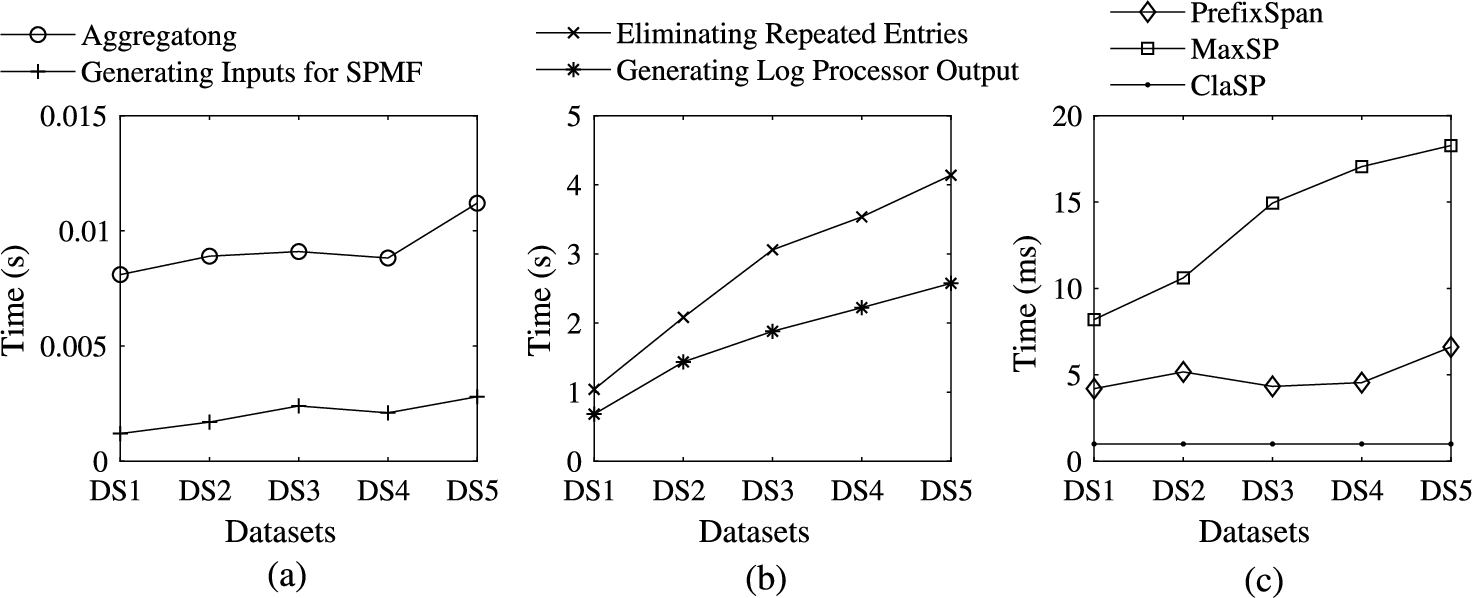
Time required (a) (in seconds) for merging nova_api and neutron_server logs, and generating inputs for the pattern mining library (SPMF) (b) (in seconds) for eliminating repeated entries and generating log processor output, and (c) (in milliseconds) for running PrefixSpan, MaxSP and ClaSP algorithms in the SPMF library.
The second set of experiments is to measure the efficiency of aggregating logs from different services and generating outputs by our log processor. Figure 15(a) shows the time in seconds to aggregate logs from Nova and Neutron, and to generate inputs to the sequence pattern mining algorithms implemented in the SPMF library [21]. The time to aggregate logs remains within 112 milliseconds for the largest dataset. The time for the input generation remains within two milliseconds for the largest dataset and shows a linear increase. Figure 15(b) depicts the time required for the steps, i.e., eliminating and counting repeated entries, identifying sequences as the outputs of the log processor, performed on the aggregated logs. In both steps, the larger datasets show less increase in the required time. The time required for identifying sequences remains within 2.6 seconds, and the eliminating repeated entries step takes maximum 4.2 seconds for our largest dataset.
Applying Alternative Learning Techniques. To demonstrate the applicability of our log processor, we further apply its outputs to run three popular sequence pattern mining (which is a data mining approach with broad range of applications) algorithms. Specifically, we first run the PrefixSpan [68] algorithm, which mines the complete set of patterns. One potential application could be to identify structures of dependencies among cloud events using this algorithm to further enhance the proactive security solutions. Second, we execute the MaxSP [22] algorithm, which mines maximal sequential patterns. Using this algorithm, we can easily identify the most common patterns which potentially can facilitate anomaly-based security solutions. Third, we run the ClaSP [23] algorithm, which identifies the largest pattern with a minimum frequency. This algorithm might be useful to identify unique patterns to profile a security violation or a legitimate use. To this end, we generate inputs to SPMF, which is a sequence pattern mining tool, and report the input generation time in Fig. 15(b). We also report the efficiency results to run these algorithms with the outputs of our log processor in Fig. 15(c). We observe constant time (one millisecond) while running ClaSP algorithm for different datasets. The MaxSP and PrefixSpan algorithms take around 18 milliseconds and 6.5 milliseconds, respectively, for our largest dataset.
Experiments with Real Cloud. The main objective of this part of the experiments is to evaluate the applicability of our log processor in a real cloud environment. Table 11 shows the summary of the results that we obtain for the real data. Due to the much larger size (e.g., 1.6 GB text-based logs) of the real-life logs, the parsing time is quite long (4 hours and 40 minutes). However, once is active, it may potentially log intercepted events in an incremented manner to avoid the delays at the parsing step. After parsing, we eliminate the log entries related to listing resources and their details, as the corresponding events to these entries are beyond our interest. The time for the remaining steps is quite similar to what is measured for our testbed cloud logs with much smaller size of logs. Note that the grouping step is not measured for Neutron, as the tenant ID is missing in the Neutron logs collected from the real cloud (as discussed in Section 3.1). However, we group them arbitrarily to measure the time for next steps. From the results of the real data, our observation is that our log processor is scalable once the parsing step is performed; which possibly allows our approach to process huge logs in a reasonable time.
Summary of the experimental results with real data for Nova and Neutron services. The steps parsing, merging and generating sequences are performed together for both services. Note that the grouping step is not measured for Neutron, as the tenant ID is missing in the Neutron logs collected from the real cloud
Services
# of Log Entries
Parsing
Grouping
Interpretation
Merging
Generating Sequences
Nova
1,450,011
4h 40m
0.0777 s
99.271 s
0.02206 s
1.4483 s
Neutron
3,992,644
–
51.820 s
Results on proactive verification system
In the following, we discuss the obtained experimental results for our proactive verification system both in testbed and real clouds.
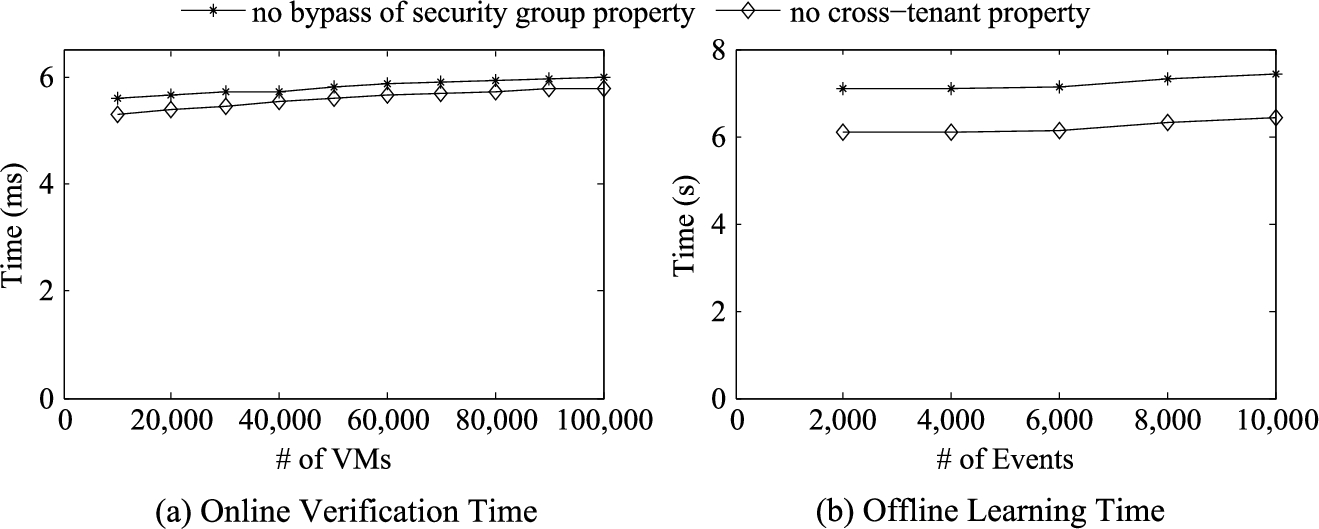
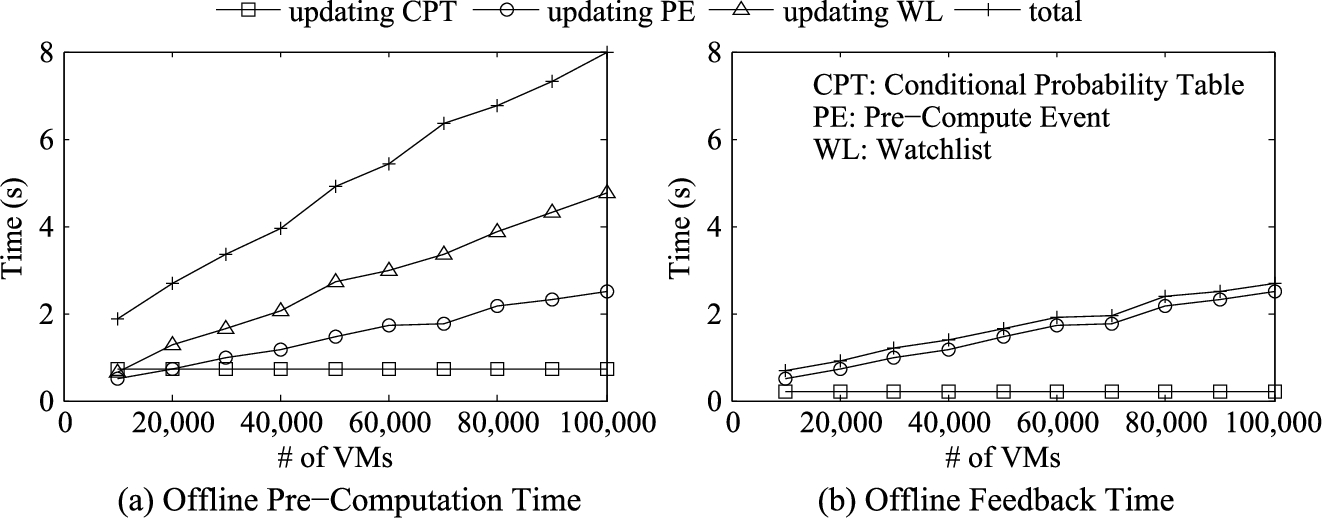
Experiments with Testbed Cloud. The objective of the first set of experiments with our proactive verification system is to demonstrate the time efficiency. Figure 16(a) shows the time in milliseconds required by to verify the no bypass of security group [11] and no cross-tenant port [33] properties. Our experiment shows the time for both properties remains almost the same for different datasets, because most operations during this step are database queries; SQL queries for our different datasets almost take the same time. Figure 16(b) shows the time (in seconds) required by GeNIe to learn the model while we vary the number of events from 2,000 to 10,000. In Fig. 17(a), we measure the time required for different steps of the offline pre-computing for the no bypass property. The total time (including the time of incrementally updating WL and updating PE) required for the largest dataset is about eight seconds which justifies performing the pre-computation proactively. A one-time initialization of pre-computation is performed in 50 seconds for the largest dataset. Figure 17(b) shows the time in seconds required to update the model and to update the list of pre-compute events. In total, requires less than 3.5 seconds for this step.
Showing time required for the (a) online runtime verification by varying the number of VMs and (b) offline learning process by varying the number of event instances in the logs for the no bypass and no cross-tenant properties. The verification time includes the time to perform interception, matching of event type and checking in the watchlist.
Showing time required in seconds for the (a) pre-computation and (b) feedback modules considering the no bypass property by varying the number of instances.
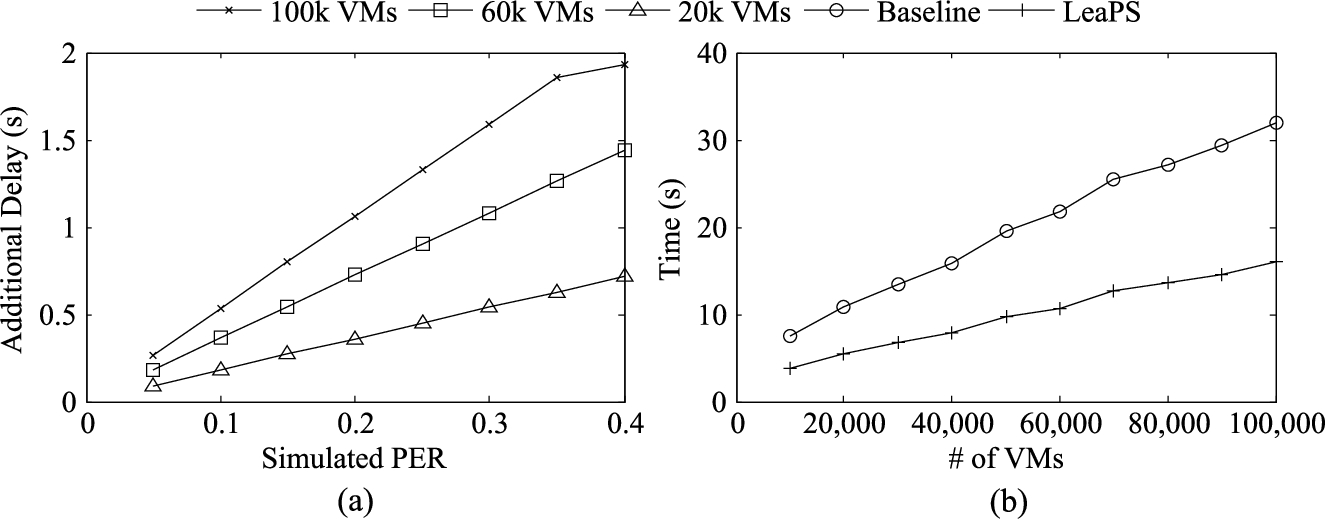
In the second set of experiments, we demonstrate how much may be affected by a wrong prediction resulted from inaccurate learning. For this experiment, we simulate different prediction error rates (PER) of a learning engine ranging from 0 to 0.4 on the likelihood evaluator procedure in Algorithm 2. Figure 18(a) shows in seconds the additional delay in the pre-computation caused by the different PER of a learning engine for three different number of VMs. Note that, the pre-computation in is an offline step. The delay caused by 40% PER for up to 100k VMs remains under two seconds, which is still acceptable for most applications.
(a) The additional delay (in seconds) in pre-computation time caused by different simulated prediction error rates (PER) of a learning tool, (b) the comparison (in seconds) between and a baseline approach.
In the final set of experiments, we compare with a baseline approach (similar to [47]), where all possible paths are considered with equal weight, and number of steps in the model is the deciding factor for the pre-computation. Figure 18(b) shows the pre-computation time for both approaches in the average case, and performs about 50% faster than the baseline approach (the main reason is that, in contrast to the baseline, avoids the pre-computation for half of the critical events on average by leveraging the probabilistic dependency model). For this experiment, we choose the threshold, N-th (an input to the baseline), as two, and the number of security properties as four. Increasing both the value of N-th and the number of properties increase the pre-computation overhead for the baseline. Note that a longer pre-computation time eventually affects the response time of a proactive auditing.
Experiments with Real Cloud. Table 12 summarizes the obtained results. We first measure the time efficiency of . Note that the results obtained are shorter due to the smaller size of the community cloud compared to our much larger simulated environment. Furthermore, we measure the prediction error rate (PER) of the learning tool using another dataset (for 5 days) of this cloud. For the 3.4% of PER, affects maximum 9.62 ms additional delay in its pre-computation for the measured properties.
Summary of the experimental results with real data. The reported delay is in the pre-computation of due to the prediction error (PER) of the learning engine
Properties
Learning
Pre-Compute
Feedback
Verification
PER
Delay*
No bypass
7.2 s
424 ms
327 ms
5.2 ms
0.034
9.62 ms
No cross-tenant
5.97 s
419 ms
315 ms
5 ms
0.034
9.513 ms
Mapping event APIs from different cloud platforms to event types
Adapting to Other Cloud Platforms. is designed to work with most popular cloud platforms (e.g., OpenStack [59], Amazon EC2 [3], Google GCP [24] and Microsoft Azure [53]) with a one-time effort for implementing a platform-specific interface. More specifically, interacts with the cloud platform (e.g., while collecting logs and intercepting runtime events) through two modules: log processor and interceptor. These two modules require to interpret implementation specific event instances and intercept runtime events. First, to interpret platform-specific event instances to generic event types, we currently maintain a mapping of the APIs from different platforms. Table 13 enlists some examples of such mappings. Second, the interception mechanism may require to be implemented for each cloud platform. In OpenStack, we leverage WSGI middleware to intercept and enforce the proactive auditing results so that compliance can be preserved. Through our preliminary study, we identify that almost all major platforms provide an option to intercept cloud events. In Amazon using AWS Lambda functions, developers can write their own code to intercept and monitor events. Google GCP introduces GCP Metrics to configure charting or alerting different critical situations. Our understanding is that can be integrated to GCP as one of the metrics similarly as the dos_intercept_count metric, which intends to prevent DoS attacks. The Azure Event Grid is event managing service from Azure to monitor and control event routing which is quite similar as our interception mechanism. Therefore, we believe that can be an extension of the Azure Event Grid to proactively audit cloud events. Table 14 summarizes the interception support in these cloud platforms. The rest modules of deal with the platform-independent data, and hence, the next steps in are platform-agnostic.
Interception supports to adopt in major cloud platforms
Effects of Tampered or Encrypted Log Entries. The log processor module of currently assumes that the integrity of the logs is preserved, and no contents of the logs are encrypted or obfuscated. If there is any incident of missing entries (i.e., an event occurrence is not logged) or mistakenly added entries (i.e., unsuccessful occurrence of an event), our log processor cannot detect such incidents. As a result, our learning phase will be affected by these unwanted incidents. The scale of the effect will mainly depend on the number of such incidents. Also, our log processor cannot handle the encryption of log contents, as it affects the integrity of the logs.
Effects of False Positives in the Learning Technique. leverages learning techniques in a different manner so that the false positive/negative rates cannot affect the security of our system directly, and rather affects the performance of our system. In , learning parameters of Bayesian network is utilized to learn the probabilistic dependencies. Any error in learning results a dependency model with incorrect probabilities. Later, while consulting this dependency model by the pre-computation module (as described in Section 5.2), may choose wrong highly-likely events and perform unnecessary pre-computation for them. At the same time, may delay the pre-computation for actual highly-likely events. The final result of such mistakes in due to the false positives/negatives in the learning tool is the increase in the response time (as reported in Fig. 18).
Possibility of a DoS Attack against. To exploit the fact that a wrong prediction may result in a delay in the pre-computation, an attacker may conduct a DoS attack to bias the learning model step by generating fake events and hence to exhaust pre-computation. However, Fig. 18(a) shows that an attacker requires to inject a significantly large amount (e.g., 40% error rate) of biased event instances to cause a delay of two seconds. Moreover, biasing the model is non-trivial unless the attacker has prior knowledge of patterns of legitimate event sequences. Our future work will further investigate this possibility and its countermeasures.
Granularity of Learning. The above-mentioned learning can be performed at different levels (e.g., cloud level, tenant level and user level). The cloud level learning captures business nature only for companies using a private cloud. The tenant level learning depicts a better profile of each business or tenant. This level of learning is mainly suitable for companies following process management strictly where users mainly follow the steps of processes. In contrast, the user level learning is suitable for smaller organizations (where no process management is followed) with fewer users (e.g., admins) who perform cloud events. Conversely, if a company follows process management, user level learning will be less useful, as different users would exhibit very similar patterns.
Reliance on Tenant Inputs. heavily depends on several inputs from tenant admins or security experts. The two main inputs are the critical event lists and specification (e.g., content) of the watchlists. In case of failure in the correct identification of a critical event, our solution may fail to detect a violation, because our final verification steps (e.g., searching in the watchlist and enforcing policies) are triggered by a critical event.
To help tenant admins or security experts in identifying critical events, we provide a guideline on identifying lists of critical events in the following. i) based on the property definition, the involved cloud components should be identified; ii) all event types in a cloud platform involving those components are enlisted; and iii) the critical events (which is already provided by the tenant) from the list are further shortlisted based on the attack scenario.
Selecting Watchlist Content for a New Property. In Table 9, we present an excerpt of mapping between security properties and their corresponding watchlist content. In the following, we provide a simple guideline for the tenant admins or security experts. i) from the property definition, the asset to keep safe is identified; ii) the objectives of a security property are to be highlighted; and iii) from the attack scenario, the parameters for the watchlist for each critical event are selected.
Tackling Single-Step Violation. The proactive auditing mechanisms fundamentally leverage the dependency in a sequence of events. In other words, proactive security auditing is mainly to detect those violations which involve multiple steps. However, there might be violations of the considered security properties with a single step. Such violations cannot be detected by the traditional steps of proactive auditing with the same response time as reported in Fig. 16(a), and may be detected by performing all steps at a single point in several seconds (e.g., around six seconds for a decent-sized cloud with 60,000 VMs as shown in Fig. 17(a)); which is still faster than any other existing works (which respond in minutes). However, this response time might not be very practical. To reduce the response time or at least not to cause any significant delay, we perform a preliminary study as follows. Our initial results conducted in the testbed cloud show that OpenStack takes more than six seconds to perform almost all user requests; which implies the possibility of not resulting in any additional delay by even for a single-step violation. Additionally, During our case studies, we observed that OpenStack performs several internal tasks to complete a user request. We may leverage this sequence of system events corresponding to a single user request to proactively perform steps. We elaborate those two ways of tackling single-step violations in our future work.
Correctness of Proactive Auditing Algorithms. This work mainly focuses on the automation of log processing and learning the dependencies; which eventually helps the proactive security auditing. For proactive verification, we rely on the verification methods proposed in PVSC [47], Madi et al. [46] and Majumdar et al. [49]; basis of which is well-known formal verification method, constraint satisfaction problem (CSP). The correctness of our auditing algorithm mainly depends on the correctness of this formal verification method as given in [14,76]. In addition, we plan to adapt unit-testing based approaches to ensure the correct adoption of formal verification methods in our system in the future.
Supporting Security Properties. Our proposed proactive auditing system, , supports a wide-range of security properties covering different layers, such as identity access management and virtual infrastructure levels, of the cloud. These properties are mainly extracted from different cloud-specific standards (e.g., [11,33,57]), literature and real-world vulnerabilities. A sample list of such security properties is shown in Table 9, and the detailed description of these properties are provided in our previous works (e.g., [46] and [49]). The expressiveness of the supported properties is similar as that of the first order logic, since our auditing system is leveraging constraint satisfaction problem or similar first order logic based formal verification methods (as mentioned earlier).
The Concept of Proactive Security Auditing for Clouds. The concept of proactive security auditing for clouds is different than the traditional security auditing concept. Apart from ours, proactive security auditing for clouds is also proposed in [9]. Additionally, the Cloud Security Alliance (CSA) recommends continuous auditing as the highest level of auditing [12], from which our work is inspired. The current proactive and runtime auditing mechanisms are more of a combination of traditional auditing and incident management. For example, in , we learn from incidents and intercepted events to process or detect in a similar manner as a traditional incident management system. At the same time, verifies and enforces compliance against different security properties, which are mostly taken from different security standards, and provide detailed evidence for any violation through dashboard. Therefore, the concept of proactive security auditing is a combination of incident management and security auditing.
Comparing existing solutions with . The symbols (∙), (-) and N/A mean supported, not supported and not applicable, respectively
Table 15 summarizes the comparison between existing works and . The first and second columns enlist existing works and their verification methods. The next two columns compare the coverage such as supported environment (cloud or non-cloud) and main objectives (auditing or anomaly detection). The next six columns compare these works according to different features. The proactive feature is checked when a solution supports proactive verification. When a solution offers an automated dependency learning, we check the automatic feature. We mark this feature as ‘N/A’ for the works which do not involve any dependencies. The dynamic feature refers to the dynamic and runtime pattern capturing. The probabilistic feature is marked when a work involves non-deterministic or probabilistic dependencies. For non-dependency-model-based works, we put ‘N/A’. The expressive feature is checked for the works which utilize well-known expressive policy languages (e.g., first order logic) to express security properties. By the self-reliant feature, we mean the works which only depend on the user-provided security properties for the accuracy of the verification. In the last four columns of the table, we compare the works based on their supporting cloud platforms. The adaptable field is checked for those works which support multiple cloud platforms or describe how their works can be ported to other platforms.
In summary, mainly differs from the state-of-the-art works as follows. Firstly, is the first proactive auditing approach which captures the dependency automatically from the patterns of event sequences. Secondly, is the only learning-based work which aims at improving proactive auditing and not (directly) at anomaly detection. Thirdly, the dynamic dependency model allows to evolve over time to adapt to new trends. Finally, the methodology is cloud-platform agnostic. However, there are still few limitations in . is less expressive than other general purpose formal verification approaches; which can be overcome by adapting those formal approaches in as discussed in Section 8. Also, relies on a complete list of critical events provided by tenant admins or security experts to provide 100% accuracy.
Retroactive and Intercept-and-Check Auditing. Retroactive auditing approach (e.g., [17,46,49,80,83,84] in the cloud is a traditional way to verify the compliance of different components of a cloud. Unlike our proposal, those approaches can detect violations only after they occur, which may expose the system to high risks. Existing intercept-and-check approaches (e.g., [9,61]) perform major verification tasks while holding the event instances blocked, and usually cause significant delay to a user request. Unlike those works, provides a proactive auditing approach.
Proactive Auditing. Proactive security analysis in the cloud is comparatively a new domain with fewer works (e.g., [9,47,87]). Weatherman [9] verifies security policies on a future change plan in a virtualized infrastructure using the graph-based model proposed in [7,8]. PVSC [47] proactively verifies security compliance by utilizing the static patterns in dependency models. Both in Weatherman and PVSC, models are captured manually by expert knowledge. In contrast, this work adopts a learning-based approach to automatically derive the dependency model. Congress [61] is an OpenStack project offering similar features as Weatherman. Foley et al. [20] propose an algebra for anomaly-free firewall policies for OpenStack. Many state-based formal models (e.g., [18,43,44,75]) are proposed for program monitoring. Our work further expands the proactive monitoring approach to cloud differing in scope and methodology.
Learning-based Detections. There are many learning-based security solutions (e.g., [26,29,30,35,51,54,77]), which offer anomaly detection. Unlike above-mentioned works, this paper proposes a totally different learning-based technique to facilitate the proactive auditing.
Log Processing in Clouds. There exist several works (e.g., [4,25,45,52,88]) on log processing in clouds. Lin et al. [45] leverage the big data analytics, Hadoop, and in-memory computing capacity of Spark, to propose a cloud platform which can efficiently process and analyze logs in batches. Similarly, Yu et al. [88] leverage cloud computing and distributed big data analytics to process large amounts of logs. Unlike those works, we focus more on processing logs retrieved from OpenStack clouds. However, leveraging such big data analytics and memory-efficient methods may enhance the performance of our log processing. Sahara [52] offers a real-time log analysis using Spark. Right after each log entry is created, it is fed into Sahara, parsed into separate fields, stored and visualized at an HTTP endpoint. Although Sahara’s methodology on real-time analysis can inspire our future attempt on this matter, Sahara currently does not offer next stages (e.g., identifying event types and their sequences) of our log processing. Additionally, Amazon CloudWatch [4] and Google Cloud Dataflow [25] perform advanced real-time analysis provided for troubleshooting of systems by other existing technologies. Unlike those works, we focus more on identifying event types and their sequences in logs to facilitate various learning techniques for analysis.
Conclusion
In this paper, we proposed an automatic learning-based proactive security auditing system, , which completes a mandatory pre-requisite step (e.g., log processing) and addresses the limitations of existing proactive solutions (by automating the dependency learning). To this end, we first conducted a case study on real-world cloud logs and highlighted the challenges in processing such logs. Then, we designed and implemented a log processing approach for OpenStack to feed its outputs to the learning tools to capture dependencies. Afterwards, we leveraged learning techniques (e.g., Bayesian network) to learn probabilistic dependencies for the dependency model. Finally, using such dependency models, we perform proactive security auditing. Our proposed solution is integrated to OpenStack, a popular cloud management platform. The results of our extensive experiments with both real and synthetic data show that can be very scalable for a decent-size cloud (e.g., 6 ms to audit a cloud of 100,000 VMs) and a significant improvement (e.g., about 50% faster) over existing proactive approaches. In addition, we demonstrated that other learning techniques such as sequence pattern mining algorithms can be executed on the outputs of our log processor efficiently (e.g., 18 ms to find frequencies of all possible patterns using PrefixSpan). As future work, we will investigate the feasibility of applying runtime data streaming to process logs incrementally and in a more scalable manner. We also intend to conduct case studies on logging of other cloud platforms to offer a platform-agnostic log processing solution, which might be very useful for -like security solutions.
Footnotes
Acknowledgments
The authors thank the anonymous reviewers for their valuable comments. This work is partially supported by the Natural Sciences and Engineering Research Council of Canada and Ericsson Canada under CRD Grant N01823 and by PROMPT Quebec.
References
1.
R.Agrawal, R.Srikantet al., Fast algorithms for mining association rules, in: Proc. 20th Int. Conf. Very Large Data Bases, VLDB, Vol. 1215, 1994, pp. 487–499.
2.
C.S.Alliance, Security Guidance for Critical Areas of Focus in Cloud Computing, Vol. 3, 2011.
M.Bellare and B.Yee, Forward integrity for secure audit logs, Technical Report, Citeseer, 1997.
7.
S.Bleikertz, T.Groß, M.Schunter and K.Eriksson, Automated information flow analysis of virtualized infrastructures, in: European Symposium on Research in Computer Security (ESORICS), Springer, 2011, pp. 392–415.
8.
S.Bleikertz, C.Vogel and T.Groß, Cloud Radar: Near real-time detection of security failures in dynamic virtualized infrastructures, in: Proceedings of the 30th Annual Computer Security Applications Conference (ACSAC), ACM, 2014, pp. 26–35.
9.
S.Bleikertz, C.Vogel, T.Groß and S.Mödersheim, Proactive security analysis of changes in virtualized infrastructures, in: Proceedings of the 31st Annual Computer Security Applications Conference (ACSAC), ACM, 2015, pp. 51–60.
J.Davies, Specification and Proof in Real Time CSP, Vol. 6, Cambridge University Press, 1993.
15.
A.P.Dempster, N.M.Laird and D.B.Rubin, Maximum likelihood from incomplete data via the EM algorithm, Journal of the Royal Statistical Society. Series B (Methodological) (1977), 1–38. doi:10.1111/j.2517-6161.1977.tb01600.x.
F.Doelitzscher, C.Fischer, D.Moskal, C.Reich, M.Knahl and N.Clarke, Validating cloud infrastructure changes by cloud audits, in: Eighth World Congress on Services (SERVICES), IEEE, 2012, pp. 377–384.
18.
E.Dolzhenko, J.Ligatti and S.Reddy, Modeling runtime enforcement with mandatory results automata, International Journal of Information Security14(1) (2015), 47–60. doi:10.1007/s10207-014-0239-8.
P.Fournier-Viger, C.-W.Wu and V.S.Tseng, Mining maximal sequential patterns without candidate maintenance, in: International Conference on Advanced Data Mining and Applications, Springer, 2013, pp. 169–180. doi:10.1007/978-3-642-53914-5_15.
23.
A.Gomariz, M.Campos, R.Marin and B.Goethals, ClaSP: An efficient algorithm for mining frequent closed sequences, in: Pacific-Asia Conference on Knowledge Discovery and Data Mining, Springer, 2013, pp. 50–61. doi:10.1007/978-3-642-37453-1_5.
S.Guha, Attack detection for cyber systems and probabilistic state estimation in partially observable cyber environments, PhD thesis, Arizona State University, 2016.
27.
S.Hagen, M.Seibold and A.Kemper, Efficient verification of IT change operations or: How we could have prevented Amazon’s cloud outage, in: Network Operations and Management Symposium (NOMS), IEEE, 2012, pp. 368–376.
28.
D.Heckerman, A tutorial on learning with Bayesian networks, in: Learning in Graphical Models, Springer, 1998, pp. 301–354. doi:10.1007/978-94-011-5014-9_11.
29.
R.A.Hemmat and A.Hafid, SLA violation prediction in cloud computing: A machine learning perspective, Technical Report, Université de Montréal, 2016.
30.
H.Holm, K.Shahzad, M.Buschle and M.Ekstedt, CySeMoL: Predictive, probabilistic cyber security modeling language, IEEE Transactions on Dependable and Secure Computing12(6) (2015), 626–639. doi:10.1109/TDSC.2014.2382574.
31.
A.S.Ibrahim, J.Hamlyn-Harris, J.Grundy and M.Almorsy, CloudSec: A security monitoring appliance for virtual machines in the IaaS cloud model, in: 5th International Conference on Network and System Security (NSS), IEEE, 2011, pp. 113–120.
32.
Z.Ismail, C.Kiennert, J.Leneutre and L.Chen, Auditing a cloud provider’s compliance with data backup requirements: A game theoretical analysis, IEEE Transactions on Information Forensics and Security11(8) (2016), 1685–1699. doi:10.1109/TIFS.2016.2549002.
33.
ISO Std IEC, ISO 27017, Information technology – Security techniques – Code of practice for information security controls based on ISO/IEC 27002 for cloud services (DRAFT) (2012), Available at: http://www.iso27001security.com/html/27017.html.
34.
ISO Std IEC, ISO 27002: 2005, Information technology-security techniques – Code of practice for information security management. ISO (2005).
35.
Y.Jiang, E.Z.Zhang, K.Tian, F.Mao, M.Gethers, X.Shen and Y.Gao, Exploiting statistical correlations for proactive prediction of program behaviors, in: Proceedings of the 8th Annual IEEE/ACM International Symposium on Code Generation and Optimization, ACM, 2010, pp. 248–256.
36.
H.Kai, H.Chuanhe, W.Jinhai, Z.Hao, C.Xi, L.Yilong, Z.Lianzhen and W.Bin, An efficient public batch auditing protocol for data security in multi-cloud storage, in: 8th ChinaGrid Annual Conference (ChinaGrid), IEEE, 2013, pp. 51–56.
37.
P.Kazemian, M.Chang, H.Zeng, G.Varghese, N.McKeown and S.Whyte, Real time network policy checking using header space analysis, in: Proceedings of the 10th USENIX Symposium on Networked Systems Design and Implementation (NSDI), 2013.
38.
A.Khurshid, W.Zhou, M.Caesar and P.Godfrey, Veriflow: Verifying network-wide invariants in real time, in: Proceedings of the 10th USENIX Symposium on Networked Systems Design and Implementation (NSDI), 2013.
39.
S.Kikuchi and K.Hiraishi, Improving reliability in management of cloud computing infrastructure by formal methods, in: Network Operations and Management Symposium (NOMS), IEEE, 2014, pp. 1–7.
40.
L.Lamport, Time, clocks, and the ordering of events in a distributed system, Communications of the ACM21(7) (1978), 558–565. doi:10.1145/359545.359563.
41.
S.L.Lauritzen, The EM algorithm for graphical association models with missing data, Computational Statistics & Data Analysis19(2) (1995), 191–201. doi:10.1016/0167-9473(93)E0056-A.
42.
M.Li, W.Zang, K.Bai, M.Yu and P.Liu, MyCloud: Supporting user-configured privacy protection in cloud computing, in: Proceedings of the 29th Annual Computer Security Applications Conference (ACSAC), ACM, 2013, pp. 59–68. doi:10.1145/2523649.2523680.
43.
J.Ligatti, L.Bauer and D.Walker, Run-time enforcement of nonsafety policies, ACM Transactions on Information and System Security (TISSEC)12(3) (2009), 19. doi:10.1145/1455526.1455532.
44.
J.Ligatti and S.Reddy, A theory of runtime enforcement, with results, in: European Symposium on Research in Computer Security (ESORICS), Springer, 2010, pp. 87–100.
45.
X.Lin, P.Wang and B.Wu, Log analysis in cloud computing environment with Hadoop and Spark, in: 5th IEEE International Conference on Broadband Network & Multimedia Technology (IC-BNMT), IEEE, 2013, pp. 273–276.
46.
T.Madi, S.Majumdar, Y.Wang, Y.Jarraya, M.Pourzandi and L.Wang, Auditing security compliance of the virtualized infrastructure in the cloud: Application to openstack, in: Proceedings of the Sixth ACM Conference on Data and Application Security and Privacy (CODASPY), ACM, 2016, pp. 195–206.
47.
S.Majumdar, Y.Jarraya, T.Madi, A.Alimohammadifar, M.Pourzandi, L.Wang and M.Debbabi, Proactive verification of security compliance for clouds through pre-computation: Application to OpenStack, in: European Symposium on Research in Computer Security (ESORICS), Springer, 2016, pp. 47–66.
48.
S.Majumdar, Y.Jarraya, M.Oqaily, A.Alimohammadifar, M.Pourzandi, L.Wang and M.Debbabi, LeaPS: Learning-based proactive security auditing for clouds, in: European Symposium on Research in Computer Security (ESORICS), Springer, 2017, pp. 265–285.
49.
S.Majumdar, T.Madi, Y.Wang, Y.Jarraya, M.Pourzandi, L.Wang and M.Debbabi, Security compliance auditing of identity and access management in the cloud: Application to OpenStack, in: 7th International Conference on Cloud Computing Technology and Science (CloudCom), IEEE, 2015, pp. 58–65.
50.
A.Maña, A.Muñoz and J.González, Dynamic security monitoring for virtualized environments in cloud computing, in: 1st International Workshop on Securing Services on the Cloud (IWSSC), IEEE, 2011, pp. 1–6.
51.
S.Mehnaz and E.Bertino, Ghostbuster: A fine-grained approach for anomaly detection in file system accesses, in: Proceedings of the Seventh ACM on Conference on Data and Application Security and Privacy (CODASPY), ACM, 2017, pp. 3–14.
R.Mitchell and R.Chen, Behavior rule specification-based intrusion detection for safety critical medical cyber physical systems, IEEE Transactions on Dependable and Secure Computing12(1) (2015), 16–30. doi:10.1109/TDSC.2014.2312327.
55.
K.Murphy, A Brief Introduction to Graphical Models and Bayesian Networks, 1998.
56.
S.Narain, Network configuration management via model finding, in: Proceedings of the 19th Conference on Large Installation System Administration Conference (LISA), 2005, pp. 15.
57.
NIST, SP 800-53, Recommended security controls for federal information systems, 2003.
B.D.Payne, M.Carbone, M.Sharif and W.Lee, Lares: An architecture for secure active monitoring using virtualization, in: IEEE Symposium on Security and Privacy (SP), IEEE, 2008, pp. 233–247.
67.
J.Pearl, Causality: Models, Reasoning and Inference, Cambridge University Press, 2000.
68.
J.Pei, J.Han, B.Mortazavi-Asl, J.Wang, H.Pinto, Q.Chen, U.Dayal and M.-C.Hsu, Mining sequential patterns by pattern-growth: The prefixspan approach, IEEE Transactions on knowledge and data engineering16(11) (2004), 1424–1440. doi:10.1109/TKDE.2004.77.
69.
D.Petcu and C.Craciun, Towards a security SLA-based cloud monitoring service, in: Proceedings of the 4th International Conference on Cloud Computing and Services Science (CLOSER), 2014, pp. 598–603.
70.
S.Pinisetty, V.Preoteasa, S.Tripakis, T.Jéron, Y.Falcone and H.Marchand, Predictive runtime enforcement, Formal Methods in System Design51(1) (2017), 154–199. doi:10.1007/s10703-017-0271-1.
71.
M.Qiu, K.Gai, B.Thuraisingham, L.Tao and H.Zhao, Proactive user-centric secure data scheme using attribute-based semantic access controls for mobile clouds in financial industry, Future Generation Computer Systems80 (2018), 421–429. doi:10.1016/j.future.2016.01.006.
K.Ren, C.Wang and Q.Wang, Security challenges for the public cloud, IEEE Internet Computing16(1) (2012), 69–73. doi:10.1109/MIC.2012.14.
74.
R.S.Sandhu, E.J.Coyne, H.L.Feinstein and C.E.Youman, Role-based access control models, Computer29(2) (1996), 38–47. doi:10.1109/2.485845.
75.
F.B.Schneider, Enforceable security policies, Transactions on Information and System Security (TISSEC)3(1) (2000), 30–50. doi:10.1145/353323.353382.
76.
S.A.Schneider, Security properties and CSP, in: Proceedings of the 1996 IEEE Symposium on Security and Privacy, 1996, pp. 174–187. doi:10.1109/SECPRI.1996.502680.
77.
M.Solanas, J.Hernandez-Castro and D.Dutta, Detecting fraudulent activity in a cloud using privacy-friendly data aggregates, 2014, Technical Report, arXiv preprint.
78.
N.Tamura and M.Banbara, Sugar: A CSP to SAT translator based on order encoding, in: Proceedings of the Second International CSP Solver Competition, 2008, pp. 65–69.
79.
B.Tang and R.Sandhu, Extending OpenStack access control with domain trust, in: Network and System Security, Springer, 2014, pp. 54–69.
80.
K.W.Ullah, A.S.Ahmed and J.Ylitalo, Towards building an automated security compliance tool for the cloud, in: 12th International Conference on Trust, Security and Privacy in Computing and Communications (TrustCom), IEEE, 2013, pp. 1587–1593.
81.
K.K.Venkatasubramanian, T.Mukherjee and S.K.Gupta, CAAC – an adaptive and proactive access control approach for emergencies in smart infrastructures, ACM Transactions on Autonomous and Adaptive Systems (TAAS)8(4) (2014), 20.
C.Wang, S.S.Chow, Q.Wang, K.Ren and W.Lou, Privacy-preserving public auditing for secure cloud storage, IEEE transactions on computers62(2) (2013), 362–375. doi:10.1109/TC.2011.245.
84.
Y.Wang, Q.Wu, B.Qin, W.Shi, R.H.Deng and J.Hu, Identity-based data outsourcing with comprehensive auditing in clouds, IEEE Transactions on Information Forensics and Security12(4) (2017), 940–952. doi:10.1109/TIFS.2016.2646913.
85.
Y.Wang, Q.Wu, B.Qin, W.Shi, R.H.Deng and J.Hu, Identity-based data outsourcing with comprehensive auditing in clouds, IEEE Transactions on Information Forensics and Security12(4) (2017), 940–952. doi:10.1109/TIFS.2016.2646913.
S.S.Yau, A.B.Buduru and V.Nagaraja, Protecting critical cloud infrastructures with predictive capability, in: 8th International Conference on Cloud Computing (CLOUD), IEEE, 2015, pp. 1119–1124.
88.
H.Yu and D.Wang, Mass log data processing and mining based on Hadoop and cloud computing, in: 7th International Conference on Computer Science & Education (ICCSE), IEEE, 2012, pp. 197–202.
89.
H.Zeng, S.Zhang, F.Ye, V.Jeyakumar, M.Ju, J.Liu, N.McKeown and A.Vahdat, Libra: Divide and conquer to verify forwarding tables in huge networks, in: Proceedings of the 11th USENIX Symposium on Networked Systems Design and Implementation (NSDI), Vol. 14, 2014, pp. 87–99.
90.
T.Zhang and R.B.Lee, CloudMonatt: An architecture for security health monitoring and attestation of virtual machines in cloud computing, in: 42nd Annual International Symposium on Computer Architecture (ISCA), IEEE, 2015, pp. 362–374.
91.
X.Zhu, S.Song, J.Wang, S.Y.Philip and J.Sun, Matching heterogeneous events with patterns, in: 30th International Conference on Data Engineering (ICDE), IEEE, 2014, pp. 376–387.