
Abstract
In recent years, Advanced Persistent Threats (APTs) have become a major issue for critical infrastructures that are increasingly integrating modern IT technologies. This requires the development of advanced cyber-security services that can holistically detect and trace these attacks, beyond traditional solutions. In this sense, Opinion Dynamics has been proven as an effective solution, as they can locate the most affected areas within the industrial network. With this information, it is possible to put in place accurate response techniques to limit the impact of attacks on the infrastructure. In this paper, we analyze the applicability of Opinion Dynamics to trace an APT throughout its entire life cycle, by correlating different anomalies over time and accounting for the persistence of threats and the criticality of resources. Moreover, we run various experiments with this novel technique over a testbed that models a real control system, thereby assessing its effectiveness in an actual industrial scenario.
Introduction
Traditionally, SCADA (Supervisory Control and Data Acquisition) systems that govern the critical infrastructures from all industrial sensors (e.g., nuclear plants, Smart Grid or transport systems) have been working in isolation from external networks. To a certain degree, their security was based on obscurity. Nowadays, this contrasts with the advent of Industry 4.0, where the Industrial Control Systems have been increasingly connected to external networks (e.g., the Internet) to outsource several applications and store data in the Cloud. In addition, new technologies are being adopted to optimize the throughput while minimizing the costs, such as the Internet of Things (IoT) and Big Data. In consequence, the number of cyber-security issues in these environments has increased dramatically in recent years, as many reports show [3].
To date, one of the most critical hazards to industrial infrastructures is the so-called Advanced Persistent Threats (APTs), which are specifically targeted attacks perpetrated by well-resourced organizations, who in most cases make use of zero-day vulnerabilities and stealthy techniques to go unnoticed over a long period of time. Stuxnet was the first of these threats reported back in 2010, which caused disruption to an Iranian nuclear plant for four years without being detected [7]. After this, many others came into the spotlight [13], but all of them have in common the difficulty to be detected and traced. It is not surprising that traditional security mechanisms such as firewalls, Intrusion Detection Systems (IDSs), antivirus, etc. do not successfully deter the effect of these threats, so that they must be coupled with advanced services to protect the entire infrastructure from a holistic point of view, during the life-cycle of the APT within the organization.
In this context, graph theory can be leveraged to apply distributed algorithms that correlate anomalies measured across the network that are potential consequence of these attacks, while being able to locate the most affected areas within the topology. This innovative approach was applied in [21], where Opinion Dynamics was introduced. This is a multi-agent collaborative algorithm that keeps track of the anomalies suffered by devices in order to provide valuable information for the provisioning of accurate response techniques that minimize the impact of the APT on the infrastructure. However, this publication only focuses on the detection of changes in the topology of the network from a theoretical perspective (i.e., the removal/addition of edges between nodes), without considering an actual set of attack vectors against nodes from a technical point of view. This is the basis for our extended solution, that shows the feasibility of this technique to include realistic sources of anomaly and successfully trace the movement of an APT within a defined network architecture. For this reason, in this article we review the literature of the most reported cases of APTs with the aim to realistically represent their stages and the type of anomalies detected in each step of their kill chain (i.e., the sequence of individual attacks). The effectiveness of the solution is theoretically demonstrated, computing indicators of the health status of the network. Finally, the technique is implemented and executed over a real industrial environment, through the use of a testbed. We can summarize our contributions as:
Modeling of an APT and its attack actions considering the persistence and criticality of resources.
Adaptation and implementation of a distributed algorithm to detect realistic anomalies affecting the network nodes.
Creation of indicators to inform the operators about the threat evolution and the network health status.
Demonstration of the effectiveness of the Opinion Dynamics solution on a testbed.
The remainder of this paper is organized as follows: Section 2 outlines the proposed architecture and introduces the concept of Opinion Dynamics. In Section 3 the literature is reviewed to extract information about the APT modus operandi. Based on this extracted model, an algorithm that can detect and trace the presence of APT is described in Section 4. Then, the approach is theoretically and experimentally analyzed in Section 5 and 6, respectively. Finally, the conclusions drawn are presented in Section 7.
Preliminaries
In this section, we lay the theoretical base that permits, on one hand, the formal representation of actual APT attacks over a defined network and, on the other hand, the execution of the detection technique.
Proposed network architecture
As discussed in the Introduction, most industrial ecosystems are nowadays adopting cutting-edge technologies into their production chain and monitoring systems. The counterpart of the modernization of industrial technologies (which we will refer to as ‘operational technologies’ or OT) and its integration of IT (‘information technology’) in this context comes with the appearance of new cyber-security threats. Some of them are inherited from the IT paradigm and some other arise from the growing integration between IT and OT. We are talking about attack vectors such as denial of service, presence of malware in the control teams, exploitation of vulnerabilities in communication protocols, phishing and social engineering, etc. that will be further described in Section 3.1. For this reason, since there are several reported APTs that attempt to compromise resources belonging to both the IT and OT parts of the industrial network, it makes sense that the whole industrial topology can be split into these different sections: IT and OT, which will be interconnected by firewalls.
Traditionally, the architecture of a typical control network has adopted the ISA-95 standard [11]. Following a rigid pyramidal architecture, the manufacturing components (i.e., sensors and actuators) are located at the base (level 0), whereas devices interacting with them (i.e., PLCs, RTUs) are set at level 1. Level 2 comprises those devices that control the production process (i.e., SCADAs, HMIs), while those that manage the workflow (i.e., Manufacturing Execution Systems) belong to level 3. Finally, the highest level contains the Enterprise Resource Planning (ERP), or resource management. However, due to the aforementioned integration of cyber-physical systems, this architecture is evolving towards a distributed and decentralized model. Therefore, the lines that separate every level are getting blurred, which is more noticeable in the highest level of the IT section, where several entities (e.g., ERP, SCADA systems) can be flexibly deployed in the Cloud, as shown in Fig. 1.
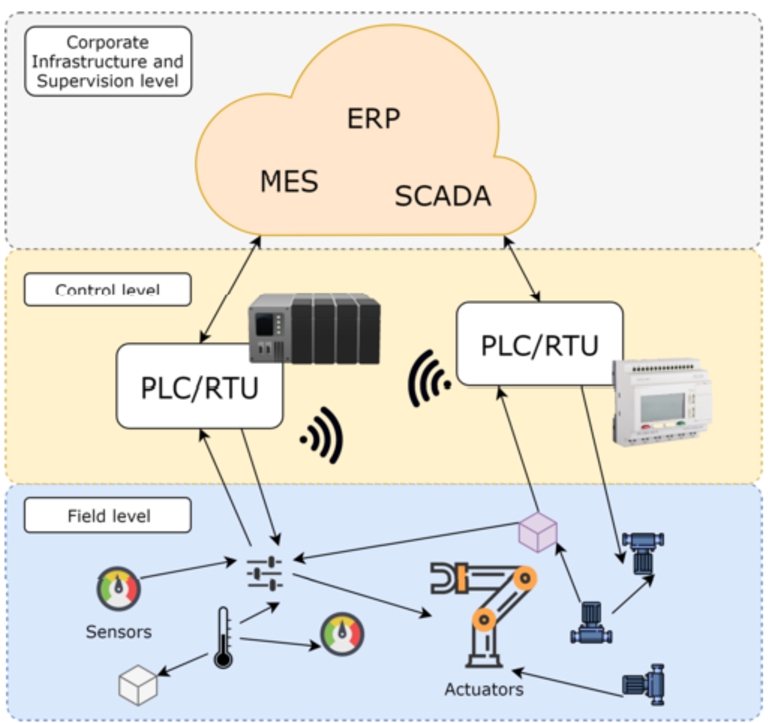
Architecture of modern industrial organizations.
The formalization of the proposed network architecture is explained in the following. Let
A driver node
If a driver node
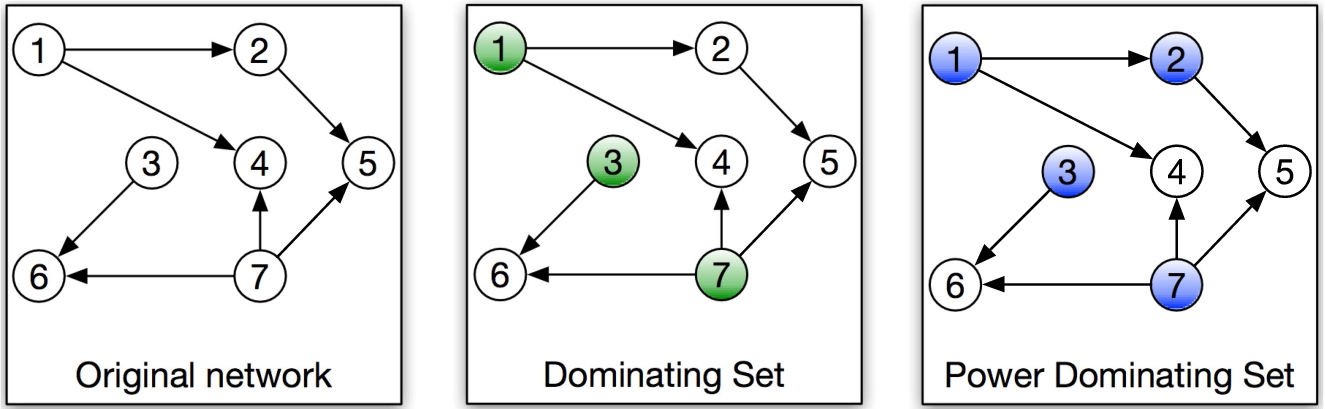
Observation rules for the election of the most dominating nodes.
An example of the election of these driver nodes is depicted in Fig. 2. As we can see, the DS is a subset of the PDS, whose nodes are adjacent to all edges in the graph. More specifically, the PDS will be used in the OT section of the industrial topology to represent the set of devices that are connected to the firewalls that also connect to the IT nodes, thereby merging both sections. The reason for such election is that in an operational environment multiple kinds of devices coexist. However, apart from sensors and actuators, Programmable Logic Controllers (PLCs) and Human–Machine Interfaces (HMIs), only SCADA systems and high-level servers are actually connected to external networks (i.e., the IT section or Internet). Therefore, these last nodes are the ones that hierarchically have more connectivity (so they will be linked to the firewall nodes), which is equivalent to the controllability concept introduced before. As for the IT section, since most of the devices range from ERP to customer-end systems (whose computational capabilities are not as restricted as OT devices), we assume that all nodes are connected to the firewalls and thereby can access the operational area.
However, concerning the network topology of the IT and OT section, we must note that each of these subnetworks is built with a different network distribution. On the one hand,
Once we have established the architecture for the network, we are in position to not only simulate attacks over the topology, but also to deploy the detection system based on Opinion Dynamics, which is the main contribution of our work.
In this section, we present the fundamentals behind the distributed detection technique from a theoretical point of view. In order to better understand what it measures and how it provides a valuable insight for further monitoring and response procedures, we must pay attention to how an APT behaves. As introduced in the first section, this type of threats comprises several stages over which the attacker manages to compromise certain devices over the victim network until he/she reaches an interest point. Then, the intruder usually chooses to either disrupt the productive process or exfiltrate information to the attacker headquarters, as described further in Section 3.1.
This chain of individual attack actions commonly takes quite a long time to penetrate the network resources; over this evolution, it would be of paramount interest to extract two main pieces of information:
The portion of the network that is subject of attack at any time, being possible to distinguish what set of devices are experiencing the same degree of anomaly which can be produced by an attack. This information is essential for applying effective response techniques and potentially isolate the attack, while the rest of the areas can keep functioning as in normal conditions, hence ensuring the continuity of the production.
The traceability of events occurred to the network with respect to the evolution of the intrusion throughout the network since the very first moment it broke into it. In this sense, when it comes to APTs, we must also take the persistence of attacks into special consideration at all times, since an advanced threat can go unnoticed for months and suddenly perform a new attack. In terms of the detection technique, this implies that it is also necessary to keep track of old subtle anomalies noticed in the network, to serve as feedback to the technique and correlate their relevance with current detected anomalies, which altogether may be part of a more ambitious threat. As it is described in Section 4, the importance given to anomalies experienced on the network in the past devalues over time depending on the criticality of the victim devices and the type of anomaly detected.
This information is extracted by means of a distributed cooperative algorithm called Opinion Dynamics [9], which models the actual opinion formation among the individuals of a society: each of these individuals (agents in our case) does not simply share or disregard the opinion of the rest of agents, but he/she takes them into account to a certain extent in order to form his/her own opinion. From this moment on, what the Opinion Dynamics process does is to take an average over the opinions, which can be iteratively calculated over and over again. This eventually leads to formed consensus of opinions belonging to different agents closer to each other. Correspondingly, it is equivalent to obtaining a fragmentation of the different opinions within the society, which can be applied to intrusion detection by representing the opinion according to the level of anomaly that each agent (representing a device of the network) experiences. This was shown in its original publication [21], where authors represent this opinion value based on the ratio of change in the betweenness centrality that is experienced in every node. This indicator represents the level of connectivity that each device holds within the network architecture, which varies when the topology changes due to attacks that add or remove new edges between nodes (representing the alterations of the communication channels as consequence of an APT). The same approach is also leveraged in [17], where Opinion Dynamics is applied for the detection of intrusions in the Smart Grid domain. Compared to these publications, which address the detection from a theoretical perspective, we aim to define a more realistic attack model and enhance the original approach to consider the persistence of threats.
In the following, we formalize the intrinsics of this multi-agent algorithm, which constitutes a light modification of the approach proposed in [9] and an extension of the work presented in [21]. Let A be the set of agents of the system such that
Consequently, every agent adjusts its opinion in period
One aspect that needs to be clarified is the assignment of weight among agents: for simplicity, for a given agent, we assume that the weight value assigned to its neighbors is uniformly divided into those agents whose opinion is very close to its own value (we establish a epsilon value of 0.2 of deviation between both opinions). This models the fact that agents close to each other with the same degree of anomaly are likely to be detecting the same threat in their surroundings.
In order to successfully apply this concept of a multi-agent algorithm to the context of anomaly detection in an industrial setting, there are various questions that need to be further addressed: i) who can play the role of agents within the industrial network, considering that there should be as many virtual agents as nodes within the network (
Attack and defense models
To improve the original Opinion Dynamics approach, it is necessary to study how the attacks affect the detection of anomalies depending on their severity and the criticality of the victim nodes, which influences the application of the algorithm. For this reason, in the following we review some of the most important APTs reported in recent years to define the attack and defense models.
Review of existing APTs, APT stages, and defenses
For the specification of the Opinion Dynamics algorithm, we need to provide an accurate representation of APT attacks in the context of our network model. Therefore, here we will first review the most important APT threats and groups that have specifically targeted industrial control systems. For the interested reader, a more detailed review of these APTs – including exploited vulnerabilities, software modules, etc – is available at [13].
Stuxnet (2009). Stuxnet was one of the APTs that popularized this concept and brought it to the limelight. Developed by a state agent, the main goal of this worm was to hinder the enrichment of uranium in the Iranian nuclear facility of Natanz [7]. It is believed that its primary infection vector, which was used to infiltrate the facility, was USB flash drives. Once the malware was installed in the ‘patient zero’ computer, it also used other mechanisms (network shares, infected project files) to spread through the internal network, searching for the computers that directly controlled the uranium enriching centrifuges. Finally, the malware modified the code that controlled the centrifuges in order to silently destroy them.
DragonFly group (2013–2014, 2015–). Active since 2010, this particular APT actor has always focused on cyberespionage. On 2013, it started several campaigns against energy suppliers [25]. In its first wave of attacks, the main goal was to discover and map the existence of OPC (Open Platform Communications) SCADA servers located in the attacked network. For this purpose, after the initial infection, the malware queried the network in search of OPC servers using specific OPC DCOM (Distributed Component Object Model) calls. Its second wave of attacks followed a more conservative approach: it retrieved information mostly by extracting documents and screenshots from the infected computers.
BlackEnergy (2015–2016). The BlackEnergy malware, created by an APT actor known as Sandworm, was used to attack the energy infrastructure of Ukraine in December 2015 [24]. After the initial infection, the first goal of the malware was to replicate to as much computers as possible through Windows Admin Shares (e.g., through PsExec and remote file execution). The second goal of the malware was to set up various connections to external command&control networks. Using these networks, malicious operators were able to activate various components (KillDisk, circuit breaker manipulator) that caused havoc in electricity distribution companies.
ExPetr (2017). ExPetr was a wiper disguised as ransomware, which targeted local administrations and various industrial companies in Russia and Ukraine [5]. It used two primary infection vectors: a modified version of the EternalBlue exploit used by WannaCry, and an trojanized version of the MEDoc tax accounting software. Once ‘patient zero’ was infected, this malware used both the EternalBlue exploit and the BlackEnergy propagation mechanisms to propagate over the local network. Inmediately afterwards, the fake ransomware component of the malware would be activated.
GreyEnergy (2018). GreyEnergy is the name of the group behind the APT which is considered as the successor of BlackEnergy. It is believed to be active since 2015, targeting energy companies and other critical infrastructure organizations in Central and Eastern Europe [6]. GreyEnergy used more modern techniques than its predecessor, since the malware is built as a modular framework that can adjust to different target infrastructures, mostly for reconnaissance and information collection. Two infection vectors were used: compromising public-facing web servers connected to the internal network, and sending spear phishing emails with malicious attachments. Then, the network mapping was performed and the malware was deployed.
Zebrocy (2018). This trojan was developed by Sednit, a Russian-linked hacking group (also known as Sofacy) which is also allegedly associated to GreyEnergy. The infection took place using spear-phishing emails, and then a backdoor was installed on the victim computer to deploy further capabilities. Its targets were widely spread across the Middle East, Europe and Asia, and the first attacks were reported in Q3 2018. According to the first analysis, there are actually in the wild multiple versions of this trojan that are implemented using multiple languages, in order to make them differ structurally and visually – and hence avoid their detection.
Another element that is essential for the formalization of the behavior of APTs in our network model is the definition of the different attack stages (i.e., intrusion kill chains) that are performed by APTs. These attack stages have been extensively studied and described by various academic and industrial researchers [4,10,18], and can be summarized in the following steps:
While this classification describes the most common attack path for industrial APTs, it is necessary to point out that not all APTs need to follow this particular template from beginning to end, or to implement all stages. For example, certain APTs only need to take control of a ‘patient zero’, and then they will proceed to extract sensitive information. Other APTs (like BlackEnergy) focus on creating a network of compromised nodes connected to the command&control centers, which allows malicious operators to cripple all the elements of the targeted network (both hardware and software) simultaneously.
Finally, in order to define our defense model, and to provide an answer to the questions raised in the previous section, it is necessary to provide a brief overview on the actual state of the art of the existing defense mechanisms against the attack stages defined above. This information is extracted from more detailed reviews that are already available in the literature, such as [22]. Here, we will only highlight the most important aspects that will influence over the defense model of our network and the different detection probabilities:
Detection coverage. As of 2018, there are multiple intrusion detection and prevention mechanisms, both commercial and academic, that are able to analyze the state of all elements and communication systems in industrial networks, including the field devices. Central correlator systems. There are several commercial platforms, such as [23], whose goal is to provide support for event correlation. These platforms can retrieve events and alerts from various domains (e.g., IT, OT networks) and from various sources (e.g., SIEM systems, vulnerability scanners) in a distributed way. Beyond attack signatures. There exist several solutions that are able to indicate the potential existence of anomalous situations, even if the attack signatures are unknown. Examples include not only diverse statistics (e.g., traffic volume, network connections, protocols used), but also machine learning mechanisms, specification-based systems, and industrial honeypots. Network features. in comparison to the IT infrastructure, OT networks exhibit a more consistent behavior. This feature is actually used by certain detection mechanisms to pinpoint the existence of anomalies more accurately.
Representation of APT attacks and detection probabilities
After reviewing the behavior of industrial APTs and the state of the intrusion detection mechanisms, we can define a realistic attack and defense model for our network architecture, thereby addressing the questions raised in Section 2.2. Our attack model is simple: we assume that, given a certain goal (exfiltration and/or destruction), adversaries are able to successfully perform an APT attack against the network architecture defined in Section 2.1 using any set of the attack stages defined in Section 3.1. As for the defense model, and given the actual state of the art in the area, we assume that all the elements of the network are covered by anomaly detection mechanisms; in other words, we assume that there is one agent per node that is monitored within the network. Each agent should measure the anomaly for itself and convey its opinion to its neighbors for the execution of the Opinion Dynamics according to the original topological model. However, we must note that, in some extent, this election of agents depends on the implementation policy: for example, although assigning every node with an agent is theoretically valid, it would not be feasible in conditions where they are integrated in the software of the own devices or deployed in form of physical devices connected to the real nodes. We must recall that the function of the agents is to measure the anomaly degree (and then exchange its value with the others), which implies that it must have access to the communications and internal status of the device it is monitoring. However, this is not always guaranteed in isolated environments, or when sensors or PLCs with rigid software do not allow the execution of third party programs. An acceptable solution for these cases is the election of a subset of nodes within the control system to play the role of agents, depending on how easy is their integration via software/hardware. This way, those agents (which should be strategically dispersed over the network) would be the only ones in charge of detecting the anomaly in their devices and also in those other surrounding devices that lack an agent. In this regard, the concept of the Dominating Set introduced in Section 2.1 would be suitable for the agent election.
Despite its contribution, the solution that was firstly proposed in [21] loses granularity as just a few agents are in position to successfully detect the anomalies for the entire set of nodes. An alternative for this shortcoming consists in retrieving those outputs (i.e., the opinions) by a correlation system similar to the ones described in [22], so that the traffic of all nodes is captured without causing any delay or interference over the actual resources. This permits us to centralize the computation of the Opinion Dynamics algorithm in a more computationally powerful node, compared to its execution in limited-resources devices like in the solution presented before. As described later in Section 6, this kind of correlation system is used for our simulation in a real industrial environment.
The description of the potential implementation leads us to the question of how to extract the value of abnormality that represents the individual opinion of each agent, which is represented in a scale from 0 to 1 of continuous values. It contains the ratio of change that an agent has experienced at a given time, compared to the initial state of the device it is monitoring (under normal conditions). By assuming the existence of a centralized correlation system, the agents can be instantiated as virtual agents (i.e., one software component per agent), whose inputs will be retrieved from the different outputs of the anomaly detection mechanisms. From those inputs, every agent can now derive a certain opinion
To formalize the attacker model, we can provide a representation of the intrusion kill chain of APT attacks. Let attackStages be a set of potential attack stages that an APT can perform against the industrial control network
Once the set attackStages is defined, it is possible to represent APT attacks that target our particular network model
These particular instances are defined taking into consideration the overall goal of every APT. For example, in the case of the Stuxnet malware, its goal is to find a particular node
Regarding how the different attack stages influence the calculation of the detection probabilities, we need to consider that certain attack stages will generate more security alerts. This, in turn, will increase the probability of detecting that particular attack stage. Therefore, we need to consider the existence of different classes of detection probabilities. Here, we define Θ as an ordered set of detection probabilities of size d, where
Map of attackStages to Θ
Map of attackStages to Θ
Once Θ is defined, we can create a model that maps every element of the set attackStages to the elements of Θ. Such model, where
We assign
For
Finally,
After formally representing the attack stages, plus their relation to the detection probabilities, we can now use the proposed detection probabilities as inputs to the Opinion Dynamics algorithm, and hence simulate its response in an industrial architecture when it faces a particular instance of APT.
APT life cycle – anomaly calculation
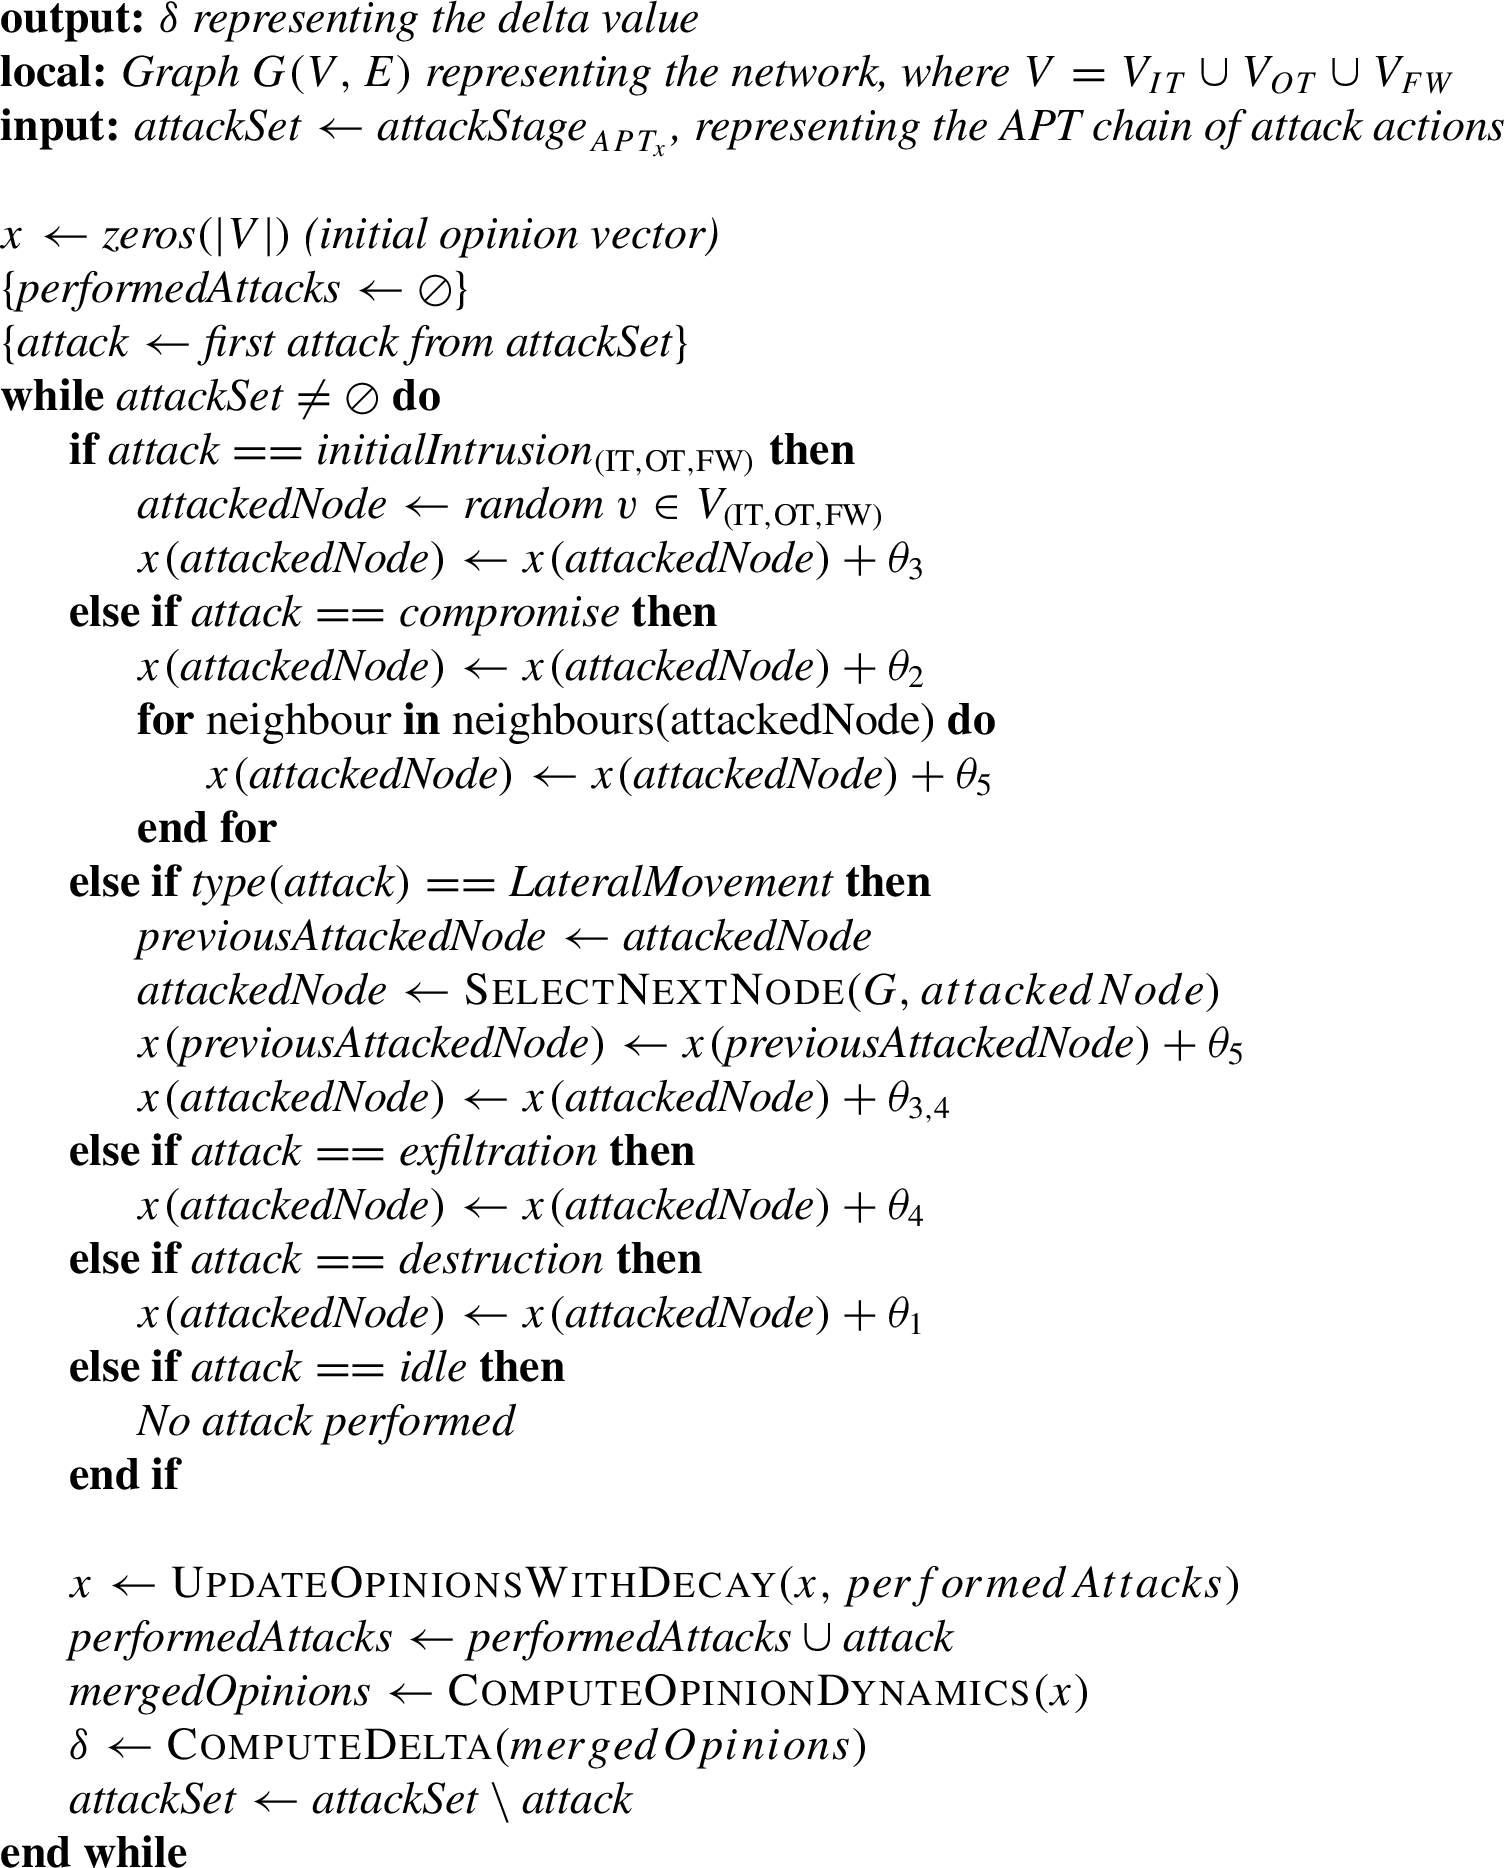
Algorithm 1 describes the life cycle of an APT composed by a set of attack actions against a given network. Each of these attacks generates an anomaly that is detected by the corresponding agents (and possibly by their neighbors), increasing their opinion in a value defined by the previously introduced Θ. After this, as commented in earlier sections, we also introduce a attenuation value on the opinion that represents the effect of old attacks in order to reduce their influence when computing the current opinion. This “decay” value, applied in the
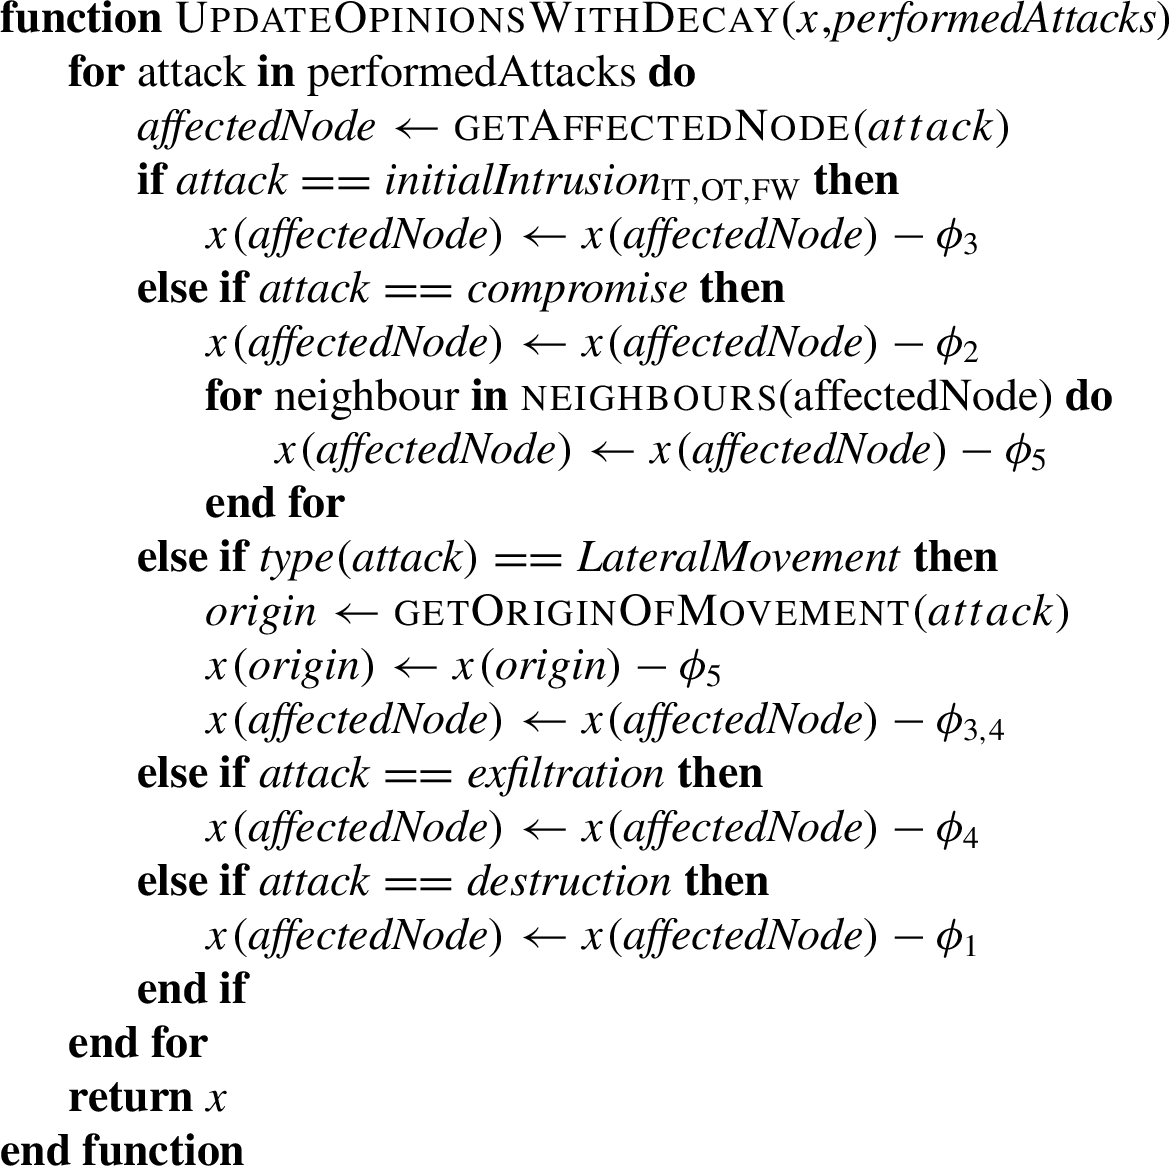
Decay of anomaly values over time depending on the attack action
Once the x vector of opinions is updated with the new attack action (with θ) and attenuated due to old stages (through Φ), the Opinion Dynamics algorithm is executed to identify the affected areas of nodes and the level of severity of these attacks. However, although this gives insight of the location of threats (as it is visualized in the experimentation section), it would be also necessary to obtain an overall value of the network health from the Opinion Dynamics processing. Therefore, we have created the so-called delta indicator, which represents a global anomaly value and is computed in the

Computation of delta value
This section presents the correctness proof of the consensus-based detection and traceability problem for APTs. This problem is solved when the following conditions are met:
The attacker is able to find an IT/OT device in the system and attack it.
The detection system is able to trace the threat, thanks in part to the consensus (detection and traceability).
The system is able to properly finish in a finite time (termination).
The algorithm is capable of terminating and providing advanced detection at any moment (validity).
The first requirement is satisfied because we assume that the attacker is capable (i) declaring the chain of attacks in advance, such as scanning, lateral movement, exfiltration or destruction (see Section 3.2), and (ii) identifying kinds of devices (e.g., IT/OT nodes and firewalls) by their functionalities. The modus operandi of the attacker is systematic except when the attacker needs to make a specific lateral movement, either through the selection of a new random neighbor node within the network or the selection of the neighbor with the highest betweenness. To comply with the predefined attack patterns, the attacker first needs to identify the first target node, which generally belongs to IT network – evidently, this characteristic depends on the type of attacker (insider or outsider) and their skills. If the attacker is an outsider, her goal is to find a
The second requirement is also found due to the software prevention agents,
Through induction we demonstrate the third requirement, corresponding to termination of the approach. To do this, we specify the initial and final conditions together with the base case. Namely:
by assumptions, we assume that the attacker is an advanced expert with skills to reach the IT-OT communication channels belonging to
(i) the attacker reaches the network
Any attack in V means an impact on the attacked node with a significant influence in its opinion dynamic (i.e.,
if we assume that we are in step k (
Finally, the latter requirement is also satisfied since the algorithm finalizes and detects the threat through opinion dynamic (either individual or collective) and shows the traceability of the threat over the time.
Theoretical simulations
In the following, we present a test case for illustrating how we can apply the Opinion Dynamics-based technique while representing an APT against a given IT/OT industrial topology, as described in the paper. For this test case, we have implemented the network topology and Algorithms 1, 2 and 3 in Matlab.
Let us assume that we have a topology composed by three OT nodes and three IT nodes connected by a firewall, as explained in Section 2.1. We will take Stuxnet for the attacker model, since it is one of the most documented APTs. According to Section 3.2, it comprises a set of nine different attack actions that will be perpetrated against the proposed network, where each node counts on an individual agent to monitor its anomalies. If we execute the Opinion Dynamics algorithm after each stage, we can analyze the different clusters of anomalies detected by sets of agents. Following the model presented in Section 3.2, we have assigned values for each θ and ϕ according to the ordered set of probabilities in Table 2, considering a realistic scenario. We have also introduced a deviation of 0.1 to values in θ to simulate a low level of noise or probability of detecting the corresponding anomaly after each attack stage. Figure 3 visually represents the resulting values in each agent after the four of the most representative stages, where (1) the attacker compromises the IT node and exfiltrates information, (2) compromises the firewall and then (3) moves to the last OT of the network and remains idle, right before the destruction of this node is performed (4). Four different idle operations are performed in this point, with a total of twelve attack actions. Numbers by the name of nodes represent the value of anomaly (opinions) that each agents holds.
Detection probability and decay values used in the Stuxnet test case
Detection probability and decay values used in the Stuxnet test case

Network topology used in the test case.
As we can also see in Fig. 3, the attacker traverses the whole network according to the Stuxnet behavior (where the current attacked node appears rounded), while the agents and its neighbors are able to detect the anomalies that consequently take place (the more red the node is, the greater the detected anomaly is). At the same time, we see how attenuation of anomalies also occurs, especially visible when the attacker leaves a node. In this example, the first IT node compromised is the number 1 while the final one is the OT number 3; the former is gradually attenuating its value as the attack evolves, according to the behavior explained in Section 4.
Opinion dynamics after the second stage.
This ability to identify where the threat is active within the network is enabled by Opinion Dynamics. If we have a look at its value in form of a plot in some point, we obtain the graph in Fig. 4. This corresponds to the execution of the algorithm (with 20 inner iterations) after the second stage depicted in Fig. 3, where the FW is compromised after attacking the first IT nodes. As we can rapidly see in the resulting graph, there are two agents (the
By this means, we can statically identify where the threat is located and which severity it experiences. However, as commented in Section 2.2, it would be also necessary to trace all the events of the APT and highlight the most affected nodes it has traversed. In this sense, if we represent the succession of opinions agreed by agents over time for the Stuxnet attack described previously, we easily have such information, which is represented with Fig. 5.

Evolution of the opinions over time to trace the APT stages.
As we can see there, the opinion profile for all agents evolves over the set of APT attack actions, showing a more pronounced value in the IT section in earlier stages and the OT in latter phases of the Stuxnet APT, as the attack aims to ultimately compromise a PLC by firstly intruding the network through a IT node. A similar effect is seen when we study the change in the delta value, which can be calculated either in the whole network or on any of its subnetworks (i.e., IT or OT). Figure 6 shows the progression of this indicator in each case, which also shows us how IT delta decreases over time and its value in OT increases according to the chain of attacks. In general, the value acquires the highest value when the last OT node is compromised, since the network has suffered most of the attacks in the previous stages. Beyond that point, delta decreases (due to the idle operations) and then it finally increases with the destruction of the node.

Evolution of delta opinions over the network for the Stuxnet attack.
In this section we will go beyond the theoretical experiments described in the previous section, and provide the experimental results of a proof of concept implementation of the Opinion Dynamics system. This proof of concept was integrated on a tesbed that simulates an industrial environment using realistic hardware and protocols. For this proof of concept, rather than integrating a full-fledged network-based and host-based intrusion detection system as an input for the Opinion Dynamics algorithm, we deployed a set of simple heuristics that searched for anomalies in the communication channel. The reason for this is simple: this experiment aims to provide a baseline that shows how the Opinion Dynamics system can help to provide the trace of a kill chain while using as an input only lightweight anomaly detection rules.
As for the structure of this section, firstly we present and provide the technical specifications of the testbed used for the simulations (the so-called I4Testbed). Then, we explain how the Opinion Dynamics system has been applied in this context. Finally, we describe the execution of the different attacks cases, and analyze the results provided by the Opinion Dynamics system.
I4Testbed – an industry 4.0 Testbed
The advent of the Industry 4.0 paradigm is basically a consequence of a plethora of technologies that are being imported from the IT world (e.g., the Internet of Things, Cloud Computing, Big Data) to industrial control systems, which have been working in an isolated way for decades. This has also caused the appearance of new attack vectors against these infrastructures, which has fostered the research of advanced cyber-security solutions. Precisely, the I4Testbed testbed has been developed in the University of Malaga to provide a realistic environment where novel detection mechanisms can be assessed without facing the whole investment of deploying a complete industrial infrastructure.

Overall architecture of the I4Testbed testbed.
The overall architecture of the I4Testbed is depicted in Fig. 7. It is designed to accommodate different industrial applications in a realistic fashion. For this particular case, we model a solar, hydraulic and wind electricity generation system. Each of the three sources are virtually simulated by using an open API that retrieves the climate conditions in Malaga in real time [19]. These values are then fed to the physical sensors, so that the turbines are ultimately activated from the SCADA system depending on specific conditions of humidity and temperature.
As shown in Fig. 7, different devices are placed in the lowest level of the topology, which includes light indicators, emergency buttons, industrial sensors (using protocols such as IO-Link, WirelessHART and ISA100.11a) and IoT sensors (TelosB using 6LoWPAN over IEEE 802.15.4). These sensors are connected to their respective gateways which, along with other field devices based on Intel Galileo Gen1, RevPi Core 3 and Raspberry Pi, gather the different measures of the generation process and then relay them to three different PLCs: one SIMATIC S7-1200 (using Profinet) that governs the hydraulic generator, one PLC based on Raspberry Pi 3 (using ModBus TCP) that controls the eolic and solar generator, and another one implemented purely via software, that controls the AC system of the power transformer. These three PLCs are then operated by the SCADA system (which is based on Linux with Python) and two different HMIs: one SIMATIC KTP700 and another one implemented with a Raspberry Pi. This SCADA system, that also works as HMI (as shown in Fig. 8), and the IBH Link UA Gateway can be accessed by local entities through TCP/IP and OPC UA; and by external entities through a virtual private network (VPN) connection. Additionally, the testbed also integrates a backup server, a corporate computer and another one for development purposes.
As for the monitoring capabilities of the I4Testbed, the previously presented topology contains a security server with high computational resources that is able to capture all the information from the communication channels via a network switch in port mirroring mode. Despite the logical topology, as all devices are physically connected through one switch, the security server can retrieve all the traffic from the nodes. This way, the security server can also function as a centralized entity (as discussed in Section 3.1), where we can deploy a virtual agent for each physical node that must be monitored. Such agents will then perform the different computations of the Opinion Dynamics algorithm.
Within the Opinion Dynamics system, every agent will process the traffic handled by its associated physical node, and study the security state of its neighbourhood. As a result, it will create a quantitative value (i.e., the opinion of that agent) which will be used as an input to the Opinion Dynamics algorithm. For the purpose of our experiments, in this proof of concept implementation we will make use of an heuristic to compute the unique anomaly value, which considers the following characteristics:
Variation of traffic volume: By analyzing the number of packets per protocol and device connected with each channel: Enabling the detection of added/removed devices within the topology, in addition to non-frequent communications.
Variation of the commands received by the industrial protocols: Through the analysis of the number and type of commands, with the aim of detecting anomalous actions performed by potentially compromised devices.
Variation of the delays experienced between received commands by the industrial protocols: To infer the presence of anomalous processes running in each device.

Interaction panel GUI on the SCADA system.
For the computation of an unique anomaly value, the average and standard deviation of the different characteristics monitored (e.g., number of connections, packets exchanged) are calculated in normal conditions. For the sake of simplicity, we have assumed that, for a given characteristic, a value sensed at any time is considered as anomalous when it exceeds the standard deviation of such characteristic in normal conditions. Finally, the opinion of each agent is chosen as the highest anomaly value for all the characteristics monitored. Even though this criteria is an adjustable parameter for the simulations, we have specifically considered the following equation to compute the anomaly value for a given characteristic:
Then, the process is analyzed periodically to sense multiple anomalies across the entire topology. For this test case, we have considered slots of 5 minutes: during this period, each pair of devices that exchange information are considered as neighbours, and all characteristics of the communications are gathered by each agent to compute its anomaly degree. Lastly, these anomalies (i.e., the agents opinions) are correlated using Opinion Dynamics, to ultimately output the health status of the industrial system.
In order to implement the virtual agents, we have deployed three different components (cf. Fig. 9) in the security server. These components are as follows:
A
Then, the
Finally,
For this particular experiment, these three components have been developed using Python 2.7.13. In order to capture the network traffic, we have also used the scapy library and several dissectors such as scapy-cip-enip.
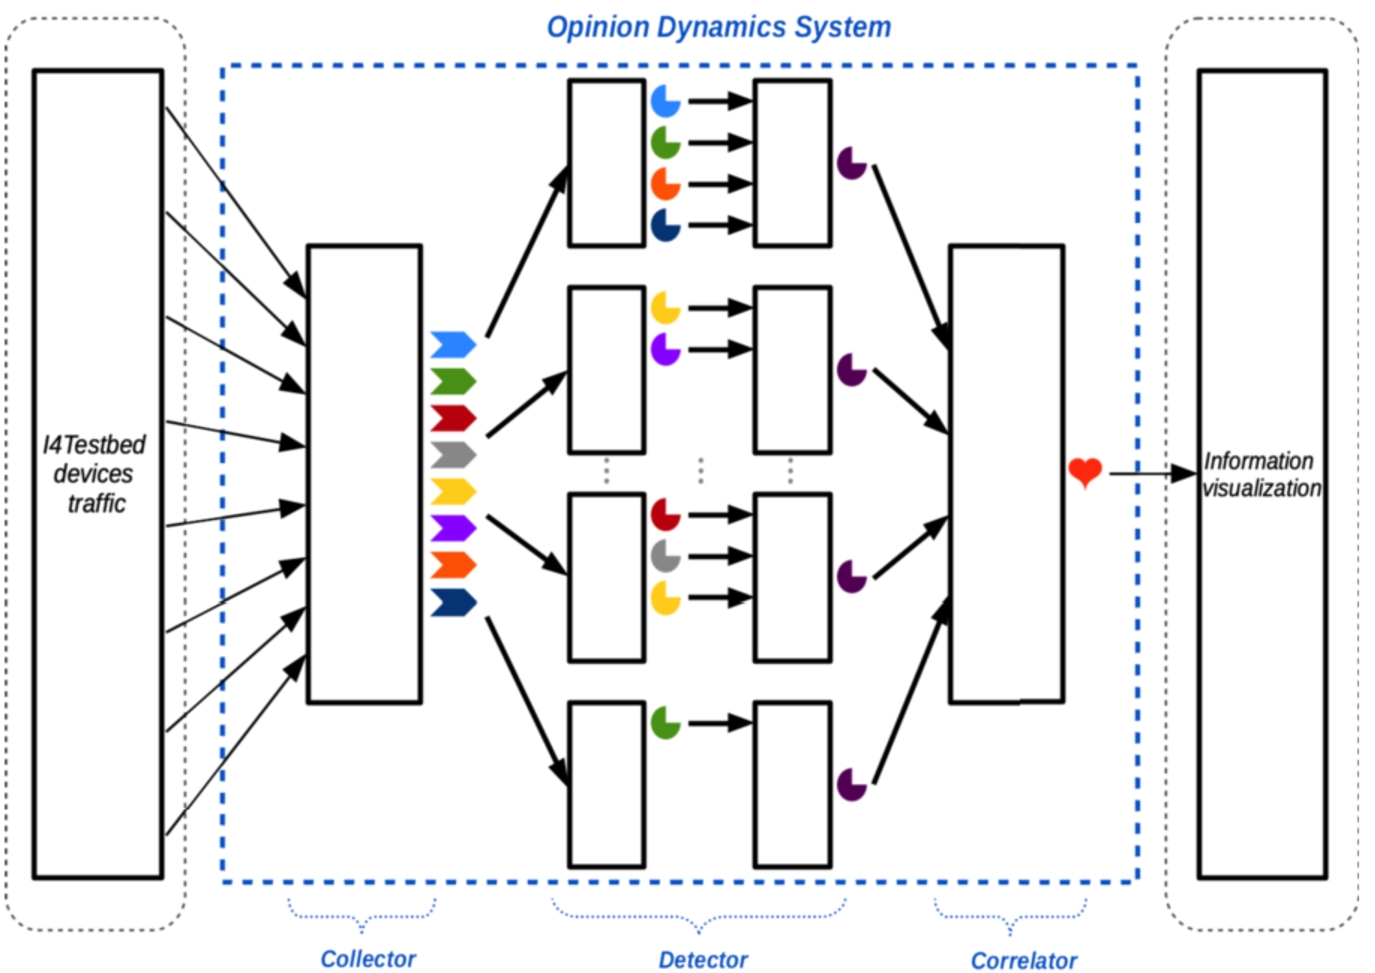
Components of the Opinion Dynamics System.
In this section we show how the Opinion Dynamics-based technique performs against a test case of an APT composed by four different attack stages. The aim is to check how the different agents that are spread over the topology sense the different anomalies caused by these vectors. As a result of this analysis, the system should provide a trace of the whole attack, plus an aggregated indicator of the health of all resources of the I4Testbed. In order to i) achieve an acceptable degree of realism, and ii) provide as many sources of anomalies as possible, the entire kill chain has been defined as a sequence of the following stages:

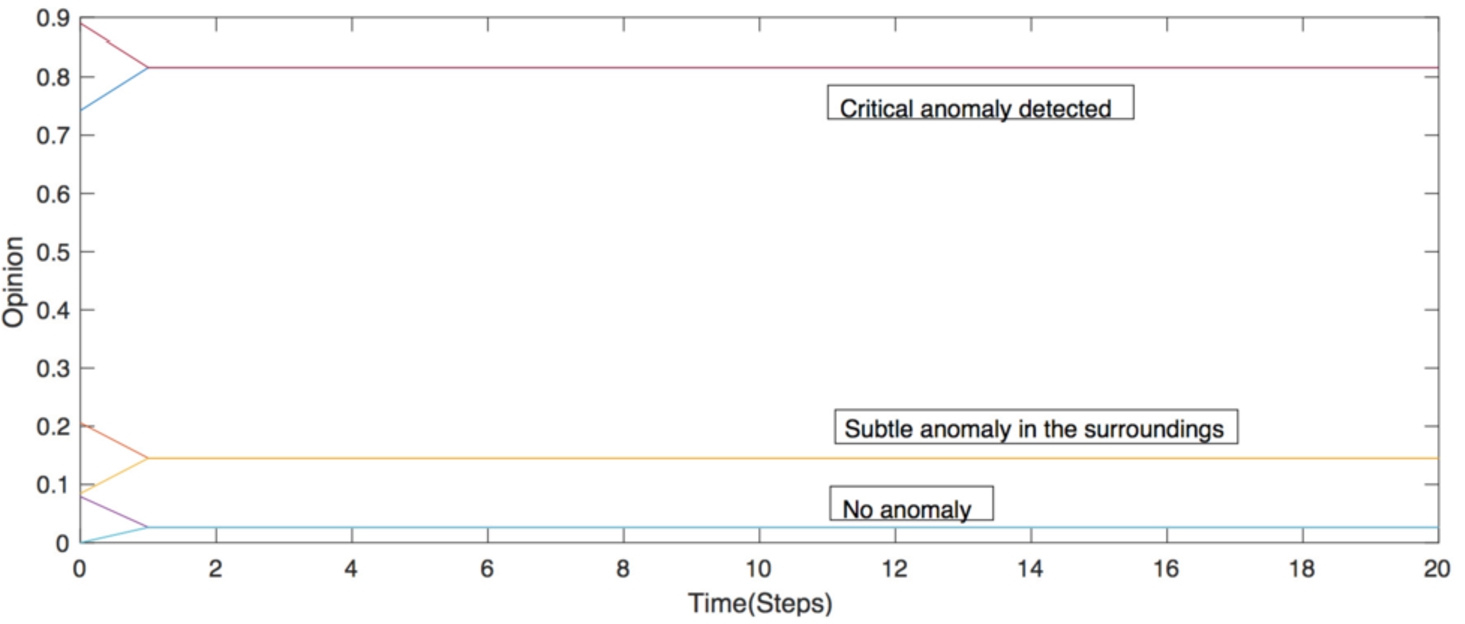
Evolution of the Opinion Dynamics values over the test case attack stages.

Evolution of delta opinions over the test case attack stages.
In order to visualize how these attacks are detected and reported by the Opinion Dynamics System, the experimentation has been carried out according to the following methodology: firstly, the industrial system is left to work for an hour without taking any special action on the testbed, except for computing the detection algorithm periodically every 5 minutes. This helps the virtual agents (one per device) to compute the average and standard deviation of the different characteristics introduced before (traffic volume, number of connections and communication commands, etc) in normal conditions. Afterwards, the entire kill chain is executed in sequence, with a waiting time of approximately one hour between the various stages of the attack. During the execution of the kill chain, the Opinion Dynamics system keeps being executed, so that we can keep track of the multiple anomalies measured as attacks take place.
As a result, Fig. 10 shows an abstract representation of the I4Testbed devices and their connections, along with the respective correlated opinion of all virtual agents, which is computed immediately after each individual attack. Note that, in our experiments, two devices are considered as neighbours by the Opinion Dynamics as long as they exchange information during the last period analyzed (i.e., every 5 minutes, as explained before). This way, the system can detect when a device has been removed from the topology, which affects the anomaly calculation due to a variation on the number of connections. Note also that, in Fig. 10, dotted lines represent connections that are not used frequently.
As we can see, the correlation of the different opinions of the virtual agents provide helpful information that is of interest to network security mechanisms and services, as it provides an accurate visualization tool to easily identify the most affected resources at all times. First, Fig. 10(a) shows that an important anomaly was detected by the virtual agent assigned to the corporate PC when the SSH connection was opened to communicate with the HMI/SCADA, since its notices an unexpected connection involving that target device. Besides, if host-based IDS were available, the virtual agent assigned to the HMI/SCADA would also have signalled the existence of an anomaly. Note that this corporate PC is opted out for the Opinion Dynamics computation after this first step because it will not have any more interactions with the rest of the devices during the entire simulation. Then, as seen in Fig. 10(b), the search for victim devices within the network results in a mild increase in the opinion of most agents, since the network is flooded with TCP connections.
Thirdly, the adversary establishes the covert-channel between the HMI/SCADA and the Modbus PLC, with the aim to issue commands without firing any alert. However, this attack is also detected when the variation of the packet delays is analyzed by the agents involved, which is leveraged to embed the shutdown command for the target PLC; in other words, different clusters of opinions appear as consequence of the correlation of similar opinions due to similar delays experienced in their surroundings links. These are represented in orange in Fig. 10(c). Lastly, the attacker sends a shutdown command to the RPi3 PLC, paralyzing the production chain. As expected, this generates a critical anomaly (cf. Fig. 10(d)) that is measured by all devices that work closely to that device. Such anomaly is a consequence of the variation in the traffic volume, caused by delays and requests issued by the industrial devices; namely, the WirelessHART and ISA100.11a gateways, the field devices, the HMI/SCADA system, and the Software PLC.
Apart from providing a detailed analysis of the security status of all devices, the Opinion Dynamics System can also provide the health status for the entire network by calculating the δ indicator, as introduced in Section 4. In particular, Fig. 11 shows the resulting value of the global anomaly (1 minus the delta indicator), calculated as the weighted average of all individual opinions (also represented in the graph) during the entire simulation. In the figure, each mark in the X axis represents a single computation of the Opinion Dynamics algorithm. There are two important aspects that must be highlighted in this figure. First, as all agents run a training phase to determine the normal conditions of the system, every event is considered as an anomaly during that process until they stabilize around zero value. Second, the four different attack stages are actually shown in the figure as peaks in the y-axis. As explained before, the highest peak occurs with the ultimate disruption of the PLC, which results in a global anomaly of 68.83% (so that
APTs nowadays represent a dramatic source of economic losses and reputation damage for the industry, which obligates researchers, managers and operators to make a great effort to analyze them to trace their behavior and anticipate their effect. It then becomes mandatory to explore new ways of detecting and tracing anomalies beyond traditional detection techniques. In this paper, we have described the feasible application of an already available theoretical approach based on a distributed collaborative algorithm (Opinion Dynamics). We review the literature to gather the set of attack vectors that these threats leverage with the aim of representing the anomalies and show the effectiveness of the algorithm in a realistic setting, which also considers the influence of persistence over time. As a result, we have valuable information about the status of the network at all times. Finally, we have implemented and validated a proof of concept of this approach in a real testbed that integrates several kinds of industrial devices and protocols.
Future work will involve the enhancement of this algorithm when applied to a fully distributed environment of the Industry 4.0. This is a especially volatile context where heterogeneous devices interact with any other element within the local infrastructure or between industrial organizations, thereby involving a cloud-based network of partners. In this sense, it worth investigating the design of trust management procedures that allow the escalation of the Opinion Dynamics in a decentralized way while preventing against the manipulation of the detection system or the agents’ opinions. Likewise, the analysis of new sources of anomalies to accurately detect APTs in such innovative scenarios, plus the integration of alerts provided by more traditional intrusion detection mechanisms, will be subject of research.
Footnotes
Acknowledgments
This work has been partially supported by the research project SADCIP (RTC-2016-4847-8) and the research project SMOG (TIN2016-79095-C2-1-R), financed by the Ministerio de Economía y Competitividad, and DISS-IIoT, financed by the University of Malaga (UMA) trough the “I Plan Propio de Investigación y Transferencia” of UMA. Likewise, the work of the first author has been partially financed by the Spanish Ministry of Education under the FPU program (FPU15/03213). The authors also want to thank J. Rodriguez and S. Infantes (NICS Lab.) for their valuable comments, support, ideas, and incredible help.