
Abstract
Con2Mix (Contrastive Double Mixup) is a new semi-supervised learning methodology that innovates a triplet mixup data augmentation approach for finding code vulnerabilities in imbalanced, tabular security data sets. Tabular data sets in cybersecurity domains are widely known to pose challenges for machine learning because of their heavily imbalanced data (e.g., a small number of labeled attack samples buried in a sea of mostly benign, unlabeled data). Semi-supervised learning leverages a small subset of labeled data and a large subset of unlabeled data to train a learning model. While semi-supervised methods have been well studied in image and language domains, in security domains they remain underutilized, especially on tabular security data sets which pose especially difficult contextual information loss and balance challenges for machine learning. Experiments applying Con2Mix to collected security data sets show promise for addressing these challenges, achieving state-of-the-art performance on two evaluated data sets compared with other methods.
Introduction
Supervised learning [31,36,37,43] has shown great success with large, labeled data sets collected and annotated by researchers in image, language, and many other domains. However, in real-world cybersecurity domains, the task of accurately labeling large data sets for supervised learning is often infeasible. For example, security-critical software products, such as operating systems, web servers, cloud computing architectures, and networking stacks, often consist of hundreds of millions of lines of code, and undergo hundreds or thousands of code changes per day (churn) as features are added, bugs are corrected, and hardware evolves. Accurately identifying and labeling even one security vulnerability in these large, mutating corpa often requires extremely high levels of expertise and many hundreds of person-hours of effort. As a result, previously undiscovered (zero-day) security vulnerabilities are so valuable and rare that some have sold for up to $2.5 million USD2
In order to aid defenders in analyzing such data sets before vulnerabilities become exploited, it is essential to efficiently leverage the small portion of the data set that has been labeled by experts, and train the model to handle the large amount of unlabeled data. Semi-supervised learning utilizes both labeled and unlabeled data to address this dilemma. In recent years, many semi-supervised methods [2,14,50,63] have emerged for different domains, bridging the gap between supervised learning and unsupervised learning. However, in security domains, semi-supervised methods on tabular security data sets remain relatively unexplored. This open problem has impeded cybersecurity research and practice, in that state-of-the-art software vulnerability detection approaches often suffer extremely high false positive rates (making them unusable), miss many vulnerabilities (making them unsafe), or cannot use machine learning approaches at all (posing scalability and automation problems).
Nevertheless, partially labeled data sets for this domain are widely available in the form of Common Vulnerabilities and Exposures (CVE)3
There are many semi-supervised learning techniques in image and language domains due to the ease of data augmentation in these data sets. However, in security domains, data are usually in a tabular format. This impedes augmentation because the data lack context, causing significant information loss after augmentation. Tabular security data sets are also highly imbalanced. For example, the class ratio of the data set we use is 1:100 (positive:negative) for data set 1 and 1:50 (positive:negative) for data set 2, where positive means vulnerable cases and negative means non-vulnerable cases. This huge imbalance issue is difficult to solve with traditional down-sampling and up-sampling methods (e.g., [5]). To address this problem, researchers have proposed a variety of approaches. For example, set convolution (SetConv) [22] and episodic training have been proposed to extract a single representative for each class, so that classifiers can later be trained on a balanced class distribution. Focal Loss [35] addresses this class imbalance by reshaping the standard cross entropy loss such that it down-weights the loss assigned to well-classified examples, focusing the training on a sparse set of hard examples and preventing the vast number of easy negatives from overwhelming the detector during training. Class-balanced Loss [12] is a re-weighting method using the effective number of samples for each class to re-balance the loss.
As an alternative to these methods, we propose a novel triplet mixup data augmentation method to address the class imbalance problem by only augmenting the minority data. Triplet mixup goes beyond the traditional pairwise mixup, mixing three different data points from the same class, thereby joining the information from the features of the triple data to a larger extent. Experimental results demonstrate the effectiveness of our proposed data augmentation method over the prior approaches. In addition to doing mixup on the input, we also do manifold mixup in the hidden space on each pair of embeddings to create multiple views for our contrastive loss term. We further leverage the unlabeled subset by pre-training the encoder and using label propagation [28] to generate pseudo-labels for the unlabeled samples. Subsequently, the trained encoder and samples, for which we have generated pseudo-labels, are transferred to a downstream task where a simple predictor with Mixup [66] augmentation is trained.
The contributions of our work are fourfold: (1) We propose a novel triplet mixup data augmentation method that can reduce the data imbalance problem in large, sparsely labeled data sets. (2) Our work is the first semi-supervised learning framework on tabular security data sets. (3) We develop a tool to automatically extract source-level function features from sources processed by Joern [59] and binary-level function features from binaries produced by C compilers. (4) We achieve state-of-the-art performance on all the experiments, which demonstrate the superiority of our proposed method for cybersecurity data domains.
Vulnerability complexity
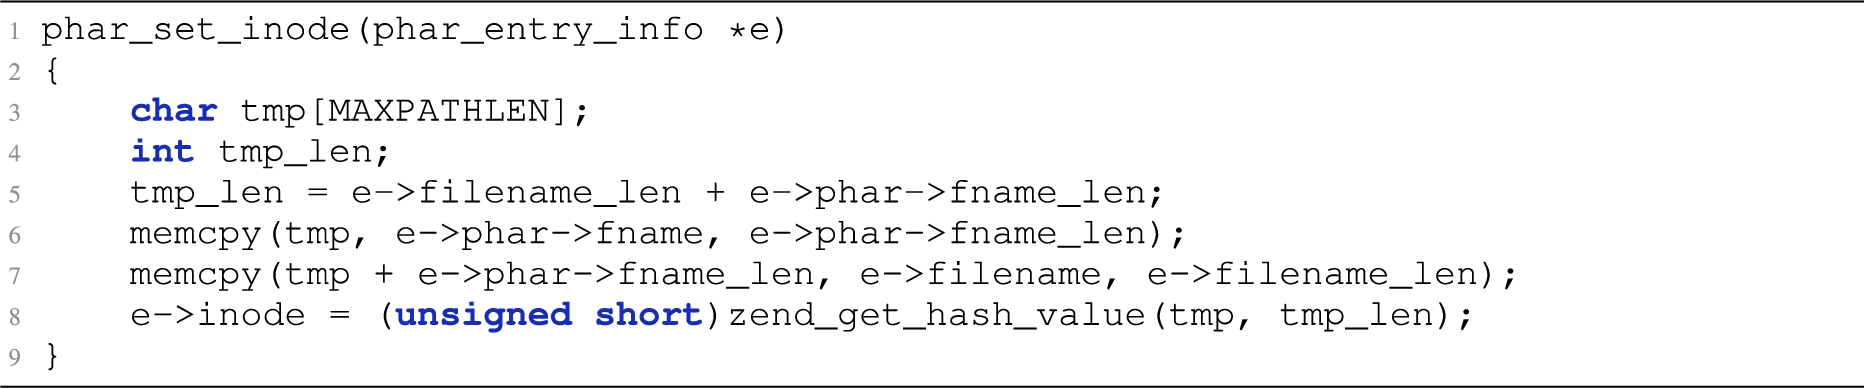
A buffer overflow vulnerability in a PHP interpreter (CVE-2015-3329)
Software vulnerability detection is widely considered to be a difficult problem requiring high levels of human expertise and training. Therefore, providing defenders with more powerful tools to help them find these subtle but dangerous vulnerabilities in large bodies of complex code is an increasingly acute need in the software industry.
Listing 1 shows an example of a vulnerable function (CVE 2015-3329) in the Linux PHP interpreter. Despite having a small number of lines without loops or conditionals, this bug evaded auditors for over two years, leaving affected Linux machines susceptible to remote compromise until it was detected and patched in April 2015. The flaw involves unsafely copying a file name with attacker-controllable length into a buffer, potentially overflowing it and corrupting adjacent memory. When adjacent memory includes code pointers, the hijacker can take remote control of the program. Although many standard code complexity metrics (e.g., number of lines-of-code, looping structures, and conditions) misidentify this code site as unlikely to contain a vulnerability, additional features such as pointer arguments, distance to insecure libc functions, and pointer assignments might focus more auditor attention on this function.
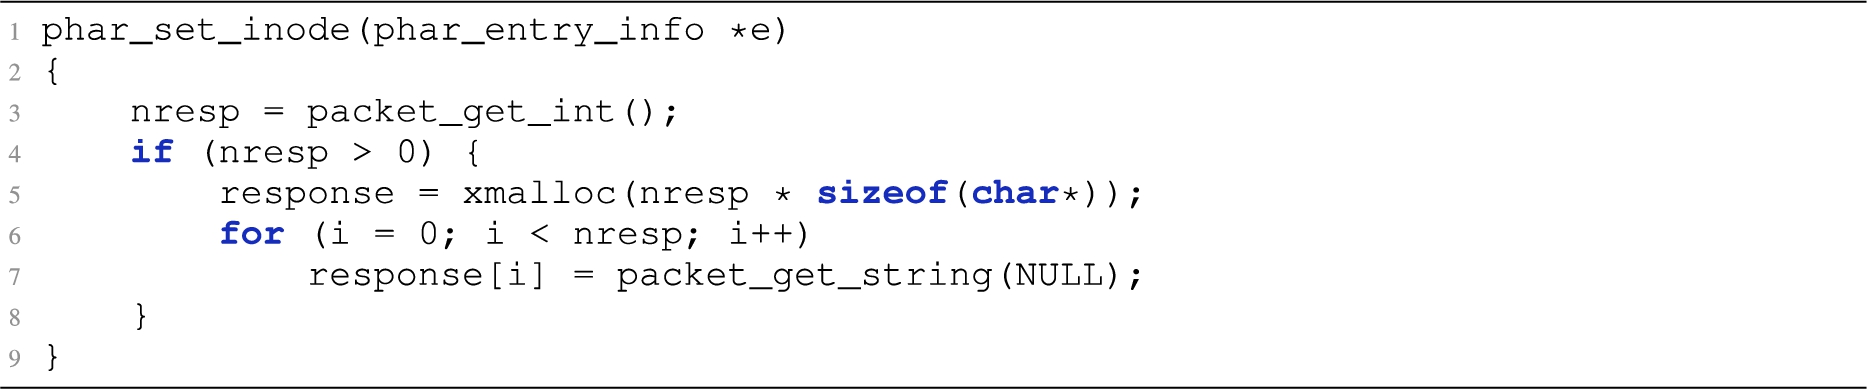
An integer overflow vulnerability in OpenSSH v3.3 (CVE-2002-0639)
Listing 2 shows a classic example of integer overflow extracted from OpenSSH v3.3 (CVE-2002-0639). When
All these metrics intensify the vulnerability complexity and therefore can be used as alarming indicators (features). Such complexity metrics are used to approximate the vulnerability proneness by measuring how coupled the candidate function is both internally (e.g. variables, pointers, etc.) and externally (e.g. fan-in, fan-out, height, etc.). The features used in this research are further discussed in §2.2.
Previous work has considered the software vulnerability detection problem at various levels of granularity, including component-level granularity [23,65,74], source file-level granularity [17,39,48], and function-level granularity [64]. Finer granularities are more useful because they provide code programmers and auditors more precise information on where vulnerabilities might be located and how to patch them against exploitation; but they are often more difficult to achieve in practice because of the much greater level of human skill and time typically required to localize precise bug positions—especially for bugs that involve complex interactions between multiple components scattered throughout the code. This leads to greater data imbalance challenges, since finer-granularity labels are more difficult to produce. Accurately modeling software vulnerabilities therefore requires a suitably large data set. Moreover, the data set must usually consist of real-world applications and real-world bugs rather than synthetic data in order to yield a model that is effective for realistic vulnerability-finding tasks. Although the synthetic dataset such as Juliet [3], includes a simple, compact and, minimal code required to compile a vulnerability, it is far off from replicating a complicated and diverse real world vulnerability [9,70].
Building a large corpus of data using real-world applications is challenging. We used NVD archives to compile a labeled data set with a reasonable vulnerable-to-non-vulnerable ratio in records. The NVD database includes URLs with patches or exploit tags, but does not reveal which portions of each patch are relevant to the exploit, or which original code lines were exploited. Inferring the respective files, functions, and locations of the defective code is a manual effort requiring many person-hours. Automating this step by filtering out irrelevant code without harming the actual imbalance ratio is infeasible. We collected a suitably large corpus by manually inspecting 8 real-world applications [57] designed for variety of different purposes and whose known vulnerabilities are recorded within the NVD.
Table 1 shows the descriptions of the applications in our data set. Each is a large-scale open-source project written in C/C++ containing hundreds or thousands of functions, and tens or hundreds of thousands of lines of code. By manually studying all NVD records for these applications over the past decade, we assembled a data set of over 400 vulnerabilities, the exact bug locations that gave rise to each vulnerability, and the type of attack that exploited each vulnerability and that motivated the patch.
Previous work shows that the vulnerability likelihood is proportional to the software complexity [47]. The complexity may be increased by vulnerability metrics such as number of lines-of-code, number of variable, and nested structures etc. Different code features may be associated with different vulnerabilities, hence we categorize them into four different dimensions. Table 2 summarizes the four dimensions of features: structure-based, flow-based, pointer-based, and binary-based. These dimensions are inspired by prior works that have shown the effectiveness of using different aspects of software structures for modeling and discovering vulnerabilities [18,59]. In particular, the different dimensions are useful for detecting different types of vulnerabilities. For example, flow-based features tend to be associated with component interaction errors, wherein software components make inconsistent, conflicting assumptions about prerequisites or interfaces; whereas pointer-based features tend to be associated with incorrectly computed references to data or memory.
Applications
Applications
Features
We collect source-level function features using Joern [59], which processes source files into code property graphs (CPGs) reflecting their syntax, control-flows, and dataflows. In addition to source level feature collection, we collect binary-based data in order to detect compiler-generated vulnerabilities that cannot be observed at the source code level. To our knowledge, ours is the first data set that combines detailed, fine-grained CVE data for both source and binary features. We developed a tool to automatically extract these features from sources processed by Joern and binaries produced by C compilers.
Data augmentation is a method to increase training data diversity without directly collecting more data [20]. It is often employed to address data insufficiency problems. In image and language domains, data augmentation has been well studied [13,24,27,29,30,34,46,49,51,68]. There are a variety of data augmentation methods available in these domains. For example, in image domains researchers use zoom, flip, contrast adjustment, etc., and in language domains researchers use language translation, next words and previous words predictions, interpolation, etc. Dating back to 2002, SMOTE (Synthetic Minority Over-sampling Technique) [5] is an efficient up-sampling method for the minority class. In recent years, Mixup [66] has emerged as a popular data augmentation method for alleviating memorization and sensitivity of adversarial examples of large deep neural networks. It regularizes the neural network to favor simple linear behavior between training examples by training a neural network on convex combinations of pairs of examples and their labels. RLCN [56] utilizes limited samples for training a model and then applies it to classify normal instances and detect the emergence of novel classes over time. However, tabular data lacks context information, making it difficult to apply traditional data augmentation methods on tabular domains because it generates too much noise. To address this issue, MCoM [33] extends the idea of Mixup to Triplet Mixup, a data augmentation method. In this paper, we adopt the triplet mixup idea of MCoM and demonstrate its effectiveness with different experimental settings and different data sets.
Semi-supervised learning
Semi-supervised learning [14,26,32,33,58,60,63,67,69,71] is a machine learning branch using both labeled and unlabeled data to perform certain learning tasks. Generally, semi-supervised methods can be partitioned into two categories: inductive methods and transductive methods. Inductive methods aim to construct a classifier that can generate predictions for any object in the input space. A simple inductive approach called wrapper methods first trains classifiers on labeled data and then uses the predictions of the resulting classifiers to generate additionally labeled data [73]. The classifiers can then be re-trained on this pseudo-labeled data in addition to the existing labeled data. VIME [63] is a self- and semi-supervised learning framework that creates a novel pretext task of estimating mask vectors from corrupted tabular data in addition to the reconstruction pretext task for self-supervised learning. Contrastive Mixup [14] leverages mixup-based augmentation under the manifold assumption by mapping samples to a low-dimensional latent space and encouraging interpolated samples to have high similarity within the same-labeled class. They cannot be directly used in the security domain because they cannot handle the imbalanced data problem. Our method Con2Mix can be regarded as a wrapper method derived from Contrastive Mixup with an optimized Triplet Mixup data augmentation method which is the main innovation compared to Contrastive Mixup. Our method can better work for minority classes and is superior in security data sets.
Contrastive learning
Contrastive learning [10,11,42,54,55,61,62] aims to embed augmented versions of the same sample close to each other while separating embeddings from different samples. Recent methods such as SwAV [4], MoCo [25], and SimCLR [7] with modified approaches have produced results comparable to the state-of-the-art supervised method on the ImageNet [15] data set. Similarly, PIRL [40], Selfie [53], and the InfoMin principle [52] reflect the effectiveness of the pretext tasks being used and how they boost the performance of their models. Contrastive Learning has started gaining popularity on several NLP tasks in recent years. INFOXLM [8], a cross-lingual pretraining model, proposes a cross-lingual pretraining task based on maximizing the mutual information between two input sequences and learning to differentiate machine translation of input sequences using contrastive learning. Most of the popular language models, such as BERT [16] and GPT [45], approach pretraining on tokens and therefore may not capture sentence-level semantics. To address this issue, CERT [19] that pretrains models on the sentence level using contrastive learning was proposed. In this work, we extend contrastive learning to tabular domains by computing a contrastive loss in the embedding space.
Pros and cons of different baselines
Our method Con2Mix is a semi-supervised method. Thus, we compare our method with 6 supervised methods and two state-of-the-art semi-supervised methods. The supervised methods we choose are XGBoost, MLP, Logit Regression, SVM, Decision Tree, and KNN. The semi-supervised methods are VIME [63] and Contrastive Mixup [14]. Table 3 demonstrates the pros and cons of these different baselines. Compared to supervised methods, our method only utilizes a small portion of labeled data and achieves better results than supervised methods. Compared to VIME, our method works for both continuous and discrete data. Compared to Contrastive Mixup, we add one more data augmentation in the input layer, which make our model able to handle imbalanced data.
Pros and cons of different baselines
Pros and cons of different baselines
In order to introduce our proposed method, we first provide some formulas for contrastive loss and semi-supervised loss (supervised and unsupervised loss). These two kinds of losses are the foundation of our proposed method. Provided with a data set with N examples, we define
Contrastive loss
Contrastive learning is a popular method used in unsupervised learning. Contrastive Learning is a technique that enhances the performance of tasks by using the principle of contrasting samples against each other to learn attributes that are common between data classes and attributes that set apart a data class from another. Instead of directly using the label of the data set, contrastive learning compares augmented data and the original data. Thus, data augmentation on the original data is usually the first step. The resulting model measures the similarity of the data pairs in an effort to make the data generated from the same data and the data generated from different data separated. In contrastive representation, a batch of N samples is generally augmentated through an augmentation function
Semi-supervised loss
Semi-supervised learning (SSL) is a machine learning technique that uses a small portion of labeled data and lots of unlabeled data to train a predictive model. Supervised learning is training a machine learning model using the labeled data set. Unsupervised learning, on the other hand, is when a model tries to mine hidden patterns, differences, and similarities in unlabeled data by itself, without human supervision. Semi-supervised learning is halfway between supervised and unsupervised learning. Unlike unsupervised learning, SSL works for a variety of problems from classification and regression to clustering and association. Unlike supervised learning, the method uses small amounts of labeled data and also large amounts of unlabeled data, which reduces expenses on manual annotation and cuts data preparation time. In semi-supervised learning, there are two disjoint data sets
The first term is estimated over the small labeled subset
Methodology
Figure 1 illustrates our proposed Con2Mix framework, containing 4 parts: (1) triplet mixup data augmentation on the minority (vulnerable) class to address the imbalance in the tabular security data set; (2) contrastive and feature reconstruction loss to train the encoder and the decoder; (3) pseudo-labeling of the subset of the unlabeled data using a label propagation technique; and (4) downstream tasks that train the predictor (e.g., MLP) with the fixed trained encoder.
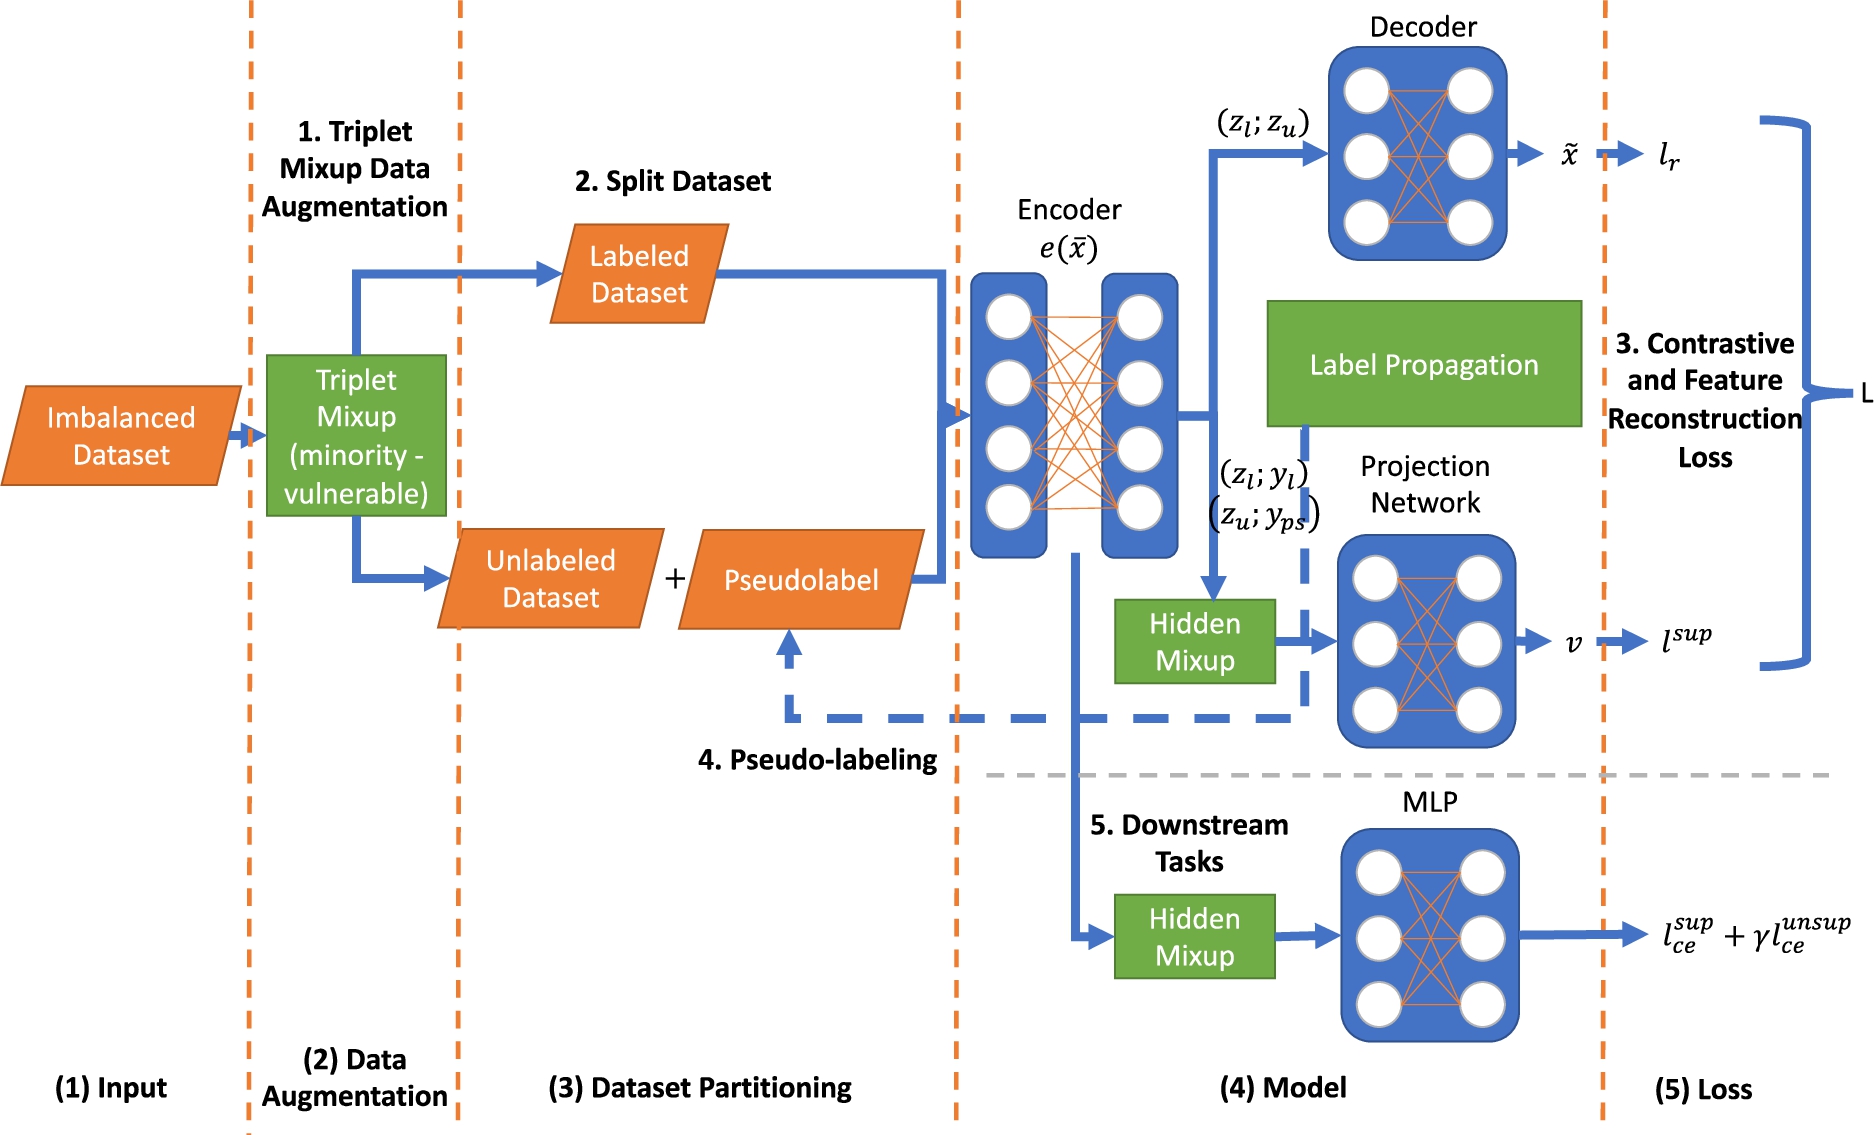
Overview of Con2Mix. (1) for the imbalanced dataset, we first apply a triplet mixup data augmentation on positive classes (vulnerable cases) to get a more balanced dataset. (2) we split the dataset into the labeled dataset and unlabeled dataset with a labeled ratio (e.g., 0.1). (3) through an encoder and decoder, we get the feature reconstruction loss
This section proposes our novel data augmentation technique to generate more minority examples. By generating more minority examples, this method makes the data set more balanced, so that successfully helps imbalanced issues in the imbalanced tabular data.
Traditional Mixup [66] augments data between a data pair:
For example, if we have three data points
Triplet Mixup can not only fit tabular domains but also can apply to computer vision and natural language procession domains with certain changes in the representation of the data.
Contrastive and feature reconstruction loss
In addition to the data augmentation to the input data, we also do mixup data augmentation in the hidden space. Given an encoder e, that is comprised of T layers
As shown in Fig. 1, we represent latent representation of labeled samples as
In addition to the contrastive loss term, the encoder is trained to minimize the feature reconstruction loss via a decoder
We first train the encoder using this loss term over K epochs to warm-start the representations in the latent space prior to pseudo-labeling and leverage the unlabeled samples.
Pseudo-labeling
Until now we have only used the labeled set
Downstream tasks
After pre-training the encoder, the encoder is fixed and will be used for downstream tasks (see Fig. 1) with the generated pseudo-labels to train the predictor (e.g., MLP). We leverage Mixup augmentation [66] in the latent space and feed samples to a set of fully connected layers. The training loss for the downstream tasks is combined with the cross-entropy loss for supervised (
Algorithm
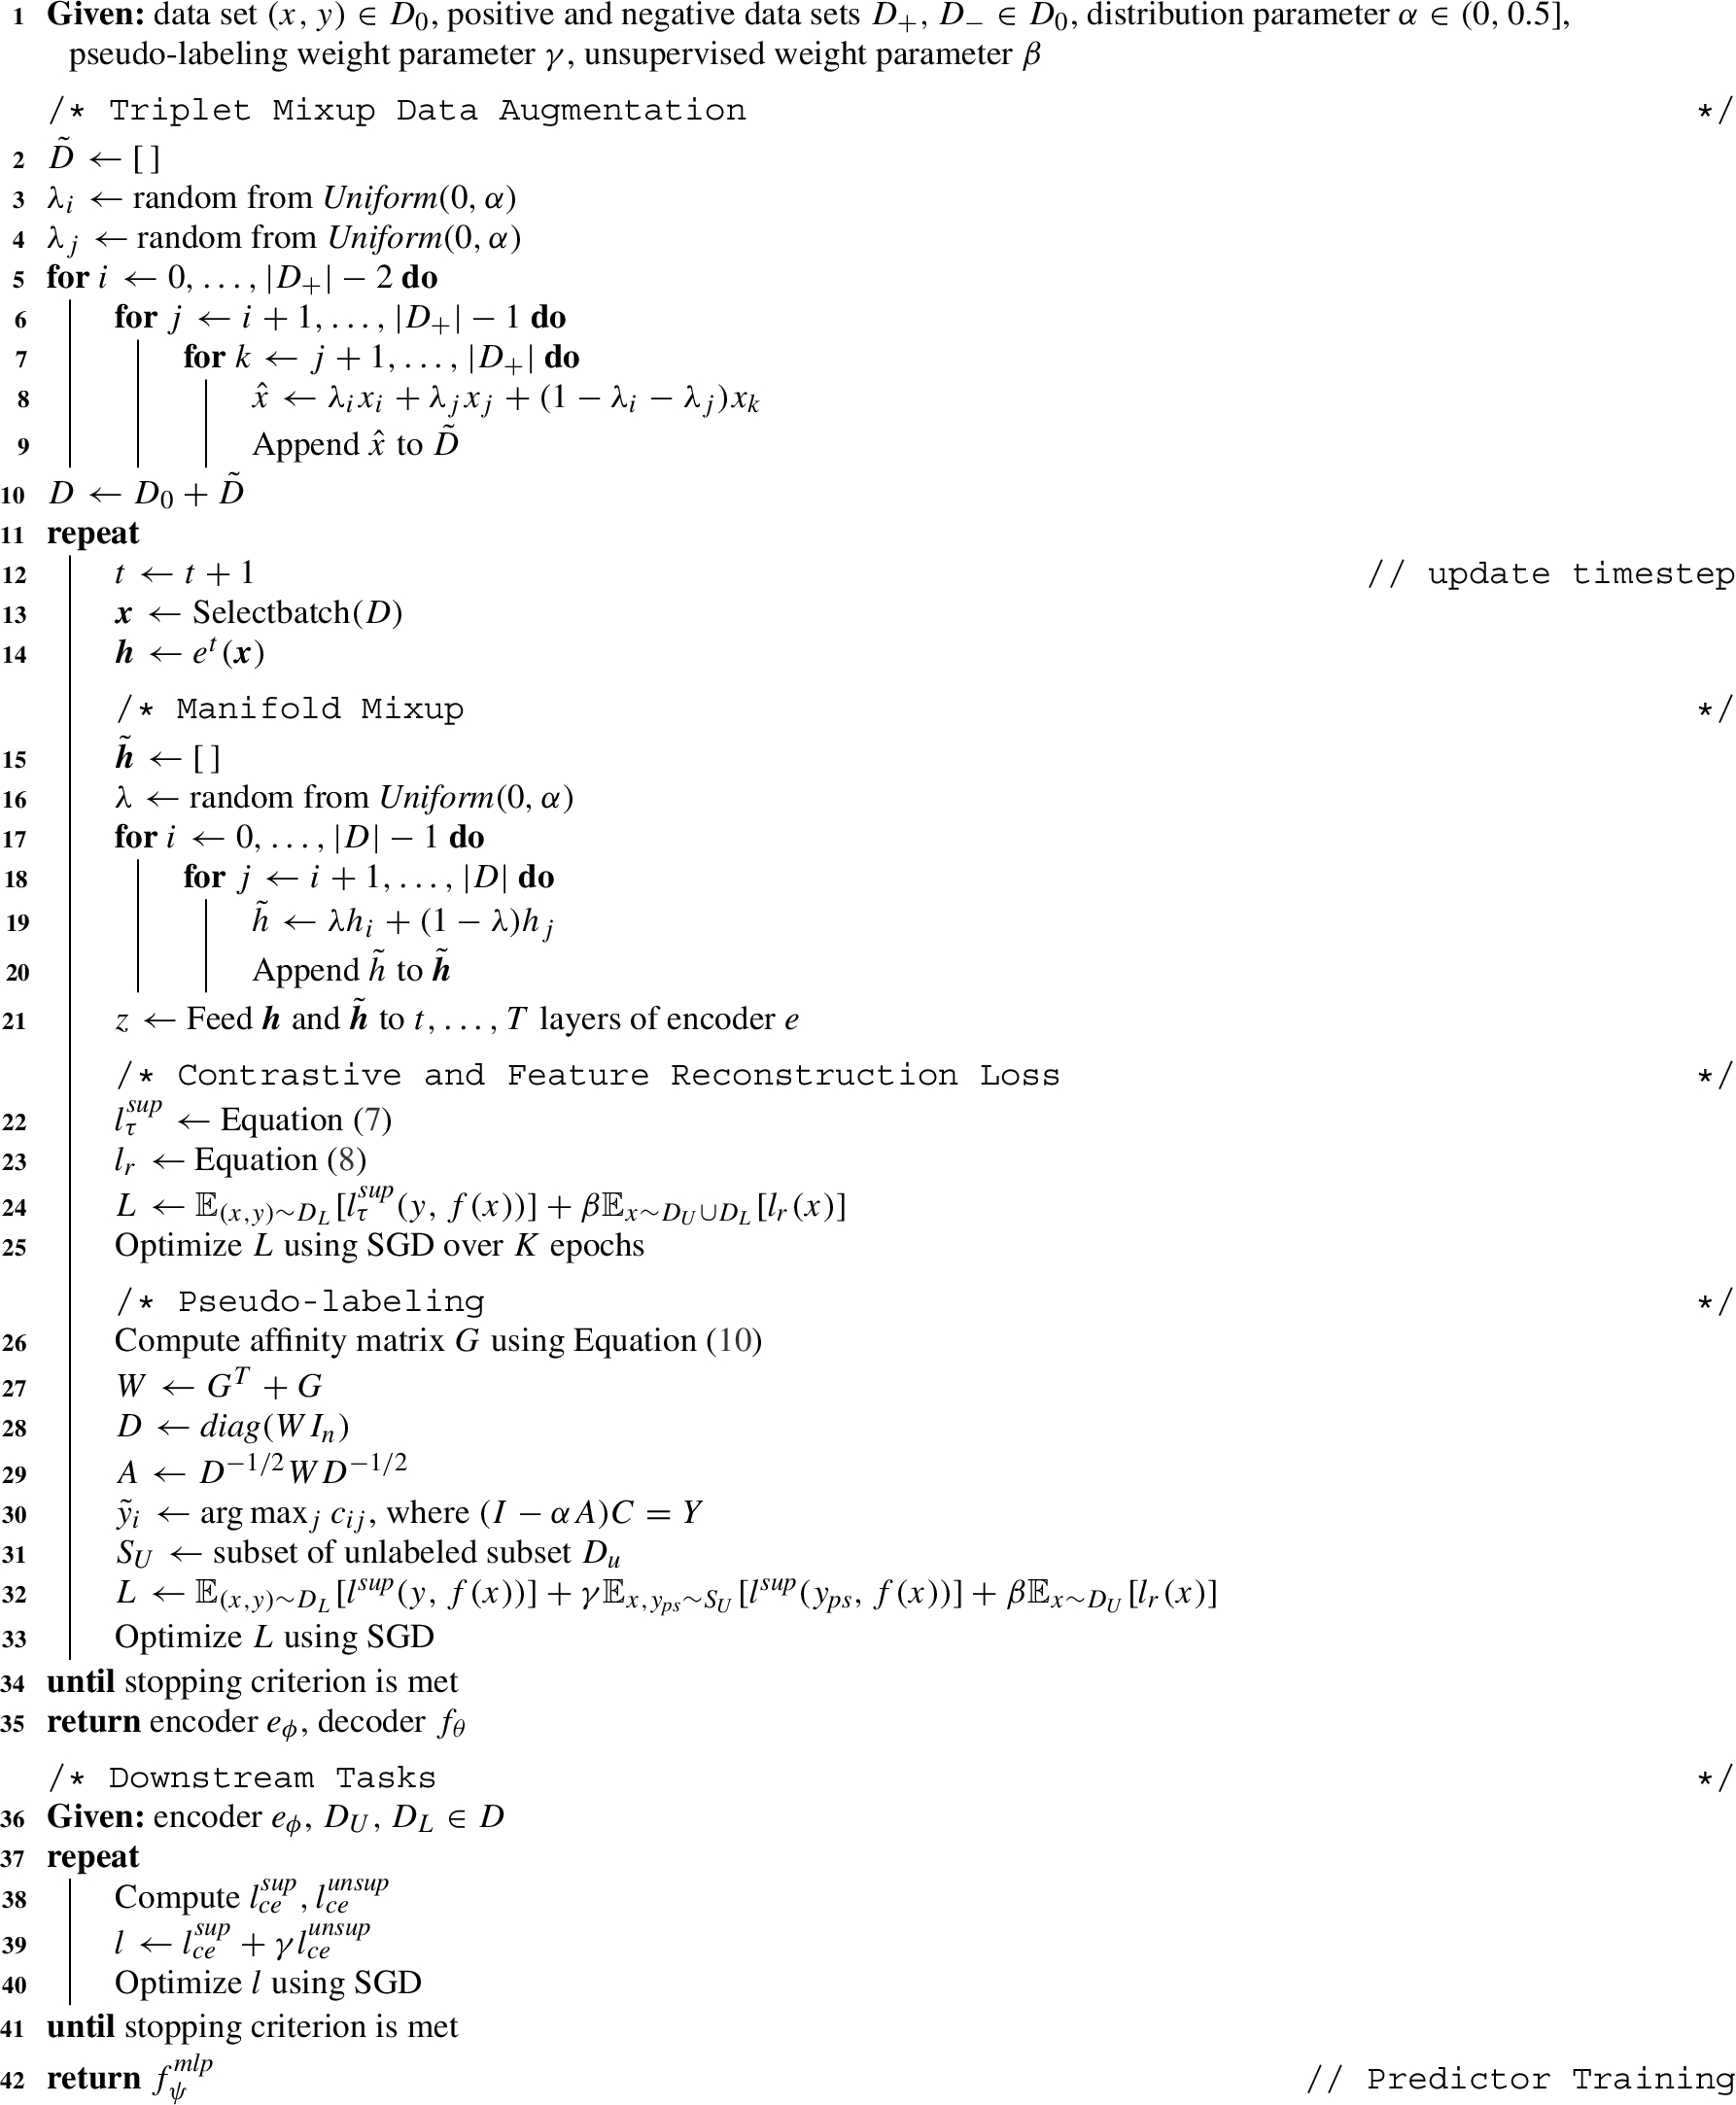
Algorithm 1 integrates all four parts of our proposed Con2Mix method into a single pseudo-code. Triplet mixup data augmentation comprises lines 2–10, manifold mixup comprises lines 15–21, contrastive and feature reconstruction loss comprises lines 22–25, and pseudo-labeling comprises lines 26–30. Line 32 represents the total loss including pseudo-labeling. As mentioned in line 25, we first optimize the contrastive and feature reconstruction loss over K epochs, then add pseudo-labeling to the loss term. Lines 36–41 represent downstream tasks: the predictor training using the cross entropy loss with both of the supervised and unsupervised parts.
Con2Mix
This section demonstrates the superiority of our method on a large, imbalanced tabular security data set that we manually assembled from NVD and open source repositories (see Section 2.2). The data set 1 contains 5692 records with 53 positive (vulnerable) cases and 5639 negative (non-vulnerable) cases, making data augmentation essential. We also do experiments on a less imbalanced data set, data set 2, which contains more positive cases (4491 records with 165 positive cases and 4326 negative cases) and get similar results.
We compare our method with 6 supervised methods (XGBoost [6], MLP, Logit Regression, SVM, Decision Tree, and KNN) and two state-of-the-art semi-supervised methods on tabular domains (VIME [63] and Contrastive Mixup [14]) with or without our proposed Triplet Mixup data augmentation. We compare our data augmentation method with existing down-sampling and SMOTE [5] up-sampling methods. We do experiments with different mixup strategies and demonstrate why triplet is superior. In addition, we compare with the pairwise mixup data augmentation with different loss functions, and show that our method with standard cross entropy loss function performs best among all the loss functions. We also do experiments with different labeled ratios and choose 0.1 as our labeled ratio for semi-supervised learning.
All the experimental results record accuracy, precision, recall, TPR (true positive rate), TNR (true negative rate), micro F1 score, macro F1 score, and weighted F1 score. Positive means vulnerable and negative means non-vulnerable. For the security data set, we assign more importance to the recall and TPR.
Results
Main experimental results
Table 4 shows the main experimental results of our method compared with 6 supervised methods and 2 semi-supervised methods (labeled ratio 0.1). We separate the experiments into 2 parts: (1) without triplet mixup data augmentation (upper part) and (2) with triplet mixup data augmentation (lower part). The upper part of Table 4 shows that without triplet mixup data augmentation, even the accuracy and TNR are near 100, and the precision, recall, and TPR are all 0, which means that all the methods can only predict negative data and not the positive (vulnerable) data sought by defenders. The results show all the methods perform poorly on imbalanced tabular security data without triplet data augmentation no matter how many labeled data the model utilizes.
Main experimental results on Data Set 1. Top two are shaded and best is bold
Main experimental results on Data Set 1. Top two are shaded and best is bold
The lower part of Table 4 applies triplet mixup data augmentation to the original positive data to obtain 17798 data with 4554 original data. The experimental results show that Con2Mix achieves the best recall and TPR (66.67) with only 0.1 labeled data (1779/17798). Although Logit Regression and VIME also achieve the same recall and TPR, they all exhibit worse performance according to the other metrics. In addition, Logit Regression is a supervised method utilizing all the labeled data, wheras our method uses only 0.1 labeled data. Thus, our method Con2Mix achieves the best performance among all the tested methods.
Table 5 shows the main experimental results of our method on data set 2. When we add our triplet mixup data augmentation, we can see that the results of all the methods increase (recall and tpr increase). Even logit regression and VIME achieve the best recall and tpr (100 and 96.43), other metrics of their models are low (accuracy of VIME is 19.04, and the accuracy of logit regression is 13.59). Thus, except for logistic regression and VIME, our method achieve the best recall and tpr (75.00) with much higher other metrics.
Main experimental results on Data Set 2. Top two are shaded and best is bold
Here, we assign more attention to the metrics TPR and Recall rather than other methods as it is more important to detect positive (vulnerable) data in the security domain. Sometimes we need to sacrifice other metrics to guarantee a higher TPR and Recall.
Table 6 compares our triplet mixup data augmentation method with a down-sampling (reduce the data points) and an up-sampling method (SMOTE [5]). Compared with down-sampling and SMOTE, our method achieves the best recall, TPR (66.67), and precision (3.95), demonstrating that our method is better overall. Down-sampling reduces negative samples, losing information from the negative samples. In contrast, up-sampling generates more samples from the positive samples. SMOTE generates positive samples by adding small amounts to positive samples. However, our method leverages more information from positive samples by mixing-up triple data points.
Experimental results with different sampling methods on Data Set 1. Top two are shaded and best is bold
Experimental results with different sampling methods on Data Set 1. Top two are shaded and best is bold
Table 7 compares different mixup strategies: pairwise, quadruplet, pairwise + original (mixing a pair of data points including the output of pairwise mixup), pairwise + triplet (mix a pair of data points followed by triplet mixup, including the output of pairwise mixup). Triplet achieves the best recall and TPR (66.67). Although pairwise + original and pairwise + triplet achieve the same recall and TPR, Triplet achieves the best accuracy, precision, TNR, and F1 scores. Pairwise does not generate enough augmentations, while quadruplet generates too many. Triplet achieves the best results compared with mixed ones because it combines triple data with balanced weights.
Experimental results with different mixup strategies on Data Set 1. Top two are shaded and best is bold
Experimental results with different mixup strategies on Data Set 1. Top two are shaded and best is bold
Table 8 compares different loss functions aiming to deal with the data imbalance problem. We first apply pairwise mixup data augmentation on the original data and run experiments with different loss functions: Focal Loss [35], CB (Class Balanced) Loss [12], and Weighted CE (Cross Entropy) Loss. Weighted CE means cross entropy loss with weights 1 and 10 for the majority and minority classes, respectively. Our model uses the standard cross entropy loss. Our method achieves the highest TPR of 66.67 compared with only 44.44 by the others, while maintaining high levels for all other metrics.
Experimental results with different loss functions on Data Set 1. Top two are shaded and best is bold
Experimental results with different loss functions on Data Set 1. Top two are shaded and best is bold
We do ablation study with two important components: (1) Triplet Mixup Data Augmentation (Input Mixup), and (2) Mixup in Hidden Layers (Hidden Mixup). Table 9 shows the results after removing each mixup. From Table 9, we can see that without input mixup, the model cannot handle positive (vulnerable) cases. After adding the triplet mixup data augmentation, even without hidden mixup, the recall and TPR increase from 0 to 66.67. After adding the hidden mixup, other metrics except recall and TPR increase slightly.
Ablation study on Data Set 1. Top two are shaded and best is bold
Ablation study on Data Set 1. Top two are shaded and best is bold
The most important parameter in our work is the labeled ratio. Table 10 examines ratios from 0.01 to 0.90. A ratio of 0.01 yields recall and TPR of 100 with accuracy of only 2.64 and TNR of only 1.86, which means the model performs very poorly on the security data set due to lack of labeled data. Setting the ratio from 0.02 to 0.10 achieves the best recall and TPR (66.67) among all the labeled ratios except 0.01. A ratio of 0.10 achieves the best accuracy, precision, TNR, and F1 scores; whereas increasing it from 0.15 to 0.90 decreases the recall and TPR to 11.11 with other metrics increasing slightly. This means the model overfits the data set. Thus, we choose 0.10 as the most appropriate labeled ratio.
Experimental results with different labeled ratios on Data Set 1
Experimental results with different labeled ratios on Data Set 1
Semi-supervised learning techniques are widely used in image and language domains due to the ease of data augmentation. However, in security domains, the data are typically in a tabular format, which makes augmentation challenging as it lacks context and leads to significant information loss. Tabular security datasets also suffer from a high degree of class imbalance, with ratios like 1:100 or 1:50 between positive (vulnerable) and negative (non-vulnerable) cases. Traditional methods, such as down sampling and up sampling (e.g. [5]), struggle to effectively address this issue. To tackle the problem, researchers have proposed various approaches including set convolution [22] and episodic training aiming to extract representative samples for each class to achieve a balanced class distribution. Focal loss [35] reshapes the standard cross-entropy loss to prioritize difficult examples during training. Class-balanced loss [12] employs re-weighting based on the effective number of samples for each class. Alternatively, we present a novel technique called triplet mixup data augmentation that focuses on augmenting minority data. Triplet mixup goes beyond pairwise mixup by combining three data points from the same class, effectively integrating their features.
Experimental results demonstrate the effectiveness of our proposed method compared to previous approaches. Additionally, we apply manifold mixup in the hidden space and leverage unlabeled samples through pre-training the encoder and using label propagation to generate pseudo-labels. The trained encoder and samples with pseudo-labels are then used for a downstream task, where a simple predictor with mixup augmentation is trained. Our method is not limited to the specific data sets we utilize; instead, it can be applied to various tabular data sets since the theory and framework are designed for general tabular data. Moreover, our method is particularly valuable for addressing the challenge of imbalanced tabular data sets, as the triplet mixup technique is specifically tailored to tackle the issue of class imbalance.
Conclusion and future work
This paper proposed and evaluated Con2Mix, a novel semi-supervised machine learning method for analyzing highly imbalanced tabular security data sets. The method includes 4 components: (1) Triplet Mixup Data Augmentation, (2) Contrastive and Feature Reconstruction Loss, (3) Pseudo-labeling, and (4) Downstream Tasks. Comparison of Con2Mix with 6 supervised methods and 2 state-of-the-art semi-supervised methods in tabular domains shows that without the triplet mixup data augmentation, all the methods perform poorly (with 0 precision, recall, and TPR) on the data set. After adding our proposed triplet mixup data augmentation, the results improve substantially, with Con2Mix achieving the best recall and TPR (66.67). Future research should explore generalizing our technique to additional data sets in other domains. To enhance our proposed method, our plan is to work on graph data sets, such as CFGs, CPGs, and ASTs extracted from open-source applications to detect software vulnerabilities at the source and binary levels. Our proposed method will help the developers or experts to automatically label the graphs related to each function and component.
Footnotes
Acknowledgment
The research reported herein was supported in part by NSF awards DMS-1737978, DGE-2039542, OAC-1828467, OAC-1931541, and DGE-1906630, ONR awards N00014-17-1-2995 and N00014-20-1-2738, DARPA FA8750-19-C-0006, Army Research Office Contract No. W911NF2110032 and IBM faculty award (Research).