
Abstract
Research into the relationships between commuting and other activities has been hampered by the lack of suitably comprehensive datasets. This paper identifies a possible source of detailed information for such studies, the American Time Use Survey (ATUS). This paper surveys approaches used by researchers to analyze commuting in the ATUS and outlines a method of measuring commuting in a clear and consistent way. This analysis details the advantages of this method over other approaches. Commuting measured in the ATUS using this methodology is shown to be consistent with commuting measures in other large, nationally representative studies. The proposed methodology makes possible a range of analyses exploiting the unique information in the ATUS.
Introduction
Commuting plays a major role in the labor market decisions, time use, and satisfaction of many Americans. The commute acts as a fixed cost (in both time and money) to labor force participation. Commuting time limits the amount of time available for other activities. Length of commute can affect which jobs are available to job seekers, limiting potential labor markets. Additionally, commuting may play a significant role in happiness and satisfaction. Kahneman et al. [1], for example, provide evidence that commuting ranks as one of the least desirable activities undertaken by workers. Because of these varied impacts on labor supply, location decisions, and general well-being, commuting has been the focus of study by a variety of researchers. The scope of this research in the United States has been limited by the availability of a nationally representative survey with information on both commuting behavior and an array of other characteristics.
The American Time Use Survey (ATUS) collects extensive information on how Americans spend their time, including all episodes of travel time. While it does not distinguish between commuting and other travel episodes, it has advantages over other available surveys. The ATUS contains respondent characteristics that commonly used transportation datasets lack, such as wage and salary information. Moreover, unlike transportation surveys and other large surveys, the ATUS captures other uses of time on the same day. This includes the details of time spent on work, which could allow for further classifying commuting behavior. Furthermore, additional ATUS modules are available, making possible the use of data on other respondent characteristics such as eating and health information. The survey design also yields linkages to CPS panels with additional data.
Researchers have begun to analyze commuting behavior using the ATUS, though the commuting measures they use have significant flaws. For example, Deloach and Tiemann [2] draw conclusions about the characteristics of commuting in the U.S. using an activity code that corresponds only partially to commuting. Ali [3] and Giménez-Nadal et al. [4, 5] also use this measure in their analyses. Christian [6] exploits the unique advantages of the ATUS to examine tradeoffs between commuting time and time spent on health-related activities, but constructs a commuting measure which appears to overstate travel time. By contrast, Stone and Schneider [7] use the method outlined in this paper.
For this analysis, commutes are defined generally as trips from home to work or from work to home. Classifying direct trips – with no stops along the way to perform any other tasks – as commuting is straightforward. Problems arise when an individual stops along the way between home and work, because it is not evident which of this travel is commuting and which is primarily intended to reach other destinations. The methodology detailed in this paper provides a consistent means of accounting for stops when measuring and analyzing commuting behavior in the ATUS.
American Time Use Survey (ATUS)
The ATUS is an annual, national time use survey administered by the Bureau of Labor Statistics (BLS). One respondent per household is chosen from a subset of households which have recently completed the Current Population Survey (CPS) to provide a diary of all activities performed in a 24-hour period.1 Begun in 2003, data are now available for years 2003 through 2017, with about 14,000 respondents per year.
Commuting travel classification
The reported and coded activities include travel episodes. ATUS respondents are not asked to provide the purpose of any trips, nor are they asked to identify travel specifically. Instead, a spell is coded as travel if it involves movement from one location to another. Overall, estimates of the total amount of time spent traveling in a day from the ATUS appear to be comparable to those using National Household Transportation Survey (NHTS) data, as demonstrated by Bose and Sharp [8] and Yennamani and Srinivasan [9]. However, classification of travel time by its purpose is inexact. Several possible methods for classifying commuting time are detailed below.
Most researchers examining commuting in the ATUS have used the activity code for “travel related to work”,2 including Deloach and Tiemann [2], Ali [3], and Giménez-Nadal et al. [4, 5]. Activities classified under this code meet one of two criteria:
Travel occurring immediately before work activities, or Travel occurring immediately after work, provided that the next activity takes place at home.
This activity code does not correspond directly to commuting in two main ways. First, because travel that is directly followed by work is generally coded as work-related travel, it contains some travel that is not commuting. For example, the return trip to work from an errand during the middle of the work day would in general be classified as travel related to work. More significantly, it excludes many commuting spells when stops are made along the way between home and work. Notably, this effect is asymmetrical, impacting the trip to work differently from the trip home. If a worker reports stopping to perform another activity along the way to work, the last travel spell is generally coded as work-related travel. However, stopping on the way from work to home means that no travel from this commute leg is classified as travel related to work. Because of these shortcomings, this activity code is a poor measure of commuting.
Brown and Borisova [10] propose an alternative methodology for reclassifying travel between home and work, which Christian [6] adopts in an analysis of commuting and health-related activities. Hamrick and Hopkins [11] employ a modified version of this methodology in an examination of travel to grocery stores. The Brown and Borisova methodology considers all travel between home and work to be commuting, regardless of the number or length of stops. For individuals starting and ending at home, this can be thought to provide an upper bound of commuting time, but including all travel between the two likely substantially overestimates commuting time.
The trip tour methodology outlined by McGuckin and Nakamoto [12] addresses the fundamental issue of assigning trip purpose to reported travel in trip chains. Classifying travel in this way necessitates the following terminology:
Trip chains: sequences of travel with stops;
Trip tours: trip chains that, following the McGuckin and Nakamoto methodology, contain stops of no more than 30 minutes; and
Commuting trip tours: trip tours that begin at home and end at work or begin at work and end at home.
All trips in a trip chain that contains stops of no more than 30 minutes each are combined to form tours anchored by home, work, or another location. Using this framework, commuting trip tours are those that either begin at home and end at work, or begin at work and end at home. Therefore, this methodology classifies as commuting tours that contain no stop of more than 30 minutes and either begin at home and end at work or begin at work and end at home. The travel time (but not the stop time) on such tours is summed to calculate each worker’s commuting time.
The Department of Transportation applies this methodology to the NHTS data to produce datasets containing information on trip tours, so that measuring commuting in this way allows for direct comparison to this large U.S. transportation behavior dataset. Some travel will likely be misclassified, but the 30 minute cutoff represents a reasonable attempt to balance misclassification in either direction. For many analyses focusing on commuting, it is sensible to allow for brief stops along the way but not longer dwell times.
One drawback of allowing for stops along the commute is that some travel time included in the commuting measure may be used to perform tasks that would otherwise require separate trips. However, allowing for short stops makes possible comparisons of observed journey times between home and work across groups with different numbers of stops. As shown in Section 7, men and women tend to differ significantly in stops along the journey between home and work, and gender comparisons must rely on a measure that takes this into account.
In summary, two main methodologies have been previously applied to the ATUS, and this paper proposes a third. The “travel related to work” measure in the ATUS fails to capture significant amounts of commuting behavior. By contrast, including all travel between home and work, as in the Brown and Borisova measure, would be expected to classify too much travel as commuting. By allowing for relatively short stops along the way, the trip tour methodology represents a reasonable, though imperfect compromise. Subsequent sections examine how the differences among the three methodologies affect estimates of commuting behavior.
A sample of respondents from the 2008 wave of the ATUS is used to apply the trip tour methodology to ATUS data while maintaining comparability to the NHTS sample.3 The sample is limited to respondents between the ages of 25 and 60 who are employed.4 Because work and commuting patterns differ significantly on weekends, the sample is limited to weekdays.
The trip tour methodology requires information about the origin and destination of trips, based on the activities that precede and follow the travel spells. Therefore, it is necessary for these spells to have both activity information and location. However, ATUS respondents are not generally asked to provide a location for “personal care” activities, which include such common activities as sleeping, bathing, and grooming. This is of particular concern since many people, after waking in the morning, report only engaging in other personal care activities before leaving the house. As a result, a sizable portion of this sample does not report an activity location before traveling in the morning. To address this all sleep spells occurring at the beginning and end of the ATUS diary day (that is, beginning before 4 A.M. or ending after 4 A.M.) are treated as occurring at the respondent’s home. While this may misclassify the location of some sleep spells, it seems a reasonable assumption for the vast majority of respondents. To link this to the location of the respondent at the beginning or end of travel, it is further assumed that consecutive personal care spells with no intervening travel take place in the same location.
After supplying a location for these personal care activities, the sample is limited to those who begin and end the diary day at home. This produces a sample of 3,009 time diaries for individuals who are at home at 4 A.M. and return home by 4 A.M.5
Comparing the three ATUS methodologies
The simplest commutes to classify are direct trips from home to work or from work to home. These may contain multiple travel segments by different modes, but do not involve stops along the journey to perform other tasks. As shown in Table 1, the majority of workers have at least one nonstop commute trip during the day: 55% have at least one direct trip from home to work and 45% have a direct trip from work to home. However, only 35% have a commute on the diary day consisting of at least one direct trip from home to work and at least one direct trip from work to home.6
Commute time and incidence, ATUS sample
Commute time and incidence, ATUS sample
Notes: Trip tours are chains of travel with no stop of more than thirty minutes. All travel between home and work includes all travel between the time a respondent is at home and at work, with no limitation on stop length. ATUS “travel related to work” is all travel with activity code 180501. Sample percentages are weighted using ATUS respondent probability weights.
Using the “travel related to work” activity code, somewhat more travel is classified as commuting. On average, respondents in the sample had 32 minutes of travel classified in the ATUS as “travel related to work”. As mentioned previously, this differs significantly from a measure of commuting trip tours. While it includes some travel that is not classified as commuting, overall this measure includes less travel than the commuting trip tour methodology. Primarily, this activity code does not include all travel when stops are made along the way. This is most pronounced in the to-home direction, with only 47% of the sample having travel classified as commuting to home using this measure.
The second measure includes all travel between home and work, as proposed by Brown and Borisova [10]. As shown in Table 1, this measure generates a significantly larger estimate of commuting time than the trip tour methodology. This is consistent with the increase in number of commute trips in the NHTS when no limits on stop length are imposed, as shown by McGuckin and Nakamoto [12].
Consistent with the trip tour methodology, consecutive travel spells are combined to form trip tours anchored by home, work, or other locations. Those tours with stops of more than 30 minutes somewhere other than home or work are excluded to generate a sample of commute tours, which are either home-to-work or work-to-home tours. Applying this methodology expands the proportion of the sample with commutes in each direction. The increase is slightly larger for the journey from home to work, with 70% of workers reporting at least one tour from home to work. Workers in the sample are more likely to stop on the way from work to home, and those stops are more likely to be greater than 30 minutes, so that only 60% of workers in this sample report trip tours from work to home.
Using the definition of a commuting trip tour as any tour beginning at home and ending at work or beginning at work and ending at home, with stops for no more than 30 minutes, the average daily commuting time in this sample is 38 minutes. For comparison, including only nonstop commute trips between home and work yields an average commute of 26 minutes.
Table 1 also shows the impact of different measures on the overall incidence of commuting. Using the trip tour methodology, 75% of individuals have some commuting travel. This is slightly more than the incidence of commuting measured using ATUS “travel related to work” (71%). Sixty-five percentages of individuals have a nonstop commute in at least one direction, while 76% have some travel between home and work allowing for stops of any length.
Figure 1 shows the proportion of the ATUS sample commuting, based on the three different methodologies, at 15 minute increments throughout the day. For all three measures, most commuting activity occurs, as expected, in the morning and early evening. The lines are more jagged in the late afternoon and evening, as respondents are more likely to be commuting on the hour and at 30 minutes past the hour than at 15 and 45 minutes past the hour. This results from quite a few respondents reporting travel starting exactly at these times and ending at irregular times.
This illustration demonstrates how the distribution throughout the day of travel classified as commuting differs for the various measures. In general, commuting trip tours include more travel than the ATUS measure of travel related to work, with a notable exception in the middle of the day. This is expected, since some workers are traveling to or between work-related tasks at this time without going home. Such travel would not generate a trip tour between home and work but could be classified as travel related to work in the ATUS. The difference between commuting trip tours and travel related to work is most pronounced in the early morning and later evening. The morning difference is consistent with the ATUS travel related to work code excluding the first travel spell to work if a stop is made. Similarly, this measure excludes travel home from work where stops are made; this appears to be most common for workers commuting between 5:00 and 6:00 P.M.
Percentage of individuals commuting throughout the day, ATUS sample. Source: 2008 ATUS sample of workers with limitations as described in text.
All travel between home and work includes only slightly more morning commuting than the commute trip tour measure, suggesting that few respondents are making stops longer than a half hour along the way to work in the morning. This difference is much more pronounced in the afternoon and evening, reflecting the greater tendency for workers to make long stops along the way home from work.
Table 2 details the differences in commuting incidence and time estimates using these three measures, both overall and by individual characteristics. In general, the trip tour methodology classifies as commuting more travel than the travel related to work measure, while less than the Brown and Borisova methodology. This is reflected in mean commuting time estimates, as well as commuting incidence (defined as the percent of respondents with any commuting) and two-way commuting incidence (defined as the percentage of respondents with commuting both to and from work on the given day). For the full sample, both the travel related to work and Brown and Borisova estimates of mean commuting time are statistically significantly different from the trip tour measure. This is shown in the rightmost columns of Table 2.
Statistically significant differences in estimates of commuting time persist for both measures over nearly all subgroups based on individual characteristics. Furthermore, these differences vary widely across some individual characteristics. For example, for men the trip tour methodology yields an additional 3.1 minutes of commuting time over the travel related to work measure. This difference is 8.3 minutes for women. The persistence of subgroup differences and the observed impact of the choice of measurement methodology on these differences underscore the need to choose an appropriate commuting measure, particularly for analyses of the relationship between commuting and individual characteristics.
Results of commuting classification using three methodologies
Notes: Sample of 2008 ATUS respondents. “TT” methodology is trip tour methodology. “B&B” is Brown and Borisova [10] methodology, i.e. all travel between home and work. “TRW” is ATUS “travel related to work,” i.e. all travel with activity code 180501. Sample percentages and means are weighted using ATUS respondent probability weights.
Since the wealth of information in the ATUS makes possible many analyses that cannot be performed using the NHTS, establishing that the ATUS commuting measure is comparable to the NHTS commuting measure would enhance the credibility of these results. Where the two measures differ it is important to note and explain the differences. Additionally, since the American Community Survey (ACS) is also frequently used in analyses of commuting behavior, where possible estimates from ACS data are compared to those constructed from travel and time diaries.
The 2009 NHTS sample is limited to those between the ages of 25 and 60 who provided a travel diary for travel on a weekday. This is further limited to workers who begin and end the day at home. This sample should correspond to the sample of ATUS respondents constructed above.7 The 2008 ACS is also used for some comparisons, where possible, and similarly limited to those between the ages of 25 and 60 who are employed.8
Sample average commute times are summarized in Table 3, comparing aggregate commuting measures in the NHTS and ATUS samples. As shown here, the estimates of commuting time to work from the ATUS sample mirror those from the NHTS sample. Moreover, the estimates of to-work travel time from the ATUS and NHTS are close to those from the ACS. Differences between the ACS and the other surveys are affected by the exclusion of individuals reporting no commuting. Many more respondents in the NHTS and ATUS report zero commuting than in the ACS. This is consistent with two major differences in the ACS. First, the ACS specifically asks respondents about usual travel time to work, encouraging them to report a non-zero amount. By contrast, the ATUS and NHTS do not ask separately about commuting, instead asking respondents to provide all activities or travel. Second, ACS respondents are asked to provide the usual travel time to work over the previous week, which would likely produce a non-zero response even if the respondent did not travel to work for some portion of the previous week. The ATUS and NHTS, by capturing only a single day, would yield more zero responses for such respondents.
Average commute times in minutes
Average commute times in minutes
Notes: Samples are constructed using restrictions described in text, weighted using sample weights.
For total commuting, the ATUS mean time of 37.7 minutes is close to the NHTS mean time of 37.0 minutes. When individuals with zero commuting time are excluded, the means differ more significantly. This is a direct result of the higher incidence of commuting in the ATUS than in the NHTS, shown in Table 4. While a similar percentage of respondents in the two surveys have commuting travel both to and from work, the ATUS has a higher incidence of commuting in only one direction or the other. Because of this, 35% of NHTS respondents have zero commuting time, while only 30% of ATUS respondents lack commuting time.
Commute time and incidence
Notes: Samples are constructed using restrictions described in text; means and percentages are weighted using sample weights. The trip tour methodology was applied to both the 2008 ATUS and 2009 NHTS samples.
Distributions of commute tours, ATUS and NHTS samples. Source: 2008 ATUS and 2009 NHTS samples with limitations as described in text.
These differences are examined in a different way in Fig. 2. Similar proportions of respondents report two or more commute tours in the NHTS and ATUS. However, significantly more ATUS respondents have a single commute tour; correspondingly, significantly fewer ATUS respondents have no commute tours. This is consistent with the results from Table 4 showing that more ATUS respondents have commuting in at least one direction, while similar numbers in the two surveys have commuting in both directions (roughly corresponding here to at least two commuting spells).
Percentage of individuals commuting throughout the day. Source: 2008 ATUS and 2009 NHTS samples with limitations as described in text.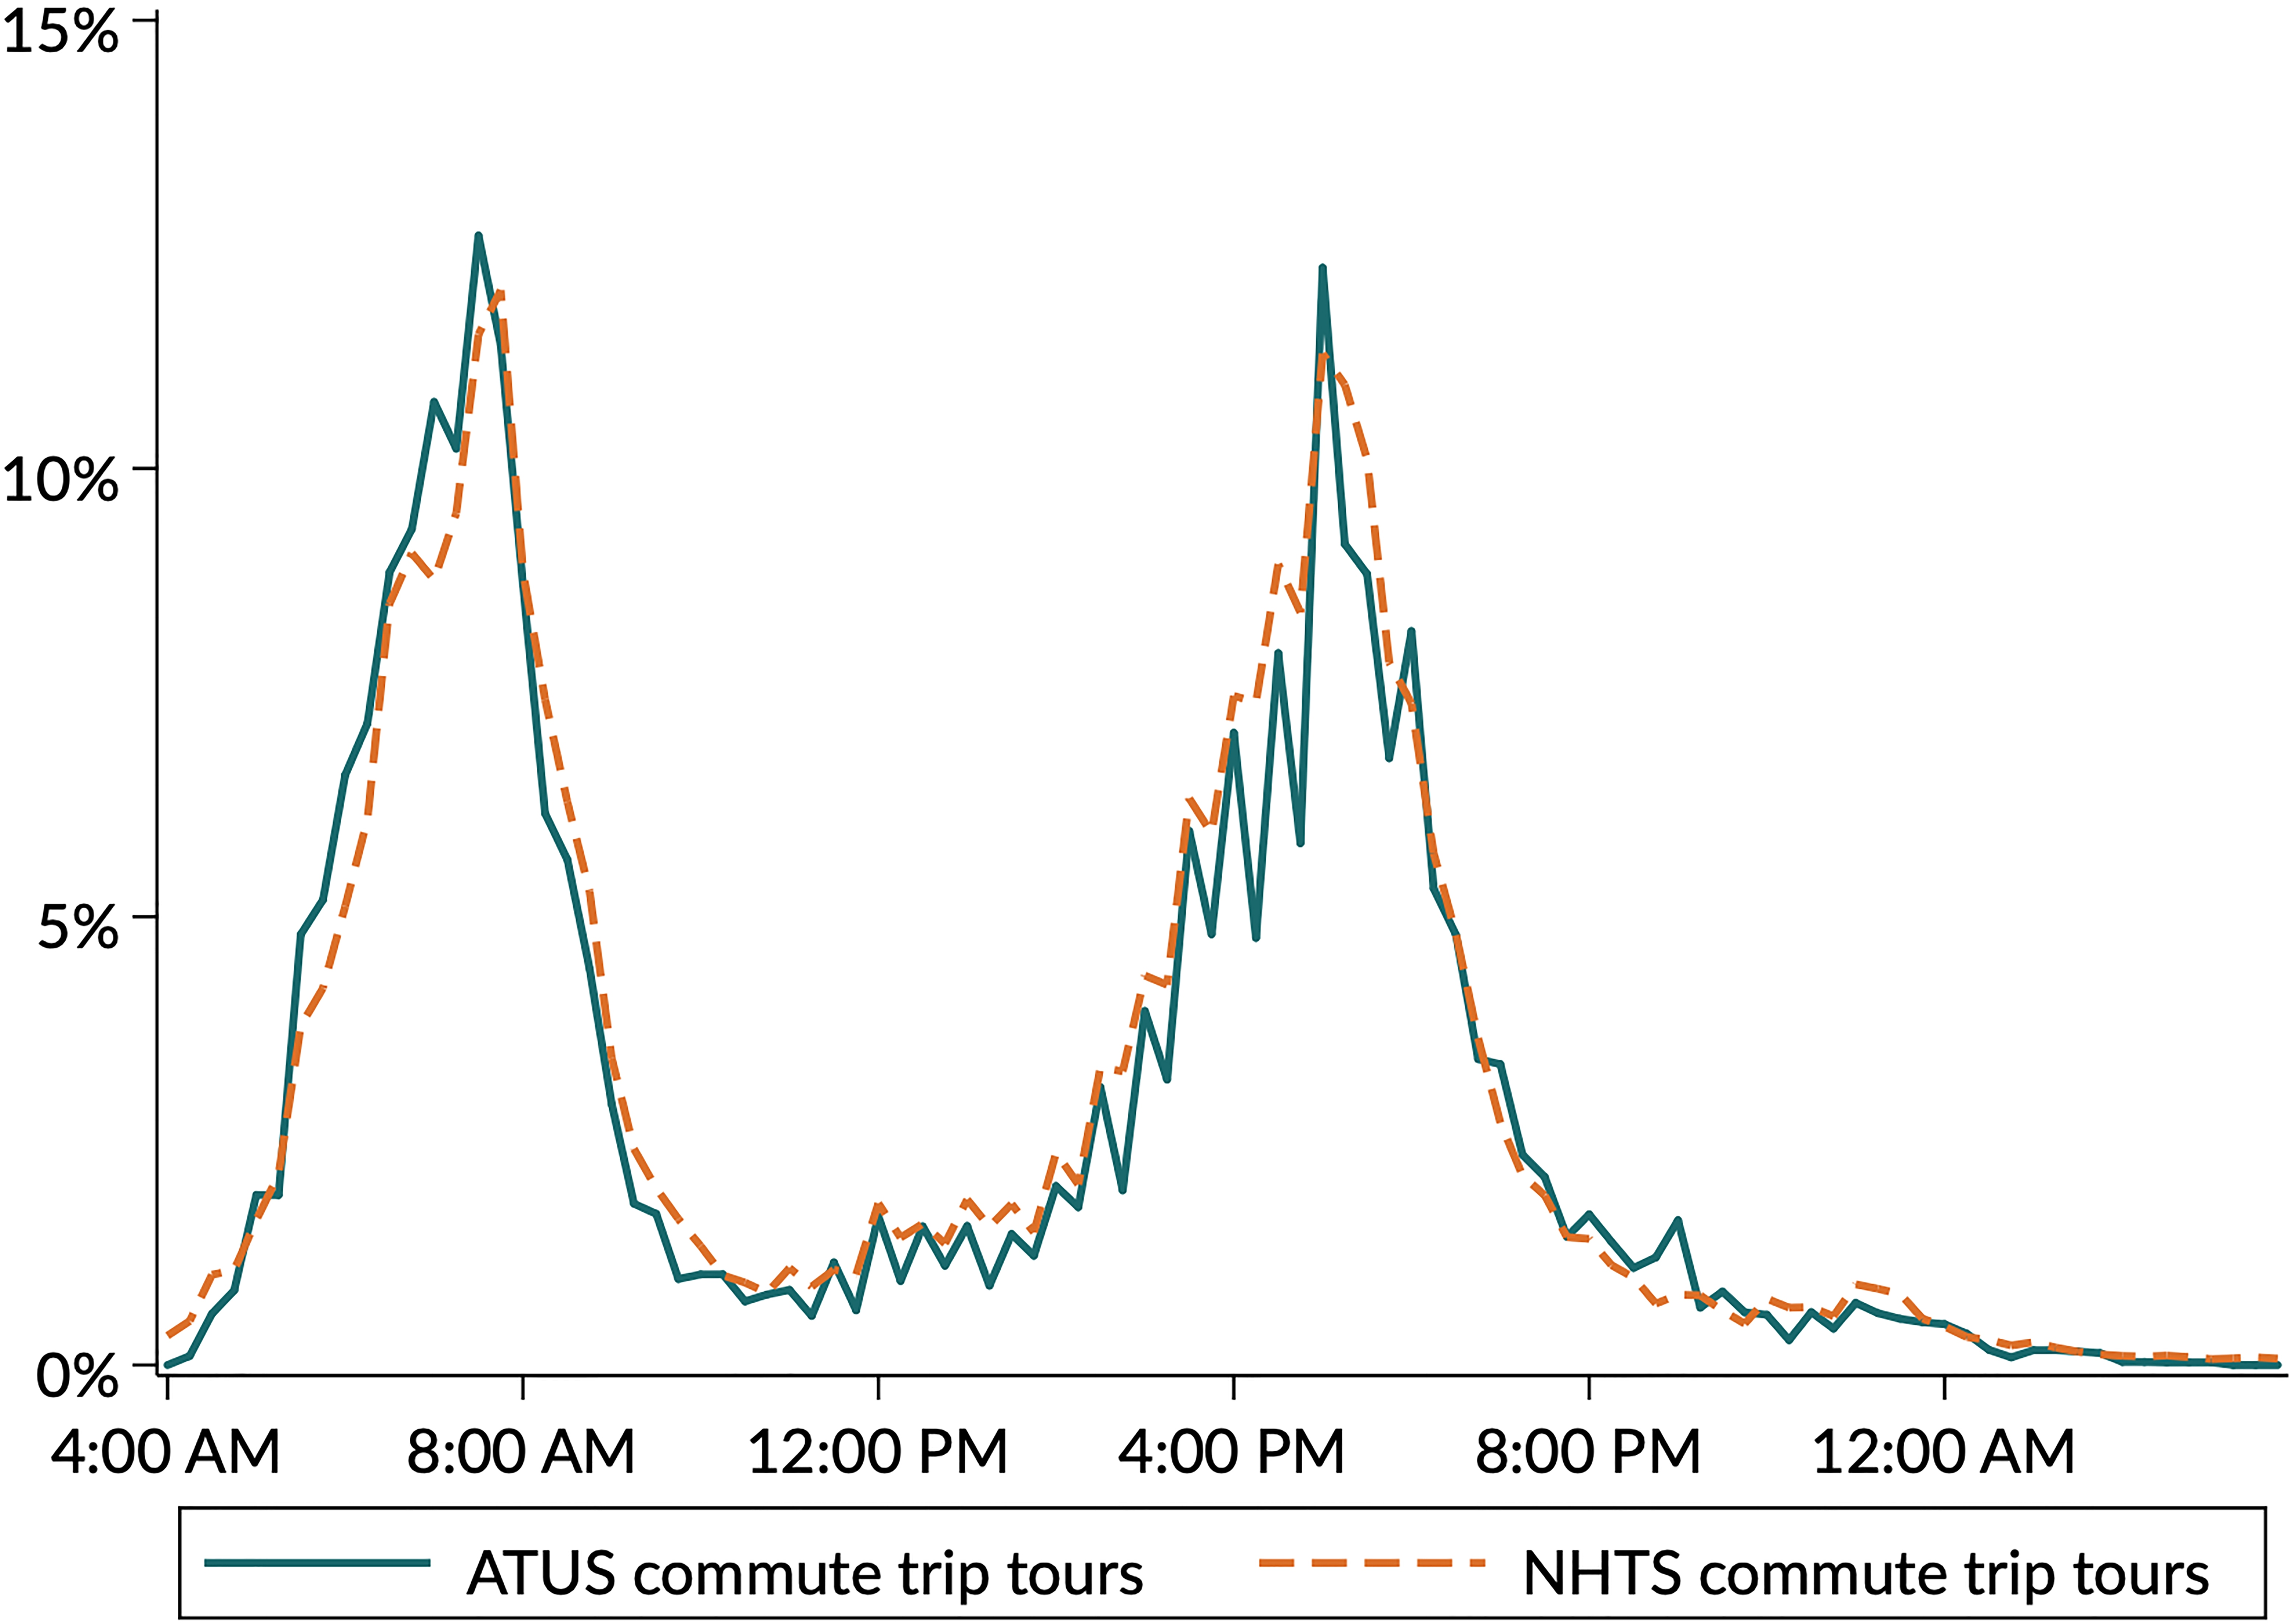
One major advantage of diary-based studies such as the ATUS and NHTS is that they make possible detailed analysis of the timing of activities. Because both the ATUS and NHTS provide the start and stop times for travel, it is possible to construct a figure analogous to Fig. 1 displaying the distribution of commuting across the day for ATUS and NHTS respondents. This comparison, shown in Fig. 3, shows the similarities in commuting travel captured by the trip tour methodology in the two samples. Overall, the two commuting profiles are very similar, though the ATUS sample appears to have slightly more travel classified as commuting in the morning and slightly less in the afternoon/evening. As in Fig. 1, the ATUS profile has a more jagged appearance, a result of more respondents reporting commuting on the hour or at 30 minutes past the hour than at other times. This effect is somewhat visible in the NHTS sample as well, but not to as great of an extent as in the ATUS.
Percentage of individuals commuting to work throughout the day. Source: 2008 ATUS, 2009 NHTS, and 2008 ACS samples with limitations as described in text.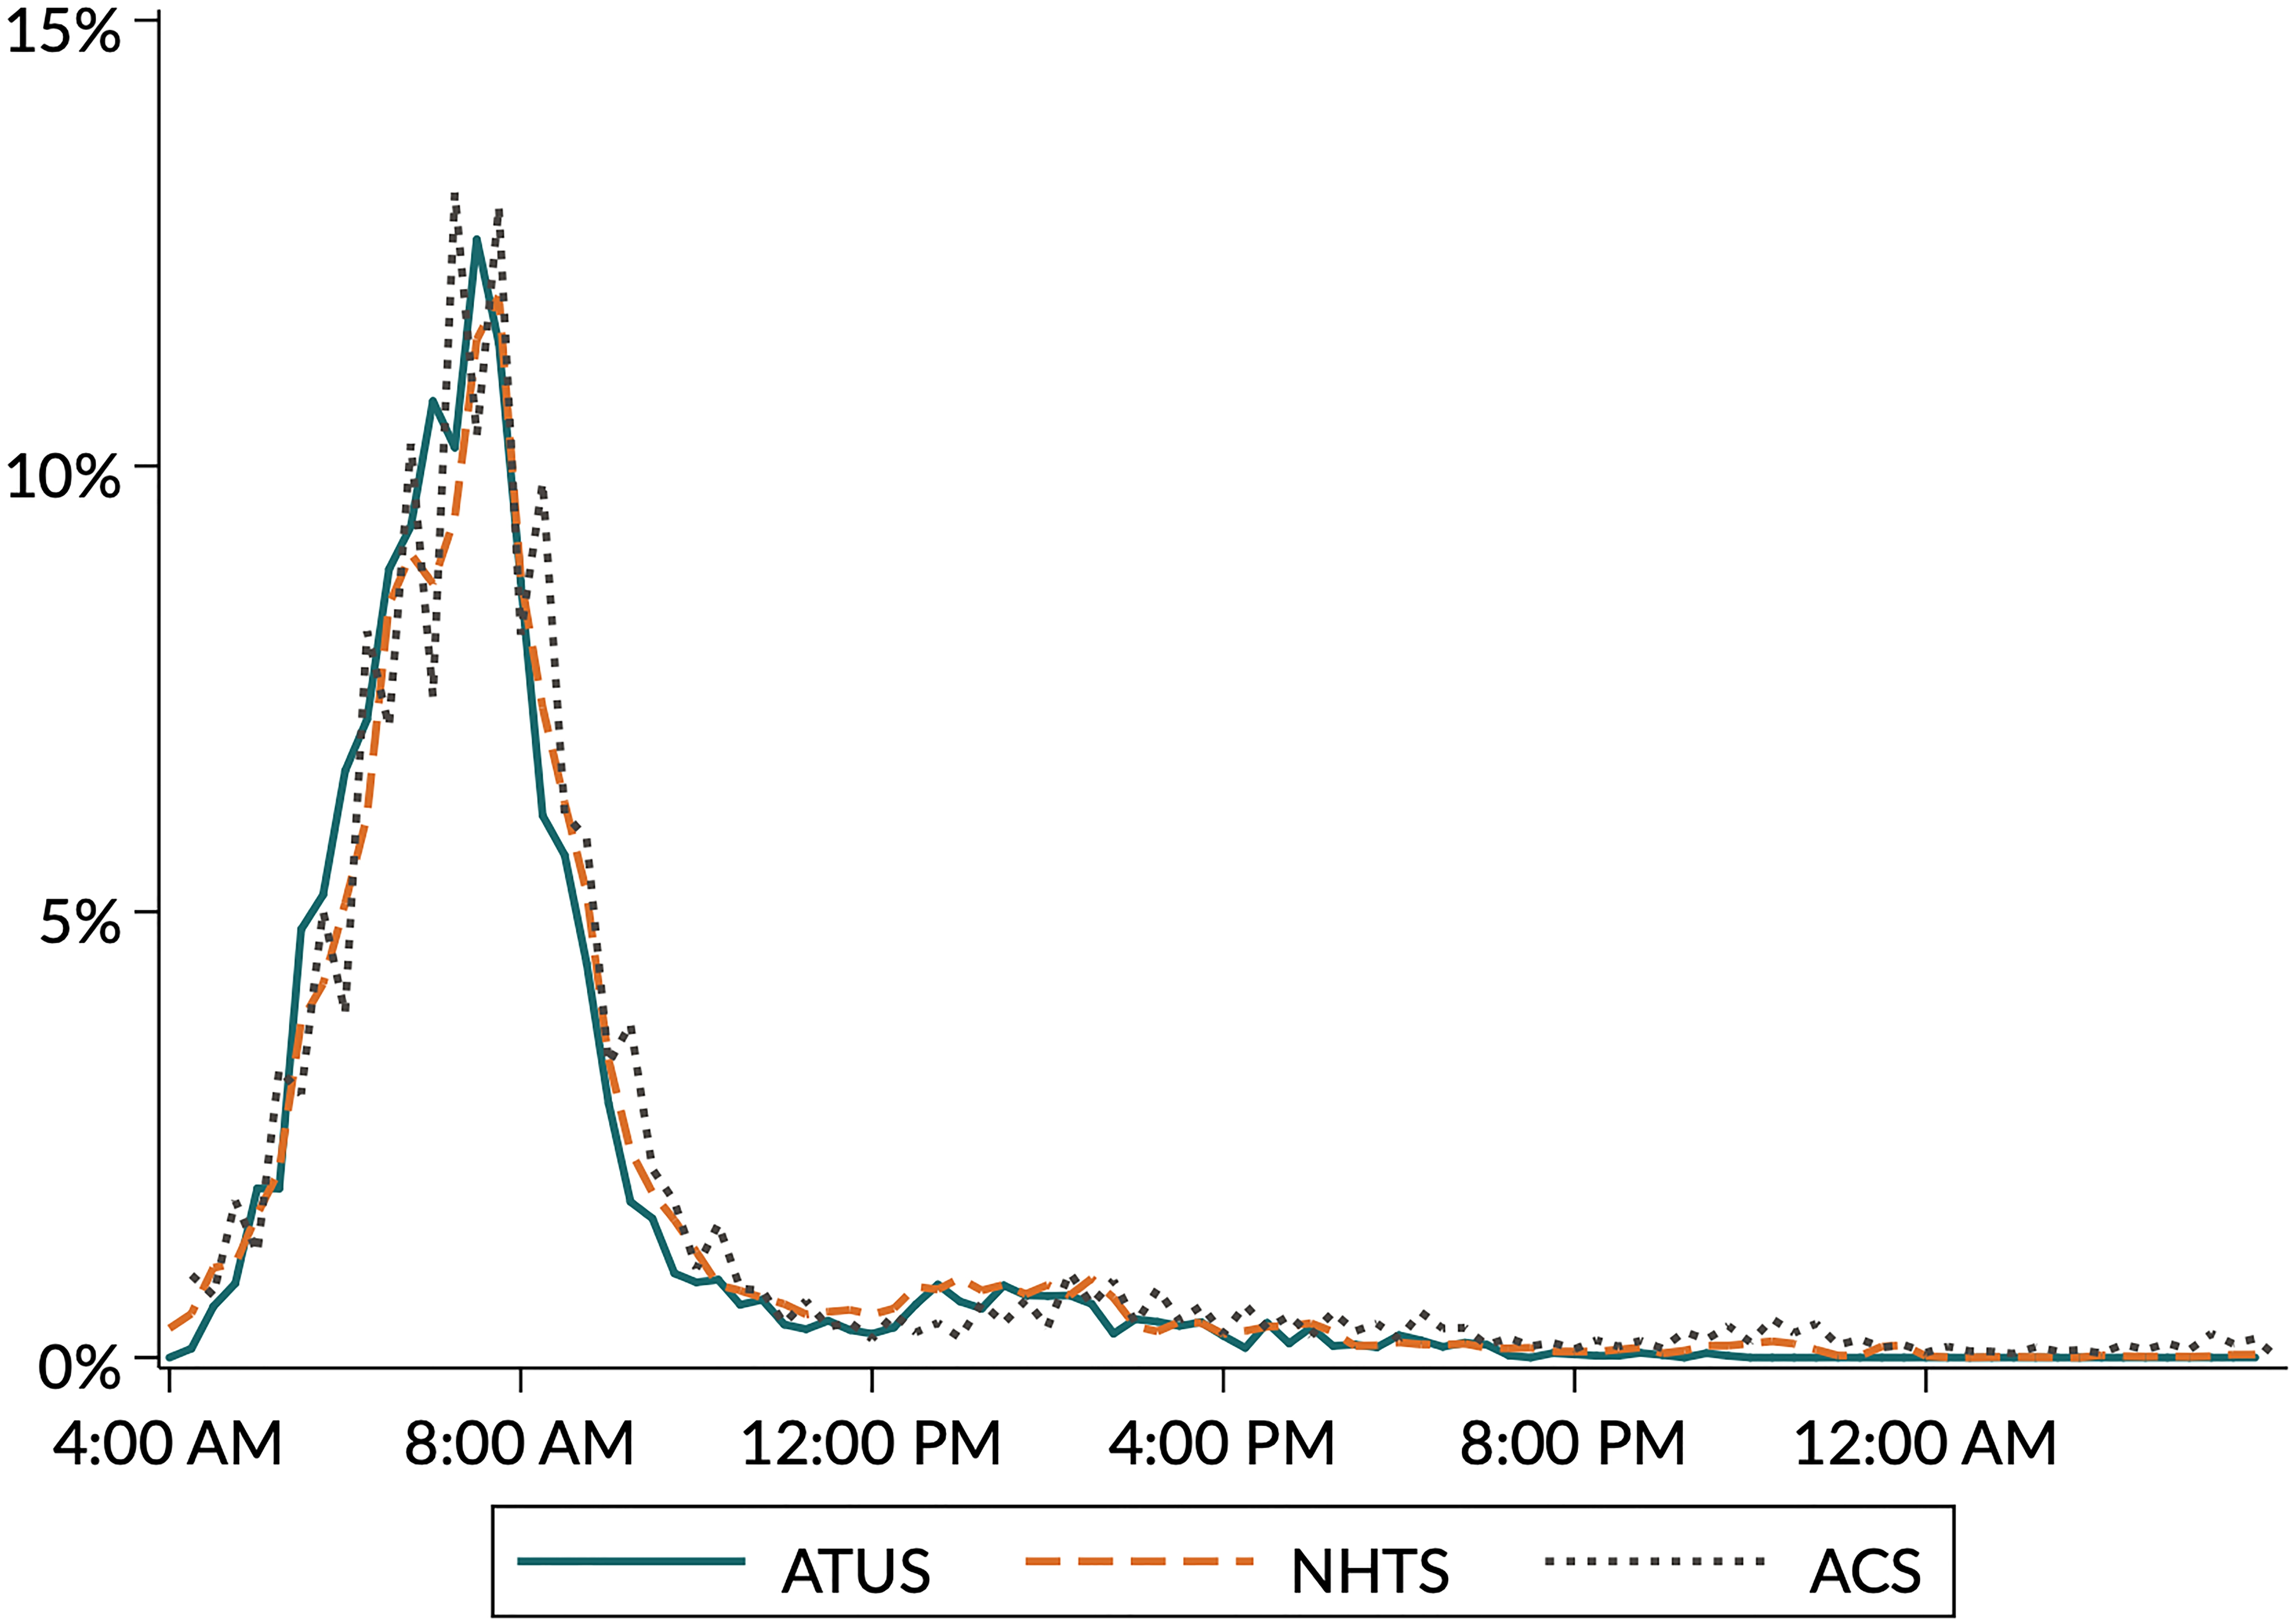
Distribution of departure times to work. Source: 2008 ATUS, 2009 NHTS, and 2008 ACS samples with limitations as described in text.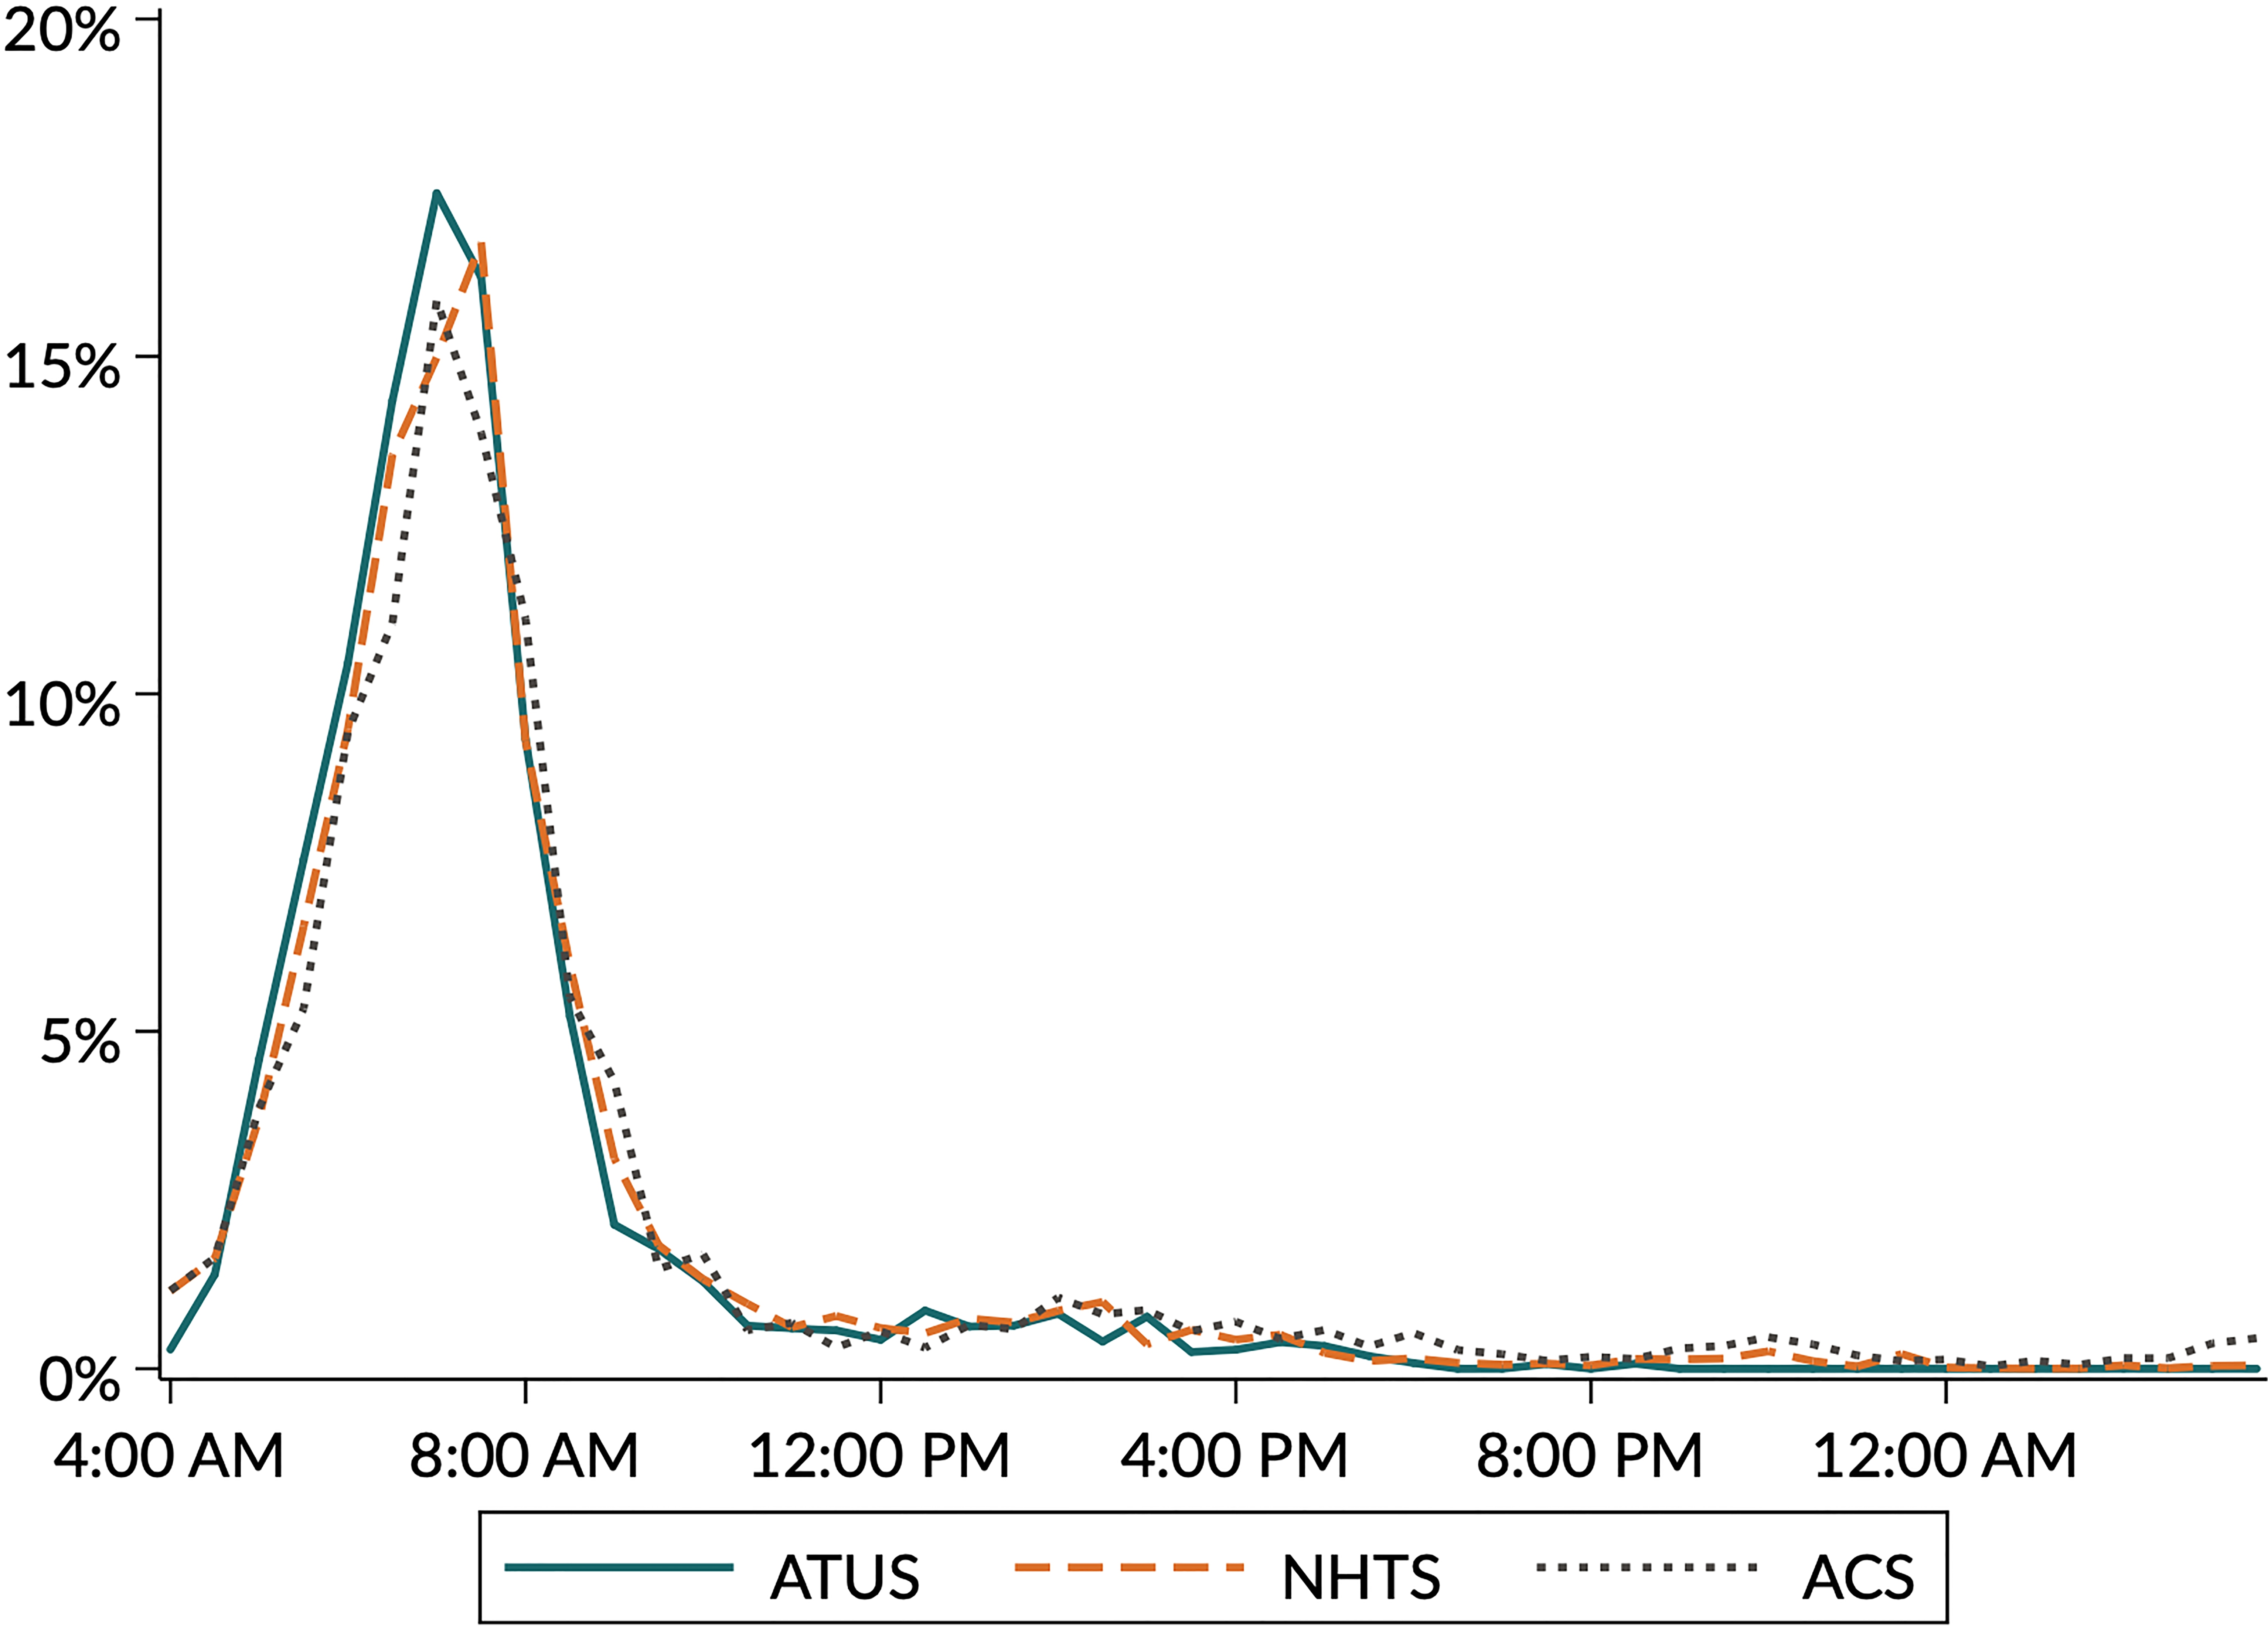
ACS respondents do not provide direct information on travel throughout the day. However, because the ACS collects information about the usual departure time in addition to the usual travel time to work, it is possible to compare ACS commuting behavior to work across the day to observed behavior using the commute tour methodology in the ATUS and NHTS. As shown in Fig. 4, the three measures of commuting to work follow similar patterns. Each peaks with between about 11 and 13% of individuals commuting to work shortly before 8:00 A.M. To-work commuting appears to occur slightly earlier in the ATUS, with the distribution shifted slightly to the left relative to the other two samples.
Additionally, the information on usual departure time in the ACS can be compared to reported departure times in the ATUS and NHTS. For the ATUS and NHTS, this corresponds to the earliest start of a commute tour. As shown in Fig. 5, the distributions of departure times appear to be similar in the three surveys. For example, in all three samples, about 15% of respondents report leaving for work between 7:00 and 7:29 A.M.
In summary, when the commuting trip tour measure is applied to the ATUS, observed commuting behavior matches up closely with observed behavior in the NHTS, both in the aggregate (as shown by comparisons of means) and throughout the day (as shown in tempograms). Moreover, measures of to-work commuting in the ATUS show similar patterns to those from the ACS, an additional large, nationally representative survey often used to study commuting. This evidence supports the use of this methodology to produce measures of commuting that mirror those in the NHTS – an established survey used to produce reliable estimates of travel behavior – at the sample level.
The choice of commuting measure significantly impacts analyses on dimensions related to stopping behavior along the commute. One example is the gender gap in commuting time, examined in further depth in Kimbrough [16]. As shown in Fig. 6, the difference in average commute length between men and women is highly sensitive to the choice of commuting measure. Using the stock ATUS measure of “travel related to working”, the gap in the 2008 ATUS is about twelve minutes, and women’s commutes are on average 37% shorter than men’s commutes. Using the preferred measure allowing for stops of up to 30 minutes, average commutes are higher for both men and women. However, the average commute increases more for women than men. The gender gap shrinks to 7 minutes, only 17% of the average commute for men.
Commuting measure choice and the gender gap. Source: 2008 ATUS sample of workers with limitations as described in text.
Analyses of gender differences in commuting time depend crucially on the choice of commuting measure. Most significantly, the stock “travel related to working” activity code in the ATUS classifies significantly less time as commuting for women than the proposed measure, while on average men’s commuting time is only affected slightly. As detailed in Kimbrough [16], this results from women’s greater likelihood of stopping along the commute.
Analysis of commuting behavior using the ATUS has been complicated by the difficulty of extracting detailed travel information from time diary data. This paper proposes and details the trip tour methodology as a strategy to produce measures of commuting behavior in the ATUS for analyses where accurate measurement of commuting is a priority. This analysis demonstrates that estimated commuting using the trip tour methodology is consistent with estimates from two surveys commonly used to study commuting, the NHTS and ACS. Calculated estimates from the ATUS are in line with those from these datasets along multiple dimensions, including aggregate means, commuting incidence, and the distribution of commuting throughout the day. The example of gender differences in commuting time demonstrates the impact of calculating commuting time with this measure rather than others used in the literature. The proposed trip tour methodology is a promising means of studying new dimensions of American commuting behavior using the ATUS.
Footnotes
More details regarding the construction of the ATUS time diaries can be found in Appendix A.1.
This corresponds to activity code 170501 in the 2003 ATUS and 180501 in subsequent years.
The ATUS contains additional information on whether a respondent worked on a particular day, but this is not used here because such information is not available in the NHTS.
Code and data necessary to reproduce or extend this methodology are publicly available on Github at
Appendix A.2 provides additional information on the NHTS.
Acknowledgments
I thank colleagues at the University of North Carolina at Greensboro for their helpful comments. Additionally, I thank Jay Stewart and participants at the “Perspectives on Time Use in the U.S.” conference for their comments and suggestions.