
Abstract
This article aims at investigating the significant higher education expansion in the Islamic Republic of Iran during 2005–2015 period through employing the production function of higher education. Avoiding simultaneity and selection problems in the presence of shocks, we have used a novel method from industrial organization discipline introduced by Rovigatti and Mollisi [1] – which is officially offered embeded in a Stata
Introduction
According to endogenous models for economic growth, human capital is one of the crucial sources of cross-country differences in the context [2]. As a developing economy, one of the main concerns of the Islamic Republic of Iran is sustainable growth, in which human capital plays an important role. The great effort in authorities and policymakers to expand higher education in Iran would seem to reflect this circumstance.
From three decades ago, the higher education of Iran has experienced substantial expansions in quantity: the number of students graduated has increased by an average annual rate of about 10%, and the number of higher education institutions (HEIs) has approximately tripled [3]. During the 2000s, the pace of the expansion dramatically increased, exceeding the 18–29 years old population growth rate and significantly accelerated from 2005 to 2015, as shown in Fig. 1.
Number of students to the population aged 18 to 29 years (%). Source: the authors’ calculation and illustration based on the data retrieved from the Statistical Centre of Iran website [70] and the Institute for Research and Planning in Higher Education (IRPHE) [68] in EViews
The expansion has been implemented mostly by funding new HEIs. To familiarize the readers with the context, Section 1.1 of this paper provides more information on higher education in Iran as much as it is related to the domain of this study; however, the concentration is not on the policies, but on their effects on university behavior as a result of the changes followed by the implementation of policies named.
Similar to other policies implemented on a country-wide scale, the policy of higher education expansion in Iran might have been followed by some changes in the behavior of stakeholders affected by the polices who – in our case – consist of HEIs and academic staff as well as students and graduates.
On the other hand, some studies suggest that econometric methods can study university behavior. Ehrenberg’s [4] systemic review summarises areas of research in econometrics of higher education, establishing the following five categories:
Estimating rates of return to higher education. Determinants of college enrolment, college graduation and choice of major. The academic labor market. Models of university behavior. Higher education as an industry and higher education governance.
in which higher education production functions fall into the 4
(H.1) The major role in fulfilling the ultimate goal of Iranian HEIs, i.e., the graduation of students, is mainly done by the physical capital of the HEIs, not the staff, (H.2) Some ranges of faculty members may contribute negatively to the process of graduation
Still, it should be noted that the estimation of production function often faces two issues of “simultaneity” and “selection problem”. Simultaneity refers to the issue that observed inputs may be correlated with unobserved shock, and therefore ordinary least square (OLS) estimator will yield biased and inconsistent estimates [6, 7]. Historically, the selection problem refers to when firms observed in the market are not necessarily a random drawn from the population of interest. The issue is problematic in panel data, providing observations on firms over time. The sample of firms that survive over time might not be random, and this will introduce bias [8].
To deal with the issues, Olley and Pakes, Levinsohn and Petrin, Wooldridge, Ackerberg, et al., and Rovigatti and Mollisi have evolved literature. They have proposed solutions by introducing new methods to estimate production functions [7, 8, 9, 10]. Although the literature is evolved in the context of the Industrial Organization in economics, this paper assumes features of the model are applicable to the context of higher education. As it would be explained in the following sections, here we assume each province as a firm that is not randomly selected over time, so the so-called selection problem maintains in the new context. Also, as the behavior is investigated in an era of gradual – but major – expansion in higher education in general,3 simultaneity is also a potential issue to avoid. Thus, at least, attempting to apply this new method in higher education studies may create a new vibe in the literature (in case of success) or would be evidence of inappropriate application (if it fails).
This paper aims to investigate the stated hypotheses about university behavior using an approach following the modern literature on this subject. To do this, first, the current Iranian higher education system is briefly explained using the available data, then, a survey of literature on the subject will be presented. Next, the estimation approaches will be introduced, and then, the process of estimation in the production function framework is applied. Finally, the estimation results will be described and discussed in the context of the production function framework, followed by a comparison to common panel data methods.
The system and behaviour
According to article 3 of the Constitution of the Islamic Republic of Iran, “free education and physical training for everyone at all levels, and the facilitation and expansion of higher education” is guaranteed [11]; As a result, considering the vastness (17
The number of higher education institutions in Iran. Note: the data for Ministry of Education is partly approximated and imputed (
To provide information on how the system functions, it is important to know that, funded by the government, state-run universities provide free education and many facilities for students, and their quality is relatively higher, so they are very competitive. These universities accept students based on a comprehensive centralized exam called konkûr, which is administered once every year by MSRT for each post-secondary stage7 [13, 15]. Students’ scores in the exam and their preferences determine the university they are accepted in. Other public and private HEIs also refer to konkûr scores to accept students, especially in more competitive positions, but they also accept students based on their backgrounds and secondary school scores; however, it is often not hard to get accepted in these universities if the student would be able to afford admission and tuition fees.
Another important feature of Iranian higher education is the centralized governance over the system by the Supreme Council of the Cultural Revolution (SCCR), MSRT, and MHME. In summary, after the Cultural Revolution preceded by the Islamic Revolution in Iran, Islamicisation was one of the central policies exerted by the highest policymaking position for education in Iran: SCCR [16]. As a result, general frameworks and policies by SCCR, and MSRT/MHME as executive organs, are mandatory in almost all categories of HEIs, so the system is highly centralized, especially in internal structure and curriculum respect. This condition has made it possible to assume similarities of the system and analyze it in a homogenous framework.
Most Iranian HEIs are educational rather than research universities, so their ultimate goal is to graduate students and award them with degrees. One possible implication, in the absence of proper regulation, would hypostatically be that private HEIs, pursuing financial purposes, increase their rate of graduation. This explains the rationale behind H.1.
As another consequence, faculty members serve educational purposes most often and are assumed to play a key role in the system. In such circumstances, the promotions8 in the hierarchy of departments9 for faculty members are awarded according to centrally announced circulars and instructions based on either educational and research backgrounds.10 The hierarchy mentioned is as it comes below in Iran:
Educational Staff (Kadr-e-Amûzeshî): The university employees in departments. They may be easily substituted or moved to non-educational offices of institutions. Assistant Lecturers (Morbbî Amûzeshyar): The faculty members who usually hold a Bachelor’s degree and instruct technical, vocational, or experimental courses. They are not promoted until they gain a higher degree. They may have a less stable position in the faculty. Lecturers (Morbbî): The faculty members who hold a Master degree or Doctor of Medicine, usually instructing Associate degree (Kârdânî) courses. They are not promoted until they gain a Ph.D. Assistant Professor (Ostadyâr): The faculty members holding a Ph.D. who usually instruct undergraduate courses. They can get promoted generally based on their years of service, courses instructed, articles published, books authored, and supervision of Master theses. Associate Professor (Daneshyâr): More experienced faculty members who are the former Assistant Professors who are promoted. They usually instruct graduate courses and can supervise more Theses or Ph.D. dissertations. Their promotion conditions are similar to Assistant professors with more strict measures.11
Professor (Ostâd): The highest rank in the department with years of experience who are promoted, Associate professors. They usually supervise Ph.D. students and often instruct graduate courses.
It should be noted that the tradition of academic freedom, Assistant Professors, Associate Professors, and Professors usually have a stable position once they are employed.
As was mentioned, the main purpose of most universities is education, so research officially takes place only in graduate levels in the form of theses (to achieve a Master degree or Doctor of Medicine) and dissertations (to achieve Ph.D.)12. Moreover, as promotion measures are quantitative rather than qualitative, these conditions lead to a conflict of interests, in several forms:
Faculty members would try to instruct as many classes as possible to facilitate their promotion procedure. Assistant – (and less likely Associate) Professors may focus on research to achieve higher ranks so that they have less time to devote to education, which is their main mission. Faculty members may take advantage of students’ efforts forcing them to research to get better scores and publish the results in his/her name. Scholars may focus on less practical, but easy to publish, topics out of their department mission (or even far from their area of expertise). Graduate students are discouraged from pursuing their topics of interests, from focusing on more favorable subjects for journals and easy-to-publish topics.
The presence of such behavior would harm the education process and decrease the graduation rate, but unfortunately, not enough precautions were initiated to prevent these conditions.13 The premise explains the rationale behind H.2.
As was mentioned earlier, Iran’s higher education has expanded on a large scale from 2005 to 2015. This is not the only expansion in Iranian higher education. The system has experienced similar expansions after IAU and PNU were founded [21]. However, the expansion started in 2005 and lasted until 2015 has had a profound effect on the system and has changed it substantially [22]. The following paragraphs first explain why authorities decided to expand higher education, then, present the process of expansion in data descriptively.
Initially, the Iranian government intended to keep higher education state-run, but, gradually the approach to higher education governance was adjusted due to the growing demand for higher education and the increase in the young population [23]. On October 15, 1985, SCCR announced the procedure and regulations to start private HEIs [24], and private HEI began to start their activity from the 1990s to a limited extent. In the 2000s, fewer restrictions were enforced upon private HEIs, so they expanded their activity, and many new institutions entered the market [23]. Since the number of state-run HEIs did not decrease, the activity of private HEIs leads to the expansion of higher education.14 Also, public and semi-public HEIs was founded in the era nurturing the changes and expansion, and also altogether probably affecting the functions of the university that we call “university behavior” in this paper.
Additionally, the Forth Program for Economic, Social, and Cultural Development of Islamic Republic of Iran (2005–2010), Part one (Knowledge-Based Economic Growth in Interaction with Global Economy), Chapter four (Development Based on Knowledge), Article 49 and Article 50, emphasize on diversification of admission in universities, implying more intake, and also the public provision of higher education, especially for low-lying and deprived areas [27]. This law was one of the main steps to amplify the expansion, especially concerning public and state-run HEIs.
Other scholars have also discussed the reasons why higher education in Iran expanded to a large extent. Arjomandi and Samiei state that the creation of a mid-class social class hoping for higher social status and the insufficiency of the labor market to respond to the demand for employment are the main reasons encouraging participation in higher education [22]. Memarzadeh and Mardani have found that technological purposes of gaining a greater power and the necessity of achieving higher equity among geographical regions have been the main drivers of higher education expansion [28]. Others may also refer to business objectives that HEIs, especially private ones, are following [29].
To give more details, as it is depicted in Fig. 2, for the interval between 2005 and 2015, the number of HEIs has grown annually 9.37% on average from about 1148 to about 2859 institutions, so the number of HEIs has approximated doubled during these years. Furthermore, the proportionate number of UAST branches has risen from 17% to 33%. The same number for private universities has also grown from 3% to 11%. On the contrary, the proportionate number of universities linked to the Ministry of Education has dropped from 25% to 10%, and IAU had 18% of HEIs in 2018 while its share had been 24% in 2005. The proportionate number of other universities has not changed substantially.
As the data for the number of students for each category of the universities mentioned in Fig. 2 is not available, so the total number of students is for the same period, and the average number of students per institution is provided in Figs 3 and 4.
Number of higher education students in Iran. Note: the number of students for Payame Noor University in 2011 and 2018 was rounded upward in data sources, so it is not precise. In addition, annual data for all categories of HEIs were not found, so the data for one or a few years is provided these HEIs. Source: The data provided by IRPHE [68] for the total number of students and HEIs, except for Ministry of Education, which is approximated based on the IRPHE data, the data retrieved from Farhangian University website [92] and the data retrieved from Technical and Vocational University website [93], Payame Noor University, which was retrieved from the university’s website [94], PNU News Agency and YJC [95, 96], and University of Applied Science and Technology, which was retrieved from the university’s website [97]. The illustration of data is done by authors in Excel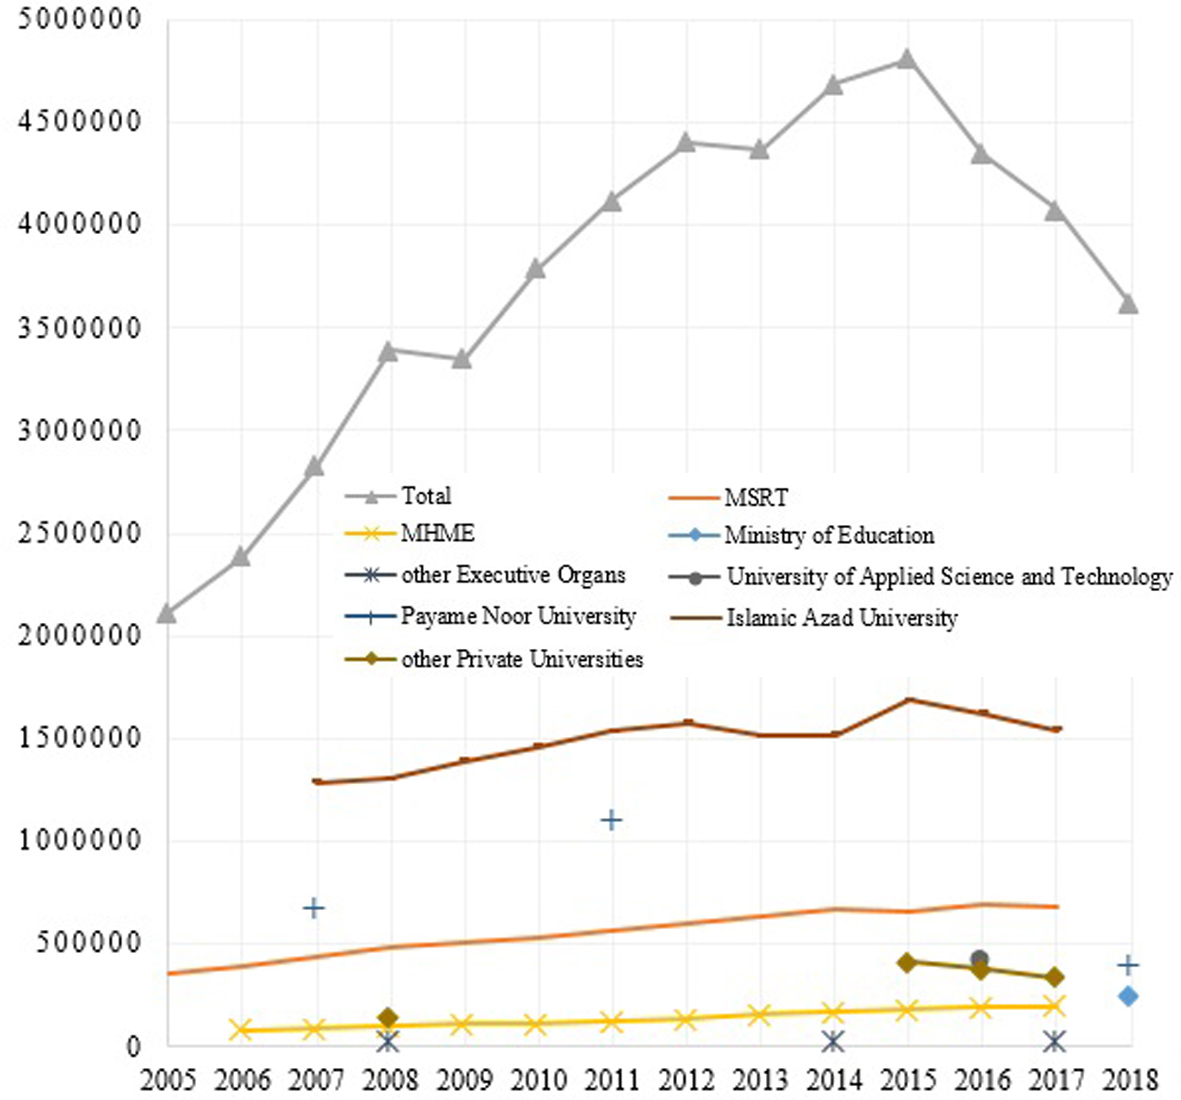
The average number of students in HEIs. Note: the data illustrated in this figure is calculated by dividing the total number of students in each category of HEI to the number of the institution for the relevant year. Source: the data is calculated by the authors based on the data presented in Figs 2 and 3. Calculations and the illustration are done in Excel
Based on the data presented, the total number of tertiary education students in Iran has grown 127% from 2117471 in 2005 to 4811581 in 2015. Moreover, the number of students in MSRT increased by 82% in the same period, and many other HEIs has experienced similar expansions (e.g., for 2008 to 2015: MHME 75%, AIU 29%, other private universities 196%, and for 2007 to 2011: PNU about 61%). According to the available data (Fig. 4 specifically), the “massification” of higher education in this era is mostly the outcome of founding new HEIs rather than increasing each university’s intake, because the average number of students in one HEI has decreased in the period of expansion (by
The expansion has increased the participation rate in higher education and has positively affected the educational attainment. Still, some studies also point out negative side-effects and failures of the expansion including unbalanced growth [30], negative cultural consequences [31], its negative effects on marriage market for the woman [32], and increasing unemployment [33, 34, 35]; however, this paper aims to investigate the university behavior with an emphasize on graduation in terms of the number of graduates in a new framework.
The higher education system of Iran has evolved in other aspects too during recent years, most of which are not explained above; but, explaining these details are out of this paper’s domain and irrelevant to the subject of study, so, it is recommended to refer to the relevant studies such as Hamdhaidari et al. [16] for the detailed explanation.
The efficiency and productivity of HEIs have been the subject of many kinds of research. There is a vast body of literature on production function estimation in higher education [36, 37, 38, 39, 40, 41, 42, 43, 44, 45, 46, 47, 48], where there are several inputs, and one output considered and productivity of each unit and return to scale are the main concerns, althogh a variety of estimation methods (e.g. Ordinary Least Squares [OLS], Spatial methods [e.g. SLX], Two-Stage Least Squares [2SLS] or Generalized Method of Moments [GMM]) and different data sets (panel data or time series) have been applied. The efficiency of HEIs is also measured and compared by utilizing benchmarking methods such as Data Envelopment Analysis (DEA) or Stochastic Frontier Analysis (SFA) (where there are some units, considering multiple inputs and outputs, and the relative efficiency is to be calculated) [49, 51, 52, 53]. Here our focus is on the productivity of inputs and returns to scale to investigate university behavior, so this section discusses the literature on higher education production functions rather than others.15
As was mentioned earlier, several studies have proposed and discussed the application of production functions in higher education (e.g., see Hopkins’ critical review of 32 studies on higher education production functions during the 1970s [40, 55]). Also, Ehrenberg’s review of the econometrics of higher education (both methodology and literature) have covered 40 years of study with a special focus on empirical research [4]. He discusses rates of return to higher education estimation, academic labor market studies, the literature related to institutional behavior, the studies considering higher education as an industry. He proposes some future areas of research [3].
Naderi thoroughly reviews the literature and considers 11 applications of the production function in higher education research analysis and its priorities, along with the identification of problems and challenges faced in application [56]. In what follows, a selection of relevant empirical studies focusing on estimation of higher education production functions is briefly reviewed about their estimation.
Da Silva Freire and da Silva apply production functions to the Portuguese higher education system and focus on the economies of scale existence and substitutability of production factors: professors and assistant professors. In this way, data on two Portuguese higher education institutions16 for the 1958–1970 period were used to estimate Cobb-Douglas production functions. The authors found that if the number of graduates is considered a product, it would be necessary to introduce time as a representative of technological progress. Additionally, they outline merits and the limitations of utilizing production functions for policymaking purposes [3, 38].
Chizmar and Zak have investigated some theoretical and empirical implications of introducing multiple outputs into economic education production functions. They proposed a simultaneous equations system that also embodies three empirical approaches, using data collected in a large section of economic principles in the fall of 1978 at Illinois State University; the sample consisted of 175 students. Their findings show that all three approaches prove the existence of trade-offs within the learning process, and substitution appears less difficult when outputs are modeled as joint products [3, 57].
Dolan and Schmidt examine the relative contributions of human and physical resources in the production of private undergraduate education, and the significance of simultaneity among students, faculty and institutional output evaluated by quality, using a three-stage least-squares technique within a theoretical framework emphasizing the interdependence of inputs and outputs in higher education. Microdata of 360 private individuals, mainly undergraduate, colleges, and universities of the United States, was used for the year 1981. Their results indicate the importance of quality faculty in human capital production [3, 58].
Sameti et al. used a simultaneous equation system to study the performance of 21 Iranian public universities in 1994–1998 period, considering endogenous variables of education quality (i.e., “the ratio of admitted undergraduates to total master degree candidates”), admission policies (i.e., “the proportion of the admitted undergraduate students through general entrance exams”), and staff quality (i.e., “the proportion of academic staff holding assistant professorship or higher ranks”). They show that staff quality and educational budget affect education quality positively, and admission policies and administrative budgets have negative effects on improvement [3, 59].
Bratti et al. have specified a growth model using a qualitative measure of human capital development to test the dependency of economic growth on human capital development in an area were among the universities located in Italy, the most efficient are evaluated. In their model, university efficiencies (in conjunction with a customary quantitative measure of human capital development: number of graduates) are represented by a stochastic frontier Cobb-Douglas production function based on 72 Italian universities’ data over the 2003–2011 period. Being estimated on a panel data framework, their evidence suggests that both indicators of human capital development have a positive and significant impact on GDP per capita, and knowledge spillovers occur between areas through the geographical proximity to the efficient universities, suggesting that the geography of production is affected [60].
Mihaljevic applies education production functions to test the significance of a complex set of factors on student attainment measured by GPA in the Croatian higher education system. His data consist of 3,856 students who had completed their first-year courses derived from a large dataset of the entire student population on 4-year programs of a large Croatian higher education institution (HEI) for the period 1994–2003. Implementing OLS estimation, he finds that paying tuition fees, being a full-time student and effort measured by the number of exam attempts, negatively influence GPA; in contrast, the relevance of educational background (secondary school education related to student’s present field of study) and mothers’ education (as a proxy for family socioeconomic status) positively affect student attainment in Croatia [61].
Soo estimates the production function for university students in English universities – using data from the NSS and HEPI surveys of 2006 and 2007 – to find the determinants of university students’ performance. The paper’s key finding is that “prior education and the quality of teaching are the most significant determinants of university degree performance.” He controls for unobserved student ability using a 2SLS/GMM approach, which indicates that it is student ability that drives the significance of prior education; taking student ability as the control variable, prior education no longer has a significant effect on degree performance [3, 62].
Naderi examines the application of production functions to evaluate developments of the Iranian higher education system over three decades from 188 to 2014. He uses a variety of production function forms to evaluate the main determinants of Iran’s higher education performance and takes advantage of cointegration analyses to avoid spurious regressions problem and also derive long-run and short-run relationships between the variables of the study. The paper’s findings show that Iranian higher education production functions conform to both polynomial cubic and Cobb-Douglas forms in estimation. Academic staff and the number of institutions are the main determinants of higher education outputs in both the long-run and short-run. Furthermore, Naderi finds that the Iranian higher education system performs under increasing return to scale with some degrees of inefficiency [3].
Liu empirically analyzes the heterogeneous and spatial effect of higher education on the regional TFP growth using a dynamic spatial (SLX) econometric model with provincial panel data from 2003 to 2016. They assume that Higher education in China can affect total factor productivity (TFP) growth and, therefore, sustainability. Their results indicate that “different levels of higher education have significant effects on TFP growth and are mainly reflected in the spatial spillover effect.” In conclusion, they suggest that “the Chinese government can promote TFP growth and economic sustainability by expanding the scale of bachelor and doctoral education and improving the quality of technical and master education” [63].
The above survey of literature has focused on the applications of higher education production functions and the methods implemented. As indicated, these studies cover developed, and developing countries, including Iran, showing the application of production functions in higher education has been of interest to researchers and policymakers during the past several decades. Besides, different methods of estimation were applied to, most often, Cobb-Douglas form of the production function. However, the literature has not taken into account the potential biases occurring as a result of simultaneity and selection issues. The following sections of this article provide a detailed analysis of the common estimation biases named and introduce recent developments of econometric literature to deal with the issues. Then, the edge-breaking control function approach, introduced by 1 [1], is applied to the data of the Iranian higher education system following different frameworks, and the results are discussed.
Materials and methods
Empirical methodology
The correct estimation of total factor productivity has been the main topic of many seminal econometric articles [1, 5, 64]. In the context of firms’ production response to positive productivity shocks, they expand their output level and demand more input; in contrast, in case of negative shocks, they do the opposite [1]. One of the recent comprehensive contributions to the literature is the Rovigatti and Mollisi study, which summarises the literature and also contributes to the literature by the application of a control function approach in estimation. They explain that:
“The positive correlation between the observable input levels and the unobservable productivity shocks is a source of bias in ordinary least squares (OLS) when estimating total-factor productivity. Various methods have been proposed to tackle this simultaneity issue, and according to their approaches, it is possible to group them into three families: fixed-effects (FE), instrumental-variables (IV), and control function approach. In the latter group, Olley and Pakes are the first to propose a two-step procedure aimed at overcoming the endogeneity: they use the investment level to proxy for productivity. Their approach has been refined by Levinsohn and Petrin and Ackerberg et al. Wooldridge proposes a novel estimation setting, showing how to obtain the Levinsohn-Petrin (LP) estimator within a system generalized method of moments (GMM) econometric framework, which can be estimated in a single step, and showing the appropriate moment conditions.” [1]
All these models assume that the firm’s dynamic profit-maximization problem at each period
Control function approach
To introduce the control function approach and for the rest of the analysis, the production function form is considered to take the form of Cobb-Douglas [65] for firm
in which
in which
The first study that proposes a consistent two-step estimation procedure for Eq. (1) is (OP) [8]. Their main point is to derive a proxy from the firm’s investment levels as a variable for
The investment policy function is The state variables are decided at time The free variables
Therefore, considering Eqs (1) and (2), the investment policy function,
as an unknown function representing observable variables. Also, substituting Eq. (3) into Eq. (1), Equation (4) is obtained:
where
“partially linear model identified only in the free-variable vector
where
where the function
If it is assumed that
where incorporates the true values of
Considering Eq. (7),
“residuals
A major drawback of the OP approach, according to common industry practices, is the violation of monotonicity assumption (1); that is, “investments are not decided at each point in time but are postponed for a few years before being made all at once.” Levinsohn and Petrin [7] try to solve this problem by “exploiting intermediate input levels as a proxy variable for
After observation of a productivity shock, firms adjust their “optimal level of intermediate inputs according to the demand function The intermediate input function is The state variables develop according to the investment policy function The free variables (
According to assumptions (5)–(7), “intermediate input demand is orthogonal to the set of state variables in
As an unknown function representing observable variables Substituting Eq. (10) into Eq. (1), the following equation is obtained:
in which
Equation (11) “is a partially linear model identified only in the free variable vector but not in the proxy variable,
“However,
consistently estimates the set of parameters
An unrealistic assumption in OP and LP is that firms can adjust some inputs instantly and at no cost when they are subject to productivity shocks. However, Aackerberg, Caves, and Frazer (ACF) and Bond and Söderbom remark that
Applying monotonicity condition Eq. (5), ACF yields
The decision time for state variables is
“The production function is value-added in the sense that the intermediate input
As Rovigatti and Mollisipropose, assumption (11) is necessary because bond and Söderbo have shown that, under the ACF assumptions, “a gross output production function is not identified without imposing further restrictions of the model” [1, 66]; so, ACF corrections do not apply to this article’s data and to summarise, the further information on ACF is skipped (for more information see Ackerberg et al.).
Addressing the OP and LP problems, Wooldridge (2009) proposes to replace the two-step estimation procedure with a GMM setup similar to that in Wooldridge (1996) [1, 9, 67]. Particularly, “he shows how to write the relevant moment restrictions in terms of two equations that have the same dependent variable (
In the first stage estimation of both OP and LP, it is assumed that
This is
“without imposing any functional form on the control function
Based on LP and Eq. (2), the implication is
in which no functional form is imposed on
The estimation approach of Roviggati and Mollisi propose is to deal with the unknown functional forms using
where
“where
Considering
“For each
and
In this leading case, the estimation is particularly straightforward because the whole system boils down to a linear estimation problem. Following Wooldridge [9], we can rewrite the system as
Using
To estimate the production functions, the data referring to the Iranian higher education system were obtained from the Institute for Research and Planning in Higher Education (IRPHE) [68]. These data include series of the number of Graduates (as dependent variable), number of Students, Professors, Associate Professors, Assistant Professors, Lecturers, Assistant Lecturers, Educational Staff for each province of Iran from 2005 to 201717. Also, the overall Government Budget devoted to HEIs of each province from 2005 to 2017 was provided from the Plan and Budget Organization [69] on the authors’ request. The number of HEIs in each province was estimated based on the data for assigned students, Government Budget, and the overall number of professors and educational staff. As for control variables, Regional Gross Domestic Product (RGDP) and Provincial Population of each province were extracted from data provided by the Statistical Center of Iran [70] for the interval being studied.18
The data is structured as a standard balanced panel data set following the methodology. Table 1 represents the abbreviation of variables studied and their sources. It should be noticed that the names in Table 1.19
Variables, abbreviations, and sources
Variables, abbreviations, and sources
Note: Government Budget devoted to HEIs is in billion Iranian Rials (IRR), Regional Gross Domestic Product is based on value added and in Iranian Rial (constant 2016 prices), and Provincial Population is in thousands.
Furthermore, Table 2 provides brief descriptive statistics of the variables being studied.20
Descriptive statistics
Source: Authors’ Estimation in EViews
As Renfro discusses, it is necessary to consider the way data is structured and how calculations are done in econometrics [71, 72]; while most of the calculations are done using econometric software packages in different platforms, it is important to note their characteristics consequently [73]. As a result, the following paragraphs explain the relative background of this paper.
In this paper, three software packages were used to work with the data and do calculations and derive econometric results: Excel
Microsoft Office Excel
Stata
EViews
Three different methods of production function estimation apply to Iranian higher education data, following the control function approaches proposed by Rovigatti and Mollisi [1]. In this section, these methods are precisely applied to data, and the estimation results are reported and compared.
Following the instructions, the natural logarithmic form of the variables being studied must be categorized as state variables, free variables, proxy variables, or optionally control and endogenous variables. No literature or study is present to reference here as a guide for this categorization, so the variables fall into each category based on the authors’ perception of the Iranian higher education system.
As for state variables, the number of university staff with more stable positions in each province, and also according to Naderi [3], the number of HEIs in each province, are considered to be state variable. Although most studies have considered academic staff as labor [3], which is expected to be interpreted as free or proxy variable here, in the case of Iran, this variable should be assigned as a state variable due to the stability of faculty position in the country. In other words, the justification here is that in response to productivity shocks, the variables cannot be adjusted easily according to academic integrity and – more basically- the labor force law of Iran. So, the list of state variables is: log(prof)21, log(acprof), log(asprof), log(lctu), and log(hei).
As for free and proxy variables, the number of university staff with less stable positions in each province, and also the government budget devoted to HEIs of each province, are considered to be free and proxy variables. The instability of assistant lecturers and educational staff, as it is observed, makes these individuals easiest to adjust in case of policy shocks, the decline in the number of assignments, or when the HEI faces a budget shortage. Also, the government budget devoted to HEIs functions very similar to an investment in the literature; therefore, bud is also considered as a free variable. Hence, the list of free variables is: log(aslctu), log(edusta), and log(bud).
As for free and control and endogenous variables, the provincial GDP and population are considered to represent the economic and demographic status of each province, which indirectly affect HEIs and the level of university supply. Moreover, the number of current university students in each province is also considered as endogenous because, the majority of educational staff time, and also budget goes for all students, not only the ones who graduate. As a result, log(rgdp) and log(rpop) are control variables and log(
In conclusion, the production function of higher education for Iranian provinces is assumed to have a Cobb-Douglas form and is specified in a baseline form as
where
Olley-Pakes Estimation. Table 3, indicates the results of production function estimation for the higher education of Iran provinces in the Olley-Pakes (OP) framework and according to the control function approach. Here, once log(bud) functions as a proxy variable, so its corresponding coefficient drops as in OP, and the other times, log(aslctu) and log(edusta) are treated as proxies so that their coefficients does not appear in the results.
Olley-Pakes Estimation Results
*(
Levinsohn-Petrin Estimation. Table 4, indicates the results of production function estimation for the higher education of Iran provinces in the Levinsohn-Petrin (LP) framework and according to the control function approach. Here, once log(bud) functions as a proxy variable, and the other times’ log(aslctu) and log(edusta) are treated as proxies.
Levinsohn-Petrin estimation results
*(
Wooldridge Estimation. Table 5, indicates the results of production function estimation for the higher education of Iran provinces in Wooldridge framework and control function approach. Here, once log(bud) functions as a proxy variable, so the relevant coefficient drops, and in the other models log(aslctu) and log(edusta) are treated as proxies, so their proxies are not reported as the methodology implies. Also, as the number of observations doesn’t match when log(bud) and log(edusta) are proxies, the control variable is omitted in estimation.
Wooldridge estimation results
*(
Pooled, Fixed Effects, and Random Effects Estimation. To distinguish the methodology with the common methods of panel data estimation, Pooled, Fixed Effects, and Random Effects Estimation (with and without time fixed dummy variables if available) were done on the dataset. Table 6 depicts the results.
Here, the model is specified differently as
where
Pooled, fixed effects and random effects estimation results
The reliability of fixed and random effects models and time-dummy variables are checked via the Redundant Fixed Effects test [89] and Correlated Random Effects test, also known as the Hausman test [90]. Table 7 shows the results of the mentioned tests for the panel data models represented in Table 6.
Reliability tests for pooled, fixed effects and random effects models
Source: Authors’ Estimation in EViews
As the results in Table 7 imply, in models (2) and (3) the null hypothesis of redundancy of fixed effects is rejected, so these models should consider both period and cross-section fixed effects as it is in the model (4); So, (2), (3) and consequently (1) are not reliable without the time and cross-sectional fixed effects. Also, according to the Hausman test, the null hypothesis of random effects existence is rejected in (5), and the model is unreliable. Hence, model (4) is the only ordinary panel data model that is here subject to interpretation and comparison.
In this section, the results of different production function estimations are explained in detail. Generally, models are reliable, and their results are occasionally significant and comparable with the literature. Also, the differences between the usage of various proxies need to be considered. According to Levinsohn and Petrin [7], the results of ordinary panel data models are biased in free and state variables, so they also need to be checked. The estimation results are represented in Table 3 to Table 5, and – as all variables are in logarithmic form – the coefficients show elasticity of the factor in production. Panel data results are not discussed here, but they are reviewed in the next section.
Generally, the proxy in the OP model should be an investment that is similar to the budget variable, bud, here. Hence, the other variables (i.e., aslctu and edust) do not perform well in OP framework [8]. On the other hand, LP accepts other variables as proxies so the models in which aslctu and edust perform as proxies of productivity shocks are reliable [7]. But as Wooldridge applies the GMM approach and studies parameters in a two-equation system, it clarifies identification issues better and provides simpler and more efficient estimators [9]. As a result, OP results when bud is proxy are far stronger than other cases in OP, LP results are preferred to OP, and Wooldridge results are stronger than LP. Also, Wooldridge results and the low level of robustness when edustis proxy, cast doubt on its properness as a proxy in this framework.
As for state variables, the coefficient for profis estimated to be negative, however most of the time, insignificant and varies between
The elasticity coefficient of acprofis positive and indicates to be significant in 4 estimations (i.e., OP[aslctu], LP[bud] and Wooldridge[bud& aslctu]) with values around 0.180 to 0.440, meaning that a 100% increase in acprof is predicted to cause an 18 to 44% increase in grad. In particular, acprof is about 7 to 26% more affected when the productivity shock is from bud, in comparison with the situation in which aslctu is considered as the productivity shock.
Same as prof, the elasticity of asprofis negative, but significant for mosf of the cases (except for Wooldridge[edust]), varying from
lctueffects are also significant (except for in Wooldridge[edust]) but positive, valuing from 0.423 to 0.814; It predicts that if the number of lecturers grows 100%, the number of graduates will grow by around 42 to 81%. Particularly, there is not much difference between the lctu response to different shocks, but, approximately response to bud shocks are slightly stronger here.
The number of higher education institutions in each province is the last state variable, indicating high robustness in all models (except for in Wooldridge[edust]). Putting LP(edust) aside23, the elasticity of the number of graduates to the number of higher institutions in each province is estimated from 0.689 to 1.038, predicting approximately a 70 to 104% increase in graduation in response to a 100% increase shock in number of HEIs. In particular, as heiperforms as capital here, and if the productivity shock is from bud it responds about 3 to 13% stronger than in response to aslctu.
Free variables in this study – which are used interchangeably as proxies – are not significant and also does not show stable positive or negative values, except for aslctu. The variable representing the number of assistant lecturers is estimated to affect grad in negative ways in all models, with the significant value of
Mainly, the performance of proxies should be evaluated by their support of literature, which will be discussed later. But, as LP provides their coefficient while they perform as a proxy, it may be potentially informative to consider proxy coefficients in LP. However, no strong conclusion can be derived this way here. This evidence provides a suggestion that maybe the set of proxies can be chosen better; however, the lack of data for this case being studied stops the research from going further.
Control variables (i.e., rgdp and rpop) have not been significant in most of the models, except LP(edust) and Wooldridge(bud) which show negative and positive results, valued
Wald test joint hypothesis was the constant return to scale (CRS) condition (sum of coefficients equals 1). The results approve CRS conditions when bud is the proxy and in LP(edust) but is rejected in other models, including the panel data model (4).
Besides, Levinsohn and Petrin [7] suggests that the ordinary least squares estimator leads to biased coefficients. To compare the results, maximum and minimum coefficients (preferably the significant ones) of OP, LP, and Wooldridge estimation are compared with the panel data model (4). Table 8 provides a comparison using the Z statistic introduced by Paternoster et al. [91].
Comparing OP, LP and wooldridge results with panel data model (4) results
Comparing OP, LP and wooldridge results with panel data model (4) results
The comparison reveals that the absolute values of state variables are mostly underestimated in the model (4).
In conclusion, implementing the most recent contributions of econometrics in estimating production functions provides better results in comparison with ordinary methods. Additionally, all the models show that the most important factor in “producing” graduates is the number of higher education institutes (HEIs), which stands for items like educational space, the facilities, etc.; in a word, the capital. Then, assistant professors and lecturers are the most important determinants discovered to affect the number of graduations. However, assistant professors affect the process negatively. In lower ranks, stand associate professors and professors in order, both with negative effects. Also, the government budget allocated to HEIs proxies the productivity shocks better than other free variables with stronger magnitudes.
This article tries to investigate the properties affecting the number of HEI graduates in Iran, considering a provincial data from 2005 to 2017 from, following production function framework and newest estimation methods. In this way, first, a review of the literature was surveyed. Next, the control function approach developed by Rovigatti and Mollisi [1] was introduced, and then the data described, and estimation was done.
The estimation is done considering the number of HEIs, full, associate, and assistant professors as a state variable, and three productivity shocks as a proxy (and interchangeably free variables): government budget, number of assistant lecturers, and number of educational staff.
The estimation results show that state variables are mostly robust, despite free variables that are not significant often. Also, the number of HEI is found to be the most effective factor in the number of higher education graduation rates with up to 1.036 elasticity. After that, lecturers and associate professors are estimated as the most important positive determinants of higher education in Iran, with up to 0.814 and 0.440 elasticities, respectively. Assistant professors and professors affect the number of graduations negatively: assistant professors with a higher magnitude than associates, up to
As the data structure for this study and also the case is similar to Naderi [3], the comparison with his results is easily available; however, the comparable estimation’s dependant variable are students, not graduates. Anyway, in that model, professors and associate professors have positive effects on the production process, but assistant professors show negative effects. The difference is that also, in this paper, the corresponding results are negative for both full and assistant professors. Naderi [3] justifies the result by considering the shortages in the supply of higher grades of academic staff, which is dominated by a hierarchical structure and time-consuming processes; in other words, when associate professors were not available, assistants had to be employed. This is also proposed that base on the academic promotion rules in Iranian higher education, which involve assistant professors informal procedures and distract their attention from education quality by creating incentives counteracting truly beneficial educational activities (e.g., demanding the high number of indexed journal articles instead of article quality or industry fund attraction), may affect the contribution of assistant professors in a negative way. On the other hand, most of the time, the process of promotion to full professorship takes as much a long time that the holders of the position are often old and not motivated to put enough time and effort into the graduation of students whom in the majority are in undergraduate level.
In conclusion, this paper tries to estimate the higher education production function of Iran in order to investigate university behavior, following the literature and available data of Iranian provinces from 2005 to 2017. In this way, a cutting-the-edge method introduced by Rovigatti and Mollisi [1] is applied to different estimators of production function (i.e., Olley-Pakes, Levinsohn-Petrin, and Wooldridge). The method considers productivity shocks and avoids simultaneity and selection problems that occur in OLS or Fixed-Effects Estimation. The results approve the importance of physical capital, which is proxied by the number of HEIs and then human capital, especially associate professors and lecturers. It is also understood that full and assistant professors negatively affect the process of graduation. In addition, the budget is found to proxy for productivity effects better than assistant lecturers, and educational staff fails to successfully proxy for those shocks. The constant return to scale hypothesis is approved in stronger models but fails in the others.
Footnotes
The rationale behind the hypotheses is explained in Section 1.1.
The data presented in following sections prove this claim that all 31 provinces of Iran have been engaged in the expansion.
The Ministry of Education in Iran focuses on primary and secondary education; so, the purpose of the universities linked to the ministry is primarily to train teachers and expand vocational training.
These two universities gradually gained their independence and are managed independently, but they serve the proposes of Ministry of Education and have a key role in educating future teachers.
As these universities are financed by private funds (especially, from the tuition fees that students pay) and make some decisions independently, it is more appropriate to call them semi-public, rather than public universities.
Post-secondary stages in Iran (and their equivalent in United States) consist of: Kârdânî (or Fogh-e-diplom; equivalent to Associate Degree), Kâreshenâsî (or Lîsâns; equivalent to Bachelor Degree), Kâreshenâsî-e-Arshad (or Fogh-e-Lîsâns; equivalent to Master Degree), Doctorâ-ye-Herfe’ei (for medical, dentistry and pharmacy students; equivalent to Doctor of Medicine) and Doctorâ-ye-Takhassosî (equivalent to Ph.D.) See Nuffic and WENR [13, ![]() ] for more details.
] for more details.
Here, promotion means ascending to higher academic ranks, i.e. earning a higher salary and being exposed to better opportunities and positions.
Generally, each HEI consists of one or more faculty (dâneshkadeh), and the faculties consist of departments (Gorooh-e-Amûzeshî) to which faculty members are assigned.
For example, they should publish articles in internationally-indexed peer-reviewed journals.
however, there are a number of internationally-ranked research universities (such as Sharif University of Technology or University of Tehran), in which research activities are often considered as one of the main purposes of the university and takes place in other forms such as industry or government contracts and research projects.
Recently, some regulations have been considered by HEIs to avoid conflict of interests.
see also Arani et al. and Araste and Jamshidi [25, ![]() ].
].
the Arts and Law Faculties of Coimbra and Lisbon Universities and the Higher Institute of Engineering of Lisbon.
It should be noted that Persian calendar (also named Jalali calendar), which is the official calendar of Iran, is different from AD calendar (and starts from 621 AD). Academic calendar in Iran starts from about the first day of Autumn in Persian calendar (or a few days sooner) that is around September 15th. The data in this study is gathered beginning of 1383–1384 academic year which has started from September 18
Details on the provincial data are provided in Appendix.
Further explanation on what the abbreviations and the academic positions mean is provided in Section 1.1.
For more details on the data check for the data supplemented online or contact the authors.
The function of natural logarithm in this article is presented by log(
The expression means: when the estimation method is Olley-Pakes and the proxy is aslctu. The other expressions in this format are interpreted the same.
The model’s result for the variable is an outlier, and considering its 90% confidence level and weakness of its proxy the coefficient can be ignored.
Acknowledgments
We greatly appreciate the valuable guidance of Dr. Abolghasem Naderi from the initial stages of this research until the revision stage, especially for suggesting the title and rewriting the asbstract. We also thank the instructive cooperation of Dr. Mohammad Javad Salehi and IRPHE staff, providing the majority of the data used in this study generously for the authors. Also, we would like to express our sincere gratitude to Dr. Charles Gilliland Renfro and two anonymous referees for their helpful comments, which enhanced the quality of this paper and tried their best to correct our mistakes. Indeed, all the responsibility for the content is refrenced to the author and none of the scholars named above.
Appendix
All 31 Iranian provinces are included in this study, but Tehran and Alborz are considered as one province, so the list of included provinces are as followed (with referenced table): Alborz and Tehran (Table 9), Ardebil (myblackTable 10), Bushehr (Table 11), Chahar Mahall and Bakhtiari (Table 12), East Azarbaijan (Table 13), Esfahan (Table 14), Fars (Table 15), Gilan (Table 16), Golestan (Table 17), Hamadan (Table 18), Hormozgan (Table 19), Ilam (Table 20), Kerman (Table 21), Kermanshah (Table 22), Khuzestan (Table 23), Kohgiluyeh and Buyer Ahmad (Table 24), Kordestan (Table 25), Lorestan (Table 26), Markazi (Table 27), Mazandaran (Table 28), North Khorasan (Table 29), Qazvin (Table 30), Qom (Table 31), Razavi Khorasan (Table 32), Semnan (Table 33), Sistan and Baluchestan (Table 34), South Khorasan (Table 35), West Azarbaijan (Table 36), Yazd (Table 37), and Zanjan (Table 38).
The higher education data of Alborz and Tehran Provinces Source: see Table 1 and Section 2.2.
grad
st
hei
prof
acprof
asprof
2005
39442
29
2006
42195
241061
243
1032
1809
6295
2007
34715
240809
324
1263
2109
6732
2008
96945
348136
338
1067
1886
6923
2009
169358
636407
364
1595
2767
9529
2010
115657
753239
479
1616
2906
9809
2011
116032
793761
455
1768
3133
10238
2012
138695
844331
482
1834
3338
10675
2013
132551
819910
558
2281
4161
12889
2014
149807
972592
578
2247
3959
12811
2015
212577
1054015
723
2622
4511
13870
2016
189213
988055
700
2746
4445
14180
2017
1002031
691
2353
3956
11653
lctu
aslctu
edust
bud
rgdp
rpop
2005
3.44E+11
4.80E+08
13107.3
2006
4185
209
8806
3.46E+11
6.00E+08
13422.9
2007
3901
212
7629
4.36E+11
7.70E+08
13649.7
2008
7961
158
3690
3.69E+11
9.90E+08
13880.4
2009
9817
253
17123
1.66E+12
1.10E+09
14115
2010
9850
351
14128
1.54E+12
1.30E+09
14353.7
2011
9468
316
19375
1.52E+12
1.60E+09
14596.5
2012
8838
442
16292
1.36E+12
2.00E+09
14864
2013
8871
365
23905
1.48E+12
2.60E+09
15136
2014
10654
209
25594
2.01E+12
3.10E+09
15413
2015
11476
447
29870
2.54E+12
3.30E+09
15694
2016
11809
233
22873
3.11E+12
3.80E+09
15980
2017
7278
155
28733
3.70E+12
4.00E+09
16180.2
The higher education data of Ardebil Province Source: see Table 1 and Section 2.2.
grad
st
hei
prof
acprof
asprof
2005
2694
2006
2816
17177
16
3
5
157
2007
1368
7754
15
4
6
191
2008
8528
31763
22
3
6
298
2009
11756
56069
22
12
14
409
2010
10291
58974
31
17
19
460
2011
10126
63898
37
17
37
512
2012
11274
67282
36
14
26
348
2013
11716
67217
40
19
63
436
2014
11333
65070
36
17
73
468
2015
13051
73161
43
20
105
551
2016
11301
62979
41
34
164
610
2017
59495
41
48
151
588
lctu
aslctu
edust
bud
rgdp
rpop
2005
8917652
1.80E+07
1220.88
2006
300
52
593
9293081
2.20E+07
1228.75
2007
254
9
462
14214638
2.80E+07
1232.39
2008
583
151
12874207
3.50E+07
1236.19
2009
1108
82
777
3.98E+08
4.00E+07
1240.14
2010
1096
99
1017
1.69E+08
4.70E+07
1244.23
2011
1638
92
1696
3.08E+08
6.00E+07
1248.49
2012
1162
111
954
2.84E+08
7.90E+07
1252
2013
1088
59
2255
4.27E+08
1.10E+08
1257
2014
1160
54
2873
8.40E+08
1.30E+08
1261
2015
1144
114
3008
1.05E+09
1.30E+08
1266
2016
1165
12
2697
1.54E+09
1.40E+08
1270.42
2017
546
4
3571
2.19E+09
1.50E+08
1274.28
The higher education data of Bushehr Province Source: see Table 1 and Section 2.2.
grad
st
hei
prof
acprof
asprof
2005
1121
2006
854
9772
7
0
3
120
2007
1006
5312
9
3
138
2008
4773
21582
16
3
132
2009
7243
40016
16
8
4
213
2010
5478
50910
26
3
7
238
2011
6530
59742
31
4
8
275
2012
8997
66218
33
6
10
292
2013
10718
70840
45
7
19
314
2014
11346
78232
43
8
19
333
2015
16685
84442
47
9
32
454
2016
12479
66035
44
11
41
485
2017
58688
41
14
72
448
lctu
aslctu
edust
bud
rgdp
rpop
2005
11440163
4.80E+07
871.191
2006
113
0
279
11897639
5.50E+07
886.267
2007
173
7
274
11897679
8.70E+07
913.696
2008
247
4
85
7574882
9.60E+07
942.045
2009
656
108
450
11019588
9.40E+07
971.347
2010
616
128
764
10709677
1.60E+08
1001.64
2011
706
55
1639
14070552
2.30E+08
1032.95
2012
884
81
894
22850964
2.80E+08
1058
2013
959
61
1792
36962922
4.40E+08
1083
2014
1152
52
2537
58450010
6.80E+08
1109
2015
1058
55
2753
86777567
5.30E+08
1136
2016
1043
46
2354
1.22E+08
6.10E+08
1163.4
2017
463
1
2992
1.68E+08
6.40E+08
1191.89
The higher education data of Chahar Mahall and Bakhtiari Province Source: see Table 1 and Section 2.2.
grad
st
hei
prof
acprof
asprof
2005
3731
2006
2293
18618
17
0
12
203
2007
1384
9983
13
2
7
147
2008
4830
32692
20
4
22
199
2009
7650
39617
20
9
35
281
2010
6765
44108
27
8
44
316
2011
5913
45458
25
8
45
336
2012
10129
48838
27
12
58
356
2013
8105
48629
30
20
71
385
2014
8803
50818
27
18
78
446
2015
9863
50748
30
25
95
449
2016
9260
46229
30
27
122
517
2017
41182
28
36
170
447
lctu
aslctu
edust
bud
rgdp
rpop
2005
83313438
1.20E+07
847.281
2006
165
10
445
85530078
1.50E+07
853.593
2007
89
5
437
1.32E+08
1.90E+07
861.064
2008
319
326
1.51E+08
2.30E+07
868.545
2009
505
84
663
5.62E+08
2.70E+07
876.036
2010
481
45
854
5.38E+08
3.30E+07
883.537
2011
520
210
1296
6.02E+08
4.40E+07
891.045
2012
895
180
1022
6.87E+08
5.60E+07
902
2013
879
146
1738
8.27E+08
6.90E+07
913
2014
970
127
1768
8.74E+08
7.50E+07
925
2015
1021
124
1991
8.39E+08
8.70E+07
936
2016
1261
121
1988
1.05E+09
9.90E+07
947.763
2017
487
17
2409
1.29E+09
1.00E+08
951.213
The higher education data of East Azarbaijan Province Source: see Table 1 and Section 2.2.
grad
st
hei
prof
acprof
asprof
2005
8743
2006
12057
57939
57
101
173
888
2007
5529
44992
69
123
277
1018
2008
21242
102388
71
91
251
1038
2009
42534
175397
83
139
339
1460
2010
31844
196119
99
162
409
1536
2011
32906
211942
117
182
461
1866
2012
41396
233922
120
188
471
1793
2013
40298
218171
123
215
508
1894
2014
41494
219699
128
229
571
2058
2015
41735
221787
131
293
697
2348
2016
40709
207991
130
332
757
2505
2017
186491
127
338
721
2322
lctu
aslctu
edust
bud
rgdp
rpop
2005
1.57E+09
6.80E+07
3572.42
2006
1076
68
1820
1.59E+09
8.30E+07
3602.86
2007
1044
72
2220
2.00E+09
1.10E+08
3626.73
2008
1574
39
358
3.39E+09
1.30E+08
3650.83
2009
3508
337
2550
1.11E+10
1.40E+08
3675.18
2010
3457
378
3009
1.48E+10
1.60E+08
3699.77
2011
5444
320
4065
2.14E+10
2.10E+08
3724.62
2012
4701
317
3351
1.39E+10
2.70E+08
3761
2013
4588
214
6004
2.48E+10
3.50E+08
3797
2014
5109
188
6229
3.43E+10
4.10E+08
3834
2015
5574
362
6414
3.90E+10
4.00E+08
3872
2016
5504
183
6384
4.95E+10
4.60E+08
3909.65
2017
2609
45
7165
5.53E+10
4.80E+08
3922.53
The higher education data of Esfahan Province Source: see Table 1 and Section 2.2.
grad
st
hei
prof
acprof
asprof
2005
16057
2006
14871
101345
88
154
364
1352
2007
12071
57775
90
178
377
1393
2008
40101
184055
116
195
350
1324
2009
58623
243454
131
219
493
2163
2010
44036
264384
154
226
539
2015
2011
41474
294163
172
248
602
2214
2012
56880
318438
170
303
696
2608
2013
52538
306115
171
352
814
3013
2014
49937
325711
174
349
825
3009
2015
54029
318968
180
404
881
3056
2016
53007
298856
183
508
1070
3837
2017
281683
180
415
886
2608
lctu
aslctu
edust
bud
rgdp
rpop
2005
1.03E+10
1.20E+08
4492.63
2006
1462
67
2873
1.04E+10
1.40E+08
4563.57
2007
1565
38
3438
2.34E+09
2.00E+08
4625.88
2008
2593
42
1744
9.92E+09
2.40E+08
4689.02
2009
4363
299
6995
3.92E+10
2.50E+08
4753
2010
4493
311
5724
3.23E+10
3.10E+08
4817.83
2011
4734
129
8027
3.65E+10
4.30E+08
4883.53
2012
5815
314
6863
3.61E+10
5.20E+08
4930
2013
4690
231
11838
4.59E+10
6.80E+08
4977
2014
4537
161
12797
6.67E+10
7.30E+08
5025
2015
4634
314
12524
7.18E+10
7.00E+08
5073
2016
6125
190
12269
7.70E+10
8.00E+08
5120.85
2017
2784
44
11871
9.09E+10
8.40E+08
5200.31
The higher education data of Fars Province Source: see Table 1 and Section 2.2.
grad
st
hei
prof
acprof
asprof
2005
9389
2006
7630
56424
50
131
206
758
2007
2917
24435
40
135
210
719
2008
31919
122192
79
131
209
741
2009
46360
205160
89
176
250
1216
2010
34540
231682
112
261
432
1531
2011
35482
254740
134
338
366
1457
2012
41715
264304
133
277
374
1608
2013
43878
260360
147
255
400
1696
2014
41755
270999
153
256
397
1748
2015
42641
264973
147
270
432
2072
2016
39137
233047
141
299
489
2282
2017
209156
143
358
807
2124
lctu
aslctu
edust
bud
rgdp
rpop
2005
5.57E+09
8.00E+07
4280.67
2006
607
32
1785
5.63E+09
1.00E+08
4336.88
2007
676
10
1466
3.21E+09
1.30E+08
4387.8
2008
975
20
429
1.08E+10
1.50E+08
4439.24
2009
4268
308
2310
2.09E+10
1.60E+08
4491.19
2010
4690
377
2668
2.09E+10
2.00E+08
4543.66
2011
5015
333
5824
2.54E+10
2.80E+08
4596.66
2012
5841
526
3495
5.01E+10
3.50E+08
4647
2013
5349
368
8085
3.23E+10
4.90E+08
4697
2014
5219
382
8833
4.00E+10
5.90E+08
4748
2015
5552
779
9175
9.66E+10
5.90E+08
4799
2016
5552
313
8598
9.41E+10
6.70E+08
4851.27
2017
1937
51
10500
1.20E+11
7.00E+08
4903.8
The higher education data of Gilan Province Source: see Table 1 and Section 2.2.
grad
st
hei
prof
acprof
asprof
2005
6045
2006
6992
32371
33
17
67
587
2007
2805
24083
40
17
79
614
2008
13151
55884
40
14
56
500
2009
24048
93845
43
25
67
769
2010
21025
111304
63
31
122
827
2011
18898
122923
69
40
120
943
2012
24154
134244
72
30
129
859
2013
24540
135234
83
41
167
1089
2014
26070
145713
84
44
166
1081
2015
28528
148968
86
64
233
1178
2016
27115
131858
87
102
254
1289
2017
123058
86
122
268
1103
lctu
aslctu
edust
bud
rgdp
rpop
2005
2.15E+08
4.10E+07
2385.95
2006
487
51
977
2.20E+08
5.00E+07
2404.86
2007
487
232
1382
2.25E+08
6.60E+07
2418.47
2008
767
17
599
3.18E+08
8.20E+07
2432.86
2009
2189
84
1239
4.57E+08
9.10E+07
2448.04
2010
2072
83
1574
7.09E+08
1.00E+08
2464.04
2011
1990
96
3192
7.58E+08
1.30E+08
2480.87
2012
1934
106
3068
8.59E+08
1.60E+08
2490
2013
2040
82
5587
1.41E+09
2.30E+08
2500
2014
2112
67
6176
1.84E+09
2.50E+08
2510
2015
2275
131
6476
2.57E+09
2.70E+08
2520
2016
2162
27
7062
3.84E+09
3.00E+08
2530.7
2017
1386
25
6554
5.05E+09
3.20E+08
2550.66
The higher education data of Golestan Province Source: see Table 1 and Section 2.2.
grad
st
hei
prof
acprof
asprof
2005
3090
2006
2463
23157
19
5
19
180
2007
3478
10567
16
12
38
206
2008
8667
31600
28
11
44
220
2009
11933
55708
28
12
57
375
2010
12965
69222
44
14
54
380
2011
11312
83110
50
41
62
432
2012
14964
88110
48
17
71
451
2013
15550
87609
55
24
103
476
2014
14683
90768
50
22
94
511
2015
15867
91220
54
31
118
629
2016
13110
82499
56
34
158
875
2017
75704
55
47
177
837
lctu
aslctu
edust
bud
rgdp
rpop
2005
16020147
2.50E+07
1596.15
2006
203
3
549
16617814
2.90E+07
1617.09
2007
274
16
695
11581064
3.70E+07
1648.1
2008
633
13
445
12555441
4.50E+07
1679.59
2009
1328
153
1168
15437731
5.10E+07
1711.57
2010
1419
161
1221
21126864
5.80E+07
1744.04
2011
1681
230
2058
39011525
7.20E+07
1777.01
2012
1414
58
1856
63980064
9.20E+07
1795
2013
1072
46
4379
1.05E+08
1.30E+08
1814
2014
1150
59
4223
1.98E+08
1.40E+08
1832
2015
1068
51
4451
1.53E+08
1.50E+08
1850
2016
1168
34
4599
5.10E+08
1.70E+08
1868.82
2017
711
11
4208
7.87E+08
1.80E+08
1911.22
The higher education data of Hamedan Province Source: see Table 1 and Section 2.2.
grad
st
hei
prof
acprof
asprof
2005
5762
2006
5400
34112
28
19
59
440
2007
3553
20602
33
10
44
406
2008
11002
72207
41
20
50
359
2009
14797
81038
38
22
75
539
2010
21102
85712
47
28
104
640
2011
11617
96177
49
35
120
713
2012
17710
100805
49
30
110
652
2013
16356
97107
57
56
145
793
2014
16004
106362
54
60
148
827
2015
16378
101771
56
73
187
882
2016
15929
88427
50
83
215
955
2017
81467
55
85
227
1050
lctu
aslctu
edust
bud
rgdp
rpop
2005
2.81E+08
2.60E+07
1698.96
2006
476
15
940
2.87E+08
3.20E+07
1703.27
2007
468
12
999
1.58E+08
4.20E+07
1714.26
2008
638
5
255
2.29E+08
4.90E+07
1725.26
2009
1117
140
1225
2.67E+08
5.80E+07
1736.26
2010
1227
196
1496
2.88E+08
6.80E+07
1747.26
2011
1485
112
1529
3.54E+08
9.10E+07
1758.27
2012
928
98
1561
4.65E+08
1.10E+08
1754
2013
951
52
3214
6.18E+08
1.60E+08
1750
2014
942
31
3344
1.02E+09
1.60E+08
1746
2015
910
93
3436
1.36E+09
1.70E+08
1742
2016
875
11
3327
2.15E+09
1.90E+08
1738.23
2017
804
3
3486
2.88E+09
2.00E+08
1761.54
The higher education data of Hormozgan Province Source: see Table 1 and Section 2.2.
grad
st
hei
prof
acprof
asprof
2005
1882
2006
1816
14793
15
8
14
252
2007
904
8692
13
4
19
233
2008
4528
27215
19
3
20
231
2009
7715
52499
24
7
27
269
2010
9183
62456
35
5
22
295
2011
9191
68898
34
10
21
341
2012
10078
71995
38
8
17
292
2013
11180
81936
49
4
25
350
2014
12089
92196
53
19
49
509
2015
14520
95539
52
16
55
632
2016
14036
77659
50
14
76
737
2017
69535
46
14
75
540
lctu
aslctu
edust
bud
rgdp
rpop
2005
17215769
3.60E+07
1367.9
2006
250
21
607
17848593
4.20E+07
1403.67
2007
202
7
692
17848812
5.10E+07
1437.2
2008
333
306
20225735
6.60E+07
1471.4
2009
835
192
576
1.12E+09
6.80E+07
1506.29
2010
888
216
1024
4.55E+09
8.80E+07
1541.88
2011
1070
158
1017
8.02E+09
1.40E+08
1578.18
2012
880
145
1102
1.74E+08
1.80E+08
1616
2013
1081
146
2404
3.14E+10
2.50E+08
1654
2014
1134
136
3092
2.63E+10
2.60E+08
1694
2015
1180
122
3521
8.18E+09
2.50E+08
1735
2016
1177
95
3354
1.79E+09
2.90E+08
1776.42
2017
601
14
3556
1.81E+09
3.10E+08
1804.97
The higher education data of Ilam Province Source: see Table 1 and Section 2.2.
grad
st
hei
prof
acprof
asprof
2005
1094
2006
920
11457
9
0
0
111
2007
905
8433
13
75
2008
4417
21710
15
78
2009
5035
29298
16
5
101
2010
5803
40651
26
2
124
2011
5595
44444
23
18
3
162
2012
4614
44947
25
3
6
204
2013
6269
44641
27
3
16
234
2014
7449
45366
27
3
12
238
2015
9421
49013
29
4
40
305
2016
7553
39701
26
5
44
332
2017
35005
26
11
62
315
lctu
aslctu
edust
bud
rgdp
rpop
2005
4677861.7
2.30E+07
539.459
2006
217
10
337
4902957
3.20E+07
545.787
2007
206
16
269
6320002
4.80E+07
548.122
2008
227
13
106
6998574
5.20E+07
550.471
2009
487
53
508
7912372
4.70E+07
552.833
2010
470
51
670
9949163
6.40E+07
555.209
2011
499
82
1123
14151249
8.20E+07
557.599
2012
478
56
856
19736961
6.60E+07
562
2013
442
35
2131
22870974
9.80E+07
566
2014
500
10
2234
27899278
1.00E+08
571
2015
427
23
2510
32505219
8.30E+07
575
2016
580
4
2446
64656637
9.40E+07
580.158
2017
335
1
2938
1.30E+08
9.80E+07
580.87
The higher education data of Kerman Province Source: see Table 1 and Section 2.2.
grad
st
hei
prof
acprof
asprof
2005
7729
2006
5652
44990
42
40
83
623
2007
3111
31063
43
32
58
498
2008
15726
76686
53
58
46
530
2009
30808
120229
60
66
72
727
2010
23421
145237
82
83
157
926
2011
19439
158067
86
100
185
1029
2012
23498
161657
84
82
205
1142
2013
28678
167117
103
111
237
1318
2014
24081
173486
98
112
251
1422
2015
26151
171125
98
135
258
1645
2016
26251
156887
100
178
302
1905
2017
143033
100
193
345
1583
lctu
aslctu
edust
bud
rgdp
rpop
2005
2.33E+09
4.90E+07
2584.96
2006
840
42
988
2.36E+09
6.90E+07
2652.41
2007
753
34
1000
8.95E+08
8.60E+07
2707.35
2008
866
32
263
2.80E+09
8.90E+07
2763.45
2009
1839
104
1672
3.95E+09
1.00E+08
2820.74
2010
1891
161
2411
5.17E+09
1.40E+08
2879.25
2011
2320
178
4303
7.89E+09
1.70E+08
2938.99
2012
1992
235
3436
8.54E+09
2.30E+08
2983
2013
1809
153
9485
1.36E+10
3.50E+08
3028
2014
2000
190
7531
1.58E+10
3.70E+08
3073
2015
2038
168
8490
1.92E+10
3.60E+08
3119
2016
2021
111
8993
2.17E+10
4.10E+08
3164.72
2017
1295
30
8047
2.55E+10
4.30E+08
3233.94
The higher education data of Kermanshah Source: see Table 1 and Section 2.2.
grad
st
hei
prof
acprof
asprof
2005
4030
2006
2665
33330
27
19
23
355
2007
2330
15641
16
1
14
232
2008
8320
61277
38
7
18
253
2009
15142
70509
34
10
29
261
2010
9443
77917
42
9
41
426
2011
8891
82927
43
16
58
461
2012
12897
91720
43
28
69
518
2013
12235
95158
55
34
86
582
2014
14658
102009
52
37
97
673
2015
16911
102882
59
49
128
778
2016
16174
92457
55
55
140
816
2017
81518
53
51
172
901
lctu
aslctu
edust
bud
rgdp
rpop
2005
58324142
2.80E+07
1867.61
2006
373
48
1171
59993240
3.40E+07
1879.39
2007
494
48
1254
59993344
4.30E+07
1892.06
2008
540
34
638
2.52E+08
5.40E+07
1904.97
2009
1127
78
1360
3.54E+08
6.30E+07
1918.14
2010
1304
67
1065
5.46E+08
8.10E+07
1931.55
2011
1138
77
1861
8.83E+08
1.10E+08
1945.23
2012
1056
106
1429
1.10E+09
1.40E+08
1946
2013
1086
101
3260
1.35E+09
1.70E+08
1948
2014
1099
52
3271
1.85E+09
3.70E+08
1949
2015
1269
70
4045
1.51E+09
3.60E+08
1951
2016
1220
64
4198
3.60E+09
4.00E+08
1952.43
2017
484
25
4397
4.27E+09
4.20E+08
1975.79
The higher education data of Khuzestan Province Source: see Table 1 and Section 2.2.
grad
st
hei
prof
acprof
asprof
2005
6592
2006
6362
42938
35
75
126
641
2007
3000
24581
35
68
96
549
2008
24046
84059
60
49
85
432
2009
30278
205261
61
110
182
942
2010
32926
223145
72
115
245
1238
2011
28579
234814
111
162
313
1352
2012
35846
251685
120
126
252
1204
2013
39081
253454
133
119
294
1348
2014
38679
262316
125
115
269
1485
2015
44811
267118
139
149
316
1754
2016
42288
244757
137
254
479
2109
2017
218731
129
206
349
1901
lctu
aslctu
edust
bud
rgdp
rpop
2005
1.98E+09
3.70E+08
4218.37
2006
740
40
1284
2.01E+09
4.50E+08
4274.98
2007
605
33
1221
2.38E+09
6.00E+08
4325.44
2008
745
20
460
2.41E+09
6.50E+08
4376.35
2009
3778
603
1646
3.63E+09
5.70E+08
4427.69
2010
4041
649
1948
4.90E+09
7.70E+08
4479.48
2011
4531
474
3438
6.41E+09
1.00E+09
4531.72
2012
5170
461
1710
7.59E+09
9.10E+08
4567
2013
4685
357
5187
1.27E+10
1.30E+09
4603
2014
6139
394
5166
1.51E+10
2.30E+09
4639
2015
6425
448
6408
1.92E+10
1.80E+09
4675
2016
6409
314
6308
2.50E+10
2.00E+09
4710.51
2017
2086
56
7744
2.91E+10
2.10E+09
4776.9
The higher education data of Kohgiluyeh and Buyer Ahmad Province Source: see Table 1 and Section 2.2.
grad
st
hei
prof
acprof
asprof
2005
1642
2006
773
9385
8
0
0
105
2007
1003
5444
14
134
2008
4271
11177
14
3
147
2009
7205
36964
15
7
287
2010
4850
43640
18
11
238
2011
6352
47492
25
1
18
250
2012
6726
50748
23
2
17
253
2013
7507
53654
32
3
20
282
2014
7572
48207
27
3
18
289
2015
8794
57724
33
5
48
333
2016
8246
49743
32
11
69
363
2017
41209
27
18
91
419
lctu
aslctu
edust
bud
rgdp
rpop
2005
5265326.1
1.00E+08
624.564
2006
156
0
269
5512545
1.20E+08
634.299
2007
185
6
126
8733679
1.20E+08
638.984
2008
228
103
9985606
1.30E+08
643.757
2009
796
34
195
12613400
1.10E+08
648.621
2010
634
43
485
12675544
1.50E+08
653.577
2011
730
30
1323
16067901
1.90E+08
658.629
2012
828
41
747
20725137
1.40E+08
669
2013
828
36
2200
36753111
2.10E+08
680
2014
964
21
2179
42664061
1.90E+08
691
2015
839
28
2688
49658348
1.50E+08
702
2016
746
13
2630
88362414
1.70E+08
713.052
2017
259
9
2919
1.48E+08
1.70E+08
712.992
The higher education data of Kordestan Province Source: see Table 1 and Section 2.2.
grad
st
hei
prof
acprof
asprof
2005
2214
2006
3380
19476
16
0
3
131
2007
1688
8353
13
1
2
154
2008
5296
40944
24
3
2
147
2009
7847
46165
23
2
14
215
2010
7042
51810
26
2
19
205
2011
6813
56755
25
2
26
322
2012
9487
63860
29
3
28
344
2013
8445
64465
40
5
38
416
2014
10796
68162
35
2
27
433
2015
10822
70107
39
10
67
507
2016
10409
62916
39
17
97
561
2017
54747
36
23
108
562
lctu
aslctu
edust
bud
rgdp
rpop
2005
17952712
1.70E+07
1429.33
2006
230
20
416
18606957
2.20E+07
1440.16
2007
348
18
355
1.72E+08
2.80E+07
1450.26
2008
494
17
209
29023152
3.40E+07
1460.66
2009
423
13
955
67610560
3.90E+07
1471.35
2010
391
40
967
98280281
4.70E+07
1482.35
2011
480
66
1845
1.58E+08
6.40E+07
1493.65
2012
438
61
1123
2.04E+08
7.60E+07
1514
2013
414
25
2543
3.32E+08
1.10E+08
1535
2014
411
49
2729
4.36E+08
1.10E+08
1557
2015
513
53
3251
5.57E+08
1.20E+08
1580
2016
525
56
3148
8.12E+08
1.30E+08
1603.01
2017
483
21
3119
1.05E+09
1.40E+08
1602.02
The higher education data of Lorestan Province Source: see Table 1 and Section 2.2.
grad
st
hei
prof
acprof
asprof
2005
1956
2006
2759
21150
16
0
3
172
2007
2036
17514
24
4
190
2008
9294
36016
30
2
4
224
2009
14496
75031
29
2
10
319
2010
14474
83537
45
3
18
380
2011
10737
89952
48
8
21
454
2012
12828
96912
51
10
42
638
2013
15833
99977
59
25
44
537
2014
15243
105030
61
21
57
495
2015
16943
109519
59
15
75
611
2016
16601
92204
56
55
90
649
2017
84654
55
37
99
722
lctu
aslctu
edust
bud
rgdp
rpop
2005
13653374
2.20E+07
1701.59
2006
260
8
378
14179798
2.90E+07
1716.53
2007
271
2
620
10582487
3.40E+07
1724.13
2008
543
367
39444069
4.00E+07
1731.7
2009
1510
61
864
31777033
4.60E+07
1739.24
2010
1473
85
1435
28120419
5.90E+07
1746.76
2011
1713
331
2014
40519176
7.20E+07
1754.24
2012
2029
131
1486
63521074
9.40E+07
1756
2013
1599
96
2646
1.09E+08
1.30E+08
1757
2014
1513
26
3722
2.84E+08
1.40E+08
1758
2015
1564
30
4034
4.10E+08
1.40E+08
1759
2016
1620
178
3566
8.23E+08
1.60E+08
1760.65
2017
680
20
4380
1.16E+09
1.70E+08
1775.1
The higher education data of Markazi Province Source: see Table 1 and Section 2.2.
grad
st
hei
prof
acprof
asprof
2005
3053
2006
2075
29865
26
9
30
293
2007
1076
12324
16
9
21
261
2008
12449
59959
35
20
23
290
2009
20580
109403
41
20
68
707
2010
18548
113793
53
14
44
684
2011
18811
117618
64
21
60
805
2012
23228
119836
63
19
61
883
2013
21170
112428
67
23
85
947
2014
20070
112369
61
27
81
1022
2015
21219
112687
67
30
130
1123
2016
17853
95208
62
44
119
1210
2017
85571
56
37
110
911
lctu
aslctu
edust
bud
rgdp
rpop
2005
29986969
3.80E+07
1337.83
2006
361
46
932
30970432
4.90E+07
1351.26
2007
229
9
809
30970590
6.00E+07
1363.28
2008
722
46
233
19604963
6.90E+07
1375.56
2009
2930
409
932
32288973
7.60E+07
1388.09
2010
2861
391
1644
35652564
9.20E+07
1400.89
2011
2769
244
2265
43210243
1.30E+08
1413.96
2012
3374
713
1642
65841577
1.70E+08
1417
2013
2735
616
2892
1.12E+08
2.10E+08
1420
2014
2932
641
3671
1.76E+08
2.80E+08
1423
2015
2944
646
3561
2.13E+08
2.70E+08
1426
2016
3028
645
3329
2.92E+08
3.10E+08
1429.47
2017
980
23
4221
3.80E+08
3.20E+08
1450.55
The higher education data of Mazandaran Province Source: see Table 1 and Section 2.2.
grad
st
hei
prof
acprof
asprof
2005
10415
2006
11778
69104
66
35
91
849
2007
8824
58511
98
44
90
949
2008
24056
131831
95
54
103
972
2009
55755
182737
104
77
142
1235
2010
39548
219023
131
58
165
1339
2011
37033
240336
147
61
179
1537
2012
43136
254361
137
83
251
1502
2013
47334
250133
149
78
268
1688
2014
47352
241244
139
105
288
1921
2015
48842
244890
139
170
440
2079
2016
46062
222033
150
194
486
2232
2017
211262
149
211
538
1950
lctu
aslctu
edust
bud
rgdp
rpop
2005
8.13E+08
6.40E+07
2887.2
2006
1420
99
2100
8.27E+08
7.60E+07
2922.43
2007
1847
89
3018
1.07E+09
9.70E+07
2952.47
2008
2739
77
901
1.21E+09
1.30E+08
2982.65
2009
4361
178
3561
4.21E+09
1.40E+08
3012.95
2010
4330
309
4208
5.86E+09
1.70E+08
3043.38
2011
5571
252
5634
7.89E+09
2.10E+08
3073.94
2012
4150
141
7200
7.14E+09
2.60E+08
3115
2013
3282
96
9670
1.34E+10
3.60E+08
3157
2014
3637
93
11225
2.35E+10
3.80E+08
3198
2015
3955
265
12004
3.71E+10
4.20E+08
3241
2016
3922
57
11752
6.94E+10
4.70E+08
3283.58
2017
2092
19
11772
8.88E+10
5.00E+08
3303.25
The higher education data of North Khorasan Province Source: see Table 1 and Section 2.2.
grad
st
hei
prof
acprof
asprof
2005
697
2006
922
7241
7
0
0
5
2007
613
2823
6
8
2008
4613
17543
14
12
2009
5287
27785
14
2
3
77
2010
5118
33086
20
2
3
83
2011
4941
35169
20
2
97
2012
6201
41681
21
0
3
97
2013
6731
41263
23
0
3
144
2014
7558
44781
25
0
5
186
2015
8951
44992
28
3
10
306
2016
8156
41034
27
14
35
387
2017
36997
27
14
31
452
lctu
aslctu
edust
bud
rgdp
rpop
2005
3940532
1.20E+07
802.729
2006
22
0
229
4129524.2
1.60E+07
811.572
2007
63
385
4325733.7
1.90E+07
822.479
2008
195
191
4529366.5
2.30E+07
833.545
2009
519
22
431
4740632.7
2.60E+07
844.773
2010
554
32
523
4959746.2
2.70E+07
856.165
2011
589
41
1170
5186924.8
3.60E+07
867.727
2012
676
83
767
5422390.7
4.50E+07
867
2013
602
50
1756
5540532
6.40E+07
866
2014
619
44
2307
5604027
6.50E+07
865
2015
646
43
2461
10601815
7.00E+07
864
2016
766
19
2288
24306036
7.90E+07
863.092
2017
425
0
2468
20461610
8.40E+07
885.053
The higher education data of Qazvin Province Source: see Table 1 and Section 2.2.
grad
st
hei
prof
acprof
asprof
2005
2829
2006
3712
26590
27
11
25
545
2007
7355
22650
37
2
23
430
2008
13760
48436
34
4
20
403
2009
21948
85099
42
50
48
625
2010
17391
99103
56
49
66
679
2011
19128
115137
77
29
103
869
2012
24010
122865
71
32
83
691
2013
21925
129391
81
32
104
909
2014
23775
133944
74
32
107
974
2015
24075
126061
70
49
172
1109
2016
21223
107337
63
59
174
1117
2017
89219
53
40
181
964
lctu
aslctu
edust
bud
rgdp
rpop
2005
1.36E+08
2.60E+07
1124.7
2006
394
3
918
1.39E+08
3.30E+07
1143.2
2007
1047
41
918
1.12E+08
4.00E+07
1154.69
2008
1326
33
240
1.24E+08
5.30E+07
1166.28
2009
2401
146
1229
1.47E+08
5.80E+07
1177.95
2010
2369
146
1731
1.68E+08
6.50E+07
1189.71
2011
2810
148
2142
1.83E+08
8.70E+07
1201.56
2012
2321
106
2404
2.14E+08
1.10E+08
1216
2013
2217
75
3808
2.45E+08
1.60E+08
1230
2014
2424
91
3963
2.53E+08
2.10E+08
1244
2015
2326
101
4223
2.55E+08
2.10E+08
1259
2016
2184
113
4470
3.08E+08
2.40E+08
1273.76
2017
779
26
4310
3.28E+08
2.50E+08
1283.67
The higher education data of Qom Province Source: see Table 1 and Section 2.2.
grad
st
hei
prof
acprof
asprof
2005
2012
2006
2023
14315
12
12
22
227
2007
1331
9775
19
49
60
395
2008
3472
31906
26
15
43
283
2009
6238
40373
24
17
66
442
2010
7017
44298
31
16
46
417
2011
6519
50708
32
54
90
616
2012
8062
57653
34
26
79
578
2013
8938
60693
36
26
86
744
2014
9634
66212
41
32
103
746
2015
13071
73528
44
40
140
893
2016
11285
71784
44
43
179
911
2017
66735
46
50
247
951
lctu
aslctu
edust
bud
rgdp
rpop
2005
43994.08
1.80E+07
1026.84
2006
232
2
432
49711
2.10E+07
1046.74
2007
526
13
310
170368
2.80E+07
1066.98
2008
579
5
304
318434
3.30E+07
1087.59
2009
605
10
988
19738926
3.70E+07
1108.57
2010
584
9
1259
27912880
4.50E+07
1129.93
2011
789
20
1785
39819403
6.00E+07
1151.67
2012
466
23
1693
58030551
7.80E+07
1179
2013
416
5
2264
89200020
1.00E+08
1206
2014
380
3
2993
1.80E+08
1.20E+08
1234
2015
454
10
3337
1.74E+08
1.40E+08
1263
2016
487
0
2862
2.46E+08
1.60E+08
1292.28
2017
444
7
3036
3.98E+08
1.70E+08
1305.3
The higher education data of Razavi Khorasan Province Source: see Table 1 and Section 2.2.
grad
st
hei
prof
acprof
asprof
2005
12571
2006
12330
84124
83
94
350
485
2007
10693
54092
82
140
272
843
2008
29678
143986
104
168
296
1072
2009
55377
207476
126
223
348
1346
2010
36548
232268
158
256
473
1416
2011
33571
245218
145
237
449
1579
2012
42798
270601
151
269
469
1633
2013
43472
269257
169
304
558
1845
2014
42282
299168
173
348
547
2093
2015
49872
302725
179
394
670
2369
2016
49302
269630
175
441
752
2551
2017
254734
171
388
678
2273
lctu
aslctu
edust
bud
rgdp
rpop
2005
6.09E+09
9.30E+07
5500.88
2006
1017
39
2773
6.16E+09
1.20E+08
5593.08
2007
1469
173
2678
2.39E+09
1.50E+08
5671.76
2008
2932
62
1312
6.12E+09
1.70E+08
5751.23
2009
3811
152
4606
2.24E+10
2.10E+08
5831.49
2010
4064
193
5037
2.22E+10
2.60E+08
5912.55
2011
3903
225
7519
2.63E+10
3.40E+08
5994.4
2012
3360
338
7915
2.87E+10
4.00E+08
6080
2013
3074
182
11466
3.13E+10
5.70E+08
6167
2014
3355
195
12880
3.80E+10
6.30E+08
6255
2015
3480
260
13673
4.18E+10
6.60E+08
6344
2016
3621
153
13593
4.45E+10
7.50E+08
6434.5
2017
1718
29
11821
6.46E+10
7.90E+08
6507.17
The higher education data of Semnan Province Source: see Table 1 and Section 2.2.
grad
st
hei
prof
acprof
asprof
2005
3807
2006
3596
26992
25
2
20
431
2007
3161
22665
35
2
14
398
2008
8481
51808
32
2
27
454
2009
18777
82182
42
7
64
684
2010
13258
83647
49
12
80
828
2011
11422
94193
57
18
109
1179
2012
15204
103697
56
39
138
1235
2013
15697
100526
61
36
135
1125
2014
16509
109737
78
47
173
1165
2015
16690
108297
63
68
275
1592
2016
16056
98807
59
68
290
1456
2017
88924
60
58
245
1089
lctu
aslctu
edust
bud
rgdp
rpop
2005
46128.879
1.50E+07
580.452
2006
455
11
735
52061
1.90E+07
589.233
2007
528
16
657
41305565
2.30E+07
597.296
2008
893
4
298
14473932
3.00E+07
605.462
2009
1789
39
1274
1.25E+09
3.30E+07
613.733
2010
1974
56
1734
1.59E+09
4.40E+07
622.111
2011
2046
66
1699
2.21E+09
5.80E+07
630.596
2012
1715
104
1784
3.29E+09
6.80E+07
644
2013
1505
82
2713
3.92E+09
9.50E+07
658
2014
1475
81
3398
6.52E+09
1.00E+08
673
2015
1572
90
3521
7.02E+09
1.10E+08
687
2016
1522
78
3190
1.06E+10
1.20E+08
702.36
2017
883
5
3382
1.17E+10
1.30E+08
704.349
The higher education data of Sistan and Baluchestan Province Source: see Table 1 and Section 2.2.
grad
st
hei
prof
acprof
asprof
2005
4365
2006
4352
41373
28
7
19
433
2007
3902
41548
45
6
27
426
2008
9054
53953
30
2
31
495
2009
15105
80926
35
4
33
568
2010
10418
83164
45
13
70
675
2011
10976
86055
44
14
64
638
2012
12844
92727
47
21
105
502
2013
13249
95807
52
21
105
537
2014
14754
97952
50
22
114
587
2015
16738
110915
58
28
152
676
2016
15072
101822
65
35
164
775
2017
96217
60
59
184
824
lctu
aslctu
edust
bud
rgdp
rpop
2005
1.23E+08
2.00E+07
2334.74
2006
758
14
694
1.26E+08
2.30E+07
2405.74
2007
752
25
463
9.37E+08
2.80E+07
2431.13
2008
855
6
156
2.02E+08
3.50E+07
2456.68
2009
1477
44
489
3.51E+08
4.10E+07
2482.41
2010
1212
76
1275
9.02E+08
6.00E+07
2508.29
2011
1174
118
2123
1.91E+09
7.80E+07
2534.33
2012
1199
64
1407
2.52E+09
1.00E+08
2581
2013
1230
51
2080
5.20E+09
1.30E+08
2629
2014
1334
45
2703
7.35E+09
1.50E+08
2677
2015
1444
119
2718
8.81E+09
1.60E+08
2725
2016
1354
49
2952
1.09E+10
1.90E+08
2775.01
2017
1095
22
2930
1.17E+10
1.90E+08
2786.41
The higher education data of South Khorasan Province Source: see Table 1 and Section 2.2.
grad
st
hei
prof
acprof
asprof
2005
2384
2006
549
12421
13
3
5
98
2007
1630
8154
6
5
9
159
2008
4419
27825
18
2
10
177
2009
5100
33423
19
3
9
216
2010
5037
36778
24
3
24
249
2011
5058
42743
24
6
30
284
2012
7165
45655
22
5
58
483
2013
6459
44325
24
4
53
348
2014
7798
47561
27
6
98
480
2015
8083
50381
31
17
119
625
2016
8068
45478
31
27
188
681
2017
44475
34
34
136
492
lctu
aslctu
edust
bud
rgdp
rpop
2005
22847989
9.00E+06
625.624
2006
204
61
490
23640350
1.20E+07
702.827
2007
214
7
529
12588694
1.60E+07
708.559
2008
302
4
362
26317321
1.90E+07
714.36
2009
590
84
749
36198655
2.20E+07
720.231
2010
581
103
881
39540624
2.30E+07
726.175
2011
518
36
1548
42905592
3.00E+07
732.192
2012
620
81
1154
48632052
3.90E+07
739
2013
599
48
1456
90392188
5.30E+07
747
2014
649
41
2063
1.39E+08
5.80E+07
754
2015
724
49
2226
1.82E+08
6.80E+07
761
2016
734
56
2281
2.79E+08
7.70E+07
768.898
2017
409
8
2244
3.68E+08
8.10E+07
785.061
The higher education data of West Azerbaijan Province Source: see Table 1 and Section 2.2.
grad
st
hei
prof
acprof
asprof
2005
5748
2006
5960
37705
30
11
46
332
2007
3678
22432
31
16
55
352
2008
11847
73841
41
20
66
394
2009
20265
95819
48
29
80
501
2010
17174
104919
62
32
110
580
2011
14626
120870
66
41
111
688
2012
21572
127448
68
100
164
949
2013
21542
131596
73
109
193
1035
2014
20712
139729
76
109
248
1087
2015
24178
138644
78
112
295
1209
2016
24417
128856
82
122
359
1333
2017
116097
79
145
226
1140
lctu
aslctu
edust
bud
rgdp
rpop
2005
3.44E+08
3.70E+07
2832.9
2006
341
13
910
3.51E+08
4.70E+07
2873.46
2007
341
9
753
3.33E+08
5.60E+07
2913.63
2008
666
6
496
3.95E+08
6.80E+07
2954.41
2009
1456
80
1465
9.35E+08
8.50E+07
2995.82
2010
1399
132
1663
1.08E+09
9.40E+07
3037.87
2011
2020
147
3268
1.34E+09
1.30E+08
3080.58
2012
1597
142
2079
1.77E+09
1.60E+08
3117
2013
1689
96
5223
2.30E+09
2.20E+08
3153
2014
1896
62
5496
3.83E+09
2.40E+08
3190
2015
1796
149
5729
3.90E+09
2.50E+08
3227
2016
1889
45
5652
5.22E+09
2.90E+08
3265.22
2017
1078
54
6208
5.75E+09
3.10E+08
3309.57
The higher education data of Yazd Province Source: see Table 1 and Section 2.2.
grad
st
hei
prof
acprof
asprof
2005
5261
2006
4898
33448
30
12
17
241
2007
3227
22154
33
7
34
358
2008
12023
52618
35
22
34
370
2009
21918
82735
47
13
60
547
2010
14476
83188
53
18
97
676
2011
12851
88094
47
25
111
714
2012
15905
91703
48
19
108
698
2013
15398
87495
55
42
147
872
2014
13161
94679
54
27
147
845
2015
14728
94076
56
52
198
992
2016
15355
83836
57
58
249
1154
2017
81367
57
73
210
991
lctu
aslctu
edust
bud
rgdp
rpop
2005
1.21E+08
2.30E+07
972.075
2006
328
8
795
1.24E+08
3.00E+07
924.411
2007
551
71
995
1.61E+08
3.90E+07
939.973
2008
792
932
1.98E+08
4.80E+07
955.786
2009
1457
123
2029
3.23E+08
5.50E+07
971.854
2010
1361
80
2401
4.97E+08
8.00E+07
988.18
2011
1452
144
2227
7.42E+08
1.00E+08
1004.77
2012
1316
164
2587
9.18E+08
1.50E+08
1030
2013
2366
147
3580
1.90E+09
2.00E+08
1056
2014
1174
105
4074
2.40E+09
2.20E+08
1083
2015
1115
317
4540
6.72E+09
2.20E+08
1110
2016
1234
115
4404
9.24E+09
2.50E+08
1138.53
2017
548
13
4557
1.12E+10
2.60E+08
1132.61
The higher education data of Zanjan Province Source: see Table 1 and Section 2.2.
grad
st
hei
prof
acprof
asprof
2005
2430
2006
3656
18375
18
21
14
253
2007
1211
11442
20
15
25
310
2008
6666
33994
23
9
21
338
2009
9993
59116
25
49
55
523
2010
11743
63545
34
20
41
517
2011
9907
71804
44
27
74
761
2012
14083
76371
39
32
62
593
2013
11408
73393
41
54
79
680
2014
12856
75274
38
64
93
752
2015
13523
71305
41
66
118
907
2016
13069
60258
39
58
145
939
2017
54842
36
45
182
819
lctu
aslctu
edust
bud
rgdp
rpop
2005
14764908
1.70E+07
957.235
2006
322
7
626
15325081
2.10E+07
964.601
2007
292
7
564
5567575
2.50E+07
974.399
2008
591
21
96
29823792
3.10E+07
984.406
2009
1420
82
1044
50324931
3.50E+07
994.627
2010
1427
120
1339
69855066
4.30E+07
1005.07
2011
1882
23
2289
1.28E+08
5.40E+07
1015.73
2012
1687
68
1210
1.95E+08
7.00E+07
1024
2013
1359
38
2959
3.51E+08
9.60E+07
1032
2014
1416
36
3009
6.52E+08
1.20E+08
1040
2015
1522
44
3132
9.08E+08
1.40E+08
1049
2016
1089
36
2970
1.39E+09
1.60E+08
1057.46
2017
529
7
3052
1.81E+09
1.60E+08
1068.62