
Abstract
While the U.S. Census Bureau has microdata files from the 1960 through 1990 Decennial Censuses, respondent names were never digitized. Names from these censuses are only available in handwritten form on microfilm images of the original census manuscripts. In this paper, we document the 1990 Census Name Recovery Pilot (NRP) project, which was used to identify the most accurate and cost-effective means to recover respondent names, focusing on the example of the 1990 Census. In addition to describing the four stages of the project, the results of the NRP are presented in detail. The NRP showed that respondent names can be accurately digitized to support the integration of the 1960 through 1990 Censuses into the Census Bureau’s infrastructure of linked data from censuses, surveys, and administrative records.
Introduction
While the U.S. Census Bureau has microdata files from the 1960 through 1990 Decennial Censuses, respondent names were never digitized. Names from these censuses are only available on microfilm images of the original census manuscripts, in the respondents’ own handwriting. In this paper, we document a pilot project to use Optical Character Recognition (OCR) to recover respondent names from a small sample of the 1990 Census, with the intent of developing and documenting methods that could be used for a full-production recovery of all respondent names from the 1960 to 1990 Decennial Censuses. With recovered names, it will be possible to create anonymized linkage keys that will allow researchers to link records from these censuses to other files in Census Bureau’s current Data Linkage Infrastructure, which contains hundreds of linkable survey and administrative data files from states, other federal agencies, and the Census Bureau itself [1].
The 1990 Census Name Recovery Pilot (NRP) involved four distinct stages: digitizing images from a sample of 1990 Census microfilms, creating data of hand-entered names for training and testing of the OCR algorithms, carrying out OCR using automated handwriting recognition processes on digitized images, and evaluating the quality of the output. Every stage of the NRP had an experimental component, with the goal of identifying the least expensive and most accurate approaches for a future full-production project to recover names from all 1960–1990 Census images. In the sections below, we describe the motivation for this work and each of the project’s four stages. We show the results of the hand keying and OCR, and we conclude by discussing potential improvements for the full capture of names from the 1990 Census.
Motivation: The expansion of the Census Bureau’s data linkage infrastructure
The Census Bureau maintains a large set of anonymized linkable data files covering much of the U.S. population from 1940 forward, including census data, survey data, and administrative records. The research-ready infrastructure has been developed by the Census Bureau for reducing data collection needs, and it has been enhanced by government-academic collaborations that have led to innovations in data recovery, record linkage, and restricted data access. The infrastructure already includes censuses from 1940, 2000, and 2010, and will include 2020 soon. When combined with other linked historical records being constructed outside of government, this longitudinal data resource can also include linked records from the censuses from 1850 through 1930.
The major shortcoming of this growing infrastructure is that it lacks linked files from the decennial censuses of 1950 through 1990. The Census Bureau created high-quality microdata files for most of these years in order to produce tabulations of the population, but these microdata files never included respondent names. Without names, these files have never been assigned anonymous unique identifiers that could be used to link the files to one another or to other administrative and survey data from the Data Linkage Infrastructure. The individual names for these censuses are only available as handwritten entries on microfilmed images of the original census forms, which are securely stored at the Census Bureau’s National Processing Center in Jeffersonville, Indiana.
It may seem odd that researchers have access to high-quality linked files from prior to 1950 and from 2000 forward, but not in the intervening years. Beginning with the 2000 Census, the Census Bureau digitized individual names from all records prior to creating counts and statistics of the population [2]. Names were used to facilitate the removal of duplicate responses. While the Census Bureau did not digitize names from any earlier files, genealogical organizations have typically done so after the original Census records are released to the public from the National Archives and Records Administration, following the 72-year embargo period on decennial census records [3]. The 1940 Census was made public in 2012. Over the next two years, the 1940 data was digitized by a genealogical-academic collaboration and subsequently made available to researchers from Integrated Public Use Microdata Series (IPUMS) at the University of Minnesota. The Census Bureau obtained a copy of the 1940 data from IPUMS for linkage and distribution to IPUMS approved researchers via a Joint Statistical Project agreement.
In 2015, Census Bureau researchers added identification keys to the 1940 Census using names and other information, so it could be linked forward to the 2000 census and other modern files anonymously [4]. Dozens of researchers are already using this linked data inside the Census Bureau and in the Federal Statistical Research Data Centers (FSRDCs). The 1950 Census is likely to be digitized soon after it is made public in 2022 and can be incorporated using methods similar to those used for the 1940 data.
For these reasons, much of the work to enhance Census Bureau’s Data Linkage Infrastructure has been focused on the 1960 through 1990 Censuses. The goal of the NRP was to develop methods and evidence that could be used to incorporate these files into the larger longitudinal research infrastructure [5]. Since the 1960–1990 images and data are still confidential and will remain so for decades, all digitization and linkage work must take place on Census Bureau computing equipment within secure Census Bureau facilities. The scope of the NRP was narrowed to one census in order to make the most use of limited funds. We focused on 1990 in particular, following a set of National Academies of Sciences reports recommending that linkable 1990 Census data would be an ideal base file for a new, national study on income mobility [6, 7, 8].
The recovery of names from the 1990 Census presented unique challenges. While the Census Bureau has successfully used OCR in the capture of names from the 2000–2020 Censuses, that task was significantly different from this one. The capture of data from the 2000–2020 paper census forms benefited from forms that were designed for OCR. The 1990 Census forms were not optimized for OCR in any way. The 2000–2020 data capture for string variables (such as name) also included quality control and key-from-image editing when the OCR confidence was weak [9, 10, 11, 12]. Similar historical file digitization projects by genealogy companies and academic institutions also incorporate clerical edits into OCR processing [12, 13]. The estimated cost of recovering respondents’ names from the 1990 Census with current methods – including clerical edits – would exceed $17 million [5]. Thus, the NRP was developed to test the feasibility and accuracy of machine-based OCR that is not supported by any clerical edits or manual data entry beyond the creation of a “truth deck” for training and evaluation. Using automated methods without clerical edits, the OCR capture of the 1990 Census will cost significantly less, yet it is expected that the OCR output without clerical review will be of lower quality than data captured with manual effort. The NRP was established to test if the capture of the names was of high enough quality to allow for the assignment of anonymous linkage keys.
Stage 1: Digitizing microfilmed images
The 1990 Census images are stored on about 115,000 microfilm reels held at the Census Bureau’s National Processing Center in Jeffersonville, Indiana. Census respondents completed the questionnaire on paper, with the assistance of enumerators in many cases. Completed forms were sent to one of seven Census Bureau processing offices. Census Bureau staff created microfilmed images of the forms as they arrived. Each 100-foot microfilm reel holds approximately 1,800 images. Within each processing office, forms were sorted into smaller “district office” subregions prior to filming. Responses that contained only a “short form” (the 2-page questionnaire completed by all respondents) were stored on separate reels from responses that also contained a “long form” (an additional 45 questions completed by a subset of respondents). Group quarters responses (e.g., those in college dorms or jails) were typed and stored as Computer Output to Microfiche (COM). Since the digitization of COM records is significantly less challenging than handwriting recognition, and requires different hardware, group quarters recovery was not included in the NRP.
For the NRP, Census Bureau data processing staff created about one million digital images from 600 microfilm reels, including a sample of both short form and long form reels. The data processing team scanned many more images than we needed for our OCR tests, because we also had the goal of developing accurate cost estimates for the scanning process. Data processing staff used state-of-the-art equipment from two major microfilm scanner companies – Crowley Mekel and NextScan – in order to test whether either scanner worked better for OCR. Each scanning company provided in-person staff training as well as consultation on the optimal image settings for the subsequent OCR we needed to conduct. Our team created procedural documents for the processing staff and ensured that the scanners had the same basic image settings regarding file format, dots-per-inch, de-skewing, and color range. The operation of both scanners was similar, and time needed to scan a reel on both scanners was also similar.
Stage 2: Creating truth data for training and testing
In order to create data for training and evaluating the OCR, Census Bureau staff manually keyed information from 19,700 scanned census images. The keyed images came from 61 microfilm reels. The images were household sheets from the 1990 Census short form, which spanned across a folded page that was designed to be photographed, put on microfilm, and then read by a Film Optical Scanning Device for Input to Computer (FOSDIC) machine. Respondents provided most information via FOSDIC “bubbles” (see Fig. 1). Several fields included space for write-in information (e.g., information on American Indian tribe, other race, and other type of relative). For the age variable, respondents provided information as a handwritten response and via FOSDIC bubbles. Respondents wrote their names in boxes at the top of the form.
1990 Census Short Form.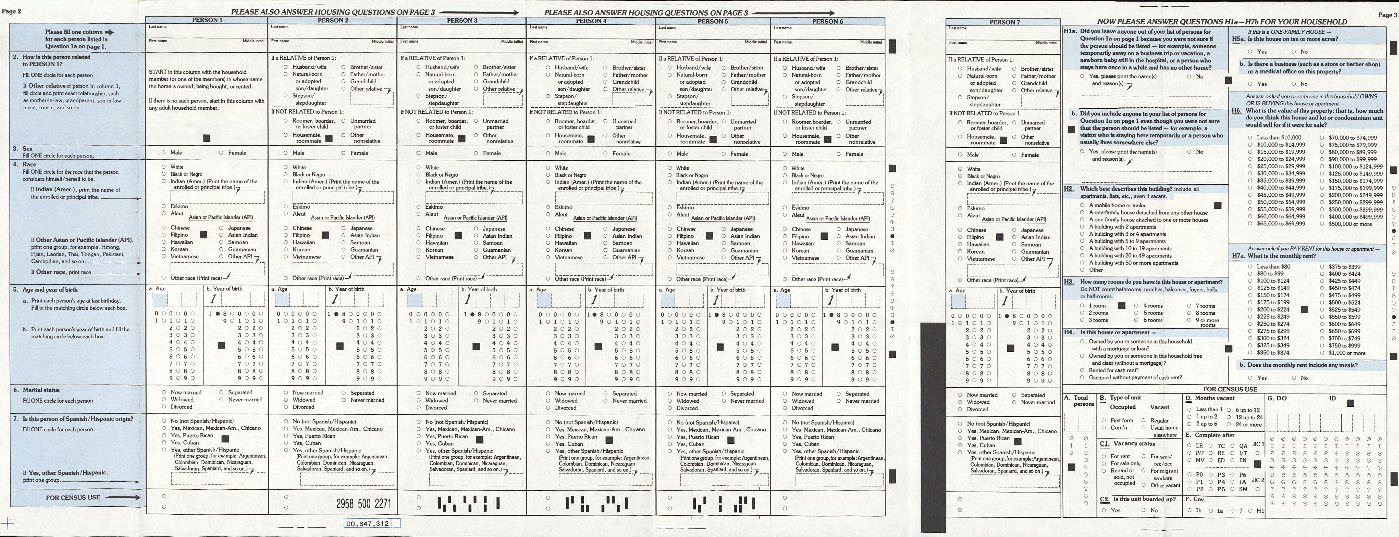
For each respondent, there was one box for last name and one box for first name and middle initial. The 11-digit household ID was present in one of two locations: as a machine-printed number beneath the second person’s responses, and a handwritten number and as a bubbled entry at the bottom right corner of the page.
The Census Bureau staff entered 45,000 person names from the 1990 images, which we refer to as truth data. Census Bureau staff entered each respondent’s first name, middle initial, last name, and age. The age variable was entered to serve as validation variable after appending names onto records in the existing 1990 microdata file (which also has age). Data processors also entered the household ID variable at the bottom of each form. The household ID variable is essential for linking the names back to the full microdata file that already exists for the 1990 Census. The processing staff used a customized key-from-image data entry application developed for this project (see Fig. 2).
Key-from-image screen from 1990 Name Recovery Pilot.
Two teams specializing in handwriting recognition were brought in to conduct the OCR component of this project. The participating teams were a private company that primarily works for banks and other commercial entities, and the University of Southern California’s Information Sciences Institute (USC ISI). USC ISI is an academic research center with a long track record of advancing the science of handwriting recognition, most prominently in government applications [14, 15, 16]. Since both teams were given access to original records protected by the Census Bureau’s privacy and confidentiality regulations, all participants were required to obtain Special Sworn Status and worked on computers not connected to the internet or intranet in a physically secure room at the Census Bureau headquarters in Suitland, Maryland. Both teams worked on the project for up to six months and brought in their own servers and software. The USC team later brought in a second server for more computational power.
Each team was provided with two-thirds of the 45,000 truth data records, along with the corresponding census images. The remaining one-third of the names and images were retained for evaluation of the OCR. We refer to this subset of the truth data given to the teams as the “training” records. The training records included data on 30,000 individuals from 14,300 households. The images drew from short form and long form reels, from both scanners. Teams were tasked with developing algorithms to capture first name, last name, middle initial, the 11-digit household ID, and age. The teams were also asked to produce up to three guesses for each item and to assign a confidence score to each guess.
In addition to the images and training data, the scanning teams were provided several “dictionaries” of names that would provide the set of options for the OCR software’s name assignment. The dictionaries were built from the Social Security Administration’s Numerical Identification file (Numident), which includes every name ever observed on an application for a Social Security Card. The Numident is a critical component of the Census Bureau’s record linkage software; any names recovered from the 1990 Census will ultimately need to be linked to an administrative records composite file based on the Numident. Four versions of the name dictionary were created from the Numident: a list of all first names and last names (16.3 million names total), a list of first and last names covering 99% of the population (5.3 million names), a list of first and last names covering 95% of the population (590,000 names), a list of first and last names covering 90% of the population (250,000 names). The dictionaries also indicated the number of times each name appeared in the full Numident. Both teams experimented with these dictionaries, and both found that the 95%–99% dictionaries yielded the best results.
Stage 4: Evaluating OCR quality
In order to fully evaluate the OCR output, one-third of the images and truth data were withheld from the OCR teams. We refer to the withheld subset of the truth data as the “evaluation” records. The evaluation records included data on 15,000 individuals from 5,200 households. The teams were provided with the evaluation images only after they had completed the creation of their OCR algorithm and processing system. The teams were never provided the hand-keyed data associated with the evaluation images; that data was stored on a separate server, and it was used to test their methods after they completed OCR on the evaluation images. While the evaluation records provide the most accurate test of the algorithm, we present results for both training data and the evaluation data for comparison.
We used three metrics to compare the OCR results to the truth data: the Word Error Rate (WER), the Character Error Rate (CER), and the percent of records with a high Jaro-Winkler score. The WER is simply the percent of records where the OCR did not exactly match the truth data. The CER and the Jaro-Winkler score are two different ways to measure the similarity between any two strings. The CER is commonly used to compare large blocks of text in OCR research. The measure is a ratio, where the numerator includes the minimum number of insertions, deletions, and substitutions required to transform one block of text into another (this numerator value is also often described as the Levenshtein distance). The denominator includes the same numbers as the numerator, plus the number of correct characters [17]. Our implementation of the CER included weights to ensure that each name’s CER contributed to the overall error rate in proportion to the length of the name. This approach effectively treated the entire body of names as a single block of text (as the CER is designed to do), where no letter would count more than any other letter. Our use of the CER is designed to be comparable to CER measures in other OCR research (e.g. [17, 18, 19, 20]). The Jaro-Winkler score was developed at the Census Bureau specifically in the context of record linkage research, with characteristics that optimize the metric for comparing names and other short words. Jaro-Winkler scores can range from 0 (no similarity) to 1 (perfect match). The Jaro-Winkler score is commonly used in name linkage outside of the Census Bureau as well (e.g. [21, 22, 23]). We considered a Jaro-Winkler score of 0.85 or better to be “high”, as this is in the range of reasonable thresholds used to identify candidate matches in record linkage applications (e.g. [24]).
As an example of the error rates in more detail, consider a two-letter name and a ten-letter name. If the OCR result was a perfect match with the truth data in both cases, the WER is 0%, the CER is 0%, and the Jaro-Winkler score is 1.00. If the first letter in each OCR name is incorrect, the WER will switch to 100% in both cases, because both whole words are wrong. The CER values will be a function of the length of each name. For the two-letter name with one incorrect letter, the CER would be 50% (one incorrect letter divided by two total letters in the name). For a 10-letter name with one incorrect letter, the CER would be 10% (one incorrect letter divided by ten total letters in the name). Across these two words the overall CER score does not simply average these two CER values to 30% (the average of 10% and 50%). Instead, we weight the ten-letter name more highly by treating both names as one single block of text. In that single block of text, there were 2 incorrect characters and 10 correct characters. This means that the CER numerator is 2 and the CER denominator is 12, yielding an overall CER of 16.7% for the two names combined. This approach to the CER makes it comparable with studies that use the CER measure to estimate error in large blocks of captured text. All evaluation was performed using Stata 16.1 running on Linux, other than the WER calculations, which were done using Python 3.6.7: Anaconda custom (64-bit) running on Linux.
Comparison of OCR and truth data for name and age
Comparison of OCR and truth data for name and age
Notes: Author’s calculations from 1990 NRP data. All results were approved for release by the U.S. Census Bureau, authorization number CBDRB-FY21-ERD002-022.
Table 1 compares the OCR results to the truth data for first name, last name, and age. While two OCR vendors performed this work, we present results only from the USC ISI. The other team’s results did not meet an initial threshold of 50% WER, so we did not consider their results for further analysis. Among the evaluation records, the ISI’s OCR WER, or the percent of the results that did not match the hand-keyed names, is 26.6% for first names and 21.6% for last names. As expected, the WERs were lower on the training records used to develop the OCR system – the training records had about 20% WER for first name and last name. We also identified the proportion of records where the Jaro-Winkler comparison between the OCR data and the truth data ranged from 0.85–1.0, which we consider to be a high score. For the evaluation records, 85.8% of first names and 89.7% of last names met this standard. For the age data, the WER was in the 5.8%–6.8% range for both the training and evaluation records. The CER followed similar patterns, with rates of 12.0% for first names and 9.5% for last names for evaluation records, which is significantly better than the 20% rate often found in similar applications [25]. The capture of names with these error rates, especially with the use the Jaro-Winkler string comparator, suggest that automated OCR, without clerical review, can capture names effectively.
Next, we compare the OCR results to the truth data for the 11-digit household identification number (ID). The accuracy of the household ID variable is extremely important, because it is needed to attach the recovered names to the existing 1990 Census microdata file. We have separated results between typed IDs (the printed digits beneath person 2’s information) and written IDs (the handwritten and bubbled digits in the lower-righthand part of the form). The vast majority of the 1990 Census household images have either a typed ID or written ID – almost none have both, but all pages have one. As Table 2 shows, the results for written IDs were significantly better than the results for typed IDs. Among the evaluation records, the error rate of the OCR results for written IDs differed from the truth data 3.6% of the time compared with 28.8% of the time for typed IDs. The CER followed similar patterns: it was 0.6% for written IDs and 17.5% for typed IDs. These results suggest the capture of handwriting was much better than the capture of the typed numbers, which was particularly surprising. We expected that the OCR teams would be able to capture the household ID field. The variable appears as either machine-typed numbers or FOSDIC bubbles; OCR systems have a long and successful history of capturing typed text and FOSDIC-style bubbles [17]. We had also assumed that OCR would be able to capture typed numbers with even more accuracy than FOSDIC bubbles, not less. The results show that the household ID variable is the greatest data capture issue resulting from this pilot project.
Comparison of OCR and truth data for household ID
Notes: Author’s calculations from 1990 NRP data. All results were approved for release by the U.S. Census Bureau, authorization number CBDRB-FY21-ERD002-022.
Word error rate of OCR and truth data for name and age, by scanner
Notes: Author’s calculations from 1990 NRP data. All results were approved for release by the U.S. Census Bureau, authorization number CBDRB-FY21-ERD002-022.
We also compared the performance of the two types of microfilm scanners, in case one scanner produced images more suited to OCR. Both scanners processed a single 100-foot roll of film in about 15 minutes. To the naked eye, the image quality was indistinguishable between scanners. Tables 3 and 4 compare how the OCR performed on images from each scanner. These tables show the same WER measure as Tables 1 and 2 – the percentage of time that the OCR did not exactly match the hand-keyed data – by scanner. As can be seen in Table 3, OCR on scanner 1 images had a lower error rate for all variables, on both training records and evaluation records. Table 4 shows the data for household ID. For written IDs, OCR on images from scanner 1 and scanner 2 performed similarly. But for typed IDs, the OCR on scanner 2 images had a lower percentage of non-matches.
Word error rate of OCR and truth for household ID, by scanner
Notes: Author’s calculations from 1990 NRP data. All results were approved for release by the U.S. Census Bureau, authorization number CBDRB-FY21-ERD002-022.
Comparison of OCR and truth data, where data keyers disagreed
Notes: Author’s calculations from 1990 NRP data. All results were approved for release by the U.S. Census Bureau, authorization number CBDRB-FY21-ERD002-022.
Our final analysis focuses on values that were difficult for the data entry team to read. Census Bureau staff double-keyed about one third of the truth records. Each of the double-keyed records was entered by two different people, and we identified the subset of those records where the two entries did not match. The keyers did not attempt to adjudicate these differences – in many cases it was simply not possible to infer the “truth”, because the handwriting was illegible or ambiguous. Instead, we flagged all conflicting records as “hard-to-read.” Of all records, 2.1% of first names, 2.8% of last names, and 0.2% of age entries were flagged as hard-to-read. Table 5 presents data for only hard-to-read records, meaning the subset of double-keyed records where the two entries did not match. As Table 5 shows, the OCR was significantly worse for hard-to-read records, for both training data and evaluation data. This shows that there is a group of records that are hard to capture by any means – whether by OCR or manual entry – and that neither method could be expected to perform perfectly. In some cases, it will never be possible to know the “truth”, regardless of data extraction method, but the hard-to-read records are a small subset of the overall data captured.
The 1990 Census NRP sought to identify the most accurate and cost-effective means to recover names from the 1990 Census to prepare the data for record linkage. Through a range of small tests, we identified a path to recover names with an accuracy rate of around 75%–80%, or closer to 85%–90% when using a string comparator. These capture rates and string comparator scores are sufficient to assign accurate linkage keys for the vast majority of records in the 1990 Census. This accuracy rate was achieved without incorporating the manual quality control that is typical in OCR operations, such as conducting key-from-image for low-confidence OCR assignments. Given the scale of the larger goal of capturing names from the 1960–1990 Censuses, it is not likely that funds will be available to pay for additional manual work.
The NRP work revealed many areas where steps can be taken to improve the data capture outcomes. For example, the OCR team’s use of various name dictionaries revealed that the results can be sensitive to the size of the dictionary, as well as the indicator of how common each name is. The OCR process needs to use the largest possible set of names without over-assigning the rarest names, and it needs to be able to do this very quickly. A more granular name list could be used to leverage what was learned through the pilot – this could include lists for each census year, each state, or even respondents’ individual characteristics, such as age or place of birth. We expect that more targeted dictionaries will improve the accuracy and speed of name capture.
There are also several areas where automated post-processing edits are likely to produce data quality improvements. For instance, the analysis presented in this paper does not make use of the OCR output’s “confidence score” for each name assignment. The OCR confidence scores are a value ranging from 0 (no confidence) to 1 (complete confidence). Preliminary analyses of the confidence values suggest that the confidence scores provide a useful filter for low-quality OCR assignments while discarding relatively few high-quality assignments. It may be possible to incorporate OCR confidence scores into the quality values given when assigning unique linkage keys to the records.
Similarly, it may be possible to use family relationships to improve OCR assignments. The images contain information at the household-level, and the microdata files from each census captured the relationships between household members. There are many instances where the OCR output assigned slightly different last names to relatives in a household. In most cases, it is clear that these family members in fact share the same last name, though it is not clear which variation of the last name they share. While there would be a risk in forcing the OCR software to “lock in” on a single name for related individuals with similar names (or even to assume that the similar names are the same name), we can assign alternative last names to the entire family in post-processing, and then use both of those names as candidates in record linkage.
The NRP’s most puzzling outcome was the inability to consistently capture the household ID field, particularly for the machine printed IDs that are present beneath the person 2 column. OCR processes generally perform very well on printed numbers and FOSDIC bubbles, so using different OCR methods for handwriting and print will be needed. Moreover, the OCR team was not provided with a dictionary of these ID numbers. Given that the ID is an 11-digit variable, the universe of options was much larger than that for names, and without the “frequency” indicator that was available in the name dictionary. Finally, following the pilot project, we identified an operational file that contains a list of the ID numbers on each reel, in the same order as the1,800 census images that each reel contains. In addition, machine readable marks on the images were found to correspond to the typed household IDs, so household IDs should be digitized with near perfection.
The ultimate test of the NRP pilot results is whether the output can support the accurate assignment of linkage keys necessary to incorporate these data into the Census Bureau’s Data Linkage Infrastructure. The Census Bureau’s assignment of linkage keys relies heavily on geography, which typically involves a street-address match between each census record and the corresponding administrative records from the same year and uses additional variables along with names. An earlier attempt to link the 1990 Census without names at all reported to have linked 44% of adults to an administrative records composite, mainly through the power of the address-based linkage combined with existing data on census respondents’ age, gender, and birthplace [7]. The OCR-derived names will improve the coverage and accuracy of this outcome.
The results of the NRP pilot project suggest that the handwriting recognition quality will be sufficient for record linkage of the 1990 Census. Since completing the NRP, we have continued to refine and extend the methods developed to capture names from the 1990 Census. The Census Bureau is currently leveraging this work to undertake a full-production recovery of all respondent names from the 1960–1990 Censuses, with the goal of integrating these data into the Census Bureau’s Linked Data Infrastructure [5]. The resulting linked data will allow for transformational longitudinal research on individuals, families, and households in the United States from 1940 to the present.
Footnotes
Acknowledgments
Any views expressed are those of the authors and not necessarily those of the U.S. Census Bureau. Results were approved for release by the Census Bureau’s Disclosure Review Board, authorization number CBDRB-FY21-ERD002-022.