
Abstract
Background:
Huntington’s disease (HD) is a fatal progressive neurodegenerative disease characterized by chorea, cognitive impairment and psychiatric symptoms. Retinal examination of HD patients as well as in HD animal models have shown evidence of retinal dysfunction. However, a detailed retinal study employing clinically available measurement tools has not been reported to date in HD.
Objective:
The goal of this study was to assess retinal responses measured by electroretinogram (ERG) between HD patients and controls and evaluate any correlation between ERG measurements and stage of disease.
Methods:
Eighteen patients and 10 controls with inclusion criteria of ages 18–70 years (average age HD subjects: 52.1 yrs and control subjects: 51.9 yrs) were recruited for the study. Subjects with previous history of retinal or ophthalmologic disease were excluded. Retinal function was examined by full-field ERG in both eyes of each subject. Amplitudes and latencies to increasing flash intensities in both light- and dark-adaptation were measured in all subjects. Statistical analyses employed generalized estimating equations, which account for repeated measures per subject.
Results:
We analyzed the b-wave amplitudes of ERG response in all flash intensities and with 30 Hz flicker stimulation. We found statistically significant increased amplitudes in HD patients compared to controls at light-adapted (photopic) 24.2 and 60.9 cd.sec/m2 intensities, dark-adapted (scotopic, red flash) 0.22 cd.sec/m2 intensity, and a trend toward significance at light-adapted 30 Hz flicker. Furthermore, we found a significant increase in light-adapted ERG response from female compared to male HD patients, but no significant difference between gender amongst controls. We also noted a positive association between number of CAG repeats and ERG response at the smallest light adapted intensity (3.1 cd.sec/m2).
Conclusions:
ERG studies revealed significantly altered retinal responses at multiple flash intensities in subjects with an HD expansion allele compared to controls. Significant differences were observed with either light-adapted tests or the dark-adapted red flash which suggests that the enhanced responses in HD patients is specific to the cone photoreceptor pathway.
INTRODUCTION
Huntington’s disease (HD) is an autosomal dominant neurodegenerative disorder characterized by chorea, cognitive impairment and psychiatric symptoms. The mean age of onset is 35–55 years of age with a median survival time of 15–18 years after onset of motor symptoms [1]. The disease is caused by a CAG trinucleotide expansion in the HTT gene (also known as IT-15). The mechanism of pathogenesis has remained elusive, and thus there is currently no disease modifying treatment or cure for HD.
Prior to availability of genetic testing in the early 1990 s, patients came to clinical attention only after presentation of movement disorders or psychiatric symptoms. However, with the development of more sensitive objective measures and increased awareness of the full physiologic characteristics of HD, we have improved the capacity for earlier detection of clinical signs. For instance, functional MRI (fMRI) studies of presymptomatic HD patients have shown abnormalities in brain activation patterns and striatal function prior to development of motor symptoms [2]. Neuropathologic studies of various forms of neurodegeneration suggest that there is evidence of neuronal dysfunction prior to actual cell death [3–5]. This period between cell dysfunction and cell death may be a potentially critical reversible point to target therapeutics. Therefore, additional clinical measures to identify disease onset and measure progression will be invaluable for implementing early interventions.
Enormous effort is being focused on identifying biomarkers as early disease markers in patients with neurodegenerative disease such as Alzheimer disease, Parkinson disease, multiple sclerosis, and amyotrophic lateral sclerosis. Biomarkers are a substitute measurement for the presence or progression of (or towards) disease. The goal is to find a biomarker that is reliable, specific, and minimally invasive to the patient. A surrogate measure of disease can then be used not only to mark disease onset, but also to follow the clinical course of patients as they are treated with agents that slow progression of neurodegeneration. One complication in determining disease onset in HD patients stems from the variability in expressivity of disease. Some individuals may present with psychiatric or cognitive features prior to motor symptoms and vice versa. Thus efforts to identify additional signs may allow for complementary data contributing to determination of a patient’s disease severity or stage.
In addition to imaging studies such as fMRI, single photon emission computerized tomography and nuclear magnetic resonance spectroscopy [6–8], single molecule profiling of neurofilament light protein and serum gene expression microarray profiling have demonstrated differences between early HD patients to controls [9, 10]. Mouse model studies also indicate that HTT-induced gene expression changes can happen well before symptoms manifest [11]. The search for biomarkers at the earliest stages of HD that can be used subsequently to track progression holds great potential as it may also suggest biologically relevant genes involved in HD pathogenesis that could be targeted for intervention. However, more significant differences are seen in patients with symptomatic rather than pre-symptomatic HD, thus limiting factors in these types of imaging studies may be sensitive to CNS pathology at early stages of disease. Additionally, differentially expressed genes are still being characterized and can vary quite widely from study to study. Whether therapeutics would alter expression of those genes independent of the HD disease state still needs to be established, as changes in disease-relevant genes outside of the timeline of HD progression have not been characterized.
The electroretinogram (ERG) is a noninvasive method to assess cellular dysfunction in retina cell types, including photoreceptors, bipolar cells, and ganglion cells. ERG traces (Fig. 1) represent a mass electrical potential of the summed response of groups of cells in the retina to a change in illumination. The cellular response recorded can be specific to rod photoreceptors under dark-adapted conditions or cone photoreceptors under light-adapted conditions. Recordings are made under physiological conditions by placing electrodes on the corneal surface. The waves of the ERG trace (Fig. 1) reflect the activity of potentials that differentiate stages of retinal processing, with photoreceptors and bipolar cells making the largest contribution to the major waves of the ERG. There are three major waves that comprise the ERG trace: a-wave, b-wave and c-wave. The b-wave is most commonly assessed in the ERG, and represents a depolarization of bipolar-cells which subsequently generates a transretinal current. The b-wave amplitude is measured from the trough of the a-wave to the peak of the b-wave. ERG is used routinely by ophthalmologists to evaluate patients for retinal degeneration and therefore could be easily incorporated into routine clinical or trial HD evaluations yielding an objective, quantifiable measure [12].
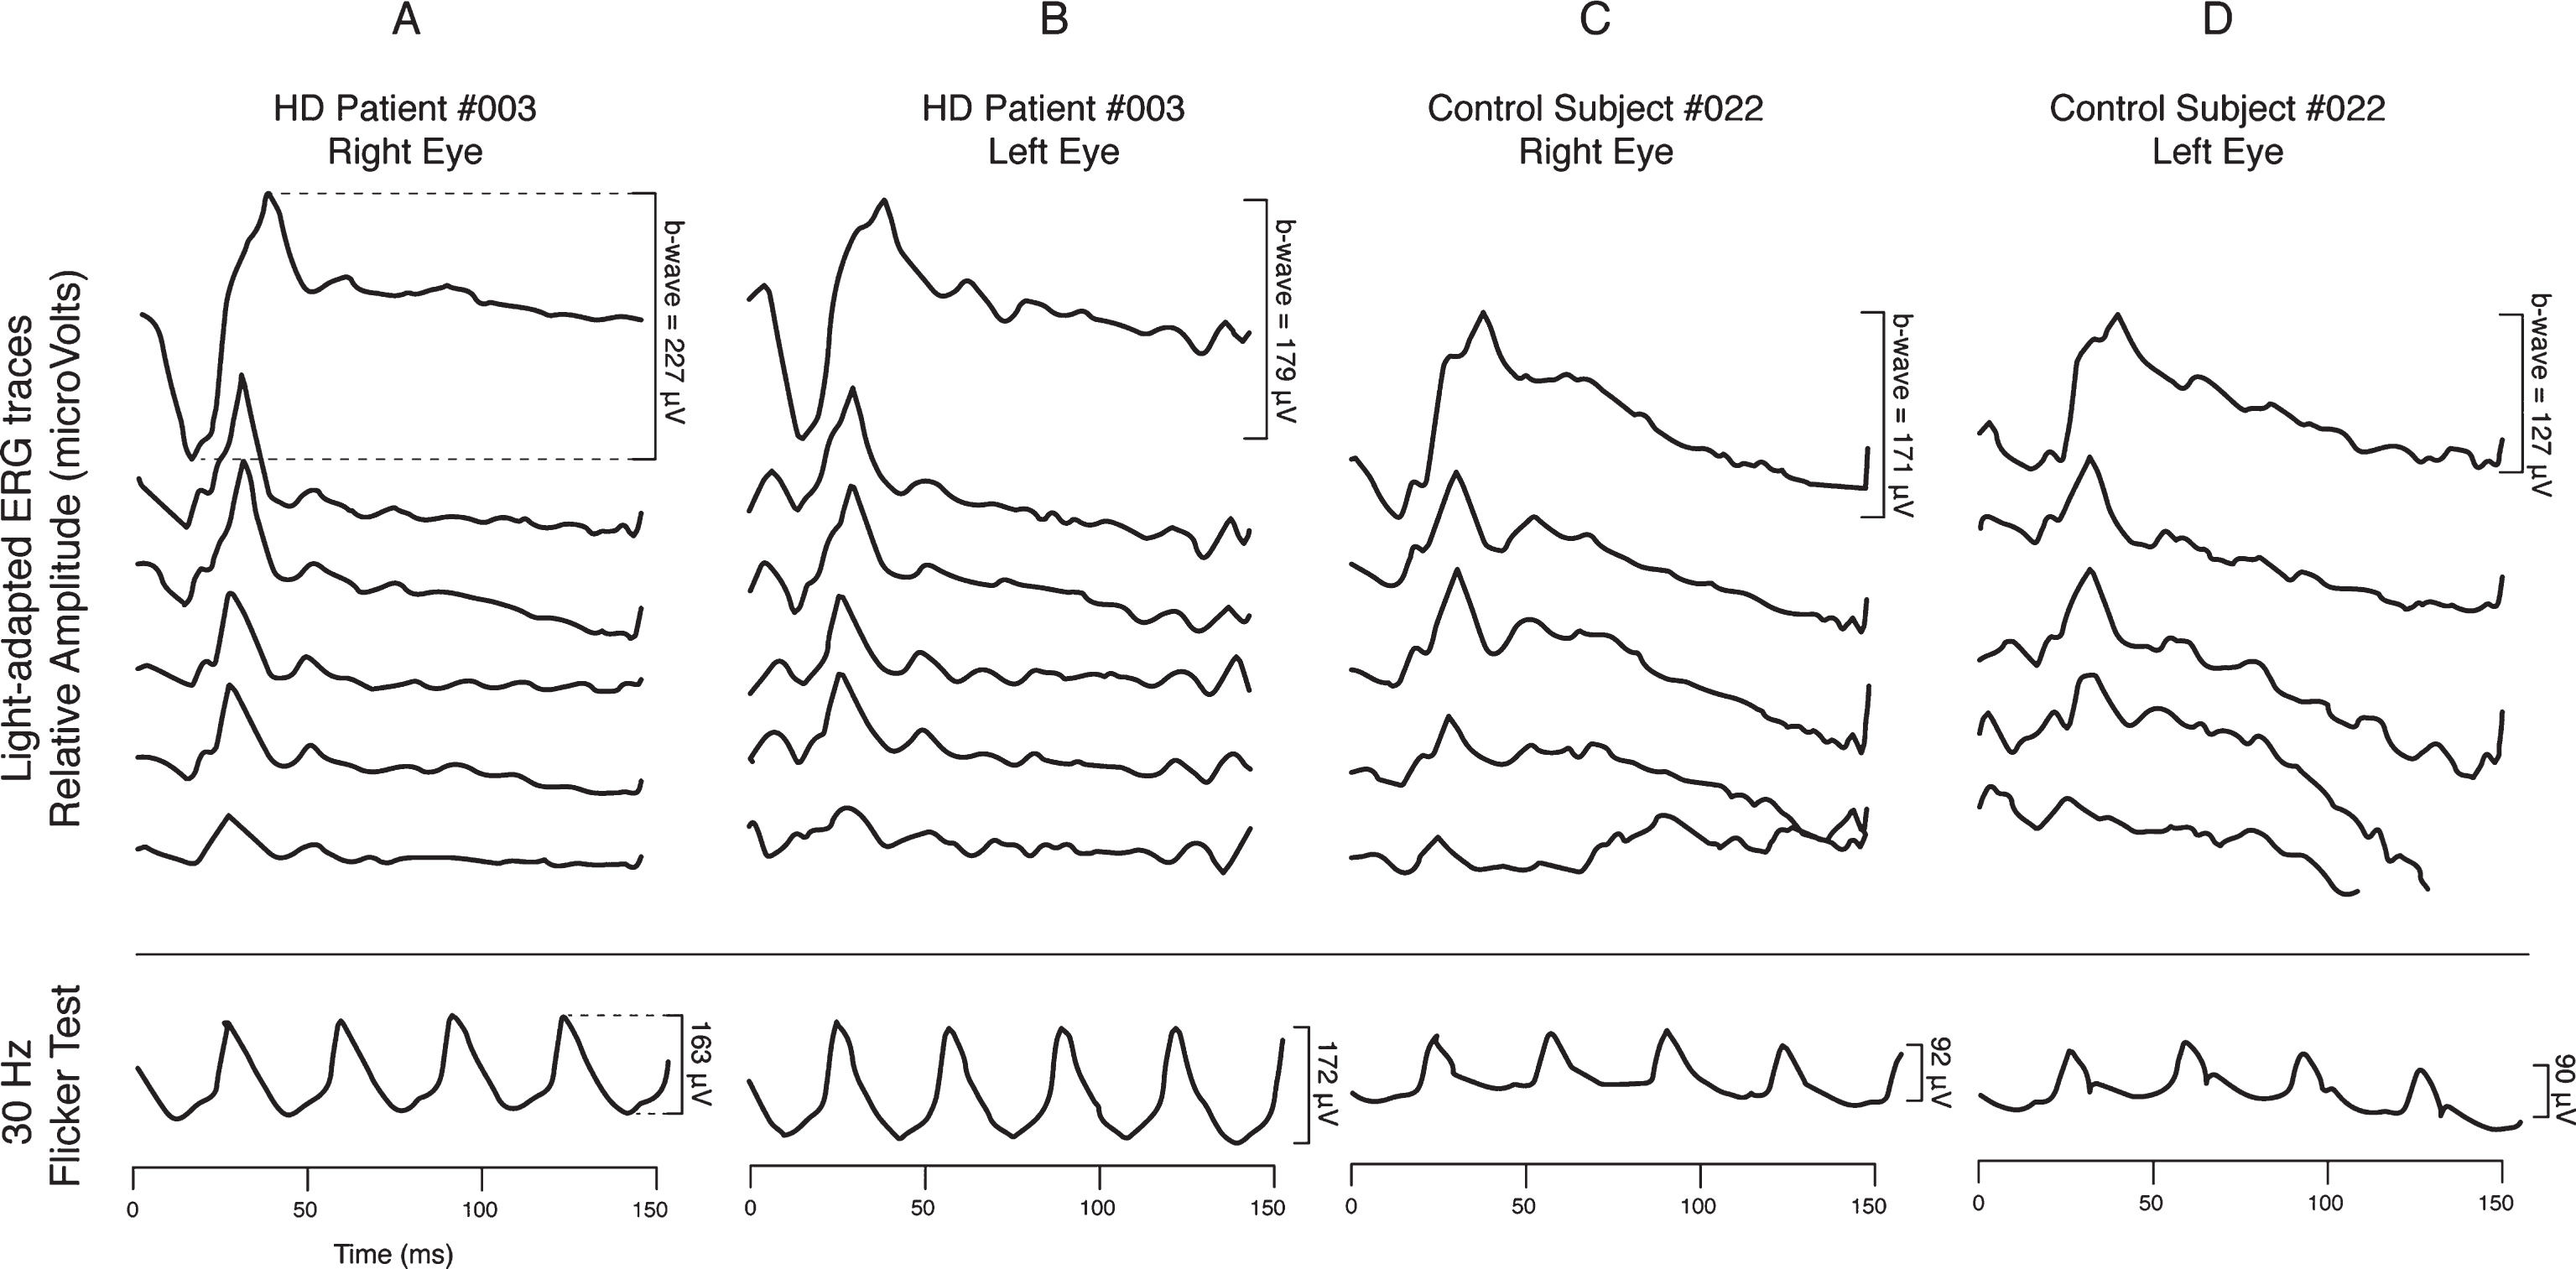
Representative light-adapted ERG traces from both eyes of one HD patient and one control subject. Traces are comprised of positive and negative waves of electrical potentials which represent the summed activity of the various retinal cells and circuits that generate a response to a light stimulus. The largest amplitude difference, or b-wave, is a response of photoreceptor and bipolar cells. Column A and B: HD patient ERGs. Column C and D: Control subject ERGs. B-wave amplitudes (uV) are described for each eye at 60.9 cd.sec/m2 intensity and in the 30 Hz flicker test (24.2 cd.sec/m2 intensity).
While clinically evident sequelae of retinal disturbance are not been commonly described in HD, retinal involvement in patients with HD was reported more than 20 years ago [13]. Retinal disease and associated symptoms are a well-known clinical feature of another polyglutamine neurodegenerative disease, spinocerebellar Ataxia Type 7 (SCA7) manifesting dysfunction in the cone photoreceptors [14–16]. In addition to neurodegenerative disease, studies in patients with psychiatric syndromes including schizophrenia and depression have suggested impaired retinal responses in ERG. This has led to the suggestion that dysfunctional dopaminergic or serotoninergic activity impacts retinal function and thus could be used as a biomarker in those diseases [17].
Two studies in mouse models of HD have suggested evidence for retinal abnormalities in HD. However, both studies relied on the phenotypically severe, transgenic R6/2 mouse model. R6/2 mice were reported to manifest retinal dysfunction and lower b-wave amplitudes as measured by electroretinogram (ERG) and pathology [18, 19]. Despite these results, no studies have explored retinal dysfunction in HD patients using full-field ERG.
Given the known early retinal pathology in human and animal models of other neurodegenerative diseases, we hypothesized that ERG may reveal objective measures of cellular dysfunction in HD patients. To test this hypothesis, we measured retinal responses using ERG in 18 HD patients and 10 controls. We analyzed the b-wave amplitudes of ERG response in multiple light- and dark-adapted flash intensities, and also with 30 Hz flicker stimulation. HD patients demonstrated statistically significant increased b-wave amplitudes in comparison to controls at light adapted intensities of 24.2 and 60.9 cd.sec/m2 and dark adapted red flash intensity of 0.22 cd.sec/m2. We observed a trend toward significance at 30-Hz flicker and no significant difference between HD patients and controls from other dark adapted tests or from light adapted 3.1 or 12.8 cd.sec/m2. These findings indicate consistent differences occurring in saturating cone pathway responses in HD patients, as their b-wave amplitudes continue to increase past controls at increasing flash intensities. In secondary analyses, we observed a significant difference between males and females with HD, such that HD females had higher responses than HD males at all but the lowest light adapted intensities (but not dark adapted intensities); this gender difference was not observed in controls. Our study is the first to demonstrate that HD patients have increased b-wave amplitude responses in ERG measurements compared to controls suggesting HD associated dysfunction in retinal cone photoreceptor pathways. The use of ERG as a clinical marker of disease will require further validation in a larger cohort and would benefit from longitudinal ERG measurements.
METHODS
Study subjects and clinical evaluation
Eighteen HD gene carriers and 10 controls with inclusion criteria of age 18–70 years were recruited from the University of Washington (UW) Neurogenetics clinic and HD Center of Excellence through a UW Human Subjects approved protocol. Subjects with previous history of retinal or ophthalmologic disease were excluded. HD patients underwent Total Motor Score of the Unified Huntington Disease Rating Scale (UHDRS) evaluation by T.D.B or S.J. and neuropsychological battery consisting of Verb Fluency, Symbol Digit and Stroop Interference testing within 9 months of ERG evaluation.
Electroretinogram measurement
Retinal function was examined by full-field ERG. Recordings were made following international standard recommendations (ISCEV) [20]. ERG technicians were blinded to HD carrier status though it was not always possible to maintain blinded evaluations when subjects with symptomatic HD were studied. All participants were able to complete the full ERG evaluation. Pupils were dilated with 1% cyclopentolate and 2.5% phenylephrine. Amplitudes and latencies to increasing flash intensities in both light and dark adaptation were measured in all subjects. Patients were initially dark-adapted for 40 minutes before starting to assess rod pathway responses (scotopic recording). The cornea was anesthetized (Proparcaine) and a JET contact lens electrode (Fabrinal, Switzerland) was placed on the cornea of each eye. Under dark-adapted conditions, flash intensities include a minimum of dim white flash at 0.06 and 0.14 cd.sec/m2, a red flash at 0.22 cd.sec/m2, a blue flash at 1.8 cd.sec/m2, and a maximum intensity bright flash at 3.1, 24.2, and 60.9 cd.sec/m2. Recordings are averaged to at least 5 flashes at each luminance condition. Following dark-adapted recordings the subject is light-adapted (photopic recording) for 10 minutes to assess cone pathway responses. Under light-adapted conditions, flash intensities include a minimum standard bright flash (3.1 cd.sec/m2) and increasing intensities of 12.8, 24.2, and 60.9 cd.sec/m2 (maximum intensity). Additional recordings are performed after a “flicker” of 30 Hz flashes (248 flashes) and averaged. The 30 Hz flicker test is repeated again if no flicker response was seen. The 30 Hz flicker flash measures pure cone responses.
Statistical analyses
In order to examine associations between ERG responses at each intensity and various measures (HD case status, neuropsychological test scores, number of CAG repeats), we employed generalized estimating equations (GEE) with an exchangeable correlation structure, which account for correlations between repeated measures (i.e. two eyes per patient yields two measurements per intensity). Separate models were run for each intensity association. In the case vs. control analyses, we examined an unadjusted model as well as a model which adjusted for age and gender as potential confounders. During this analysis, we noticed that the coefficient for gender was statistically significant in the majority of light adapted models, and so we performed exploratory stratified analyses examining this effect in further detail at all intensities. We performed initial unadjusted comparisons between males and females (separate models for cases and control), and the HD case comparisons were further adjusted for age and UHDRS score, in order to fully examine the range of potential confounding effects, as we hypothesized that disease severity may be a confounding factor. Further exploratory analyses examined implicit time (or latency) among cases and controls at each intensity. For the analyses examining associations between ERG responses and number of CAG repeats, adjusted models included gender and UHDRS score; secondary models included indicators for antidepressant and antipsychotic use as covariates, when available. Statistical analyses and box plot illustrations for these analyses were performed in Stata v14.2. As this study was known to be an underpowered pilot investigation, we did not perform adjustments for multiple tests due to the risk of type II errors (the rejection of true associations); thus, we set the significance level at a cutoff of alpha = 0.05. We acknowledge that we risk presenting results with high type I errors when we minimize type II errors in this manner; however, we view our findings as preliminary, and given the rarity of this type of data, we believe that they can serve an important purpose to inform future larger studies, as well as provide avenues for hypothesis generation. We use the term “statistically significant” throughout to mean unadjusted P < 0.05 for ease of communication, but these should be interpreted throughout as exploratory with larger sample sizes needed in the future.
RESULTS
Clinical subjects
Demographics, CAG repeat, UHDRS score, and neuropsychological test results are shown in Table 1. The age range was 35–69 years in HD subjects and 37–70 years in controls, with mean age among both cohorts were similar (52.1 years HD, 51.9 years control, t-test p-value = 0.818). The same numbers of males and females were included in the two groups. Summaries of the number of CAG repeats and neuropsychological test scores for HD cases are also summarized in Table 1.
Patient characteristics for HD cases and controls
*T-test to compare age between cases and controls.
ERG measurement
Full-field ERGs were measured in all flash intensities and with the 30 Hz flicker stimulation. Dark-adapted (scotopic) and light-adapted (photopic) ERG tests were performed. Representative traces from light-adapted ERG tests are shown in Fig. 1. We found that while HD and control b-wave amplitude responses were similar in light-adapted ERG tests at lower flash intensities (3.1 and 12.8 cd.sec/m2), there was a statistically significant increase in amplitude in the HD retinal responses compared to control retina at higher light-adapted intensities of 24.2 and 60.0 cd.sec/m2 (adjusted p < 0.05 for both measures) (Fig. 2), and a trend toward significance at 30 Hz flicker intensity (adjusted p < 0.05), which also uses a flash intensity of 60.0 cd.sec/m2. Additionally, HD cases had significantly increased responses at the dark-adapted red flash intensity 0.22 cd.sec/m2, adjusted p < 0.05), which induces a mixed rod and cone response. The mean responses at each intensity are listed in Supplementary Table 1. There appeared to be a trend towards higher b-wave amplitude responses in HD patients overall at both dark- and light-adapted intensities, though this was not statistically significant at the sample size herein (data not shown). Additionally, we did not observe differences in implicit time between cases and controls at any intensity (data not shown). Increased b-wave amplitude responses suggest that the HD retina have an increased response to higher intensity stimuli compared to controls.

Mean b-wave amplitude responses (μV) for cases and controls at: A) light-adapted intensities and 30 Hz flicker; and B) dark-adapted intensities (with flash color). *p < 0.05, GEE adjusted for gender and age. Among the color flashes utilized, red flash generates mixed cone and rod photoreceptor responses, whereas the other dark-adapted tests measure only rod responses.
Association of retinal response with HD phenotype
We hypothesized that patients with more severe disease as measured by UHDRS and neuropsychological testing may have more significantly abnormal ERG than patients with less severe disease. Using the GEE model as described, we analyzed for evidence of association between flash intensities and UHDRS, as well as the neuropsychological tests (Verbal Fluency, Symbol Digit, Stroop Interference testing including: Color Naming, Word Reading and Interference). No significant associations were observed between any of the HD phenotypic measurements (motor or neuropsychological) and ERG responses at any intensity (data not shown). As expected, the UHDRS score and each of the neuropsychological tests were highly correlated with one another (all pairwise Pearson’s correlations ranged from 0.6–0.9).
We observed a highly statistically significant association between light adapted intensity response at 3.1 cd.sec/m2 and number of CAG repeats, such that for every additional CAG repeat, the response increased an average of 2 uV (p = 0.010, adjusted p = 0.009; r2 value = 0.25) (Fig. 4, Supplementary Table 3). We did not observe significant associations at any other light or dark adapted intensity. Furthermore, exploratory analyses did not indicate a detectable effect of antipsychotic and antidepressant use on the association between CAG repeats and ERG response.
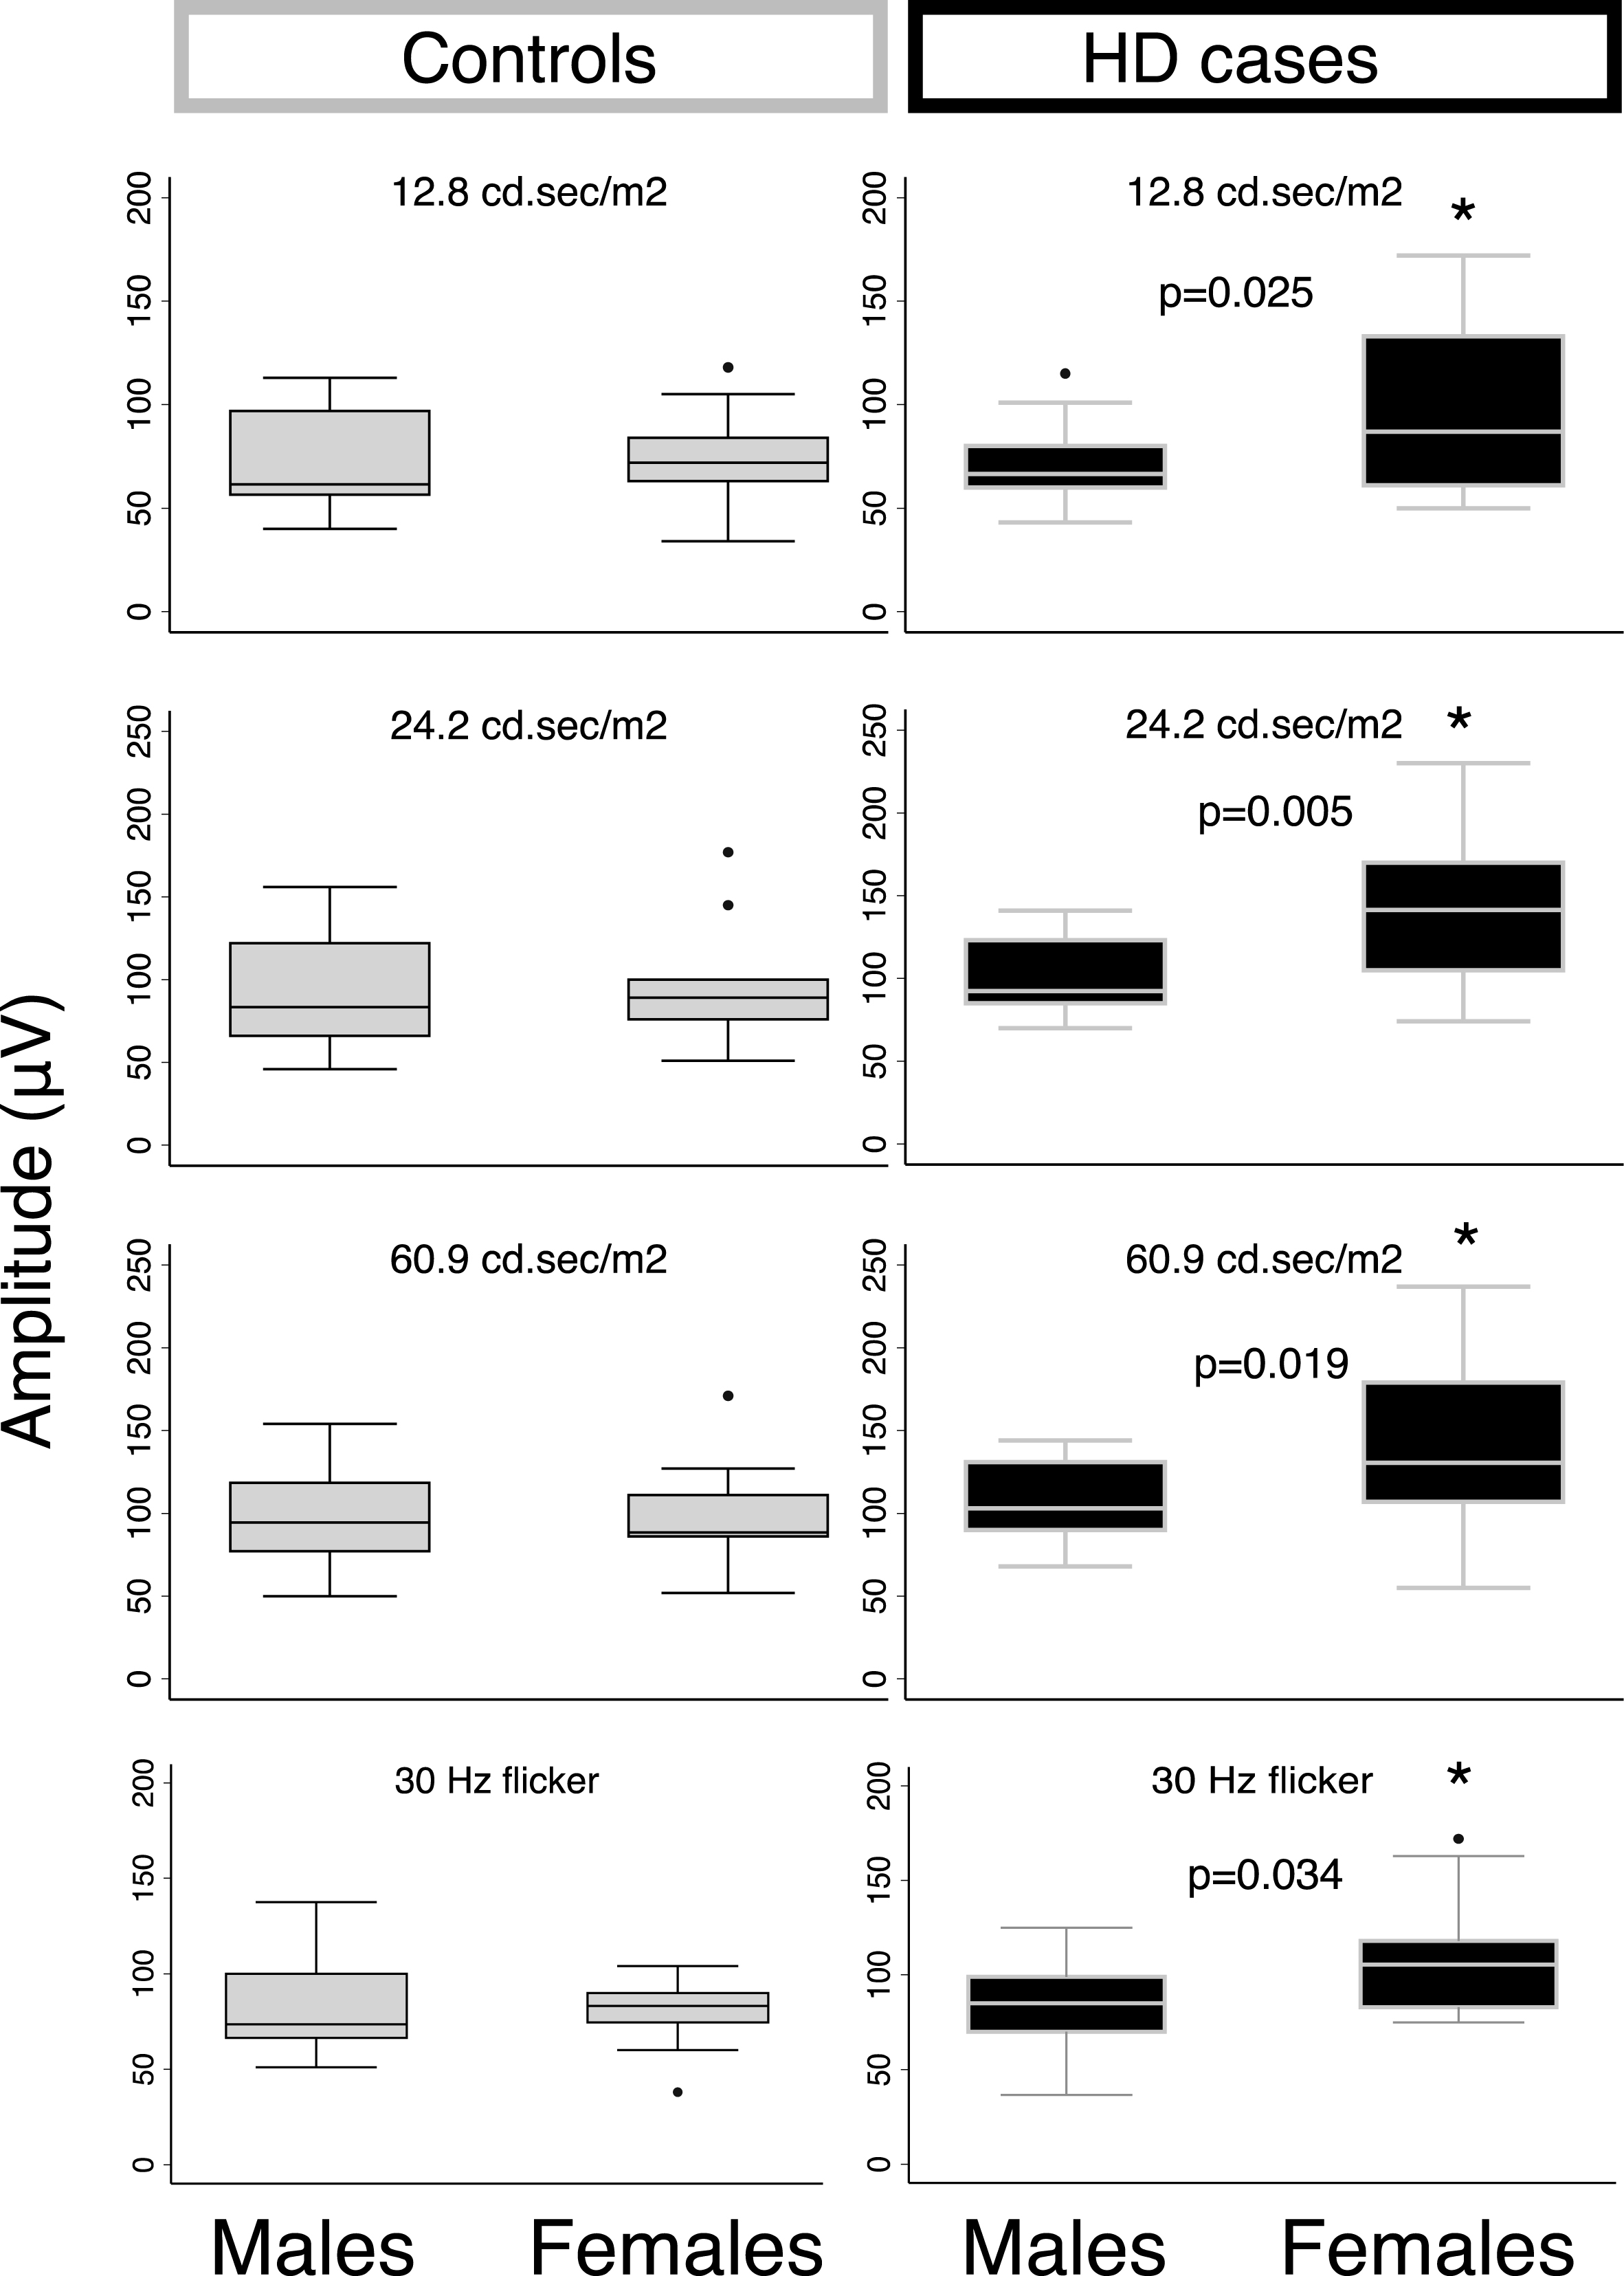
Box plots for differences in light-adapted ERG responses between genders from either control or HD subjects. Significant differences were observed between male and female responses from HD subjects but not controls. Sex differences were significant at each light-adapted intensity (60.9, 24.2, and 12.8) and also at 24.2 intensity with 30 Hz flicker. Sex differences were not significant under dark-adapted tests. (* = p-value<0.05).

Scatter plots examining the relationship between number of CAG repeats and light-adapted ERG responses, with fitted lines and r-squared values for each intensity (in cd.sec/m2).
Impact of gender
In exploratory analyses, we further stratified the analysis examining associations between HD case status and ERG response by gender. We observed statistically significant associations between gender and light-adapted response at the three higher intensities among the HD cases, such that on average, female HD cases had significantly increased ERG responses compared to male HD cases (p < 0.05) (Fig. 3, Supplementary Table 2). A similar, borderline significant effect was also seen for 30-Hz flicker response. For example, at 24.2 cd.sec/m2 intensity, HD females demonstrated, on average, an additional 43 uV increased amplitude of ERG response compared to HD males (p = 0.005). No gender difference was observed among the controls.
DISCUSSION
Our study presents, to our knowledge, the first full-field ERG dataset from a cohort of HD patients and controls. We found that HD patients demonstrated increased b-wave amplitude responses compared to controls in the cone pathway. In comparison, the rod pathway was not specifically affected in HD patients. We also observed an association between the lowest light adapted intensity (3.1 cd.sec/m2) and number of CAG repeats, such that greater numbers of repeats were associated with higher amplitude responses, on average; however, we did not observe this effect at any other light or dark adapted intensity, and the effect was small. Intriguingly, in exploratory analyses, we observed statistically significant associations between gender and several light adapted intensity tests. Taken together, these results indicate possible dysfunction of signal transmission through the retina of HD patients, which may be particularly enhanced in females.
Previous work has shown that the R6/2 mouse model of HD develops cone-rod retinal degeneration which can be measured by ERG. These mice have markedly decreased amplitudes to all flash intensities [21]. Patients with other neurodegenerative diseases including another polyglutamine disease, SCA7, similarly show impaired responses to flash ERG [22]. Few studies have looked at retinal involvement in HD. The first study, performed in 1993, used the foveal blue test light to survey threshold differences in retinal responses from 61 controls, 19 HD patients, 14 Tourette’s patients, and 20 schizophrenia patients. The only significant difference observed was between HD patients and controls, with patient thresholds significantly higher than normal [13]. The behavior test employed to measure threshold is dissimilar from a full-field ERG and thus makes it difficult to draw parallels between the two studies. Kersten et al. recently examined the morphology of optic nerve and macula in HD patients using optical coherence tomography (OCT) and found selective thinning of the peripapillary retinal nerve fiber layer (RNFL) suggesting HD pathology impacts ocular physiology [23]. Using histological methods, a single case study of postmortem HD reported no retinal pathology or histological abnormalities, despite evidence for retinal degradation in a Drosophila HD model and R6/2 HD transgenic mice [24].
In the ERG studies reported here, we observed larger b-wave amplitudes in HD cone pathway responses at saturating flash intensities, as well as in the mixed rod/cone response to the dark-adapted red flash. The retina contains layers of neurons that form either vertically or horizontally organized pathways. The vertical pathway is composed of photoreceptors (first-order neurons) which signal to bipolar cells (second-order neurons) primarily through glutamate. Bipolar cells transmit signals to retinal ganglion cells (third-order neurons) that form the optic nerve axons [21] (Fig. 5). The light-adapted b-wave amplitude primarily reflects both on- and off-bipolar cells to a light stimulus, with smaller contributions from third-order neurons such as amacrine cells [25]. There may be multiple mechanisms for increased b-wave amplitudes in HD patients, including increased phototransduction of photoreceptors, alteration of concentrations of the protein substrates underlying the phototransduction cascade, increased density of membrane proteins mediating the cationic photoreceptor current, and gain in synapse signal in which a change in neurotransmitter activity causes an increased response of bipolar cells [26]. There was no clear evidence that the a-wave showed saturation, which reflects the net closure of photoreceptor sodium channels. Further work to study the kinetics of the ERG would be needed to address this issue.

Schematic drawing of wiring of primary (rod and cone photoreceptors) and secondary (bipolar) cells in the retina and potential mechanisms for increased b-wave amplitudes observed in this study.
HD patients experience progressive dysregulation of circadian rhythms [27, 28]. Ouk et al. proposed retinal degeneration as a contributing factor to circadian dysregulation and was the first study to try to link the involvement of the retina with this disease phenotype [29]. Taken together, these studies and our results described here emphasize the need for further exploration into the role of the retina and pathogenesis of disease. There remains a possibility that hyperexcitability, rather than degeneration, is contributing to circadian abnormalities.
A number of studies have characterized gender differences in HD and in ERG responses, but matching CAG length and disease severity across human subjects can be difficult. In two large cohort studies, female HD patients were found to have more moderate disease progression [30] and higher age of onset [31] compared with HD males, although a longitudinal study of patients with mid-age onset suggested females have faster disease progression rates than men [32]. In Sprague-Daley rats, premenopausal mice had higher scotopic b-wave ERG amplitudes menopausal female mice, which may reflect the biological role of the estrogen system in retinal function [33]. Additionally, estrogen receptors are found in the retina in the ganglion cell layer [34] which contributes to the b-wave response. Female sex hormones have previously been termed “neuroprotective” in an HD study that demonstrated lower estradiol levels in male rats correlated with a lower number of DARPP32+ medium spiny neurons in the striatum [35]. These studies collectively suggest that differences in sex hormones might affect retinal responses. In our study, we identify a significant increase in ERG b-wave amplitudes of female HD patients compared to male HD patients, but we observe no gender differences across the control group. Our study population was small and heterogeneous, and we cannot be certain of the mechanism(s) for the difference we observed, nor can we discount the possibility of unmeasured confounders. Future studies of HD retinal responses could benefit from sampling a larger cohort of both males and females to characterize potentially subtle gender differences in control populations, for which our small sample size may not have been sufficient. In addition, considering disease stage of the cases as well as the various stages in the female estrous cycle could help to uncover important effects of sex hormones on retinal function.
The initial goal of this work was to explore the use of ERG as a potential biomarker. Our study is limited by a small sample size, which prevents us from further generalizing the conclusions. Additionally, given the exploratory nature and small sample size of this pilot study, we did not correct for the issue of multiple testing in order to minimize risk of type II errors (i.e. the rejection of true associations). We recognize that given the large number of possible associations tested (even within each hypothesis-driven question due to the existence of multiple intensities tested per question), we are at high risk for type I error, and results should be interpreted with caution. However, we believe these preliminary findings support the rationale for larger studies to both confirm our initial findings as well as determine whether ERG abnormalities occur independent of canonical HD phenotypes as measured by neuropsychological and motor testing. Another limitation to our clinical study is the lack of detailed structural information as may be provided by OCT. The retina is made up of complex layers of cells. Assessing which cells or subcellular components might be contributing to the phenotypic differences observed in this cohort would add further morphological information. While we did observe an association between number of CAG repeats and ERG response at the lowest light intensity, the effect size was small; additionally, since four of the eighteen patients did not complete assessment at this intensity (which was the highest degree of missingness at any intensity), the extra-small sample size may be responsible for a spurious association. A more representative sample of CAG lengths, with more attention to disease staging, will be necessary to determine true associations between CAG repeats and ERG response. It will also be valuable to measure retinal responses using ERG longitudinally in patients and controls in order to understand any correlation between disease progression and retinal differences, to determine whether hormonal fluctuations through the life span are driving potential differences observed between males and females, and to assess the use of ERG as an early disease biomarker.
In our clinic, patients do not often complain directly of decreased central vision as may be expected with a cone predominant retinal dystrophy. However, HD patients may also have impaired saccades, smooth pursuits and ocular apraxia; thus subtle changes in visual acuity or visual field may be not be obvious to the symptomatic patient. Our findings would suggest that individuals with an HD expanded allele may be at risk for retinal dysfunction and thus concerns about vision may also warrant evaluation by an ophthalmologist with attention to retinal pathology.
In conclusion, retinal changes can be detected in HD patients and ERG measures may be a useful, commonly implemented non-invasive tool to detect disease. Understanding retinal differences in HD patients aids in our understanding of HTT protein function beyond the brain. We present a pilot study to non-invasively measure retina response in HD using full-field ERG. Our results differ from retinal degeneration observed in the R6/2 mouse model of HD, in that we observed significantly increased retina responses in HD patients compared to controls; furthermore, this response may differ in males and females. Our study highlights the need to further understand the molecular mechanisms for retinal dysfunction in HD patients and emphasizes the need for additional retinal and neuropathology studies in patients and disease-relevant mouse models.
CONFLICT OF INTEREST
The authors declare no conflict of interest.
Footnotes
ACKNOWLEDGMENTS
We are grateful to the research subjects for their participation in this study. We thank Dr. Fred Rieke for his helpful comments and discussion. This work was supported by a contract from the CHDI Foundation and by the University of Washington Huntington Disease Center for Excellence. JRP is supported by a National Science Foundation Graduate Research Fellowship.