
Abstract
Background:
Huntington’s disease is a late onset neurological disorder caused by a trinucleotide CAG repeat expansion mutation in the HTT gene encoding for the protein huntingtin. Despite considerable ongoing research, the wild-type function of huntingtin is not yet fully understood.
Objective:
To improve knowledge of HTT gene regulation at the transcriptional level and inform future studies aimed at uncovering the HTT gene’s normal function.
Methods:
The HTT gene region was functionally characterized through an in silico analysis using publicly available data sets. ChIP-seq data sets and the online STRING database were used to identify putative transcription factor binding sites (TFBSs) and protein-protein interactions within the HTT promoter region. siRNA-mediated knockdown and ChIP-qPCR of STAT1, a TF identified from the in silico analysis, were used to validate the bioinformatics screen.
Results:
16 regions containing potential regulatory genomic markers were identified. TFBSs for 59 transcription factors (TFs) were detected in one or more of the 16 candidate regions. Using these TFs, 15 clusters of protein-protein interactions were identified using STRING. siRNA-mediated knockdown of STAT1 resulted in an increase in HTT expression, and ChIP-qPCR detected enrichment of STAT1 binding at one of the predicted regions. These assays confirmed the utility of the bioinformatic analysis.
Conclusions:
Putative regulatory regions outside of the immediate HTT promoter region have been identified with specific protein-protein interactions. Future work will focus on in vitro and in vivo studies to examine the effect of modulating identified TFBSs and altering the levels of specific TFs of interest in regulating HTT gene expression.
INTRODUCTION
Huntington’s disease (HD) is an autosomal dominant neurodegenerative disorder characterized by progressive motor, cognitive, and psychiatric symptoms. HD is caused by a CAG trinucleotide repeat expansion in exon 1 of the HTT gene that encodes for an expanded polyglutamine stretch near the N-terminus of the huntingtin protein. Expanded CAG repeat sizes of greater than 35 are considered pathogenic, with repeat sizes of 36–39 having reduced penetrance or delayed age of onset [1]. There is an inverse relationship between CAG repeat length and age of onset, meaning that individuals with longer CAG expansions demonstrate earlier and more severe symptoms. This inverse correlation between length and age of onset accounts for 60–70% of the variance in age of onset [1] indicating that other putative causative modifiers may be present that affect disease pathogenesis. One of these modifying factors may be the differential expression of the HTT gene itself. A previous study identified a single nucleotide polymorphism (SNP) in a previously unidentified transcription factor binding site (TFBS) for NFκB [2]. This SNP decreases expression of the HTT gene and depending on its presence on the wild-type or mutant allele modified the age of onset of HD patients. This study highlights the importance of understanding the transcriptional regulation of the HTT gene, as this knowledge could assist in more accurate age of onset predictions for patients as well as uncovering therapeutically viable treatment options. Although numerous studies have investigated the function of wild-type and mutant HTT, how the gene itself is regulated has largely been overlooked. Previous work aimed at assessing HTT regulation focused primarily on relatively short regions proximal to the translational start site of the gene and the gene promoter (Supplementary Figure 1). These studies also primarily relied on TFBS sequence similarity alone to identify putative sites, yet this approach lacks the power of biological evidence to support candidate identification until labor-intensive functional analysis can be performed. While these studies resulted in several transcription factors that were reportedly able to modify HTT expression, a greater understanding of the regulation of the entire gene locus is still needed.
Advances in genome-wide screening technologies, including the large-scaled ENCODE project, have vastly altered the understanding of regulatory proteins and their effect on gene transcription. Potential regulatory regions are no longer confined to proximal regions near transcription start sites (TSSs) but have been broadened to include regions within the gene body itself along with adjacent genes. These cis-regulatory regions can be broadly grouped into enhancers, repressors, and insulators, and can be located at great distances from their target gene [3]. To expand our knowledge of HTT gene regulation, we conducted a more expansive search for regulatory regions outside the proximal promoter with an emphasis on understanding how the transcription of the HTT gene is controlled by sequence specific DNA binding transcription factors. We have included the 5’ and 3’ UTR and the entire gene body in our search as well as more distant regions closer to the preceding and following genes. By combining diverse publicly available data sets, including histone modifications, transcription factor binding, DNase accessible open chromatin, and RNA transcripts, we identified 16 putative regulatory regions that may impact HTT transcriptional regulation. Following the identification of these putative regulatory regions we utilized ChIP-seq data sets to identify potential TFBSs within these regions. Using ChIP-seq to identify putative sites further enhances our screen as it provides biological evidence of binding. Since TFs often act synergistically to promote binding and affect gene regulation [4], identified TFs were assembled into networks using the STRING database to prioritize TFs for subsequent in vitro validation of HTT expression modulation. To validate our screening criteria and the putative regulatory regions, we assessed the effect of specific TF knockdown on HTT expression in HEK293 cells. ChIP-qPCR was used to confirm direct TF-DNA interactions. The functional validation of identified TFs in our in vitro screens emphasizes the need to further study putative regulatory regions outside the promoter to better understand HTT gene regulation.
METHODS
Regulatory region heuristic scoring procedure
The scoring procedure included the first intron of the gene immediately preceding HTT, GRK4, to the end of the gene following HTT, MSANTD1. The complete scoring region corresponded to chr4:2,967,424–3,260,411 encompassing a total of 292,988 base pairs. UCSC Genome Browser (https://genome.ucsc.edu/) tracks from May 2012-July 2012 listed in Table 1 were used to score the genome in 1kB increments corresponding to the genomic regions listed above. Each regulatory marker listed in Table 1 was awarded one point and the number of regulatory markers for a specific 1kB region was tallied. Total scores, corresponding to the number of regulatory markers in the 1kB region, were identified along with a list of features within each increment contributing to the overall distribution of scores in the HTT locus (Fig. 1A).
UCSC Genome Browser Tracks Used and Scoring Paradigm
*Marks for activation: H3K4 Methylation, H3K36 Methylation, H3K4 Acetylation, H3K27 Acetylation. **Marks for silencing: H3K9 Methylation, H3K27 Methylation.
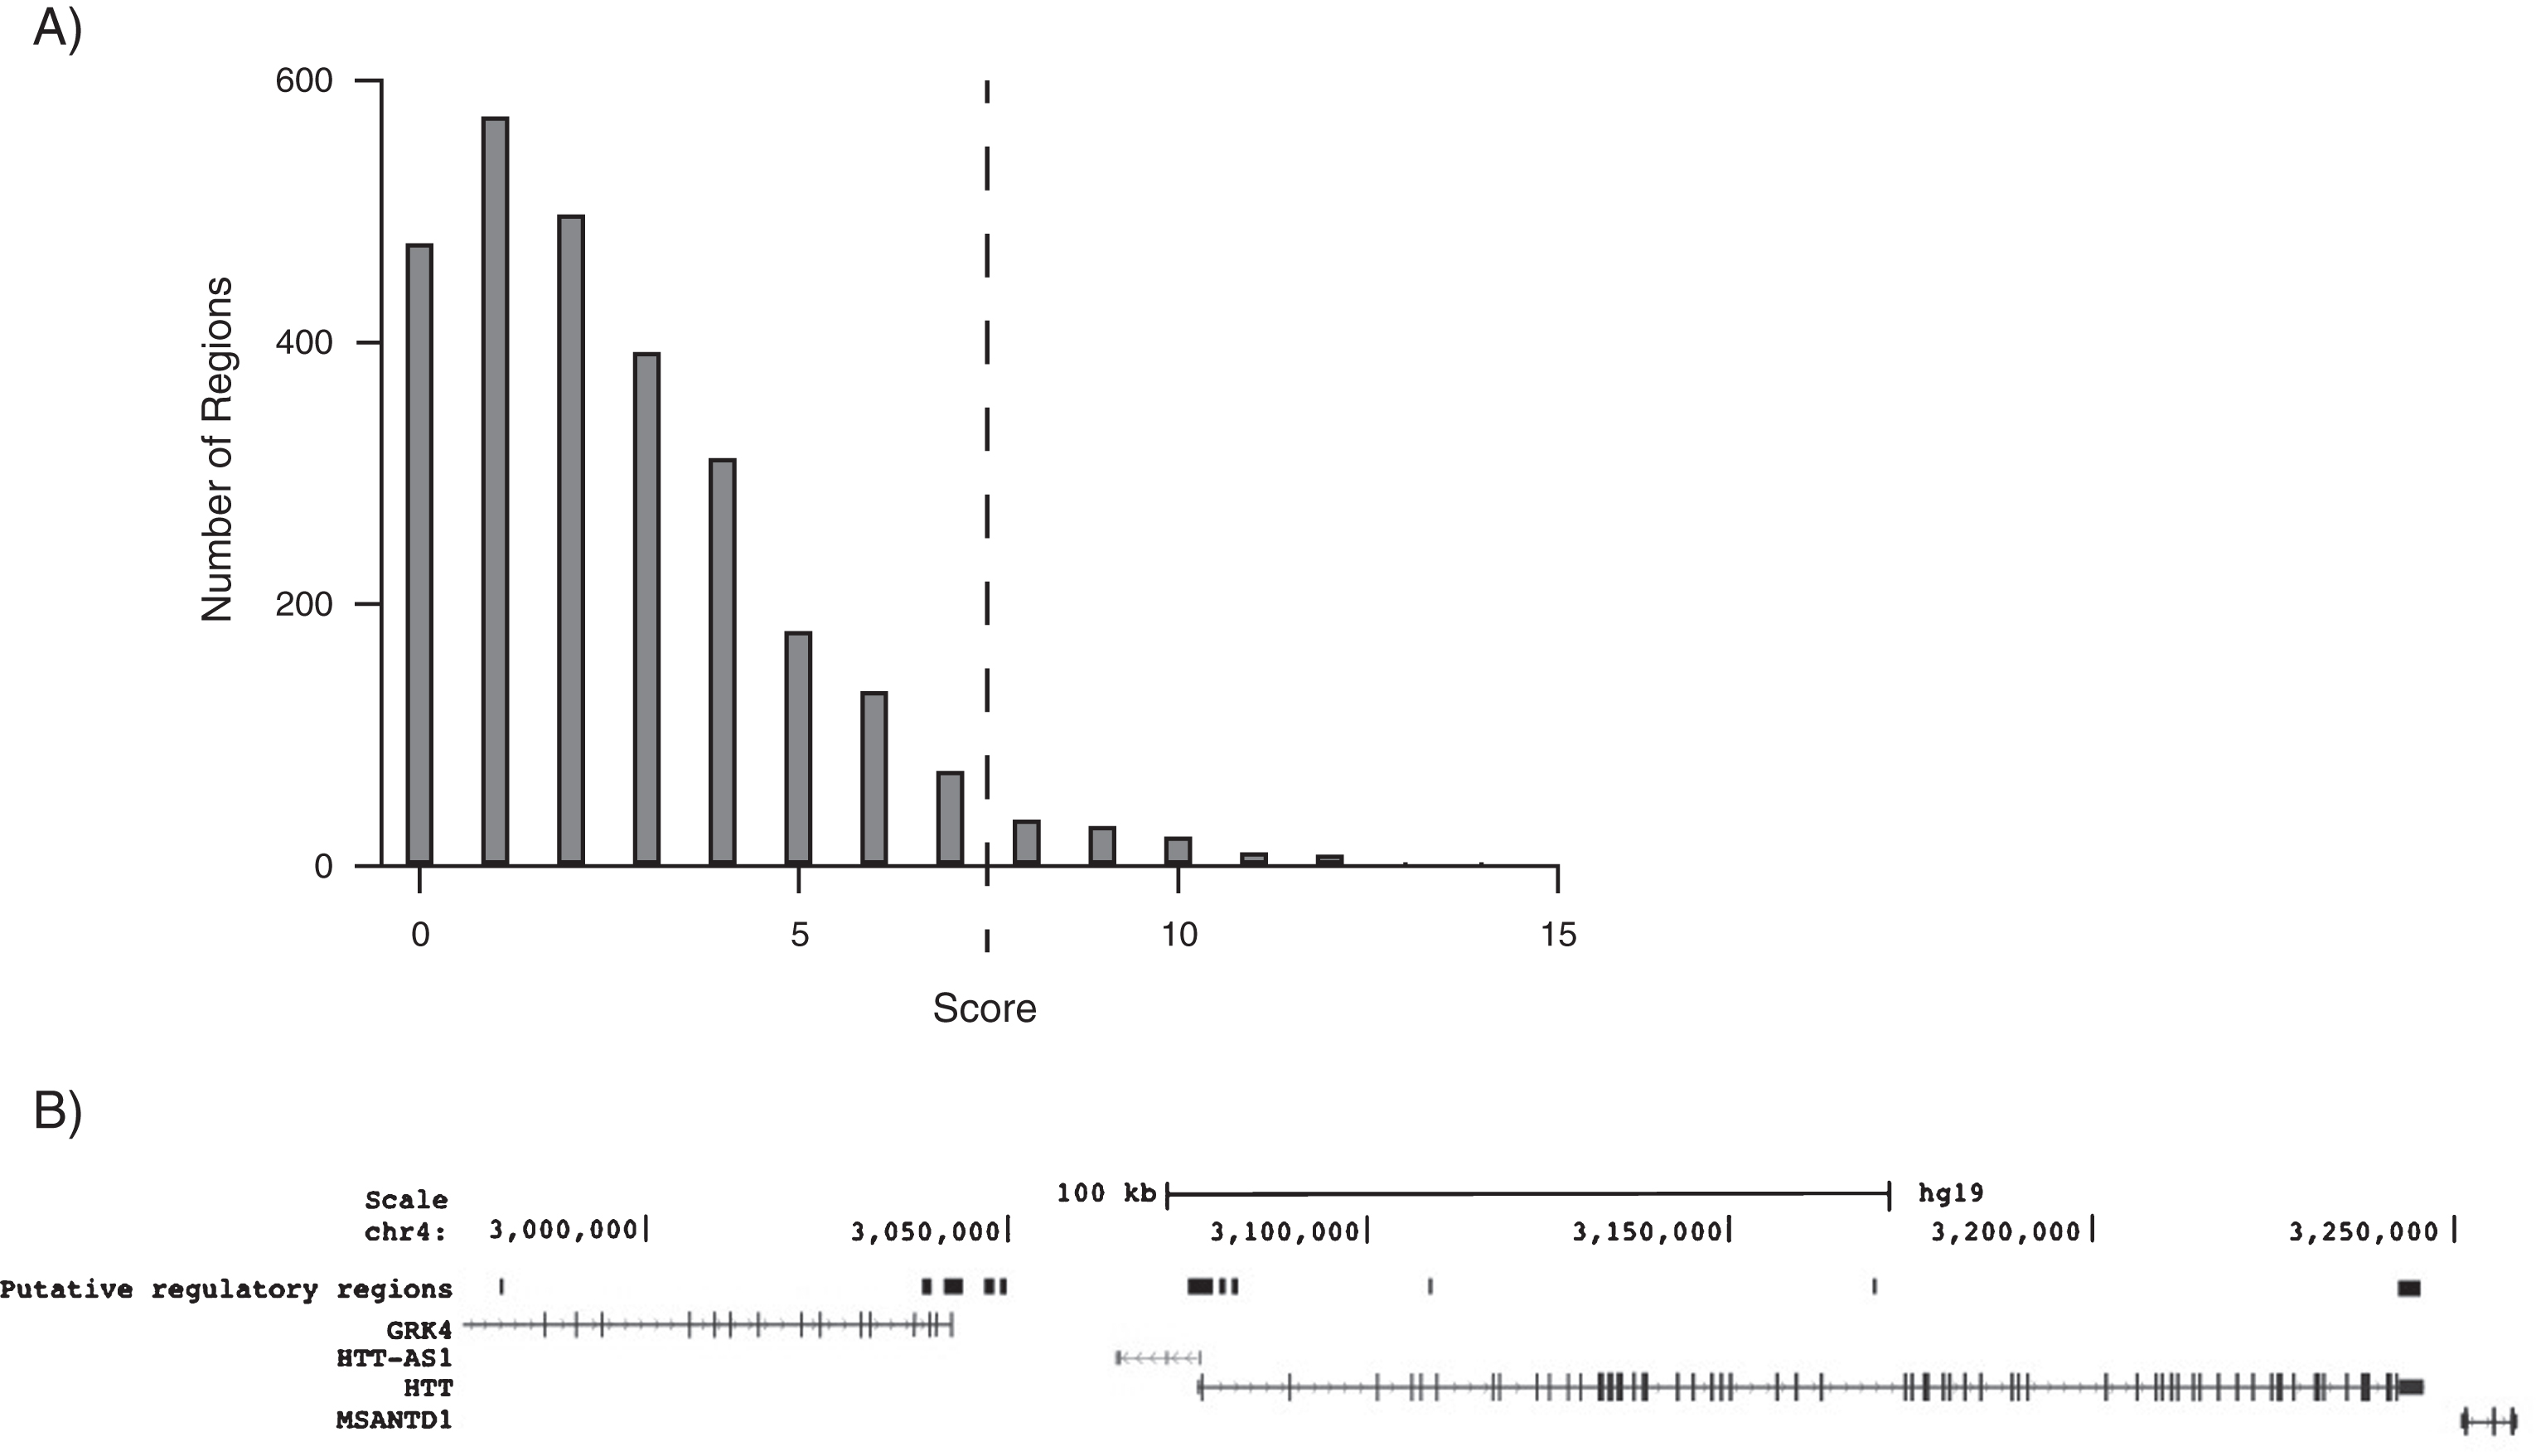
Histogram of scores for each 1kB region assessed and resulting putative regions of transcriptional regulation. A) Using a heuristic scoring method outlined in the methods, 1kB regions of chr4:2,967,424–3,260,411 were assessed. Presented are the scores of all 1kB regions for features associated with transcriptional regulation. A threshold of 7 features was selected to designate regions for subsequent analysis. B) 1kB regions with a score of greater than 7 were combined to generate 11 putative transcriptional regulatory regions. Regions are numbered 1–11 from left to right. Figure adapted from UCSC Genome Browser.
HTT-associated enhancers
CAGE-derived enhancers potentially regulating the transcriptional regulation of the HTT gene have been retrieved from http://enhancer.binf.ku.dk/presets/enhancer_tss_associations.bed where enhancers are linked to genes when the activity of the enhancers and the expression of the associated transcription start sites derived from CAGE are correlated [5]. See Supplementary Material 1.
Brain-related DNase hypersensitivity analysis
ENCODE DNase I hypersensitive peaks have been retrieved at http://hgdownload.cse.ucsc.edu/goldenPath/hg19/encodeDCC/wgEncodeOpenChromDnase/ and http://hgdownload.cse.ucsc.edu/goldenPath/hg19/encodeDCC/wgEncodeUwDnase/. We analyzed two sets of tissues. The first set (S1) is composed of data sets associated to brain-related tissues (Table 3). The second set (S2) is composed of peripheral tissues (Table 3). Brain-specific DNase hypersensitive peaks are defined as peaks from S1 overlapping with the 16 regions of interest and not intersecting with the peaks from S2. The 11 DNase hypersensitive regions obtained are given in Supplementary Material 2 regions_of_interest_overlap_Dnase_brain_specific.bed.
ChIP-seq data sets from PAZAR
DNase data sets from ENCODE
TFBS predictions
We retrieved the set of predicted TFBSs stored in the MANTA database [6]. Precisely, human TF ChIP-seq data sets from ENCODE [7] and PAZAR [8] collected for the 2014 release of the JASPAR database [9] have been retrieved when associated to a TF binding profile stored in JASPAR. The compiled set is composed of 477 TF ChIP-seq data sets associated to 103 TFs. The 11 regions of interest near the HTT gene and the five enhancer regions potentially regulating HTT transcription obtained from [5] have been scanned to predict transcription factor binding sites (TFBSs) using the JASPAR TF binding profiles for the corresponding ChIP’ed TFs [9]. Specifically, we converted the TF binding profiles into position weight matrices (PWMs) following and TFBS predictions were obtained when the relative PWM scores were higher or equal than 85% [10]. Note that both strands are scanned with the PWMs when predicting TFBSs. We predicted 591 TFBSs in the 16 regulatory regions of interest (see Supplementary Material 3 region_of_interest.MANTA_TFBSs.bed).
Protein-protein interaction networks of candidate TFs using STRING
The online STRING database [11] was used to identify clusters of known TF interactions within candidate TFs in the 16 regulatory regions and the HTT promoter specifically. The TF interaction network was used to create the following settings: i) High confidence with a required confidence score of 0.700; ii) Co-occurrence; iii) Co-expression; iv) Experiments; v) Databases. The clustering feature of the online STRING database was used to identify clusters of associating TFs based on defined interaction criteria using the available Markov cluster algorithm.
Cell culture and siRNA-mediated knockdown of STAT1
Human embryonic kidney 293 cells (HEK293) were maintained in DMEM medium supplemented with 10% FBS, 2 mM L-Glut and 2 mM penicillin/streptomycin in a cell culture incubator at 37°C and 5% CO2. siRNA constructs were purchased from OriGene for STAT1, p53, SP1, and NFκB. Three variants (A, B, C) were obtained in addition to a universal scramble control siRNA. HEK293 cells were seeded in six well plates at a density of 593,600 cells per well for siRNA transfection and subsequent quantitative real-time PCR (RT-qPCR). TransIT-TKO® transfection reagent (Mirus) at a concentration of 10μL per well and pooled siRNA constructs at a concentration of 25 nM each (75 nM total) were used for HEK293 transfection. 48 h after treatment, cells were collected for RNA extraction and transcript quantification.
RNA extraction and quantitative Real-Time PCR (RT-qPCR)
Six well plates transfected with siRNA (described above) were processed for RNA extraction using the protocol detailed in the PureLink® RNA Mini Kit (Invitrogen) with the following modifications: 1) Homogenization was achieved using a 21-gauge needle; 2) PureLink® DNase (Invitrogen) was used to degrade residual genomic DNA in the prep column according to the manufacturer’s protocol in order to increase RNA yield and purity. The concentration and purity of RNA was assessed using a Nanodrop spectrophotometer (ThermoFisher Scientific). Reverse transcription was performed using the SuperScript® VILOTM cDNA Synthesis Kit (Invitrogen). Quantitative analysis of mRNA expression was performed using FastSYBR® green master mix according to the manufacturer’s instructions (Applied Biosystems). Amplification of cDNA was performed using the StepOne Plus Real-Time PCR System (Applied Biosystems). All primers used are provided in Table 4. Quantification of mRNA levels was calculated using the standard curve method using 10-fold serial dilutions comprised of a portion of each sample used in the study. Normalization of the quantified mRNA levels was accomplished using a normalization factor generated by the GeNorm program included in the qBase® software package. The normalization factor was generated for each sample using amplification of two or three normalization genes: ActB, PGK1 and HPRT.
Quantitative PCR primer sequences for siRNA-mediated knockdown and ChIP
HEK293 STAT1 over-expression and Western blotting
HEK293 cells were seeded at a density of 593,600 cells per well in six well plates. Cells were transfected 24 h after seeding with STAT1α pRC/CMV (Addgene Cat. #8690) prepared using the PureLink HiPure Plasmid Filter MaxiPrep Kit (Invitrogen). Transfection was performed using 7.5μL TransIT®-LT1 Transfection Reagent (Mirus) per well and 2.5μg of STAT1 pRC/CMV DNA per well. Cells were scraped in 1X RIPA lysis buffer (50 mM Tris pH 7.5, 150 mM NaCl, 1 mM EDTA, 1% Triton X-100, 1% deoxycholic acid, 0.1% SDS) with additional protein inhibitors following 72 h of treatment, frozen on dry ice and immediately thawed for Bradford protein quantification. For each sample, 10μg of protein was mixed with loading buffer and denatured by heating for 10 min at 70°C. Samples were run on a 3–8% gradient SDS gel at 150 V for 60 min at room temperature. Protein was transferred to a PVDF membrane at 25 V overnight at 4°C. The membrane was blocked with 1X TBS-T 5% BSA and incubated overnight at room temperature with anti-STAT1 (Millipore Cat.# 06-501; 1:5000) and anti-β-tubulin (Applied Biological Materials Cat.# G098; 1:5000) antibodies. The membrane was washed with 1X TBS-T for 15 minutes three times, blocked with 1X TBS-T 5% BSA and incubated with goat-anti-rabbit (800) and goat-anti-mouse (680) (LiCor, Lincoln, NE; 1:5000) secondary antibodies at room temperature for 2 h. The membrane was imaged using a LiCor Odyssey scanner (LiCor, Lincoln, NE).
ChIP-qPCR of the HTT region 9 STAT1 binding site
ChIP assays were performed on HEK293 genomic DNA (1E6 cells/reaction) using a specific human polyclonal antibody recognizing STAT1 (Millipore Anti-STAT1, Cat.# 06-501; 4 ng/reaction), including mouse IgG as a nonspecific negative control and human RNA polymerase II as a specific positive control. Six well plates transfected with STAT1α pRC/CMV (described above) were collected by trypsinization for ChIP. Chromatin was prepared using the EpiQuik Chromatin Immunoprecipitation Kit (Epigentek) with the following modification: Chromatin shearing was achieved using a Sonic Dismembrator Model 500 sonicator (Fisher Scientific) at 10% amplitude for three pulses of 10 seconds followed by 30 seconds rest on ice between pulses. The precipitated DNA was quantified using a Nanodrop spectrophotometer (ThermoFisher Scientific). Sample concentrations were normalized to 10 ng/μL and analyzed by quantitative real-time PCR (described above). Primers for STAT1 binding sites at HTT region 9 and GBP1 (previously identified) are provided in Table 4 [12]. ChIP quantitative real-time PCR data were analyzed using the percent input method.
RESULTS
Potential transcriptional regulatory regions identified at the HTT locus
To identify potential regulatory regions outside of the immediate HTT promoter region, 1kB intervals of the first intron of the gene preceding HTT, GRK4, to the end of the following gene, MANSTD1 were surveyed using a heuristic scoring method. Scores ranged from 0 to 15 with most intervals scoring 0–2, corresponding to regions with little or no markers of regulatory elements (Fig. 1A). A threshold score of seven was used to designate regions for subsequent analysis. 1kB sections with scores of seven and above were then organized into larger sections and these regions were given an overall average score based upon the score of the 1kB sections comprising the region. The collection of 1kB sections with sufficient threshold scores identified 11 regions of interest (Fig. 1B) with average scores for each region listed in Table 5. An additional five previously identified enhancer regions were also included, creating a total of 16 candidate regions [5]. The proximal HTT promoter region and TSS were identified as region 6, with the highest average score. Region 11 also resulted in a high score and was identified as the 3’ UTR of the HTT gene. Region 9, corresponding to intron 5 of the HTT, gene also resulted in a high score and was chosen for subsequent in vitro studies. Regions 1–5 corresponded to regions within and shortly after the GRK4 gene. No high scoring regions were identified in the MASTD1 gene.
Putative Regulatory Region Details and Average Scores
Identification of TFBSs within 16 candidate regions
To identify TFBSs within the 16 potential regulatory regions of interest overlapping TFBS predictions within each region were retrieved from the MANTA database [6]. The TFBSs within this data base were obtained using ChIP-seq data sets from ENCODE and PAZAR and TF binding profiles from the JASPAR database. Of the 103 individual TFs associated with the 479 ChIP-seq data sets, 59 TFs were identified with a TFBS in one or more of the potential regulatory regions (Table 6). Similar analysis was conducted in region 6, the HTT promoter, using updated ChIP-seq data sets (Table 2).
Transcription Factors Identified in Putative Regulatory Regions
Protein-protein interactions between candidate TFs in 16 regulatory regions evaluated using STRING
To further prioritize the candidate putative TFs, we sought to identify those with known interactions to help identify clusters of known interacting TFs within the regions of interest. To accomplish this the online protein interacting database, STRING was used (http://string-db.org/). The Markov Clustering tool, available through the STRING database, was used to create a network of the 59 candidate TFs and to identify TFs within the network with high associations. 15 clusters were identified through the analysis with 15 candidate TFs classified with no interactions (Fig. 2). Similar analysis was conducted specifically in the HTT promoter with updated candidate TFs (Fig. 4). Four clusters of TFs were identified. We utilized this information to color code the putative TFBSs within our 16 regions of interest to identify sub-regions with clusters of interacting TFs. The STRING database is used to assess direct physical binding of proteins along with other indirect means of cooperation and regulation [13]. HTT gene regulation may rely on functional associations between candidate TFs and, as a result, the STRING database was used to uncover a network of putative functional connectivity that can be assessed experimentally in the future.
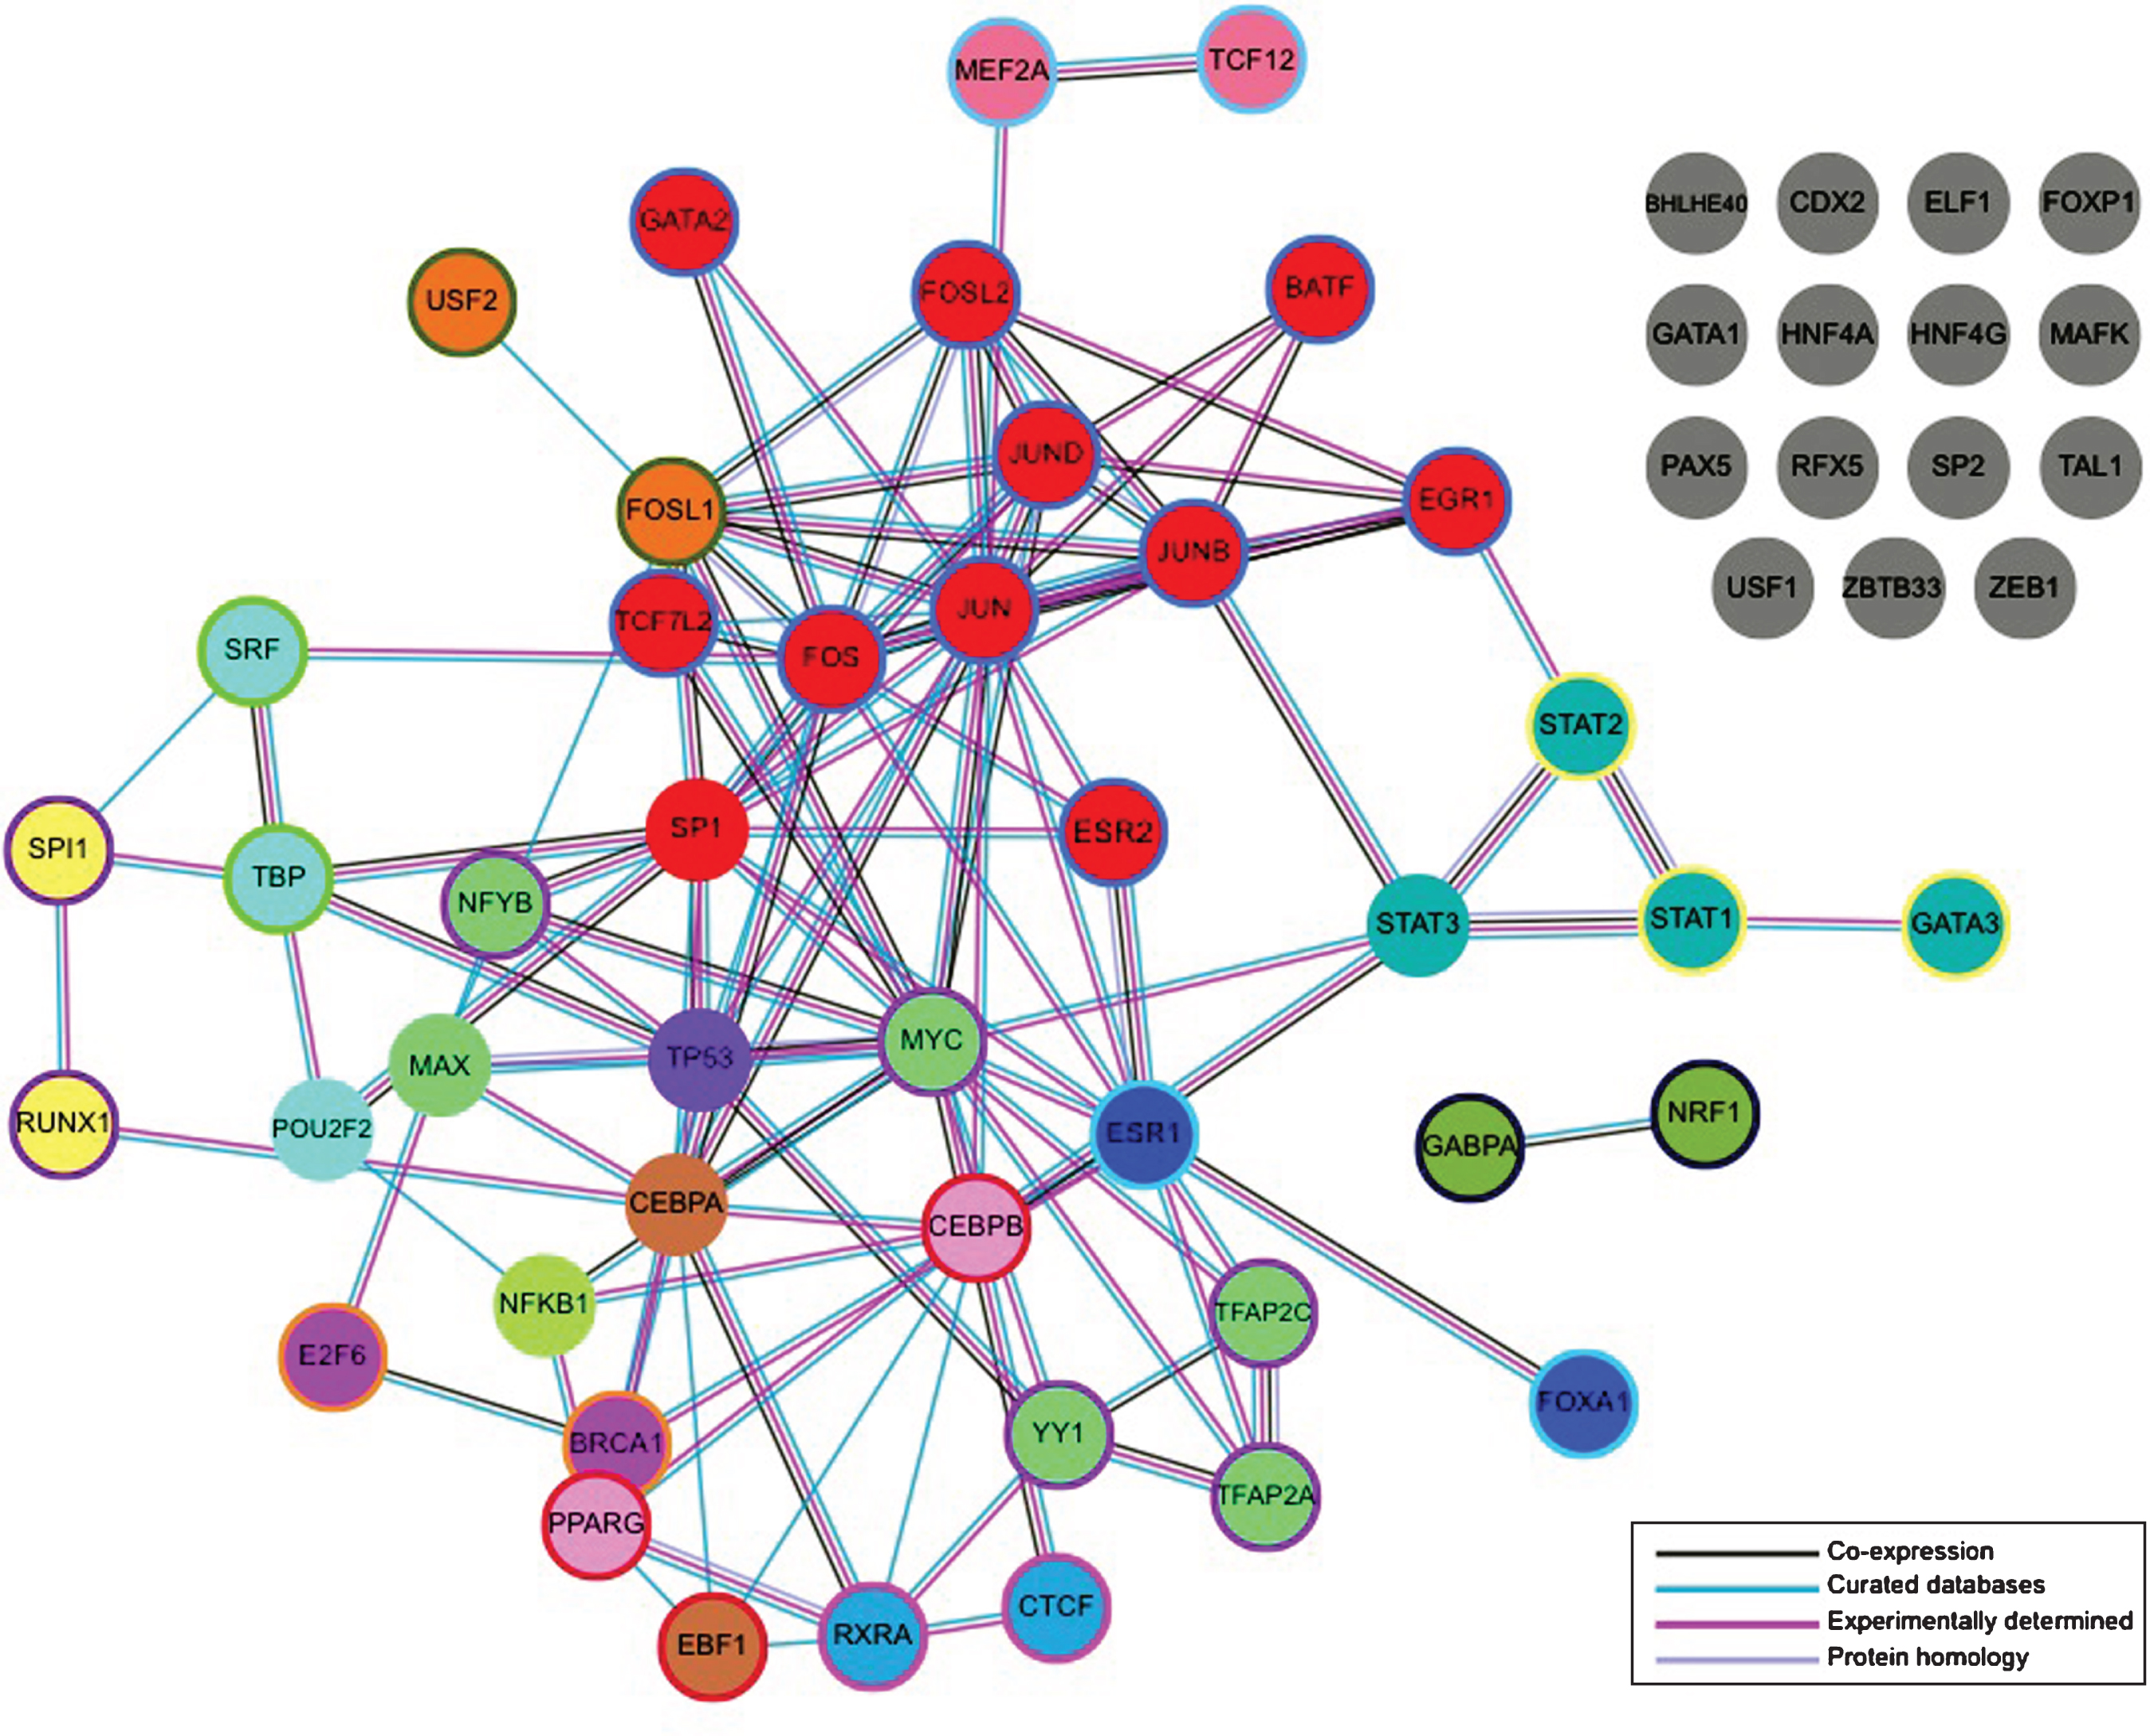
Protein-protein interactions between all candidate TFs. The STRING online database (http://string-db.org/) was used to identify clusters of interacting TFs using Markov cluster analysis. Solid colors represent a Markov cluster threshold of 3. Color outlines represent a Markov cluster threshold of 4, indicating a stronger interaction. 15 clusters of candidate TFs were identified. Figure adapted from (http://string-db.org/).
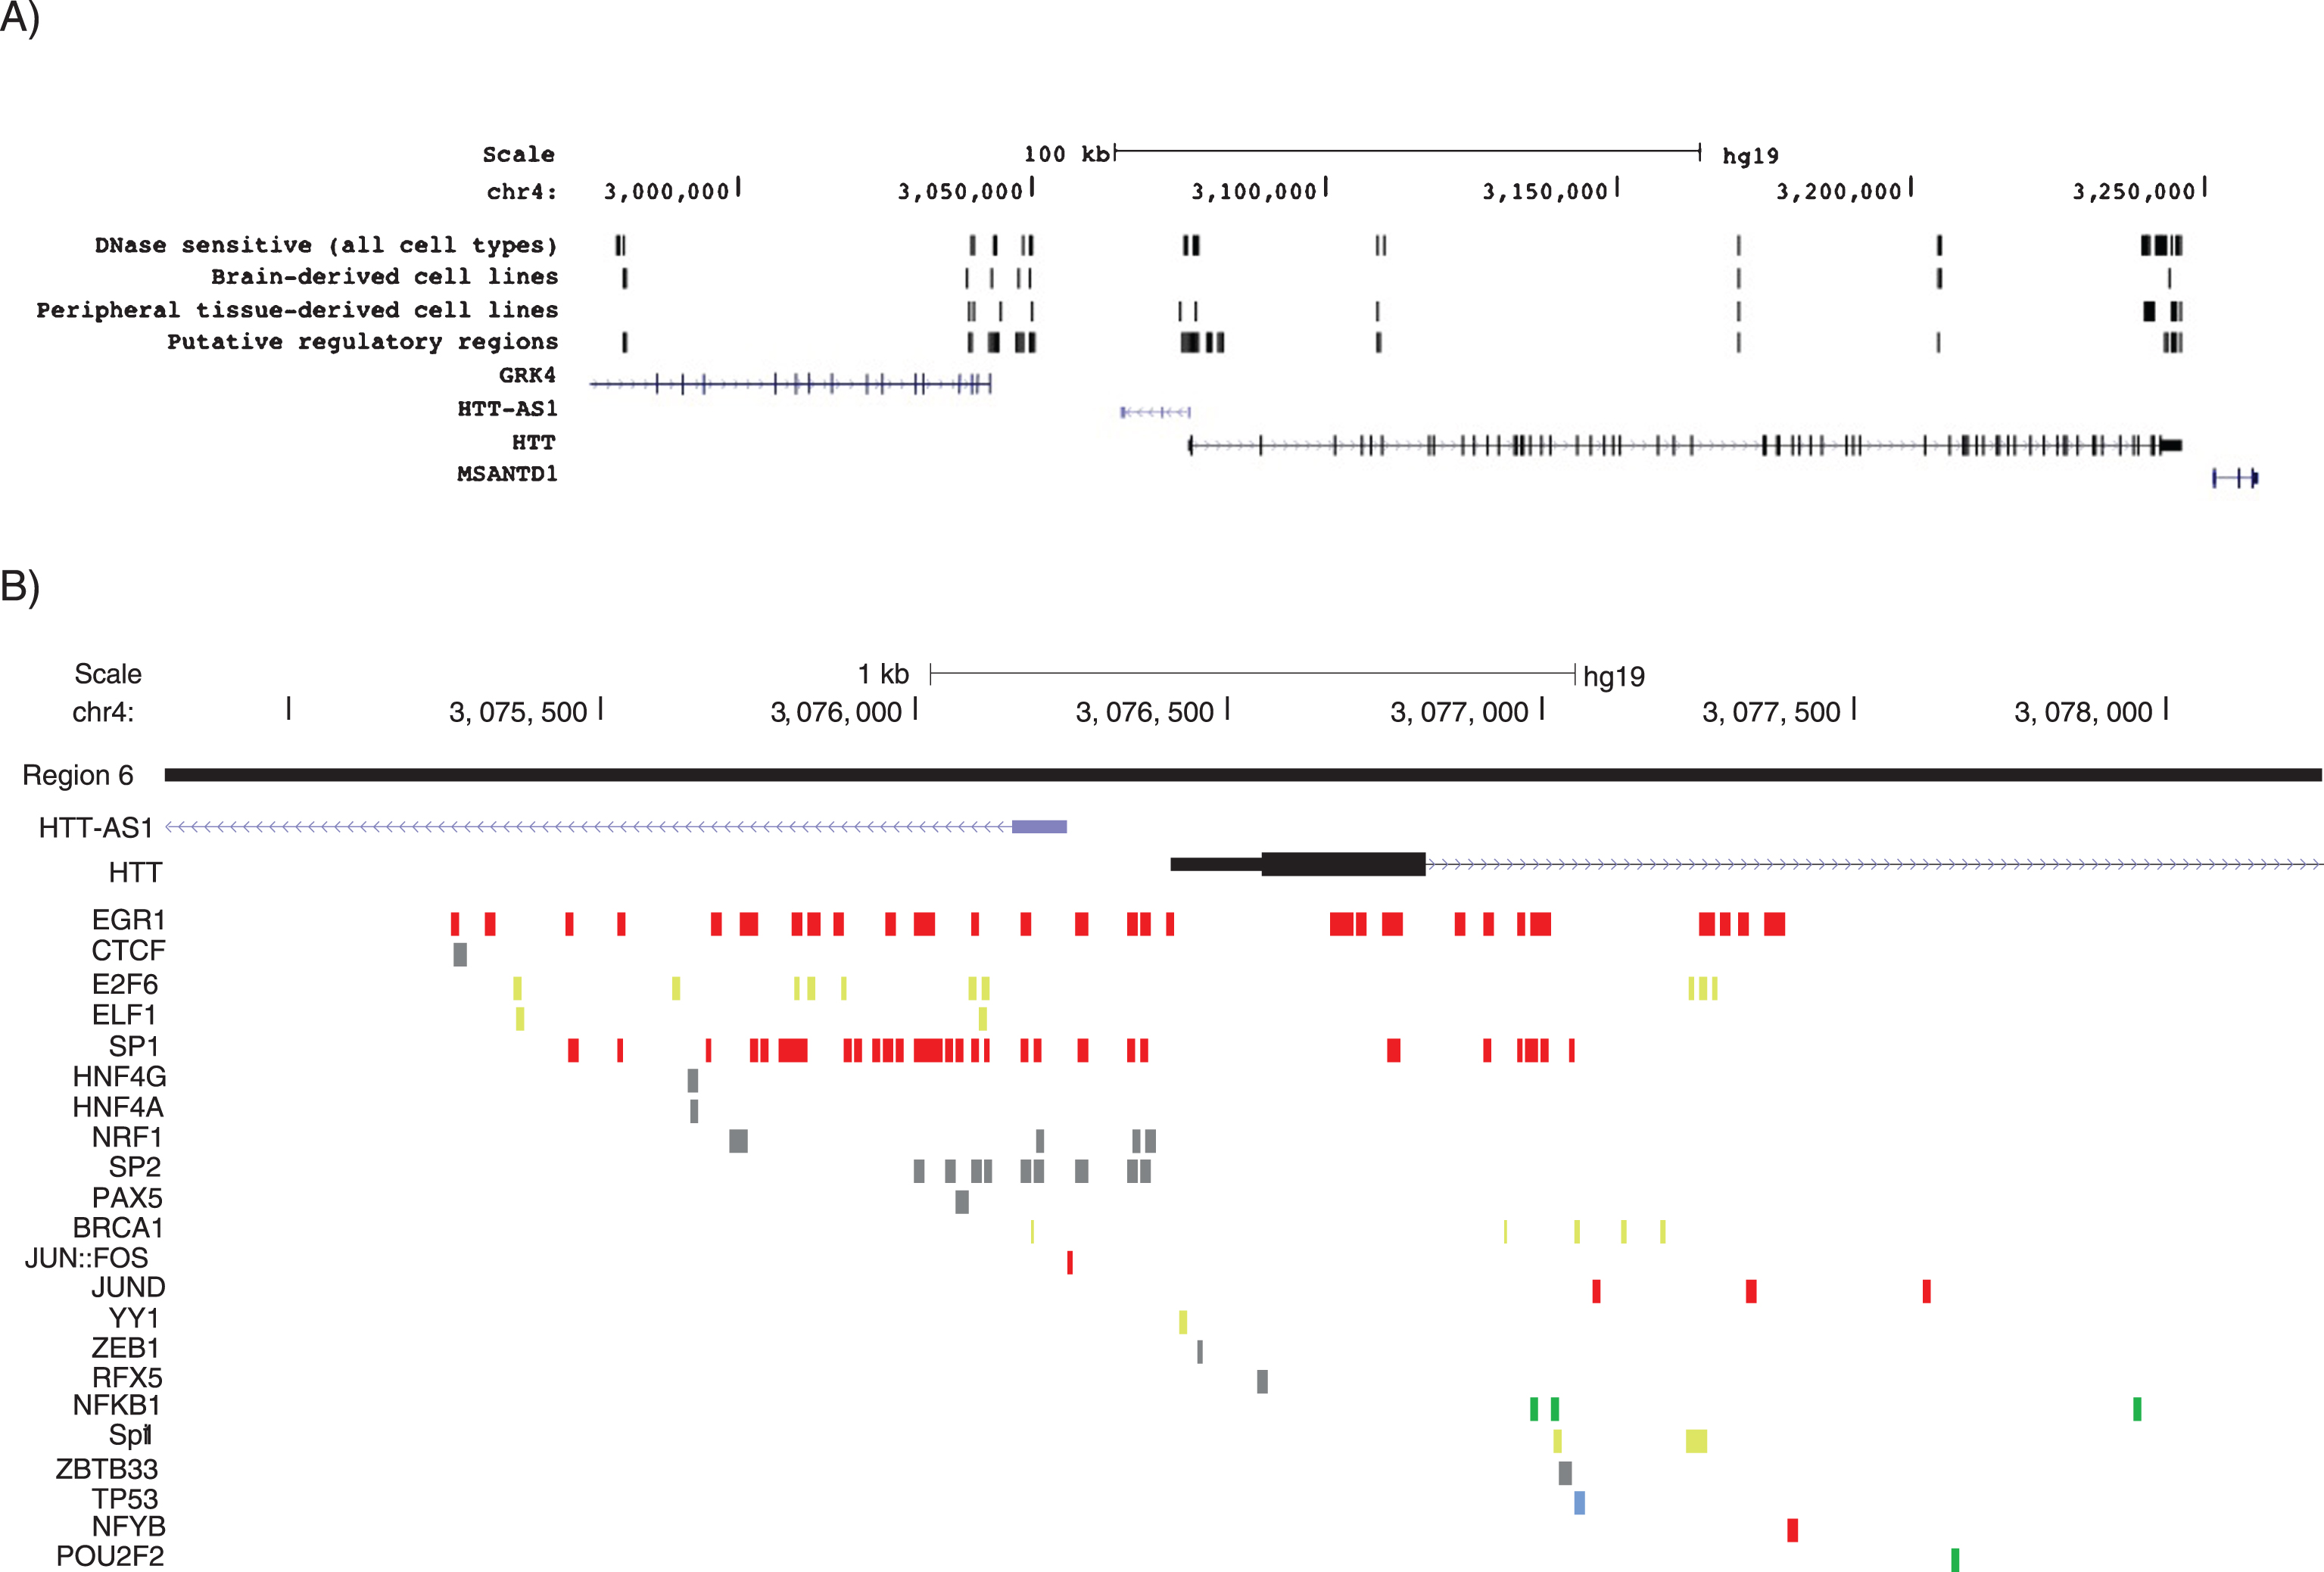
Peripheral and brain-specific DNase hypersensitivity sites in region 6 (the HTT promoter) and predicted TFBS within region 6. A) DNase hypersensitivity sites within all cell lines tested, brain cell types and peripheral cell types. Figure adapted from UCSC Genome Browser. B) Predicted TFBS in region 6, the region corresponding with the proximal HTT promoter. TFBS are color-coded according to their interacting group (Fig. 4). Figure adapted from UCSC Genome Browser.
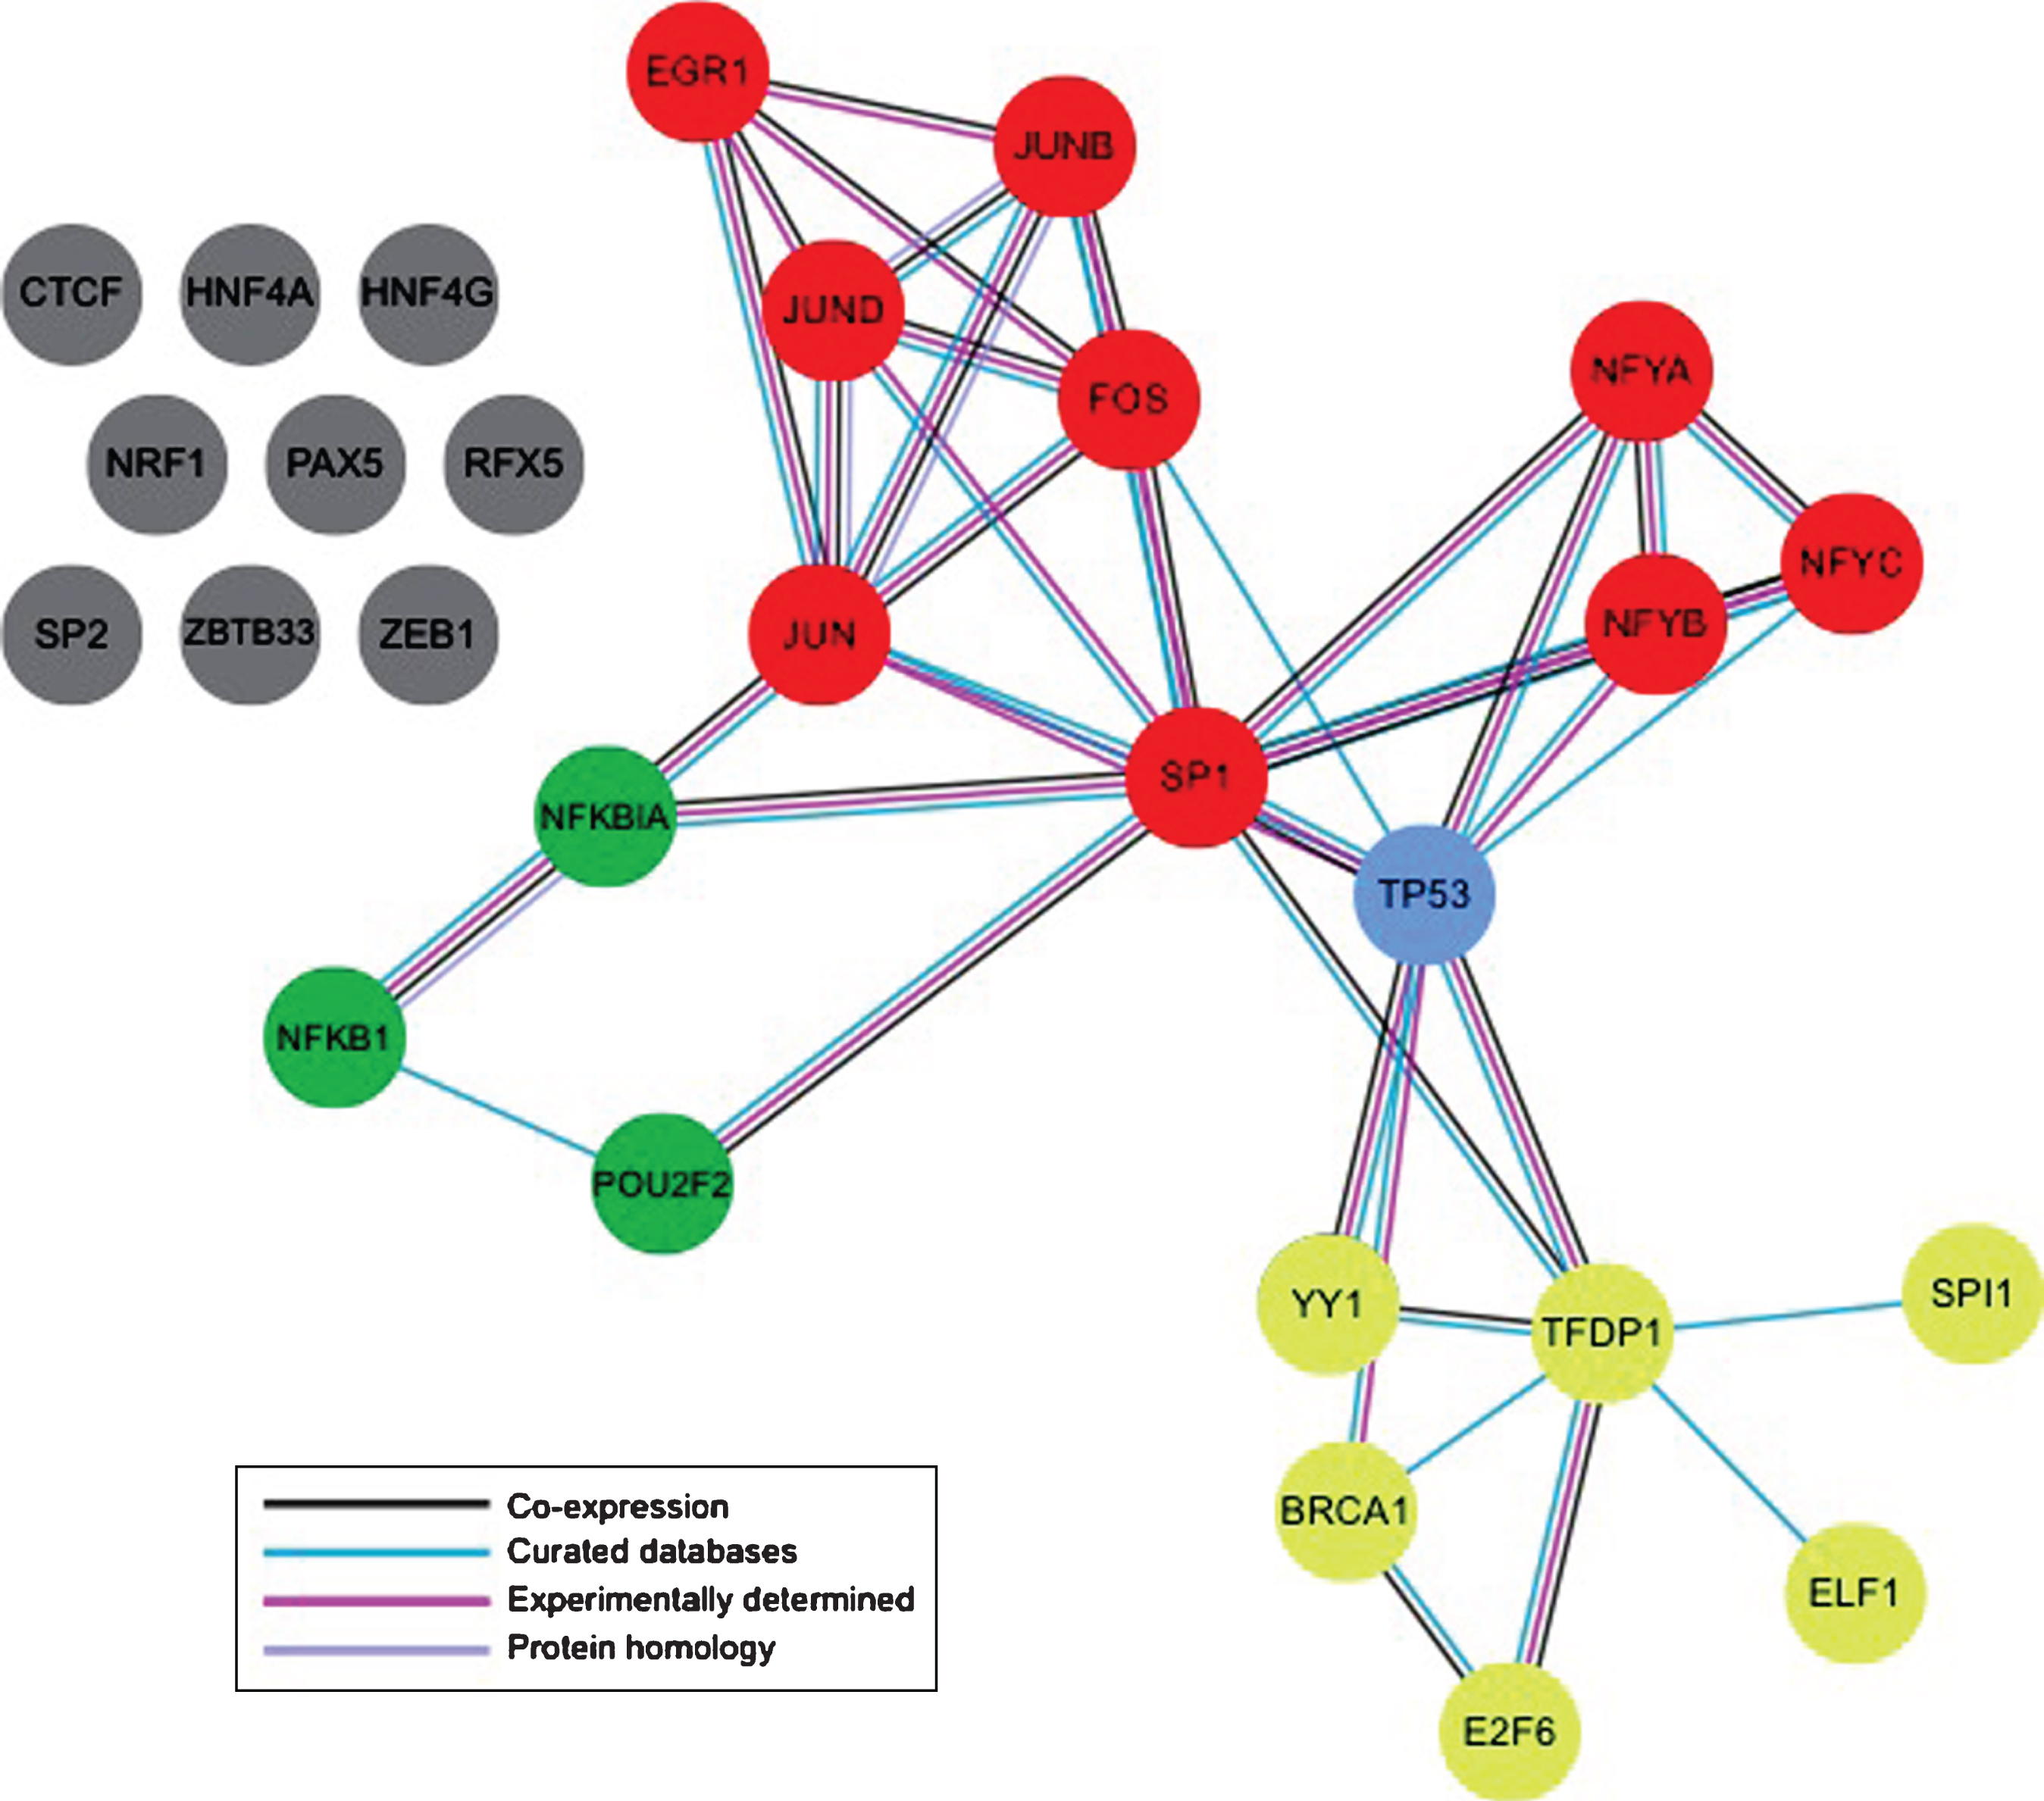
Protein-protein interactions between candidate TFs within region 6. The STRING online database (http://string-db.org/) was used to identify clusters of interacting TFs using Markov cluster analysis (threshold = 3). 4 clusters of interacting TFs were identified. Figure adapted from (http://string-db.org/).
Brain and peripheral-specific DNase hypersensitivity in 16 candidate regions
To further prioritize the list of candidate regions and TFs, specifically for in vitro analysis, DNase hypersensitivity marks were identified for both brain and peripheral tissues. DNase hypersensitivity indicates regions of the genome that are not impaired by histones or chromatin structure and are available for both DNA cleavage by DNase and TF binding. Differences in DNase hypersensitivity exist based on cell type and can be used to identify which regions of interest are specifically open in either brain or peripheral cell types [14]. HTT, although ubiquitously expressed, displays differential levels of expression in brain versus peripheral tissues [15], which may be a consequence of tissue specific methylation of specific regions in the promoter [16]. As a result, DNase hypersensitivity was used to prioritize candidate regions with open genomic characteristics to be functionally assessed in peripheral HEK293 cells.
Using DNase hypersensitivity features available on the UCSC table browser, three tracks were added corresponding to DNase hypersensitivity sites within all cell types, brain cell types and peripheral cell types (Fig. 3A). Based on these marks, region 9 was selected as the top candidate region along with region 6, the proximal promoter region, to evaluate TFs of interest in HEK293 cells. Since the primary validation was to be completed in a peripheral cell type, HEK293 cells, regions with peripheral DNase hypersensitivity were prioritized under the assumption that a region that is primarily open in peripheral cell types would likely have TFBSs for TFs that are more active in peripheral cells.
siRNA-mediated knockdown of STAT1 increases HTT promoter expression
To validate the utility of the bioinformatic screen in identifying TFs capable of altering HTT expression, siRNA experiments were conducted in peripheral HEK293 cells. Using the combination of the TFBS prediction, ENCODE DNase hypersensitivity tracks and STRING analysis, region 9 and its accompanying TFs were evaluated (Fig. 5, Supplementary Figure 2). One of the candidate TFs identified in Region 9, STAT1, plays a vital role in various signaling pathways including those that regulate cell growth and differentiation, the immune response, antiviral activity and homeostasis [17]. More importantly, numerous studies focused on transcriptional dysregulation in HD have identified changes in STAT1 gene expression in both primary human HD innate immune cells [18] and in the cerebellum and caudate of HD patients [19]. Based on these studies and the identification of STAT1 in our ChIP-seq data sets and STRING analysis, it was chosen as a candidate TF to be investigated in vitro. siRNA-mediated knockdown of STAT1 resulted in significant reduction in STAT1 transcript levels and an increase in endogenous HTT expression (Fig. 6). Three additional TFs, p53, SP1, and NFκB were also selected as previously reported modulators of HTT expression. In our in vitro experiments, siRNA treatment resulted in significant knockdown of specific transcripts, but mediated different effects on endogenous HTT expression. p53 siRNA-mediated knockdown did not alter HTT levels (Supplementary Figure 3). NFκB knockdown increased HTT expression, while Sp1 knockdown modestly increased HTT expression (Supplementary Figure 3). Taken together, this data shows that siRNA-mediated knockdown of candidate TFs resulting from our in silico analysis can alter HTT expression and demonstrates the presence of transcriptional regulatory elements outside of the immediate HTT promoter.

Identified TFBS in region 9, corresponding to intron 5 of the HTT gene. Predicted TFBSs in putative regulatory region 9. TFBSs are color coded according to their interacting group (Fig. 2). STAT1 was identified in this region and selected for further in vitro analysis. Figure adapted from UCSC Genome Browser.

siRNA-mediated knockdown of STAT1 increases HTT promoter expression. RT-qPCR for STAT1 (A) and endogenous HTT (B). Data is normalized to a normalization factor of 2 (NF2), with genes utilized indicated on the Y-axis. For each treatment n = 3. One-way ANOVA with Tukey post test, ***p < 0.001, ****p < 0.0001 (mean±SEM).
STAT1 binding is enriched at the predicted HTT region 9 site
Global siRNA-mediated knockdown of previously characterized HTT TFs and STAT1 influences HTT expression and indicates that these TFs may interact with HTT. Chromatin immunoprecipitation followed by quantitative real-time PCR showed STAT1 enrichment at the HTT region 9 binding site we predicted (Fig. 7). These data show that STAT1 directly interacts with and influences HTT transcription, identifies STAT1 as an HTT TF, and validates our in silico approach for novel TF identification.
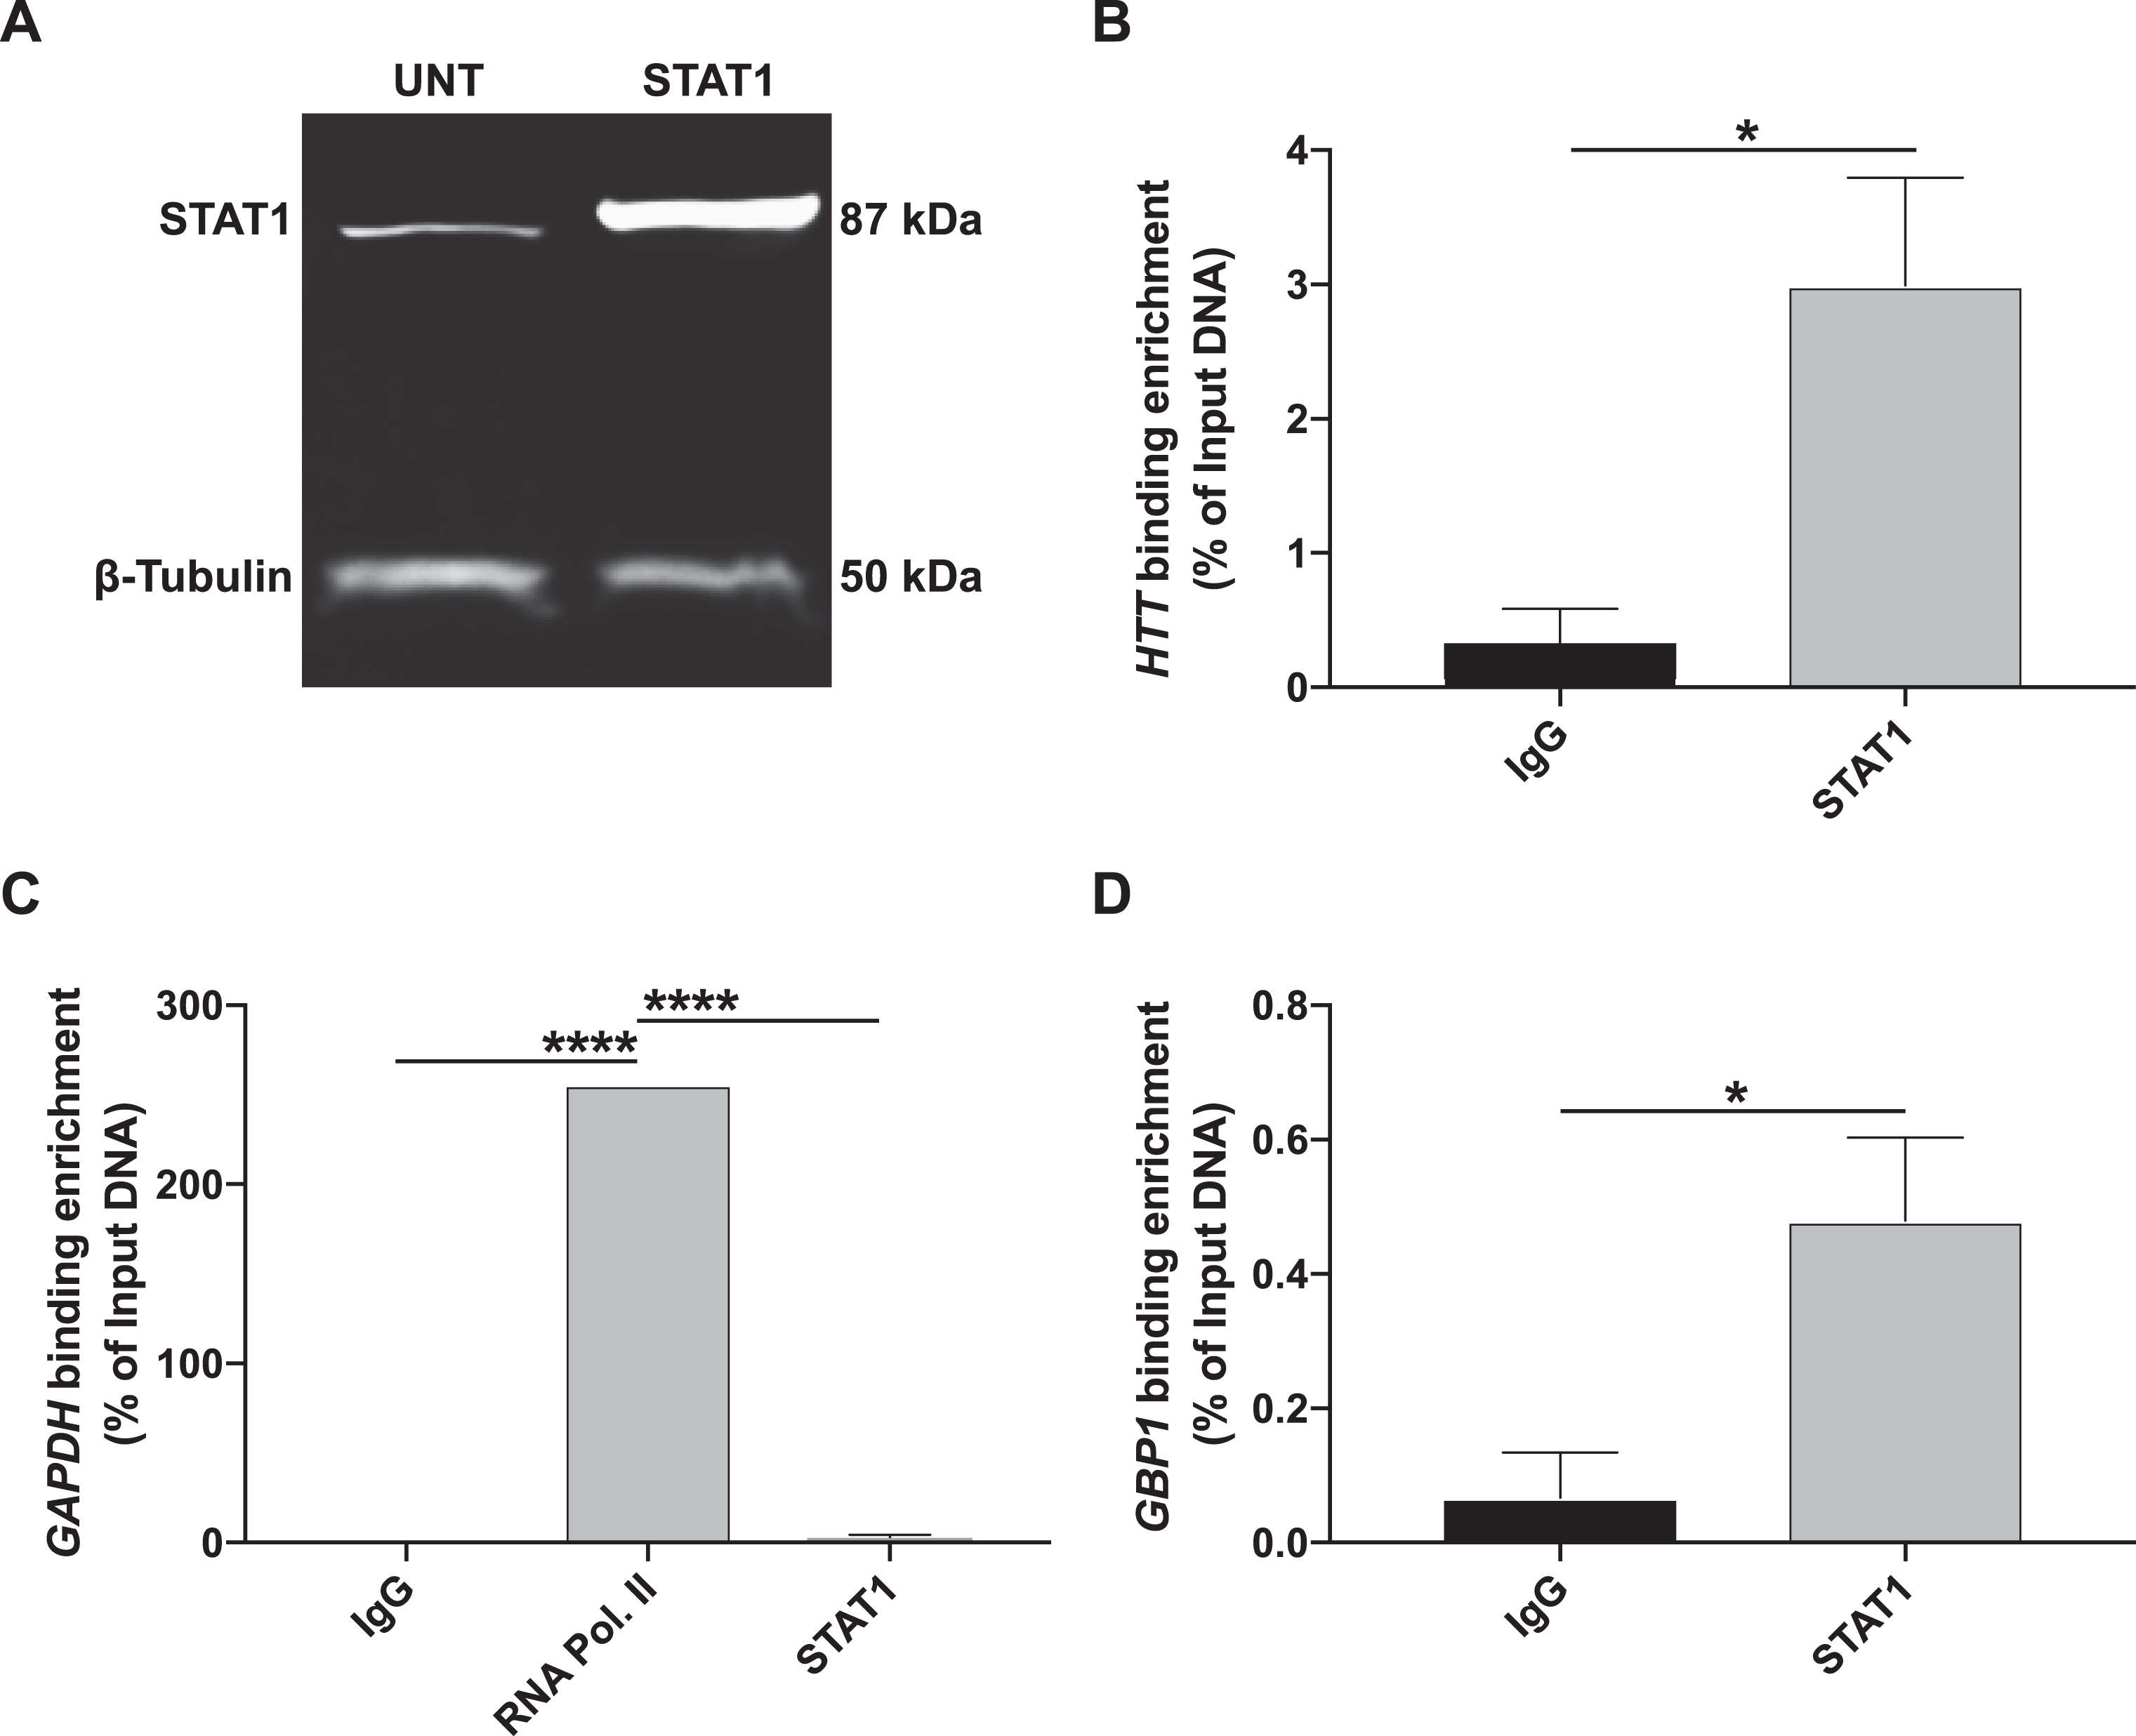
STAT1 binding is enriched at the predicted region 9 site at the HTT gene locus. (A) HEK293 cells were transfected with STAT1α pRC/CMV and collected for chromatin immunoprecipitation following 72h of treatment. Transfected cells overexpressed STAT1 compared to untransfected cells, as analyzed using Western blot. β-Tubulin is shown as the loading control. (B) ChIP-qPCR of STAT1 binding to the predicted HTT region 9 site calculated using percent of input genomic DNA. Antibodies are indicated on the X-axis. For each treatment, n = 3. Student’s t-test, p < 0.05 (mean±SEM). (C) ChIP-qPCR of RNA polymerase II binding to GAPDH is shown as a positive control for ChIP and calculated using percent of input genomic DNA. Antibodies are indicated on the X-axis. Immunoprecipitation treatments with anti-IgG (mouse) and anti-STAT1 are shown as negative controls. For anti-IgG and anti-STAT1, n = 3. For anti-RNA polymerase II, n = 1. One-way ANOVA with Tukey post test, ****p < 0.0001 (mean±SEM). (D) ChIP-qPCR of STAT1 binding to a previously identified GBP1 site is shown as a positive control and calculated using percent of input genomic DNA. Antibodies are indicated on the X-axis. For each treatment, n = 3. Student’s t-test, p < 0.05 (mean±SEM).
DISCUSSION
In this study, we used a scoring paradigm based upon known markers of transcriptional regulation to identify regions outside of the proximal promoter that may be involved in HTT gene regulation. This is the first study of its kind for the HTT gene and has identified 16 regions that bear genomic and chromosomal marks indicative of regulatory regions. Using available data sets, 59 putative candidate TFs were identified and amassed into 15 TF interaction networks. These candidate TFs were prioritized based on DNase accessible open chromatin specific in peripheral tissues for in vitro analysis. Using siRNA-mediated knockdown of STAT1, a TF previously implicated in HD transcriptional dysregulation, we identified an increase in endogenous HTT transcript expression. Direct binding of STAT1 to the predicted region 9 site was detected using ChIP-qPCR. Together, these assays functionally validated our bioinformatic screen and identified putative regulatory regions outside the proximal promoter capable of altering HTT levels.
It is important to bear in mind, however, that although this analysis is the most comprehensive of its kind to date, limitations do exist. First, of the 1639 known TFs [20], we were only able to assess ChIP-seq binding of a small subset of TFs in the 16 identified regions of interest [21]. This means that while the resulting TFs may play a role in HTT transcriptional regulation, additional TFs with larger roles may exist. Second, the local genomic context of the HTT gene, namely the genes up and downstream, were used in this early investigation but it is possible that more distal enhancers exist beyond the scope of our study. Using information from genome-wide chromosome conformation data sets (4C or 5C data sets) would allow distal enhancers to be identified, if they do exist. The selection of tissue-specific 4C or 5C data sets, representing both brain and peripheral cell or tissue types, would also allow for the identification of interacting regions of the genome that differ between cell and tissue types. The upregulation of HTT in the brain and testes implies that tissue specific enhancers may be involved in this differential expression. Our analysis did not exclude ChIP-seq data sets based on tissue and cell type specificity to include as many TFs in the screen as possible. In the future, as more ChIP-seq data sets in more diverse sets of cell and tissue types become available, it will be possible to conduct a similar analysis using data sets differing by cell type for a single TF.
Many early studies focused on HTT gene regulation utilized bioinformatic programs to screen for putative TFBS based on sequence similarity alone, followed by verification through EMSA in some cases, but not all. As an improvement to this method, several additional studies utilized functional assays to identify TFs and associated TFBS in the HTT promoter region. To date, there are 4 TFs that have been implicated in HTT transcriptional regulation using a functional assay: p53, Sp1, HDBP1 and HDBP2 [22–24]. We assessed the effect of p53 and Sp1 siRNA-mediated knockdown on HTT expression in our in vitro system and found no change in HTT expression following p53 knockdown and a modest increase in HTT expression with Sp1 knockdown. Previous work has demonstrated that overexpression of p53 [22] and Sp1 [23] increase HTT expression which contrasts our results. In the case of p53, Ryan and colleagues used HTT promoter constructs of shorter lengths that may influence the alterations in HTT levels following p53 overexpression. Sp1 was identified as a transcriptional regulator of the HTT promoter in a 2012 report and was also identified as a putative TFBS in the region containing the HTT promoter in our bioinformatic assay [23]. The Wang 2012 report found several putative Sp1 TFBSs both up and downstream of a TSS that they identified, and is different than the one identified in the UCSC genome browser. In contrast, we were only able to find one Sp1 TFBS downstream of the first exon of HTT. This difference in the number of identified Sp1 putative TFBSs is likely due to the difference in identification of TFBSs, namely as we based our TFBS on binding in ChIP-seq assays while the Wang group used a purely bioinformatic method based upon a PWM for Sp1 alone, an approach known to be prone to a high rate of false positives. It is still possible that the additional Sp1 sites identified in the Wang report are functional and bind Sp1, but due to cell type differences used in the ChIP-seq assay they were not identified in our screen. While the use of an over-expression paradigm, also in HEK293 cells, to test the role of Sp1 in HTT promoter function does suggest that Sp1 positively regulates the HTT promoter, this may be an effect of the over-expression of Sp1 and may not accurately reflect the function of Sp1 under normal conditions. In our siRNA-mediated knockdown paradigm, we found that knockdown of Sp1 modestly increases endogenous HTT expression which contrasted with the expected result based on the Wang data. The magnitude of siRNA-mediated knockdown may explain the increase in HTT expression we identified. In the case of Sp1, there was an ∼50% reduction in Sp1 following siRNA treatment. The incomplete knockdown of Sp1 may not be sufficient to decrease HTT expression as would be expected.
Transcriptional regulation of the HTT promoter has been understudied in the literature. By understanding the cellular pathways that regulate HTT transcription we gain a better understanding of the wild-type function of HTT, which will identify new therapeutic targets. We conducted a more comprehensive screen of the HTT gene and surrounding genome and have found additional genomic regions that could be involved in HTT transcriptional regulation. These newly identified regions include the 3’ UTR, several sites within introns of HTT and the promoter itself. Screening using ChIP-seq data sets also generated a new list of TF candidates and their interactions that have not been previously associated with the HTT gene. Future work using in vitro and in vivo studies to evaluate the effect of modulating TF levels on HTT gene expression will continue to further our understanding of the regulation of this gene and the implications on disease pathology.
CONFLICT OF INTEREST
The authors have no conflict of interest to declare.
Footnotes
ACKNOWLEDGMENTS
We would like to thank A. Hill, P. Wagner, and G. Lu for excellent technical assistance. This work was supported by the CIHR (to BRL and RDS) and CHDI. The study sponsor, CHDI Foundation Inc. (a not-for-profit HD research foundation) contributed to the conception of the study, and provided scientific advice on study design.