
Abstract
Background:
DriveSafe DriveAware (DSDA) has been validated as an off-road screening tool for predicting on-road driving performance in clinical populations, but its utility in people with Huntington’s disease (HD) is unknown.
Objective:
Our aim was to evaluate the utility of DSDA in people with HD by demonstrating sensitivity of DSDA scores to HD progression and exploring associations between DSDA performance and cognitive functions that are essential to driving and impaired in people with HD.
Methods:
We administered the iPad application version of DSDA to 26 pre-symptomatic and symptomatic participants with HD. Disease progression was assessed via measures of motor impairment, disease burden and functional capacity. Standardised neuropsychological tests were used to assess cognitive function across several domains including attention, processing speed, planning, and visuoperception.
Results:
Results underscore the sensitivity of DSDA to HD progression and cognitive impairment; that is, poorer DSDA performance was associated with greater HD severity and poorer cognitive ability across the domains of attention, processing speed, and planning. Nevertheless, we identified a proportion of participants with HD who were predicted to pass on-road testing based on DSDA, but scored in the impaired range on multiple cognitive tests. These participants tended to score closer to the cut-off score used by DSDA to categorise pass/fail outcomes.
Conclusions:
Our findings demonstrate potential for use of DSDA in the HD population, however, significant variability in cognitive performance among those predicted to ‘pass’ on-road driving assessment suggests the screening tool requires further development for use with HD drivers.
INTRODUCTION
Huntington’s disease (HD) is an autosomal dominant neurodegenerative disorder characterised by progressive decline in motor, cognitive and emotional functioning. The cognitive decline in HD results in reduced fitness to drive [1]. Driving is complex and cognitively demanding in that it requires the integration of multiple cognitive abilities known to decline in HD, including attention, processing speed, planning and visuoperceptual skills [2, 3]. The deterioration of these cognitive abilities results in a progressive decline in driving ability [4, 5]. Validating the impact of cognitive impairments on fitness to drive, HD gene expansion carriers have higher rates of motor vehicle accidents and poorer on-road driving test performance compared to healthy controls [4–6]. HD is also associated with impairment in insight [7], therefore people with HD may have difficulty identifying themselves as unsafe drivers [4], which contributes to increased driving risk [6, 8].
Fitness to drive assessments are routinely required for people with HD [9] but they are expensive, time consuming, and require repeat testing every 12-months [9–11]. The gold standard fitness to drive assessment in Australia and many other countries is a comprehensive occupational therapy (OT) facilitated driving test which includes both off-road (questions related to health, lifestyle and knowledge of road rules) and on-road components (driving a dual-controlled car along a set route) [10, 13]. Because of the cost and burden of these OT driving assessments [10], briefer off-road screening tests, such as neuropsychological batteries, have been developed with the aim of predicting on-road test performance [1, 14], and reducing the number of referrals for on-road assessment.
Neuropsychological tests are used to evaluate cognitive abilities considered integral to driving ability, and together with findings from the broader clinical evaluation, may serve to trigger referral for on-road driving assessment [2, 16]. Although these issues have seldom been studied in the HD population, preliminary reports suggest that cognitive impairment ratings (scores of 1.5 standard deviations below the normative mean) may predict which drivers with HD will fail an on-road driving assessment [1]. Neverthless, despite strong associations with on-road performance in HD [1, 8], the specific neuropsychological tests that have been used to assess fitness to drive in HD and other clinical populations, have been highly variable, and thus findings on the predictive utility of using neuropsychological assessments to evaluate on-road test performance in these clinical populations has been inconsistent [10, 16]. Furthermore, despite increasing efforts to validate neuropsychological evaluations as a screening method for on-road driving assessment, the absence of driving-specific stimuli and consequent poor face validity of neuropsychological tests as a driving assessment, remains a significant and universal limitation [10].
Though not extensively explored in HD, driving simulators have also been used to assess the fitness to drive of people with HD [4, 14]. In addressing some of the limitations of neuropsychological testing, driving simulators use computer-generated imagery to create interactive driving scenes that closely align with conditions of the real-world driving environment [17]. Using this technology, studies have found significant differences in the performance of HD drivers and controls, and significantly associated HD simulator performance with on-road driving performance [4, 14]. Given that simulators offer greater face validity and, potentially, predictive validity to guide referral for on-road driving assessment [6, 17] these results are promising for the future of HD driving assessments. On a practical level however, the high financial cost of driving simulators has significantly limited their application in clinical contexts [17].
Software programs that include real-world driving stimuli and capture the cognitive demands of driving may be a useful alternative to driving simulators, and in the clinical context, may provide a more suitable, lower cost option for evaluating the need for an on-road driving assessment. In the Australian context, one such option is DriveSafe DriveAware (DSDA) [18]; an interactive, face-valid tool that incorporates images of objects and surroundings that are regularly encountered while driving (e.g., cars, pedestrians, intersections) into its design [19]. The program contains two components that independently examine driving-related skills (i.e., visual scanning and anticipation of movements by vehicles and pedestrians; DriveSafe component) and self-awareness of driving ability (DriveAware component) [19]. Scores from the two domains are combined and used to categorise test-takers as ‘pass’ or ‘fail’, denoting the predicted outcome of an on-road driving assessment. Anyone who cannot be confidently classified as a ‘pass’ or ‘fail’, is classified as ‘need further testing’ and referred for on-road assessment. Research suggests about 50 percent of test-takers are categorised to ‘need further testing’ [20], and thus, half of all test-takers, who normally would be referred for on-road assessment, can potentially avoid the expensive evaluation.
To date, research examining the predictive accuracy of DSDA has been mostly limited to heterogeneous elderly samples, and there has been no systematic validation of DSDA in people living with HD. In one study of people with a range of predominantly neurological conditions, Hines and Bundy [20] found that pass/fail outcomes on DSDA accurately predicted on-road testing outcomes in 90 percent of participants. Although their sample included a proportion of people diagnosed with HD (n = unspecified), Hines & Bundy’s results did not describe performance on DSDA in this particular subgroup of participants. As such, the utility of DSDA in people with HD is unknown.
Prior to conducting a larger, relatively expensive on-road study to determine the predictive validity of DSDA for assessing fitness to drive in HD, the aim of this initial pilot study was to evaluate the clinical utility of DriveSafe DriveAware (DSDA) in an Australian sample of people living with HD. Specifically, the aim of our study was to determine the sensitivity of DSDA to measures of disease progression, and in particular, to the cognitive abilities affected in HD that are relevant to driving. In addition, we wished to examine the extent to which a ‘high pass’ and a ‘low pass’ on DSDA’s prediction of on-road driving fitness was associated with differences in performance on measures of sustained and divided attention, processing speed, planning, and visuoperception. This association would indicate that DSDA taps into the relevant aspects of cognition in HD, providing additional evidence of the tool’s predictive validity as a measure of fitness to drive.
METHOD
Participants
Our sample included 26 participants (seven pre-symptomatic, 19 symptomatic) who had previously been confirmed to have the gene expansion for HD (CAG repeats >36) (see Table 1). Participants had a range of HD symptoms, from minimal (no motor signs, low disease burden scores, no functional impairment) to moderate disease severity (many motor signs, moderate disease burden scores and some functional impairment). According to the Total Functional Capacity criterion, 50 percent of participants (n = 13) were classified with has having no or mild functional impairment (stage one; TFC score = 11–13), whilst the other 50 percent were classified has having a moderate level of functional impairment (stage two; TFC score = 7–10).
Demographic, clinical, and neuropsychological characteristics of the HD sample
Note. UHDRS = Unified Huntington’s Disease Rating Scale; TFC = Total Functional Capacity scale; TMT = Trail Making Test; SDMT = Symbol Digit Modalities Test; RCFT = Rey Complex Figure Test.
HD progression measures
We used the Unified Huntington’s Disease Rating Scale (UHDRS) motor score to assess the severity of HD motor signs [21]. Motor signs were rated on a scale of zero (normal functioning) to four (severe impairment) and summed for a total score out of 120.
We used disease burden scores as a proxy measure of proximity to disease onset, (CAGn – 35.5)×age [22]. Disease burden scores increase with disease progression, across all pre-symptomatic and symptomatic stages of HD [23].
The Total Functional Capacity scale (TFC), taken from the UHDRS, was used to assess the ability to perform basic everyday tasks, such as work and managing finances [21]. The TFC includes five items and provides a total score between zero and 13 with lower scores indicating poorer functional ability.
Virtual assessment of driving ability and awareness
The DriveSafe DriveAware program was administered using the Apple iPad [24] application version on an iPad Air 2 (see Fig. 1). The test contains two components, DriveSafe and DriveAware. DriveSafe is a proxy measure of driving ability and focuses on attention to visual cues in the driving environment. As seen in Fig. 1, DriveSafe superimposes driving stimuli (e.g., cars, bicycles, pedestrians and trucks) over the image of an intersection. These stimuli are presented for four seconds, after which participants are to indicate the type of stimulus, its position, and its direction. Points are awarded for each accurate response (type, location, direction) across a total of 10 items. Scores are summed and range from zero to 84.
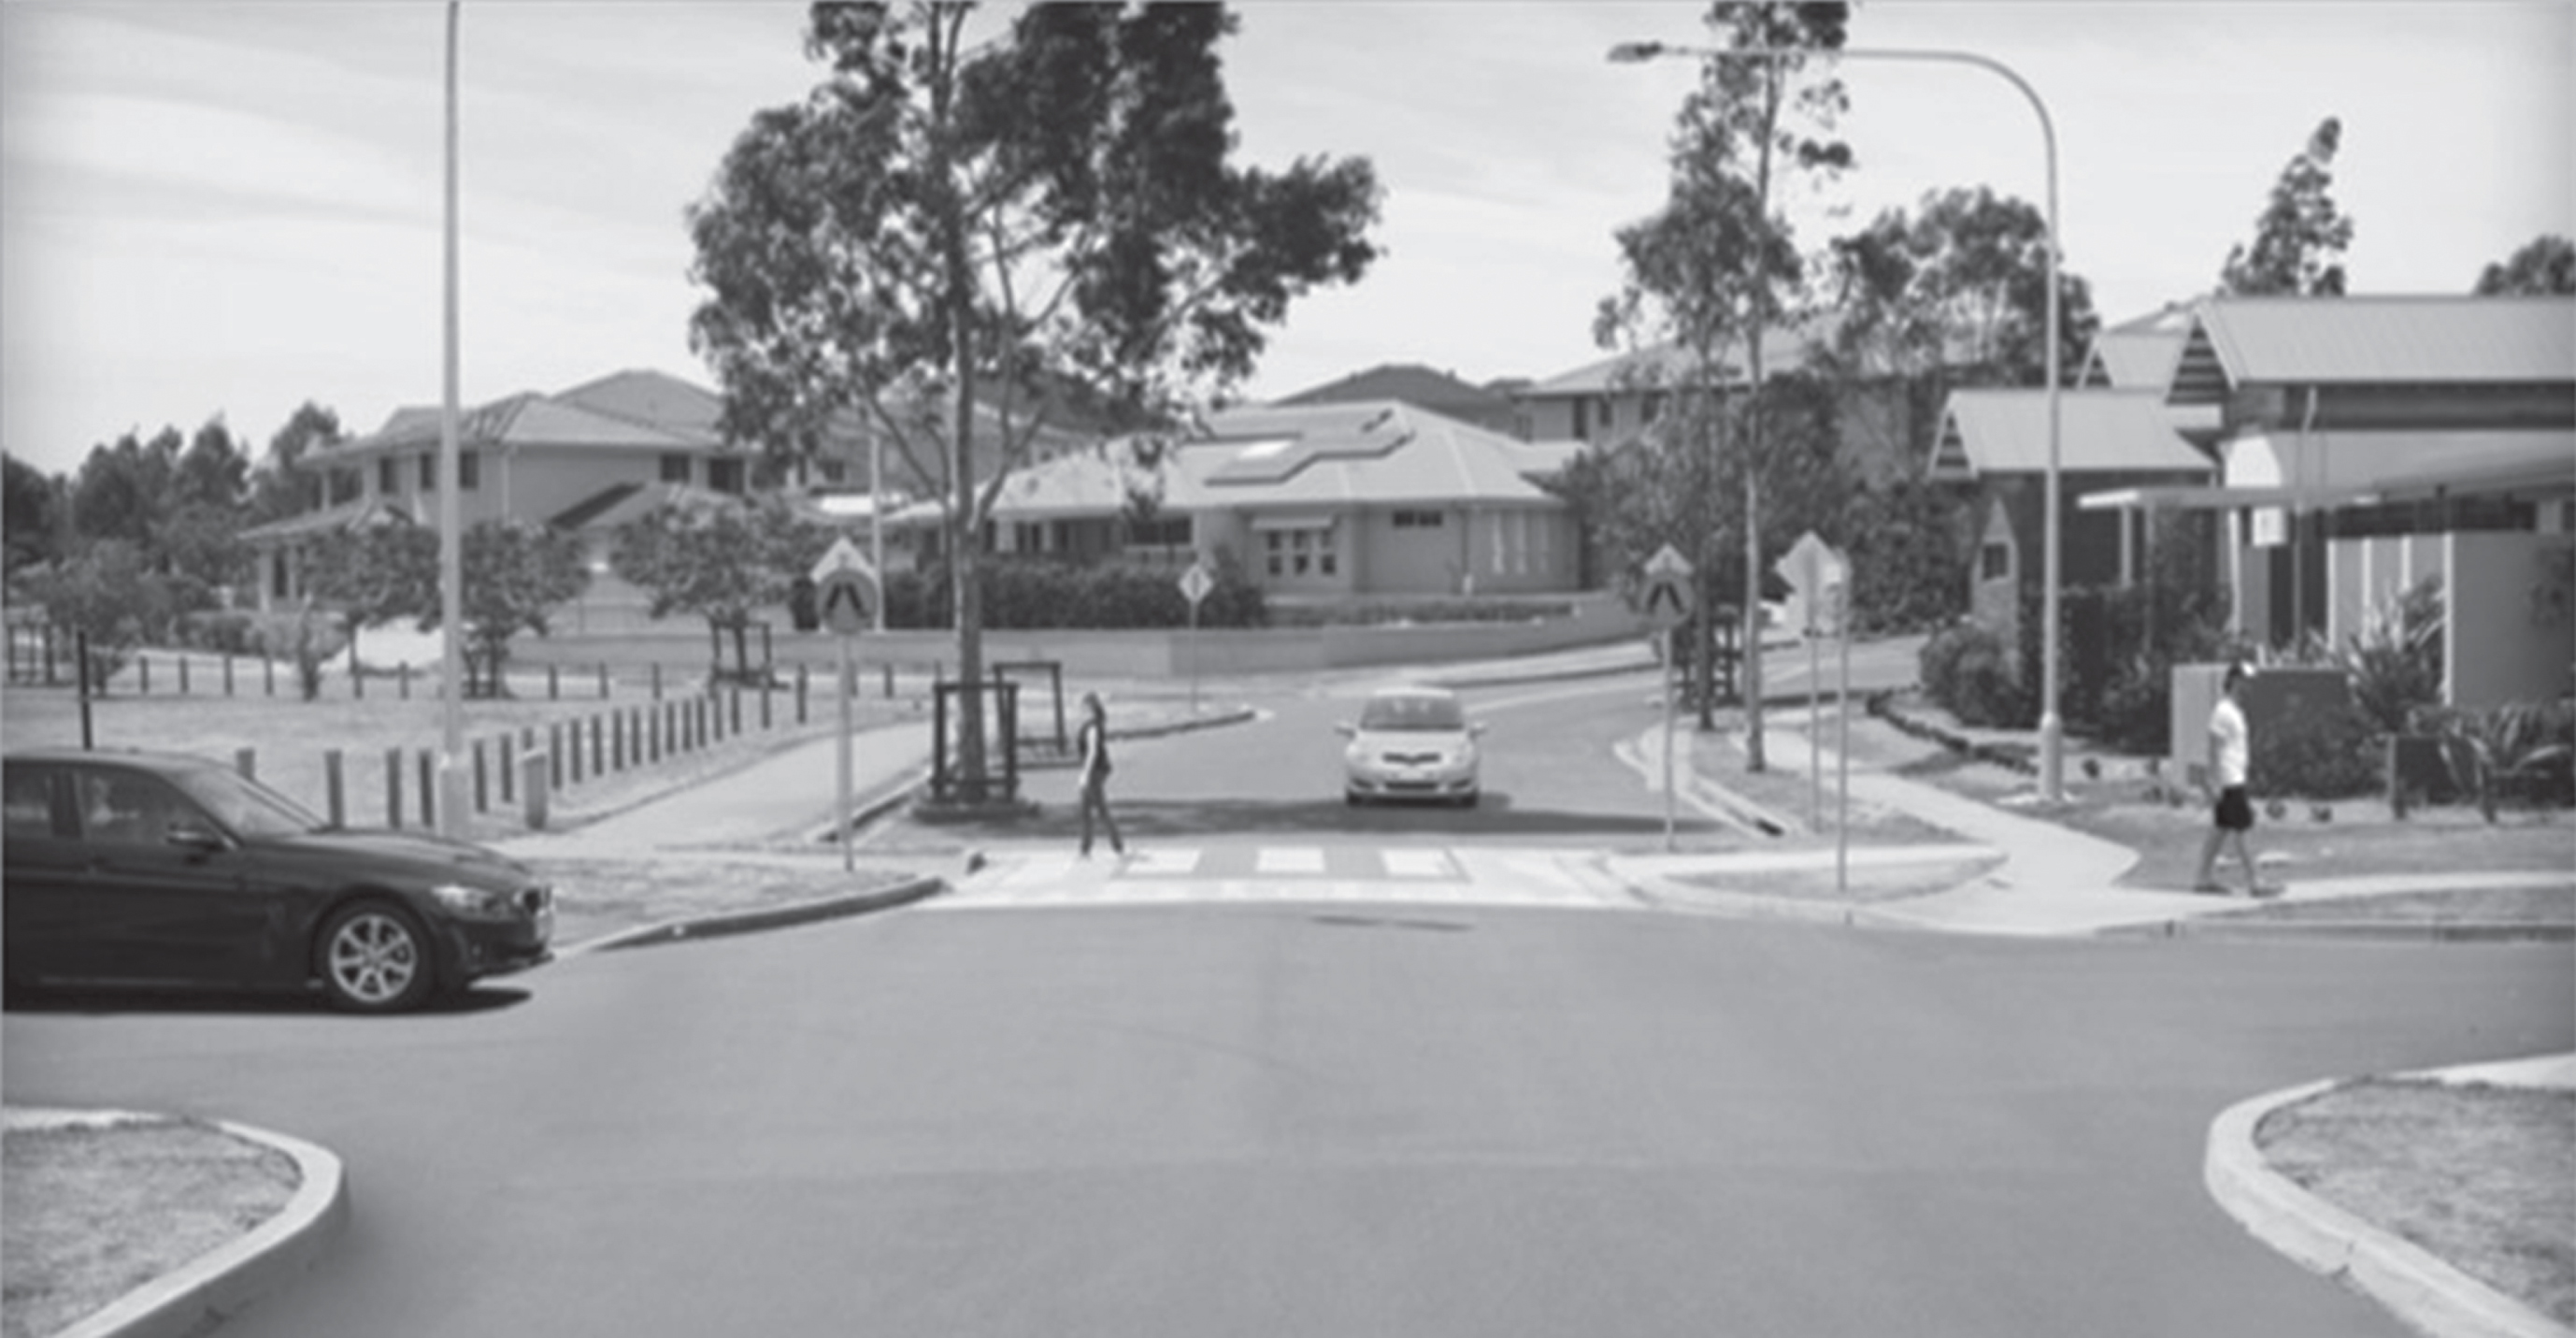
Example item of DriveSafe.
DriveAware is a four-item questionnaire used to assess driving insight. The assessment asks participants to rate their perceived performance on DriveSafe and evaluates their concerns about their own driving skills in real-world settings. Each item uses a three-option multiple choice format. These response options are then factored into the software’s algorithm to produce a score between zero and 17, with lower scores indicating a greater discrepancy between perceived driving ability and actual driving ability as measured by DriveSafe.
As displayed in Fig. 2, the DSDA cut-off scores are trichotomised into; (1) ‘likely to pass on-road assessment’ (2) ‘likely to fail on-road assessment’, and (3) ‘need further testing’. The ‘need further testing’ category accounts for a range of uncertainty and serves to reduce the likelihood of safe drivers being misclassified as unsafe and vice versa [25]. Since on-road driving is considered to require both visual attention to driving cues (DriveSafe) and self-awareness of driving ability (DriveAware), participants must score above the cut-off for both DriveSafe and DriveAware components in order to be classified as ‘likely to pass on-road assessment’. Moreover, given that good driving insight can compensate for limited driving skill (i.e., driving in only safe conditions), and vice versa, scores from the two DSDA components compensate each other to influence the process of categorisation. For example, to be categorised as a ‘pass’, test-takers must score between 72–84 on DriveSafe, and 11–17 on DriveAware; or between 58–71 on DriveSafe and 13–17 on DriveAware. Further detail, including exact cut-off scores and criteria associated with ‘need further testing’ and ‘fail’ outcomes is presented in Fig. 2. Studies on clinical populations indicate that DSDA has very high predictive validity, as well as high internal consistency, with alpha Cronbach values of.77 (DriveSafe) and.93 (DriveAware) [19, 26].
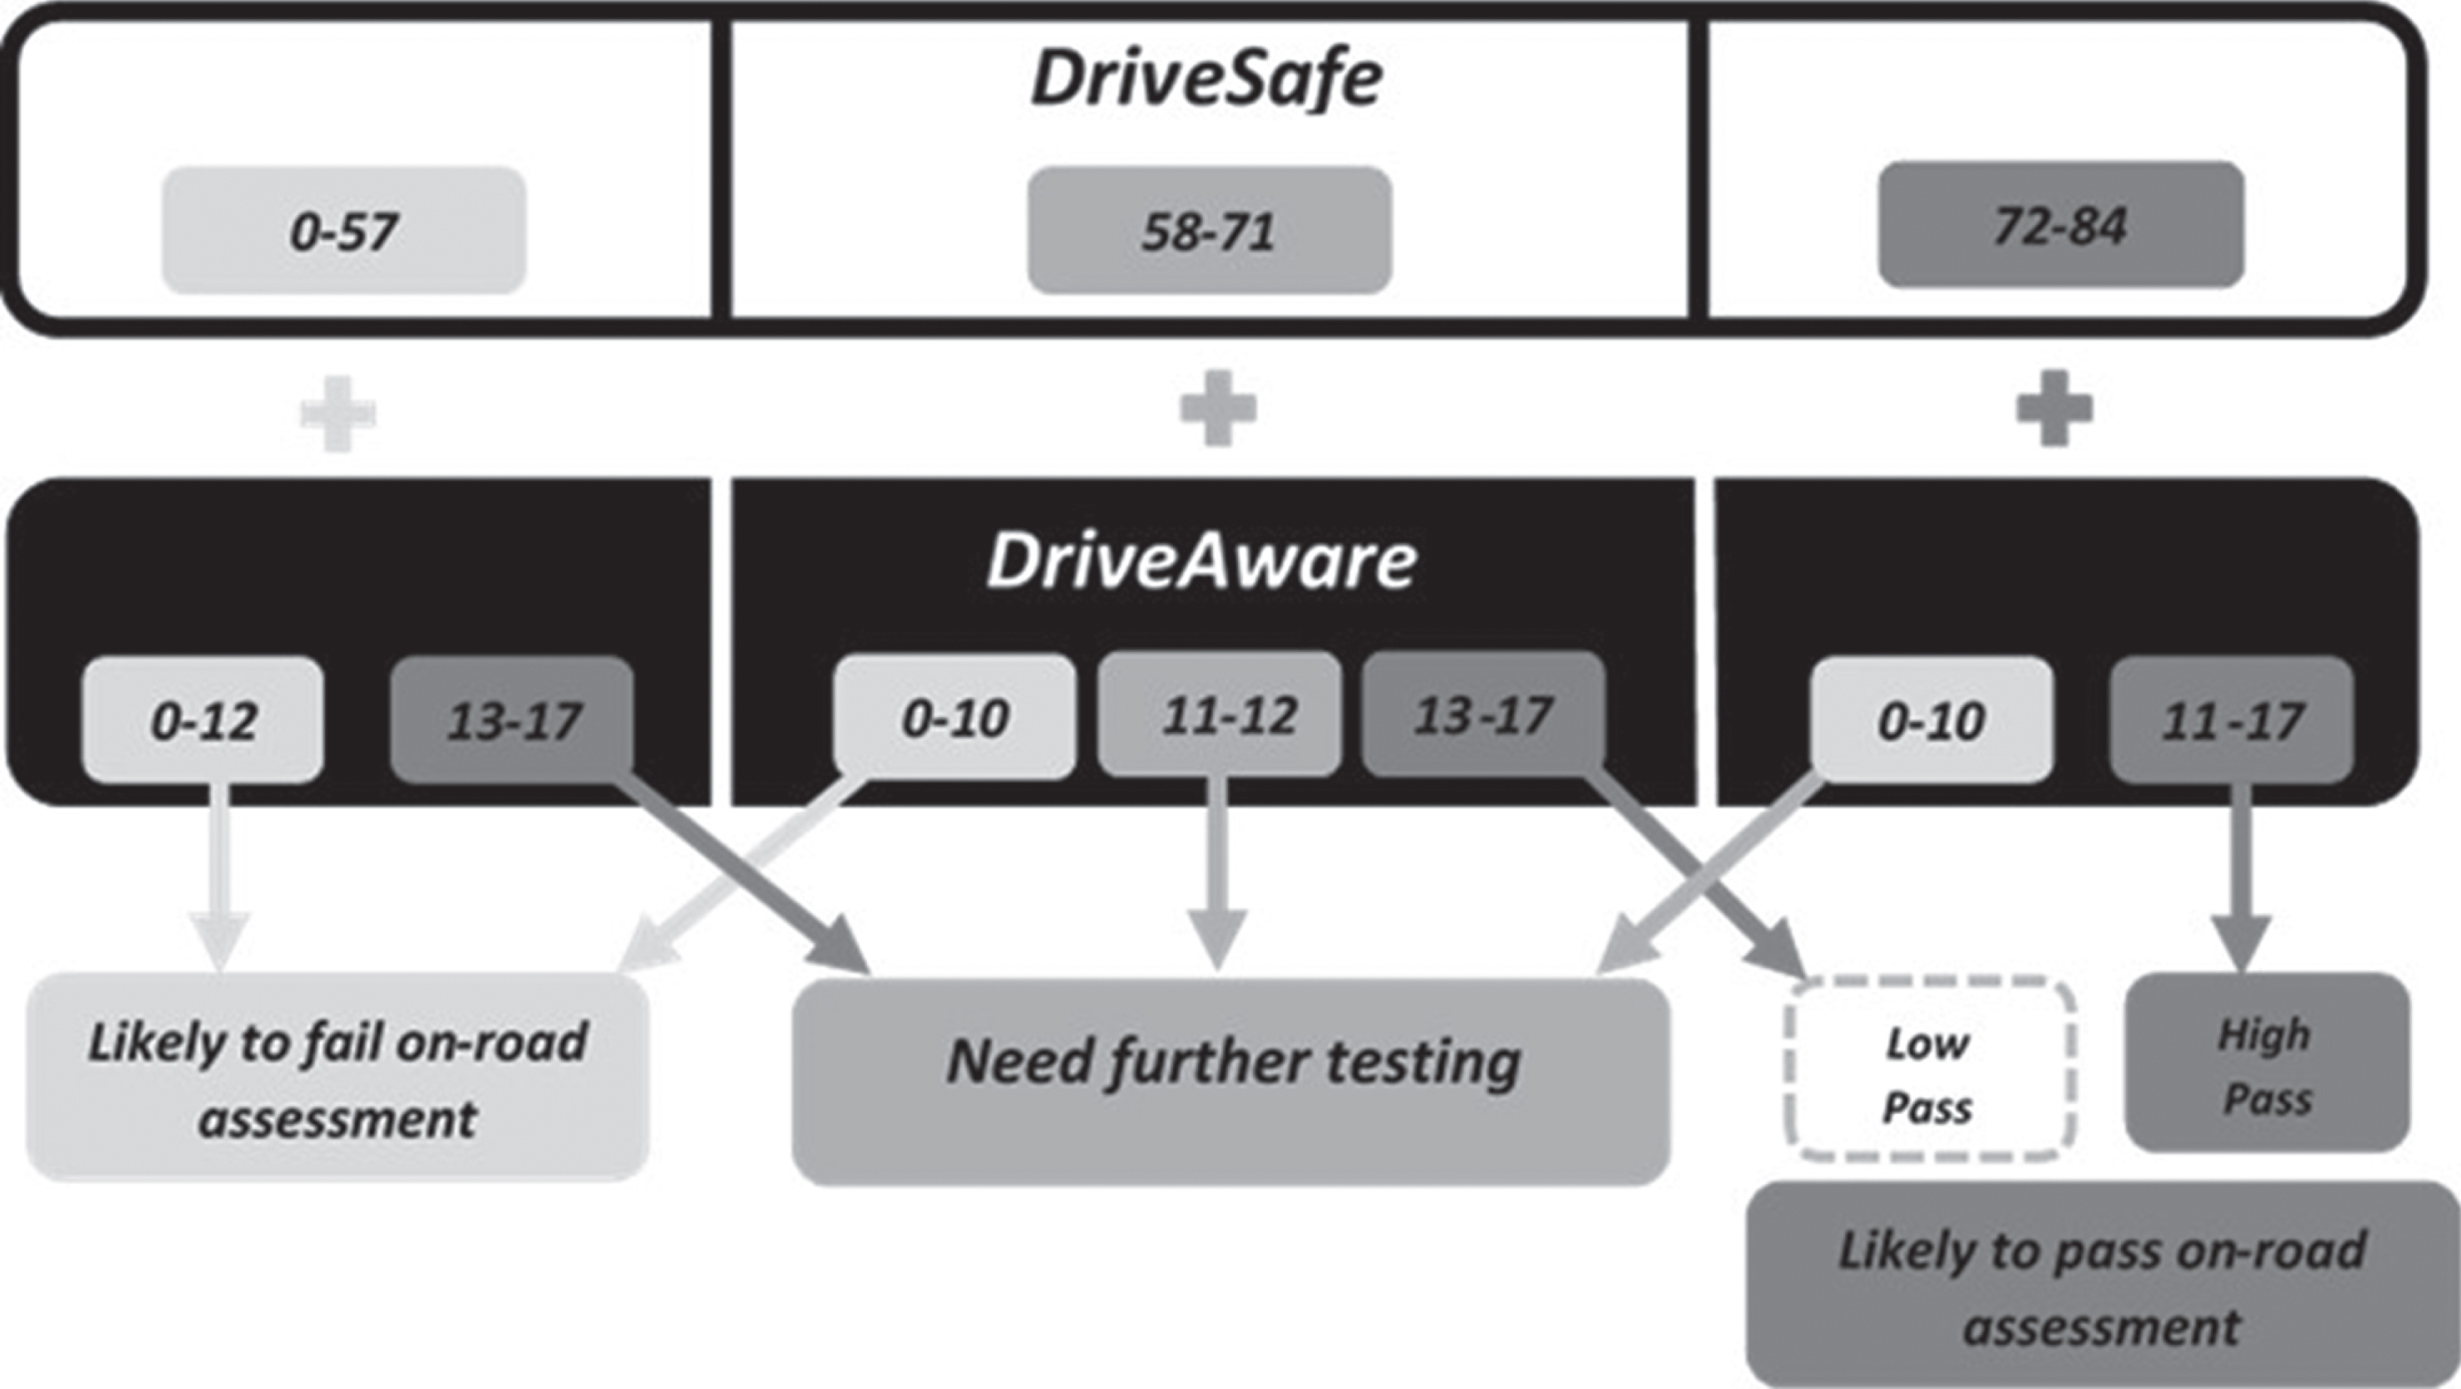
DSDA calculation method for predicting on-road performance (‘fail’, ‘need further testing’, ‘low pass’, ‘high pass’). Adapted from Pearson [27].
Neuropsychological assessments
Sustained and divided attention was assessed using the Trail Making Test (TMT) [28]. TMT part A requires participants to sustain attention as they draw a line connecting the encircled numbers one through 25, whilst TMT part B requires participants to switch attentional focus as they alternate between connecting encircled numbers and letters from one through 13 (e.g., 1, A, 2, B, ... 13).
Processing speed was measured using the written version of the Symbol Digit Modalities Test (SDMT) [29]. For this test, participants had 90 seconds to pair as many numbers with their associated symbols as possible.
Planning ability was evaluated using the Mazes subtest (form one) of the Neuropsychological Assessment Battery [30]. The Mazes test requires participants to draw a line from start to finish across seven progressively challenging mazes. Scores are associated with time intervals (e.g., completion within four to 30 seconds = one-point score, and within one to three seconds = two-point score) that increase in line with maze difficulty.
Visuoperception was measured using the Line Orientation subtest from the Repeatable Battery for the Assessment of Neuropsychological Status [31] and the Rey Complex Figure Test (RCFT) [32]. For the Line Orientation subtest, participants were required to match two lines forming an angle with their matching counterparts displayed in an array of numbered lines of different orientations. Points were awarded for accurately identifying which two numbers in the array were associated with the two lines. For the RCFT [32] participants were presented with a complex geometric figure and awarded points for accurately copying the design onto a blank page.
Procedure
We recruited participants between October 2016 and December 2017 at two different sites in Melbourne, Australia: Calvary Health Care Bethlehem (CHCB) and Monash University, Clayton. Participants were recruited through advertisements at CHCB and an internal HD research participant database at Monash University. Our test protocol employed only standardised tests, which were administered and scored in accordance with standardisation procedures. The assessments were conducted by two clinical neuropsychologists and a senior HD nurse (UHDRS motor assessment only), as well as two psychology trainees who received extensive training, supervision and ongoing support in the use of standardised cognitive testing. Ethics approval was obtained from CHCB and Monash University Human Research Ethics Committees.
Statistical analyses
All data were entered and analysed using SPSS Version 22 [33]. All statistical assumptions were met unless otherwise stated. Pearson’s correlation analyses were used to evaluate the association between DSDA performance and measures of disease progression and neuropsychological test performance. Due to violations of normality, we used Spearman’s correlation for all correlation analyses involving the TMT B and SDMT [34]. Bonferroni adjusted p-values of 0.017 (0.05/3) for disease progression correlations and 0.008 (0.05/6) for neuropsychological test correlations were used to control for the inflated type-one error rate of multiple comparisons.
Independent measures t-tests were used to compare the pass and non-pass groups (i.e., ‘pass’ group versus ‘fail’/’need further testing’ group on DSDA) on measures of disease progression and neuropsychological functioning. Additionally, to examine potential intragroup differences among participants assigned to the ‘pass’ category on DSDA, we split the ‘pass’ category into ‘high pass’ and ‘low pass’ groups based on the combination of DriveSafe and DriveAware scores (as per Fig. 2). We employed independent measures t-tests to compare ‘high pass’ and ‘low pass’ groups on measures of disease progression and neuropsychological functioning. We also compared rates of neuropsychological impairment between the ‘high pass’ and ‘low pass’ groups (impairment defined as a score falling 1.33 standard deviations below the normative mean).
RESULTS
Clinical and neuropsychological characteristics of the HD sample
As expected, symptomatic participants showed greater signs of HD severity and were more likely to be cognitively impaired than pre-symptomatic participants. At the time of evaluation, 81 percent of the total HD sample were continuing to drive. All participants who reported driving cessation were symptomatic and had stopped driving between one and 18 months (M = eight months) prior to completing the study. As a group, symptomatic participants were also less likely than pre-symptomatic participants to drive daily and to have driven more than 15,000 km in the previous year.
Characterising performance on DriveSafe DriveAware
Of the 26 HD participants who completed DSDA, 18 were predicted to ‘pass’ (14 ‘high pass’, four ‘low pass’), five were predicted to ‘fail’, and three were assigned to the ‘need further testing’ category.
Associations between DriveSafe and DriveAware performances and disease progression
Significant associations were found between DriveSafe and UHDRS motor scores (r = –0.60, p = 0.001) and disease burden scores (r = –0.57, p = 0.004), suggesting that more severe motor symptoms and greater disease burden were associated with poorer DriveSafe performance. Only scores of functional impairment, measured by the TFC, were significantly associated with DriveAware scores (r = 0.49, p = 0.01).
Associations between DriveSafe and DriveAware performances and neuropsychological function
As shown in Table 2, DriveSafe significantly correlated with most measures of neuropsychological function. After correcting for multiple comparisons, poorer DriveSafe performance was related to decreased sustained and divided attention, processing speed and planning ability. In contrast, after correcting for multiple comparisons, DriveAware only correlated with sustained attention as measured by TMT A.
Associations between DSDA and neuropsychological function
*statistically significant after Bonferroni correction. aSpearman’s correlation analysis. Notes. TMT = Trail-Making Test; SDMT = Symbol Digit Modalities Test; RCFT = Rey Complex Figure Test. For correlational data analysis purposes TMT scores were reversed to be congruent with the other neuropsychological measures, e.g., higher scores = better performance.
Differences between participants who passed and did not pass DSDA testing
Comparatively, participants who did not pass DSDA had significantly greater levels of disease severity and poorer cognitive ability than those that did pass (see Table 3). Additionally, those predicted to ‘fail’/’need further testing’ by DSDA were more likely to score in the impaired range (<1.33 standard deviations below the standardised mean) on neuropsychological measures, although high rates of neuropsychological impairment were also recorded in participants predicted to ‘pass’ on-road testing by DSDA.
Disease progression and neuropsychological performance as a function of DSDA category: ‘no pass’ versus ‘pass’
*p < 0.05. Notes. ‘No pass’ = ‘fail’ and need further testing’ categories on DSDA. UHDRS = Unified Disease Rating Scale; TFC = Total Functional Capacity scale; TMT = Trail-Making Test; SDMT = Symbol Digit Modalities Test; RCFT = Rey Complex Figure Test.
Examining heterogeneity within participants predicted to ‘pass’ by DSDA
As shown in Table 4, analyses revealed clinically significant differences (d > 0.67) between ‘low pass’ and ‘high pass’ groups on several disease progression and neuropsychological variables. Participants in the ‘low pass’ group had significantly more motor symptoms (d = 2.05) and scored worse on the TMT A (d = 1.72), TMT B (d = 1.66) and Mazes test (d = 2.09) than participants in the ‘high pass’ group. As shown in Fig. 3, participants in the ‘low pass’ group were significantly more likely to fall within the impaired range on all neuropsychological measures, with the exception of the RCFT.
Disease progression and neuropsychological performance as a function of DSDA category: ‘low pass’ versus ‘high pass’
*p < 0.05. Note. UHDRS = Unified Disease Rating Scale; TFC = Total Functional Capacity scale; TMT = Trail-Making Test; SDMT = Symbol Digit Modalities Test; RCFT = Rey Complex Figure Test.
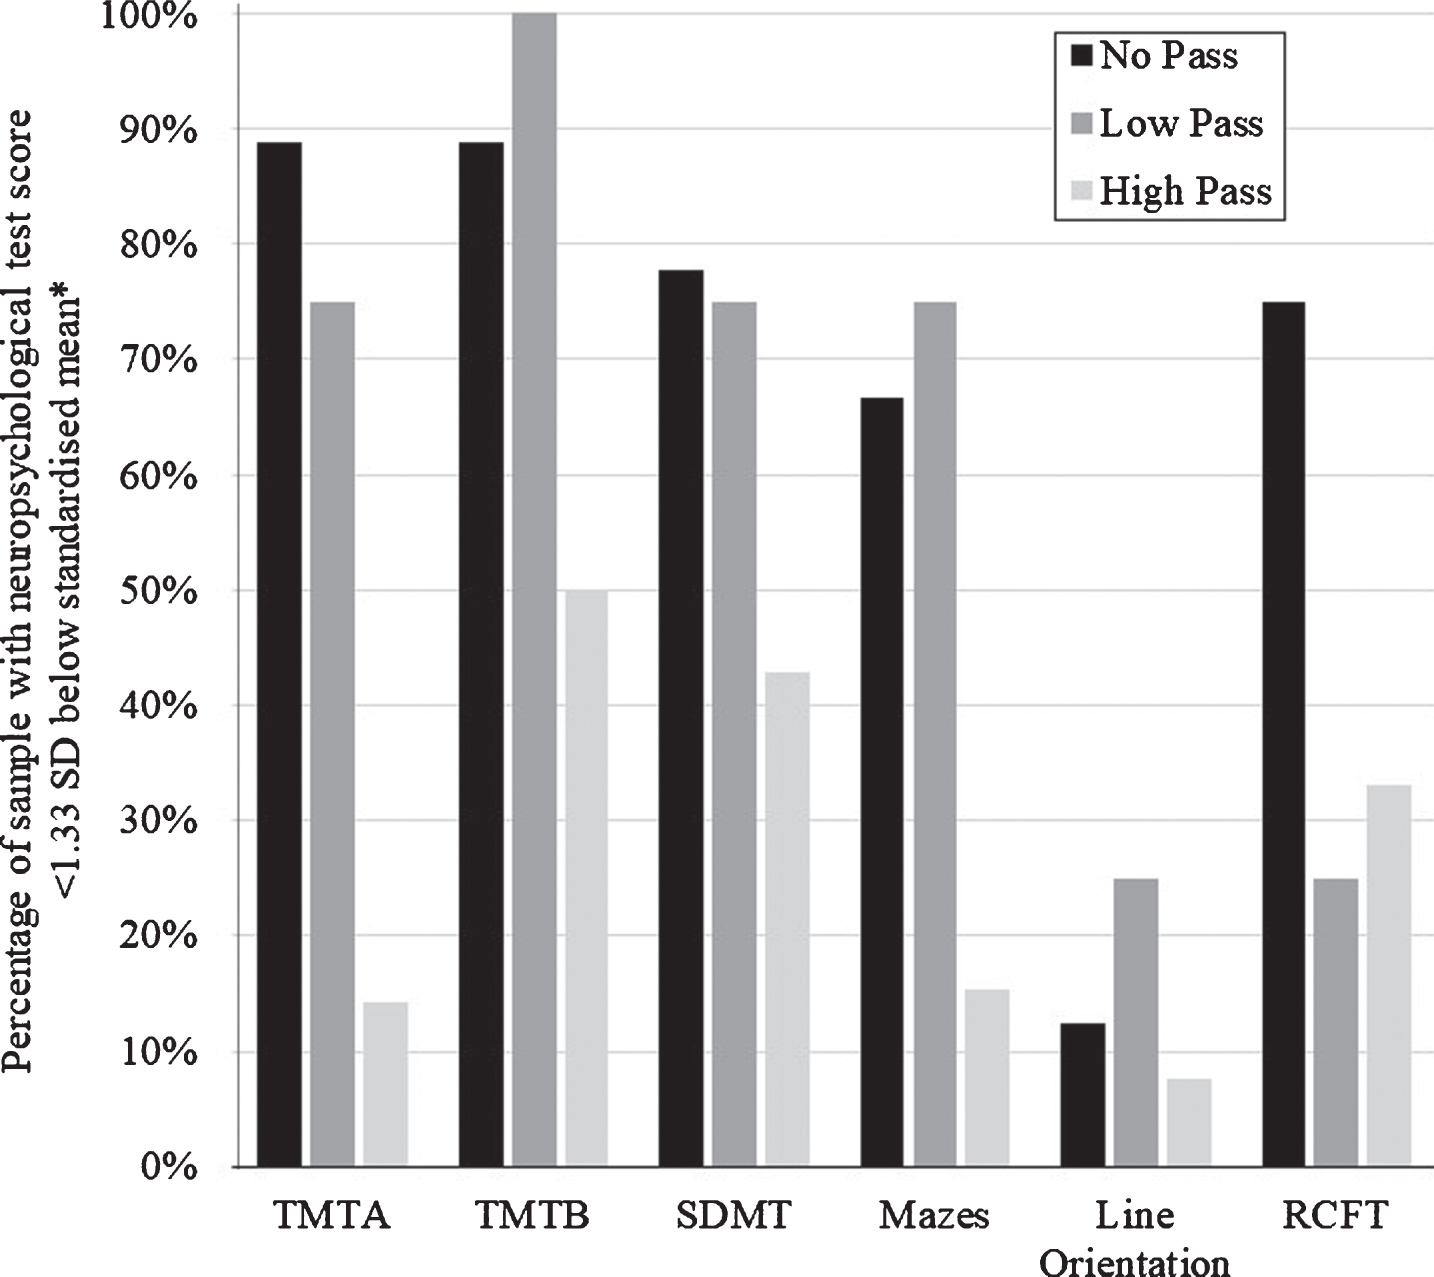
Neuropsychological impairment ratings as a function of DSDA category: ‘high pass’ versus ‘low pass’. Notes. ‘No pass’ = ‘fail’ and ‘need further testing’ categories on DSDA. *‘Impairment’ on each test defined with reference to the following published normative data: TMT A & TMT B: [35]; SDMT: [29]; Mazes: [30]; Line Orientation: [31]; RCFT: [32]. TMT = Trail-Making Test; SDMT = Symbol Digit Modalities Test; RCFT = Rey Complex Figure Test.
DISCUSSION
Overall, these preliminary pilot findings underscore the potential utility of DSDA as a screening tool to identify those people with HD who may require further on-road driving assessment. Specifically, evidence linking poorer DSDA performance to greater disease severity and reduced neuropsychological function suggests that DSDA may be sensitive to the clinical features of HD. In spite of these promising findings however, we identified significant differences on multiple clinical variables between ‘high pass’ and ‘low pass’ groups, which consequently suggests caution when interpreting and drawing implications for predicting on-road test performance, based on DSDA ‘pass’ outcomes.
In this pilot study of DSDA in HD, our findings offer some preliminary support to suggest that DSDA, in particular DriveSafe scores, may have potential utility for screening patients who may require referral for on-road driving assessment. We found that in line with significant clinical differences between participants who passed and did not pass DSDA testing, DriveSafe scores were significantly associated with measures of disease progression and neuropsychological function. Considering that these findings align with previous HD research associating motor and cognitive markers of driving impairment with on-road and driving simulator performance [4–6], our results suggest that the DriveSafe subtest of the DSDA program may be sensitive to many important disease variables affecting fitness to drive.
Unlike DriveSafe, the vast majority of disease progression indices and neuropsychological measures were not related to ‘driving insight’ as indexed by scores on DriveAware. This may be explained by the DriveAware score being determined by a small behavioural sample (i.e., a four-item questionnaire with only three response options per item) and the possible effects of range restriction on correlational analyses. Thus, the clinical utility of the DriveAware component of DSDA in the HD population requires further clarification. That said, for those participants assigned to the ‘high pass’, ‘need further testing’ and ‘fail’ categories, DSDA as a whole, appears reasonably sensitive to the presence or absence of neuropsychological impairment in domains that are both important for real-world driving performance and commonly affected by HD.
Despite providing some evidence to support the utility of DSDA in HD, our results suggest that use of DSDA with the HD population is limited by a lack of sensitivity to markers of driving impairment within the ‘pass’ category. Specifically, we found that compared to participants in the ‘high pass’ category, the ‘low pass’ group displayed significantly more motor symptoms and greater rates of neuropsychological impairment, both of which are suggestive of more advanced disease staging [3, 21]. Given that motor symptomatology and cognitive deficits are likely to substantially increase risk for on-road driving accidents [4–6], these findings suggest that at least for people with HD, scores within the ‘low pass’ range should be interpreted with caution and consideration given to further on-road assessment, given the frequency of cognitive impairment and other clinical indicators of driving impairment within this group.
Based on this pattern of findings, further research is needed to evaluate the accuracy of DSDA in predicting the outcomes of current gold-standard, on-road driving assessments in people with HD, particularly among those who score within the ‘low pass’ range. Specifically, in order to further support the utility of DSDA in HD, evidence is needed to show that scores within the ‘low pass’ range are in fact, predictive of a passing grade on gold standard, occupational therapy assessment of driving ability.
The current pilot study is not without its limitations. For instance, we acknowledge the small sample size of our study, but note that we did include a broad representation of people with HD, and we used statistical corrections for multiple analyses to help substantiate our findings.
In the first study to systematically evaluate the utility of DSDA in the HD population, we document robust associations between performance on DSDA, indices of HD progression and aspects of neuropsychological function commonly vulnerable to HD and considered critical for on-road driving. This study underscores the potential utility of DSDA in clinical decision-making, with the premise that further validation with an on-road driving assessment should lend adequate support to use of DSDA with the HD population.
CONFLICT OF INTEREST
The Authors have no conflict of interest to report.
Footnotes
ACKNOWLEDGMENTS
This research was supported by the School of Psychological Sciences and Institute of Cognitive and Clinical Neurosciences, Monash University, and Calvary Health Care Bethlehem.