




Abstract
Background:
Huntington’s disease (HD) is a neurodegenerative disorder characterized by synaptic dysfunction and loss of white matter volume especially in the striatum of the basal ganglia and to a lesser extent in the cerebral cortex. Studies investigating heterogeneity between synaptic and non-synaptic mitochondria have revealed a pronounced vulnerability of synaptic mitochondria, which may lead to synaptic dysfunction and loss.
Objective:
As mitochondrial dysfunction is a hallmark of HD pathogenesis, we investigated synaptic mitochondrial function from striatum and cortex of the transgenic R6/2 mouse model of HD.
Methods:
We assessed mitochondrial volume, ROS production, and antioxidant levels as well as mitochondrial respiration at different pathological stages.
Results:
Our results reveal that striatal synaptic mitochondria are more severely affected by HD pathology than those of the cortex. Striatal synaptosomes of R6/2 mice displayed a reduction in mitochondrial mass coinciding with increased ROS production and antioxidants levels indicating prolonged oxidative stress. Furthermore, synaptosomal oxygen consumption rates were significantly increased during depolarizing conditions, which was accompanied by a marked increase in mitochondrial proton leak of the striatal synaptosomes, indicating synaptic mitochondrial stress.
Conclusion:
Overall, our study provides new insight into the gradual changes of synaptic mitochondrial function in HD and suggests compensatory mitochondrial actions to maintain energy production in the HD brain, thereby supporting that mitochondrial dysfunction do indeed play a central role in early disease progression of HD.
INTRODUCTION
Huntington’s disease (HD) is an autosomal domi-nant neurodegenerative disorder that usually manifests around midlife [1, 2] with signs of cognitive decline, psychiatric disturbances, and impaired motor function [3, 4]. HD is caused by a mutation in the huntingtin gene [5], but neither the normal function of huntingtin nor the disease-causing mechanism of mutant huntingtin (mHtt) are completely understood. HD is therefore still a disease with a poorly comprehended pathogenesis and without a cure. The neuropathology of HD is characterized by extensive brain atrophy especially in the striatum of the basal ganglia and the cerebral cortex, with loss of white matter volume preceding clinical symptoms [6–9]. Interestingly, there is an inverse correlation between the degree of white matter atrophy and time of disease onset [10]. These findings have led to the “dying-back” hypothesis suggesting that neurite degeneration over time leads to the neuronal dysfunction and death seen in HD [11–13]. This hypothesis is supported by increasing evidence showing alterations and dysregulation in synaptic function and a selective accumulation of mHtt in striatal synapses, where it often is associated with the vesicular machinery and mitochondria [14–20]. In addition, a recent analysis of the cerebral proteome revealed dysregulation in pathways associated with synaptic function in R6/2 mice [21]. Furthermore, Sapp et al. has recently shown selective changes of the proteome of striatal synaptosomes in homozygous 140Q knock-in HD mice that were not seen in the corresponding whole-tissue samples [22]. These results support a specific synaptic effect of mHtt, that could serve as an underlying mechanism of the dying-back hypothesis.
In the neurites and synapses, the mitochondria play an essential role in delivering the energy required for neurotransmission. Mitochondrial dysfunction, including defects in energy metabolism, has long been implicated in HD pathogenesis [23, 24] with several studies showing a preferential striatal vulnerability to impairment in oxidative energy metabolism [25–29]. However, despite clear evidence of mitochondrial dysfunction in HD, it can be questioned whether it is the cause of neurodegeneration. In this context, it is relevant to investigate whether the impairment severity differs across different mitochondrial subpopulations. Studies investigating mitochondria from different subcellular localizations within the same cell have revealed the existence of mitochondrial subpopulations with a high functional and structural heterogeneity [30–32]. In neurons, the most pronounced mitochondrial heterogeneity is found between synaptic and non-synaptic mitochondria [33]. As an example, synaptic mitochondria are more affected by inhibition of the electron transport chain [34] and by oxidative damage [35–37] compared to non-synaptic mitochondria, and this differential sensitivity increases with age [38]. In HD, mitochondrial heterogeneity has received little attention, and most studies investigate the average mitochondrial function of whole cells from whole brain samples or cell cultures.
Given the importance of the mitochondria in synaptic development, function, and maintenance, and the selective vulnerability of synaptic mitochondria, we aimed to investigate if mHtt expression leads to dysfunction of synaptic mitochondria in situ that could affect energy production in the synapses. For this, we used the well-characterized transgenic R6/2 mouse model of HD, comparing synaptic mitochondrial function in R6/2 compared to wild type (WT) mice. As pathogenesis of HD may follow biphasic patterns, where pathogenic changes are apparent at specific stages of disease [19, 39], we studied the potential effects of mHtt at three different ages reflecting the prodromal phase, the time around onset of symptoms, and the late stages of disease, respectively. In light of the differential vulnerability of striatum and cerebral cortex in HD, and based on our previous studies showing marked differences in mitochondrial function in these regions [40], we assessed synaptic mitochondrial function in both regions. Since nerve terminals, with synaptic mitochondria, only make up a small fraction of a neuron and an even smaller part of a brain region, a selective effect of mHtt on synaptic mitochondria would be masked by any effect on the total mitochondrial mass. Consequently, we studied the mitochondria of an isolated synaptosomal fraction where the proportion of neuronal, synaptic mitochondria is expected to be highly enriched [22].
Our results show no changes in the prodromal phase. In the early phases of the disease, striatal synaptic mitochondria from R6/2 mice have the same volume as those of WT animals and maintain the capacity for increasing respiration when challenged, yet have increased levels of reactive oxygen species (ROS). In the late stages of disease, the striatal synaptic mitochondria showed reduced respiratory efficiency. The synaptic mitochondrial dysfunction was limited to the striatum, as no changes were observed in cortical synaptosomes, in neither the early, nor the late phases of the disease. These results demonstrate that mHtt affects synaptosomal mitochondria in striatum to a much higher degree than in cortex, thus supporting the notion that mitochondrial dysfunction does indeed play a central role in early disease progression of HD.
MATERIALS AND METHODS
Animals
R6/2 mice were obtained from The Jackson Laboratory (Stock No.: 002810, B6CBA-R6/2) and were maintained by backcrossing young R6/2 males with healthy CBAxC57BL-6 hybrid females at the Department of Experimental Medicine, University of Copenhagen. All mice used in the studies were genotyped using PCR; in selected animals, the exact CAG repeat length of the transgene was assessed. CAG repeat length of the mice gradually increased during the course of the experiments from 168 to 203 CAGs. Animals from the colony has been phenotyped previously [41]; in addition, all symptomatic animals used displayed a positive clasping test (specific to HD symptomatic transgenic animals) confirming the phenotype. As phenotypic differences between female and male R6/2 mice have been observed [41], all samples used for this study were from female R6/2 mice and wild type (WT) female littermates at three different ages: 5 weeks (pre-symptomatic), 8 weeks (early-symptomatic), and 11 weeks (late-symptomatic). The mice were kept at a 12-h light and 12-h dark cycle and had ad libitum access to water and standard chow. Experimental procedures were conducted in accordance with the Animal Experiments Inspectorate guidelines (permit no. 2012-15-2934-00039). All mice in this study were euthanized by cervical dislocation.
Preparation of synaptosomes
All synaptosomes were isolated from fresh whole brain, cortex or striatum using Syn-PER Synaptic Protein Extraction Reagent (Thermo Fisher Scientific, #87793) as previously described [42, 43]. All steps were carried out at 4°C. Tissue samples were weighed and homogenized in 10μl/mg tissue Syn-PER (mixed with EDTA-free protease inhibitor cocktail immediately before use) using 10 slow strokes in a Dounce Tissue Grinder and then centrifuged for 10 min at 1,200 × g at 4°C. Subsequently the supernatant was centrifuged again at 20 min at 15,000 × g at 4°C to obtain a soma fraction (the supernatant—a fraction containing a mixture of both nuclear and cytosolic proteins) and a synaptosome fraction (the pellet). Synaptosomes were re-suspended according to original tissue weight in 2μl Syn-PER for every mg tissue to obtain a concentration of approximately 3–4μg/μl of synaptic protein. Isolated synaptosomes were kept on ice at all times. Soma samples were stored at –20°C, and subsequently thawed at 4°C before use. Purity of the isolated fractions was examined by western blotting (Supplementary Figure 1). Synaptosome and soma fractions were collected in parallel from four mice per day, equally distributed between R6/2 and WT littermates.
Fluorescence microscopy of mitochondria
Synaptosomes were imaged using fluorescence microscopy after staining with Calcein blue-AM (Invitrogen, #C1429), MitoTracker® Green FM (Invitrogen, #M7514), and MitoTracker® Red CMXRos (Invitrogen, #M7512) using a modified protocol [44, 45]. Cover glasses (VWR, #631–1578) were prepared for microscopy by overnight incubation with 65% nitric acid (Sigma, #84378-1L) at 37°C and stored in 70% ethanol until use. One day prior to imaging, air-dried cover glasses were coated with polyethylenimine (PEI) (Sigma, #408727) diluted 1:15,000 by overnight incubation at 37°C followed by air-drying. Imaging was performed with freshly isolated synaptosomes diluted 1:5 in PBS and kept on ice during preparations. Synaptosomes were plated on PEI-coated cover glasses in triplicates and attached by centrifugation for 30 min at 1,500 × g at 4°C. Subsequently, synaptosomes were incubated with 1 mM Calcein blue-AM for 30 min at 37°C, followed by 40 min incubation at 37°C with 25 nM MitoTracker® Red CMXRos and finally 40 min incubation at 37°C with 25 nM MitoTracker® Green FM. After staining, synaptosomes were rinsed in PBS and placed upside down on an object glass. All stains and stained samples were protected from light throughout the process. Single plane images of 1,600×1,200 pixels were recorded with a pixel size of 2.275μm in resolution. Images were obtained with a Leica DmRXA fluorescence microscope using a Leica DFC340 FX camera with 16x magnification and Leica CW4000 cytoFISH software. n = 6 biological replicates per genotype and 3 technical replicates per sample; six images were captured at random in all samples (equally distributed between replicates) using 3 different filters—blue: 322/435 nm, green: 490/516 nm, and red: 579/599 nm (Excitation/Emission)—for observing the three different fluorescence signals with fixed image acquisition settings for all samples of equal brain region, fraction and age.
Quantification of mitochondrial mass and membrane potential were done using a modified protocol [44, 45]. Total mitochondrial mass, not influenced by mitochondrial membrane potential, was quantified using Image-J analyzing images from microscopy stained with MitoTracker® Green FM. Similarly, staining with MitoTracker® Red CMXRos was used as a reflection of mass of functional mitochondria, as uptake and accumulation of this dye in mitochondria correlates with mitochondrial membrane potential [46], and the intensity of MitoTracker® Red CMXRos labeling within synaptosomes therefore reflect the mitochondrial mass combined with mitochondrial membrane potential. Images of Calcein blue-AM stains were used to define the region of interest in each image. Images of Calcein blue-AM stains were auto corrected for brightness and contrast, before a threshold was placed with an end-value of 10% converting the image to a mask defining the region of interest containing synaptosomes in the particular image. Subsequently images of MitoTracker® Green FM, or MitoTracker® Red CMXRos, were analyzed giving the integrated density and the area within the region of interest. Correspondingly, a background mask was created with inverted threshold values, defining all regions, not included in the defined region of interest, as background. This background mask was then analyzed giving the mean background fluorescence. Results were calculated and presented as: corrected total fluorescence = Integrated Density –(Area of the region of interest×Mean fluorescence of background of the region of interest) with corrected total fluorescence of MitoTracker® Green FM representing total mitochondrial mass, or MitoTracker® Red CMXRos representing mass combined with membrane potential. All results were expressed as HD relative to WT analyzed in parallel.
Protein extraction and BCA assay
Protein for western blotting and BCA assay was extracted from freshly isolated or frozen synaptosomes using Cellytic™M cell lysis reagent (Sigma-Aldrich, #C2978) and protease inhibitor cocktail (cOmplete, Mini; Roche, #11836153001) in a 1:1:1 ratio to sample. Lysates were mixed and incubated on ice for 15 min. Samples were then centrifuged 20 min at 15,000 × g at 4°C and supernatants were collected and stored at –80°C. Protein concentrations were determined using the Micro BCATM Protein Assay Kit (ThermoFischer Scientific, #23235) in a Synergy HT Microplate Reader (Bio-Tek) according to manufacturer’s instruction. Standard serial dilutions ranging from 3.1–50μg/ml were used as standard curve and samples were diluted in PBS within this linear range. Absorbance was measured at 570 nm. Protein concentrations of samples used in each experiment were determined simultaneously.
Western blotting
Protein concentrations were estimated using a Nanodrop ND-1000 (Saven Werner AB) and a specific amount of protein (between 15–20μg proteins depending on the analysis in question) was mixed with LDS Sample Buffer (Invitrogen, #NP0008) and Reducing Agent (Invitrogen, #NP0004), before incubation at 70°C for 10 min. Proteins were separated on a 10% bis–tris gel (Invitrogen, #NP0315BOX) and transferred to a nitrocellulose membrane (Invitrogen, #LC2001) followed by blocking in BSA or milk dissolved in TBS buffer with 0.05% Tween-20 (TBST). The blots were probed overnight at 4°C with primary antibody according to target (supplementary Table 1) and 1 h at room temperature with 1:2,000 secondary antibody (anti-rabbit HRP, DAKO, #P0448 or anti-mouse HRP, DAKO, #P0447). Bound secondary antibodies were detected by chemiluminescence using ECL reagents (Amersham biosciences, #RPN2209) and visualized in a Syngene G:BOX Chemi XL 1.4 (Syngene) with the GeneSys v.1.4.0.0 software. Bands were quantified using GeneTools software (v4.03, Syngene), and normalized to actin serving as an internal loading control.
Citrate synthase activity assay
Freshly isolated synaptosomes were prepared for analysis by homogenization on ice in 4x volume of 50 mM glycyl-glycin buffer (300 mM KCl, 10 mM MgSO4, 10 mM EDTA, 0.04% BSA, 0.2% Triton-X-100), before centrifugation at 20,000×g at 4°C for 2 min. The resulting supernatant was transferred into two new tubes and stored at –80°C until use. Prior to analysis, protein concentrations were determined in a BCA assay and samples were diluted in Tris-buffer to a protein concentration of ∼0.2–0.4μg/μl. Pure citrate synthase (from porcine heart, Sigma, #C3260) was mixed with 100 mM Tris-buffer (pH = 8) to generate a two-fold standard serial dilution. All samples were loaded in duplicates onto a 96-well microtiter plate (Nunc) and reaction mixture (Tris-buffer, 1 mM DTNB and 0.5 mM acetyl-CoA) was added, before incubation at 30°C for 1 min followed by measurement of background absorbance at 412 nm every 10 s for 3 min. Subsequently, oxaloacetate was added to each well using a multichannel pipette and absorbance was measured at 412 nm every 5 s for 5 min. Results from each sample were background corrected using the measurements before addition of oxaloacetate and the concentration of active citrate synthase (CS) determined using the generated standard curve. All results were normalized to the total amount of protein in each sample and expressed as a ratio of WT run on same plate.
ATP bioluminescence
ATP levels in synaptosomes were assessed using ATP Determination Kit (Invitrogen, #A22066) with a Synergy HT Microplate Reader (Bio-Tek) according to the manufacturer’s protocol. Pure ATP provided in the kit was used to create an ATP standard dilution series (ranging from 0.1–10μM) and pure PBS and “Non-viable” synaptosomes (heated to 100°C for 10 min) were included as negative controls. All analyses were performed on freshly isolated synaptosomes loaded in duplicate onto a white 96-well microtiter plate (Costar). ATP working solution (containing kit-provided D-luciferase, Firefly luciferase, DTT and Reaction Buffer) was automatically dispensed into the wells and incubated at 28°C for 30 s. During incubation, luminescence (RLU) was measured every 5 ms reaching a peak within the first 10 s. An average of the RLU values obtained after 2 to 7 s was used for analysis. Results from each sample were background corrected with measurements of the included negative controls and the corresponding ATP concentration was determined using the generated standard curve. All results were normalized to the total amount of protein in the sample (determined in a BCA assay) and expressed as a ratio of WT run on same plate.
Resazurin assay
Metabolic activity and mitochondrial redox activity in synaptosomes was assessed using resazurin (Sigma-Aldrich, #199303) and used as a viability assessment. Isolated synaptosomes were kept on ice and diluted 1:5 in PBS before analysis. The assay was carried out in a Synergy HT microplate reader (Bio-Tek) dispensing resazurin (10μg/ml stock) to a final volume of 10% and incubating samples at 37°C for 70 min with continual fluorescence measurement every 5 min with 530 nm excitation and 592 nm emission filters. Viability assessment with or without 50μM veratridine was performed in parallel with the same conditions. After 6 min of measurement, veratridine was injected in selected wells (final conc. 5μM). All samples were run in duplicate on the same plate. Non-viable synaptosomes (heated to 100°C for 10 min) and a sample of pure PBS were included in the assay as negative controls. Results were background corrected with measurements of the included negative controls and normalized to the total amount of protein in each sample (determined in a BCA assay).
ROS measurement
Levels of ROS in synaptosomes were assessed using Dihydrorhodamine 123 (DHR123) (Invitrogen, #D23806). Isolated synaptosomes were diluted 1:5 in PBS before analysis. The assay was carried out in a Synergy HT microplate reader (Bio-Tek) dispensing DHR123 to a final concentration of 10μM and incubating samples at 37°C and fluorescence measurements were made at 485 nm excitation and 538 nm emission filters after 30 min. All samples were run in duplicate on the same plate and results were normalized to protein concentration determined using a BCA assay as described above. Non-viable synaptosomes (heated to 100°C for 10 min) and pure PBS were included in the assay as negative controls. Results were expressed as a ratio of WT run on same plate.
Seahorse XFe96 analysis
Seahorse plates were coated overnight with poly-ethylenimine in a 1:15,000 dilution of a 50% solution (Sigma Aldrich, #P3143). Fresh striatal and cortical synaptosomes from one R6/2 and one age-matched WT littermate were isolated in parallel and analyzed simultaneously in the same experiment with a protocol adapted from [47]. Before analysis, protein concentration was determined using Bradford protein assay (Sigma Aldrich, #B6916) and synaptosomes were then diluted in salt solution (1.3 mM CaCl2, 120 mM NaCl, 3.4 mM KCl, 0.4 mM KH2PO4, 1.2 mM NaSO4, 2 mM MgSO4, pH 7.4) and loaded on the polyethylenimine-coated XFe 96-well plate with 8μg protein/well. Plates were centrifuged at 3,400×g for 20 min at 4°C for attachment of synaptosomes to the plate bottom. All substrates used during analysis were made fresh at the day of the experiment and diluted in salt solution. Mitochondrial respiration of synaptosomes was measured using a Seahorse Bioscience XFe96 Analyzer (Seahorse Bioscience, Copenhagen, Denmark). The synaptosomes were provided three different substrate conditions: 2.5 mM glucose, 5 mM pyruvate, and 2.5 mM glucose + 5 mM pyruvate. 7 technical replicates were performed from each condition and replicates in which no oxygen consumption was measured, or where no reaction to the added components was observed, were excluded from analysis, leaving in all cases a minimum of 4 technical replicates for each condition. Four different metabolic modulators were sequentially injected (5μM veratridine, 12μM oligomycin A, 4μM FCCP, and 2μM rotenone + 2μM antimycin A) as illustrated in Fig. 4A. The oxygen consumption rate (OCR) was calculated using the Wave Software (Seahorse Bioscience) with blank measurements subtracted as background reference on each plate. OCR results are expressed as pmol O2/min/μg of protein. Respiration parameters were calculated as described in [48], also shown in Fig. 4A. For each sample, non-mitochondrial OCR (OCR after addition of rotenone & antimycin A, average of three measurements) was subtracted from all other measured values to reveal the mitochondrial OCR. The extracellular acidification rate (ECAR), being a measure of glycolytic activity, was also measured alongside the OCR. ECAR results are expressed as mpH/min/μg of protein. Measurements and calculated values from R6/2 mice are presented as percentage of WT when indicated.
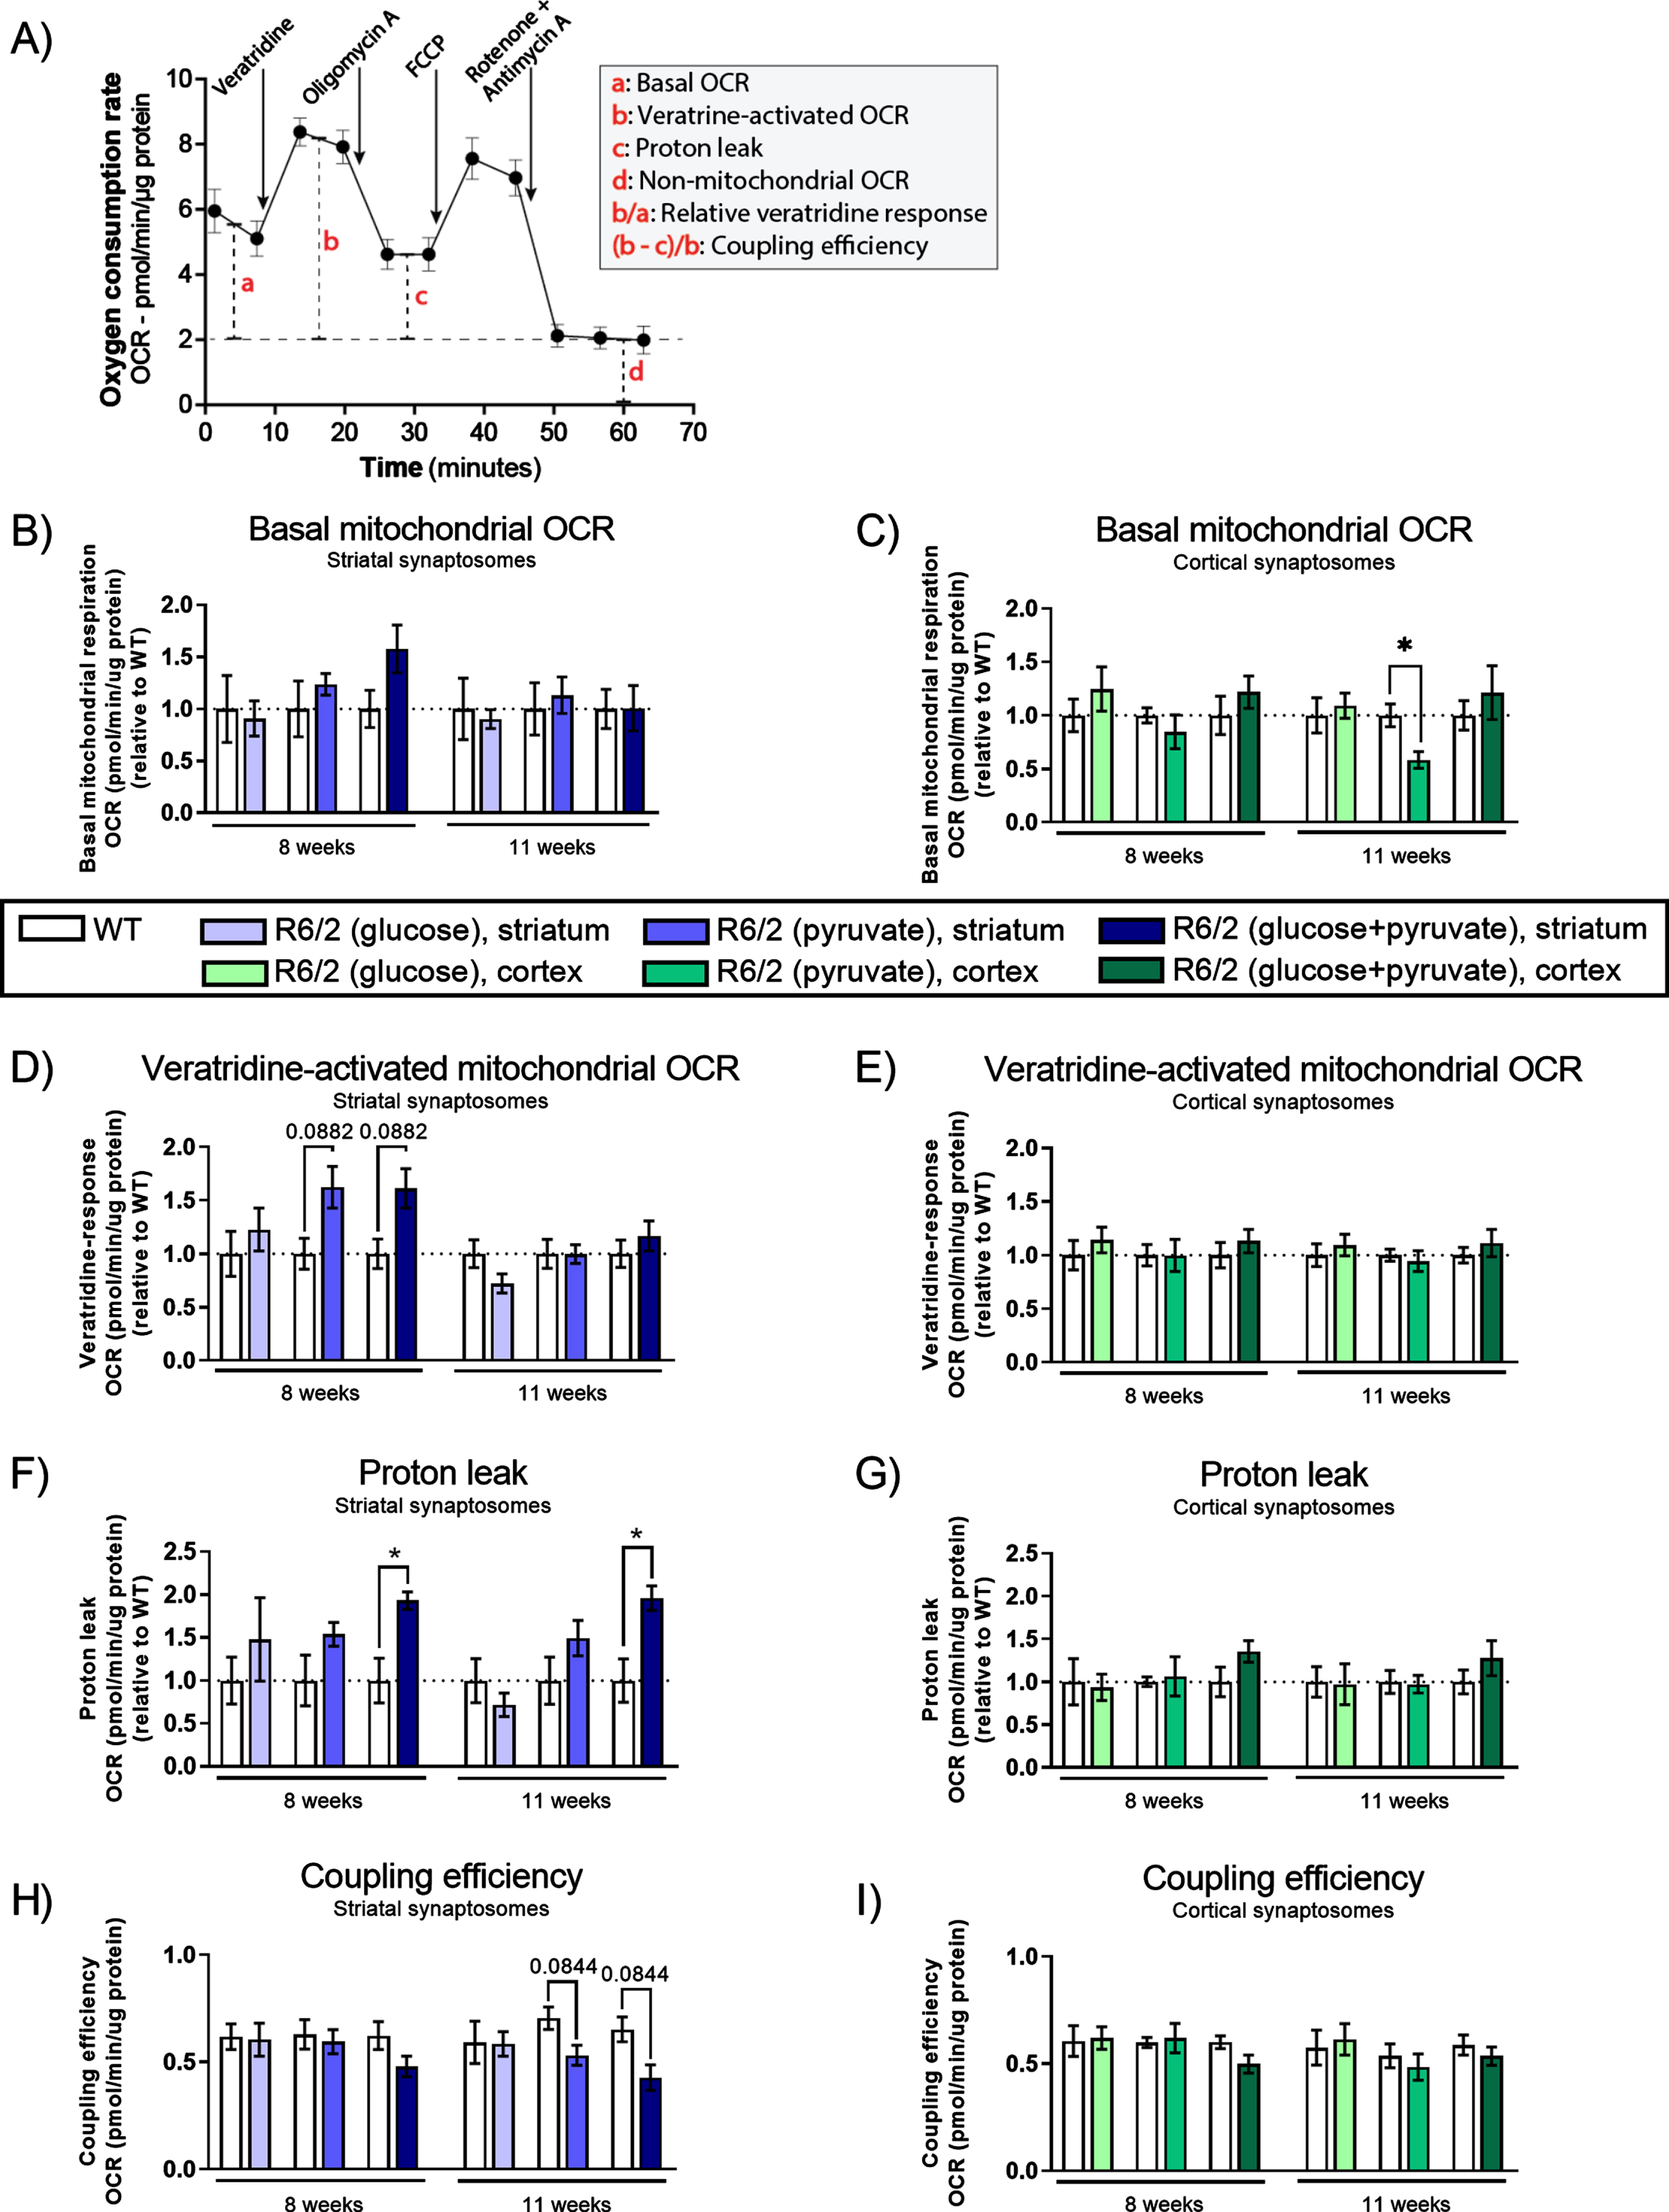
Oxygen consumption rates (OCR) in un-stimulated and stimulated synaptosomes from R6/2 mice. A) Schematic representation of Seahorse analysis and calculated respiration parameters. Graph illustrates the OCR measurements obtained from each sample. Compound injections are indicated above the curve with arrows. Red letters indicate how mitochondrial function can be interpreted, see furthermore [48]. B-I) OCR of striatal (blue shades) and cortical (green shades) synaptosomes isolated from WT and R6/2 mice at two different stages of disease and in the presences of 2.5 mM glucose (light shades), 5 mM pyruvate (medium shades) and 5 mM pyruvate supplemented with 2.5 mM glucose (dark shades). Bar plot (Mean±SEM of biological replicates, n = 6) representing basal mitochondrial OCR in resting (un-stimulated) striatal (B) and cortical (C) synaptosomes. Bar plot (Mean±SEM of biological replicates, n = 6–8) showing veratridine-activated (stimulated) mitochondrial OCR in striatal (D) and cortical (E) synaptosomes; and proton leak of the mitochondria in striatal (F) and cortical (G) synaptosomes. Respiratory parameter was calculated as shown in (A); bar plot (Mean±SEM of biological replicates, n = 6–8) showing coupling efficiency of the mitochondria in striatal (H) and cortical (I) synaptosomes. All results, except coupling efficiency, are presented relative to WT and significant differences between WT and R6/2 were determined using unpaired Student’s t-test, applying a two-stage linear step-up procedure of Benjamini, Krieger and Yekutieli (Q: 5%) as correction for multiple testing. To illustrate tendencies, the calculated q-values are shown (*q < 0.05).
Statistical analysis
Numbers of animals (n) are stated in the relevant figure legends and represent true biological replicates. All data presented are depicted as mean±standard error of the mean (SEM). p and q values from all statistical analyses were determined using Prism 6.0 software (GraphPad). We compared WT and R6/2 of the same age, same brain region, and same Seahorse substrate, using unpaired Student-t tests, applying a two-stage linear step-up procedure of Benjamini, Krieger, and Yekutieli (Q: 5%) as correction for multiple testing across the time points and the three Seahorse substrates. The calculated adjusted p values, denoted q values, are listed. Paired Student’s t-tests were used in Supplementary Tables 2 and 4, with no correction for multiple testing as these data were used to illustrate the overall purity of the synaptosomal fractions, and the general stimulatory effect of veratridine, respectively. In Supplementary Figure 3, the effect of veratridine was determined by testing differences in area under the ROC (receiver operator characteristic) curve comparing the metabolic activity of striatal and cortical synaptosomes with and without veratridine addition, using a two-way ANOVA with Holm-Sidak correction and no matching applied. p or q values < 0.05 were considered to denote statistically significant findings.
RESULTS
Mutant huntingtin differentially affects synaptic mitochondria and non-synaptic mitochondria
mHtt has previously been shown to affect mitochondrial function, including the relative levels of key mitochondrial proteins representing different mitochondrial functions [2, 49]. To assess whether mHtt expression affects synaptic and non-synaptic mitochondria differently, we fractionated the brains from the R6/2 mouse and WT littermates in two fractions: synaptosomes (highly enriched in nerve terminals) and soma (mix of neuronal soma and glia cells). Enrichment of each fraction were verified by quantification of protein expression of a synaptic (synaptophysin) and a nuclear marker (histone deacetylase 2 (HDAC2)) (Supplementary Figure 1A and Supplementary Table 2). Synaptophysin was highly enriched in synaptosome fractions and almost absent in the corresponding soma fractions, whereas HDAC2 was highly enriched in the soma fractions while almost absent in the corresponding synaptosome fractions, confirming high enrichment in the two fractions with limited contamination.
We investigated if protein levels of several key mitochondrial proteins were different between the synaptosome and soma fractions from WT and R6/2 mice (Supplementary Figure 2). We saw a tendency that the protein level of TOMM20 was decreased in R6/2 mice compared to WT in soma fractions from 8-week-old mice (adjusted p value q = 0.0507), an effect that was not observed in the synaptosome fractions. In addition, we found significantly decreased protein levels of VDAC in R6/2 mice compared to WT in the synaptosome fractions at 8 weeks of age (q = 0.0124) with no change in the soma fraction. Collectively, these findings demonstrate that the total brain mitochondrial protein composition is affected in the R6/2 mouse model, but that the direction and timing during pathogenesis of these effects differ between synaptic and non-synaptic mitochondria, supporting the notion that mHtt could have a specific effect on the synaptic mitochondria.
Mutant huntingtin induces a progressive decline in total mitochondrial mass, but no change in membrane potential-sensitive mitochondrial mass, in striatal synaptosomes
Next, we isolated the striatum and cerebral cortex before isolation of synaptosomes (assessment of enrichment in Supplementary Figure 1B and Supplementary Table 2) and evaluated the mitochondrial mass in synaptosomes of R6/2 and WT mice using MitoTracker® Green FM (Fig. 1). Our results showed a significant decrease in the total mitochondrial mass of striatal synaptosomes from R6/2 compared to WT at the late stage of disease (q = 0.01512) (Fig. 1D), with no changes found in the cortical synaptosomes (Fig. 1E). Using another dye, MitoTracker® Red CMXRos, functional mitochondrial mass (defined as the mass of mitochondria in the isolated synaptosomes, which maintains a membrane potential) was assessed (Fig. 1C). This quantification was performed in parallel with the quantification of total mitochondrial mass in the same synaptosomes, and assisted by calcein blue-AM staining, ensuring that only functional mitochondria located in situ inside membrane-enclosed synaptosomes were included in the quantification. The results show no changes in mass of functional synaptic mitochondria from neither striatal nor cortical synaptosomes (Fig. 1F, G, respectively). Additionally, we measured the activity of citrate synthase (CS) as a general marker of mitochondrial function, and evaluated changes in the pool of ATP available, in resting (un-stimulated) striatal and cortical synaptosomes from R6/2 and WT (Fig. 2). In correspondence with the maintained mass of functional mitochondria (Fig. 1F, G), we did not see any differences in these markers of mitochondrial function in neither the striatal nor the cortical un-stimulated synaptosomes compared to WT throughout the course of disease.
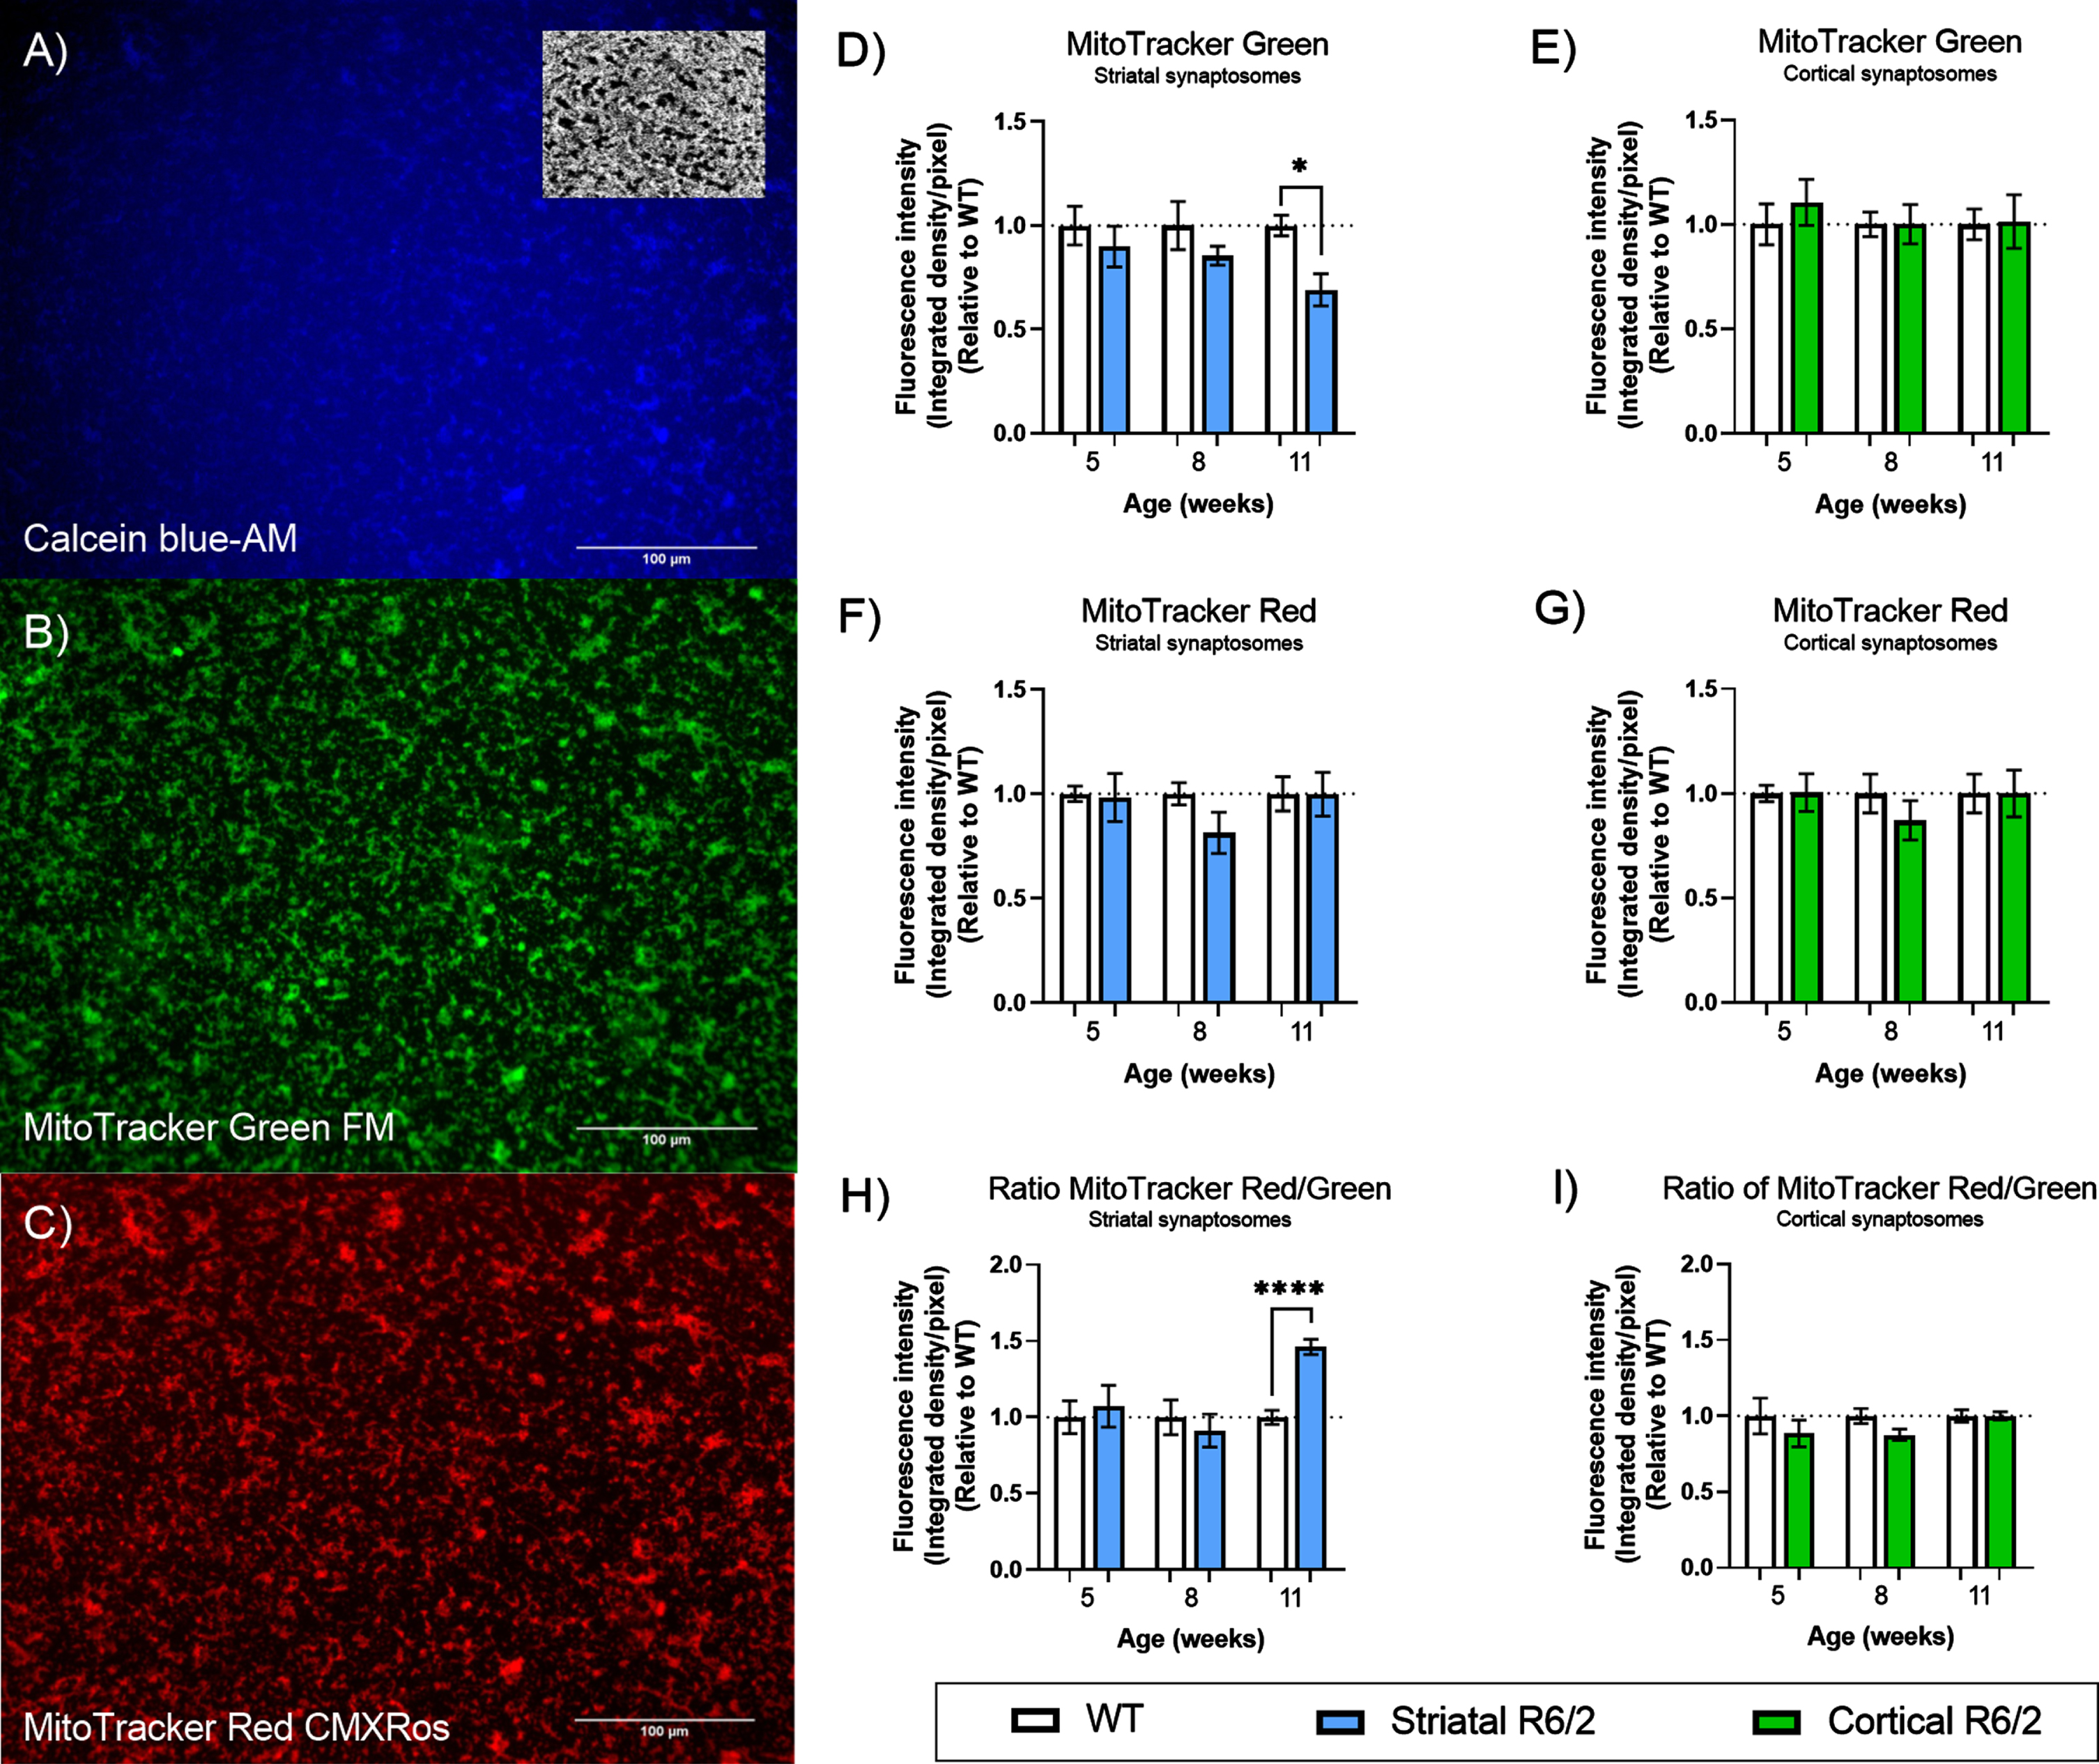
Assessment of mitochondrial mass in R6/2 brain synaptosomes. A–C). Representative microscope images of isolated synaptosomes (scale bar 100μm in all three panels). A) Membrane-enclosed synaptosomes were stained by Calcein blue-AM in order to define region of interest (ROI). Insert shows an example of a mask generated by auto-thresholding of a Calcein blue image. B) Mitochondria were stained with MitoTracker green FM and used to quantify total mitochondrial mass (stained independent of mitochondrial membrane potential). C) Mitochondria stained with MitoTracker Red CMXRos were used to quantify the mass of active mitochondria (stained as a function of membrane potential). D–G) Quantification of synaptosomes isolated from WT (clear bars) and R6/2 (colored bars) mice at three different stages of disease. Bar plot (Mean±SEM of biological replicates, n = 6 in all analyses) representing MitoTracker green FM staining in striatal (D) and cortical (E) synaptosomes; MitoTracker Red CMXRos staining in striatal (F) and cortical (G) synaptosomes. MitoTracker Red CMXRos staining as a ratio of MitoTracker green FM staining in striatal (H) and cortical (I) synaptosomes. All results are presented relative to WT within each week and significant differences between WT and R6/2 were determined using unpaired Student’s t-test, applying a two-stage linear step-up procedure of Benjamini, Krieger and Yekutieli (Q: 5%) as correction for multiple testing. To illustrate tendencies, the calculated q-values are shown (*q < 0.05 and ****q < 0.0001).
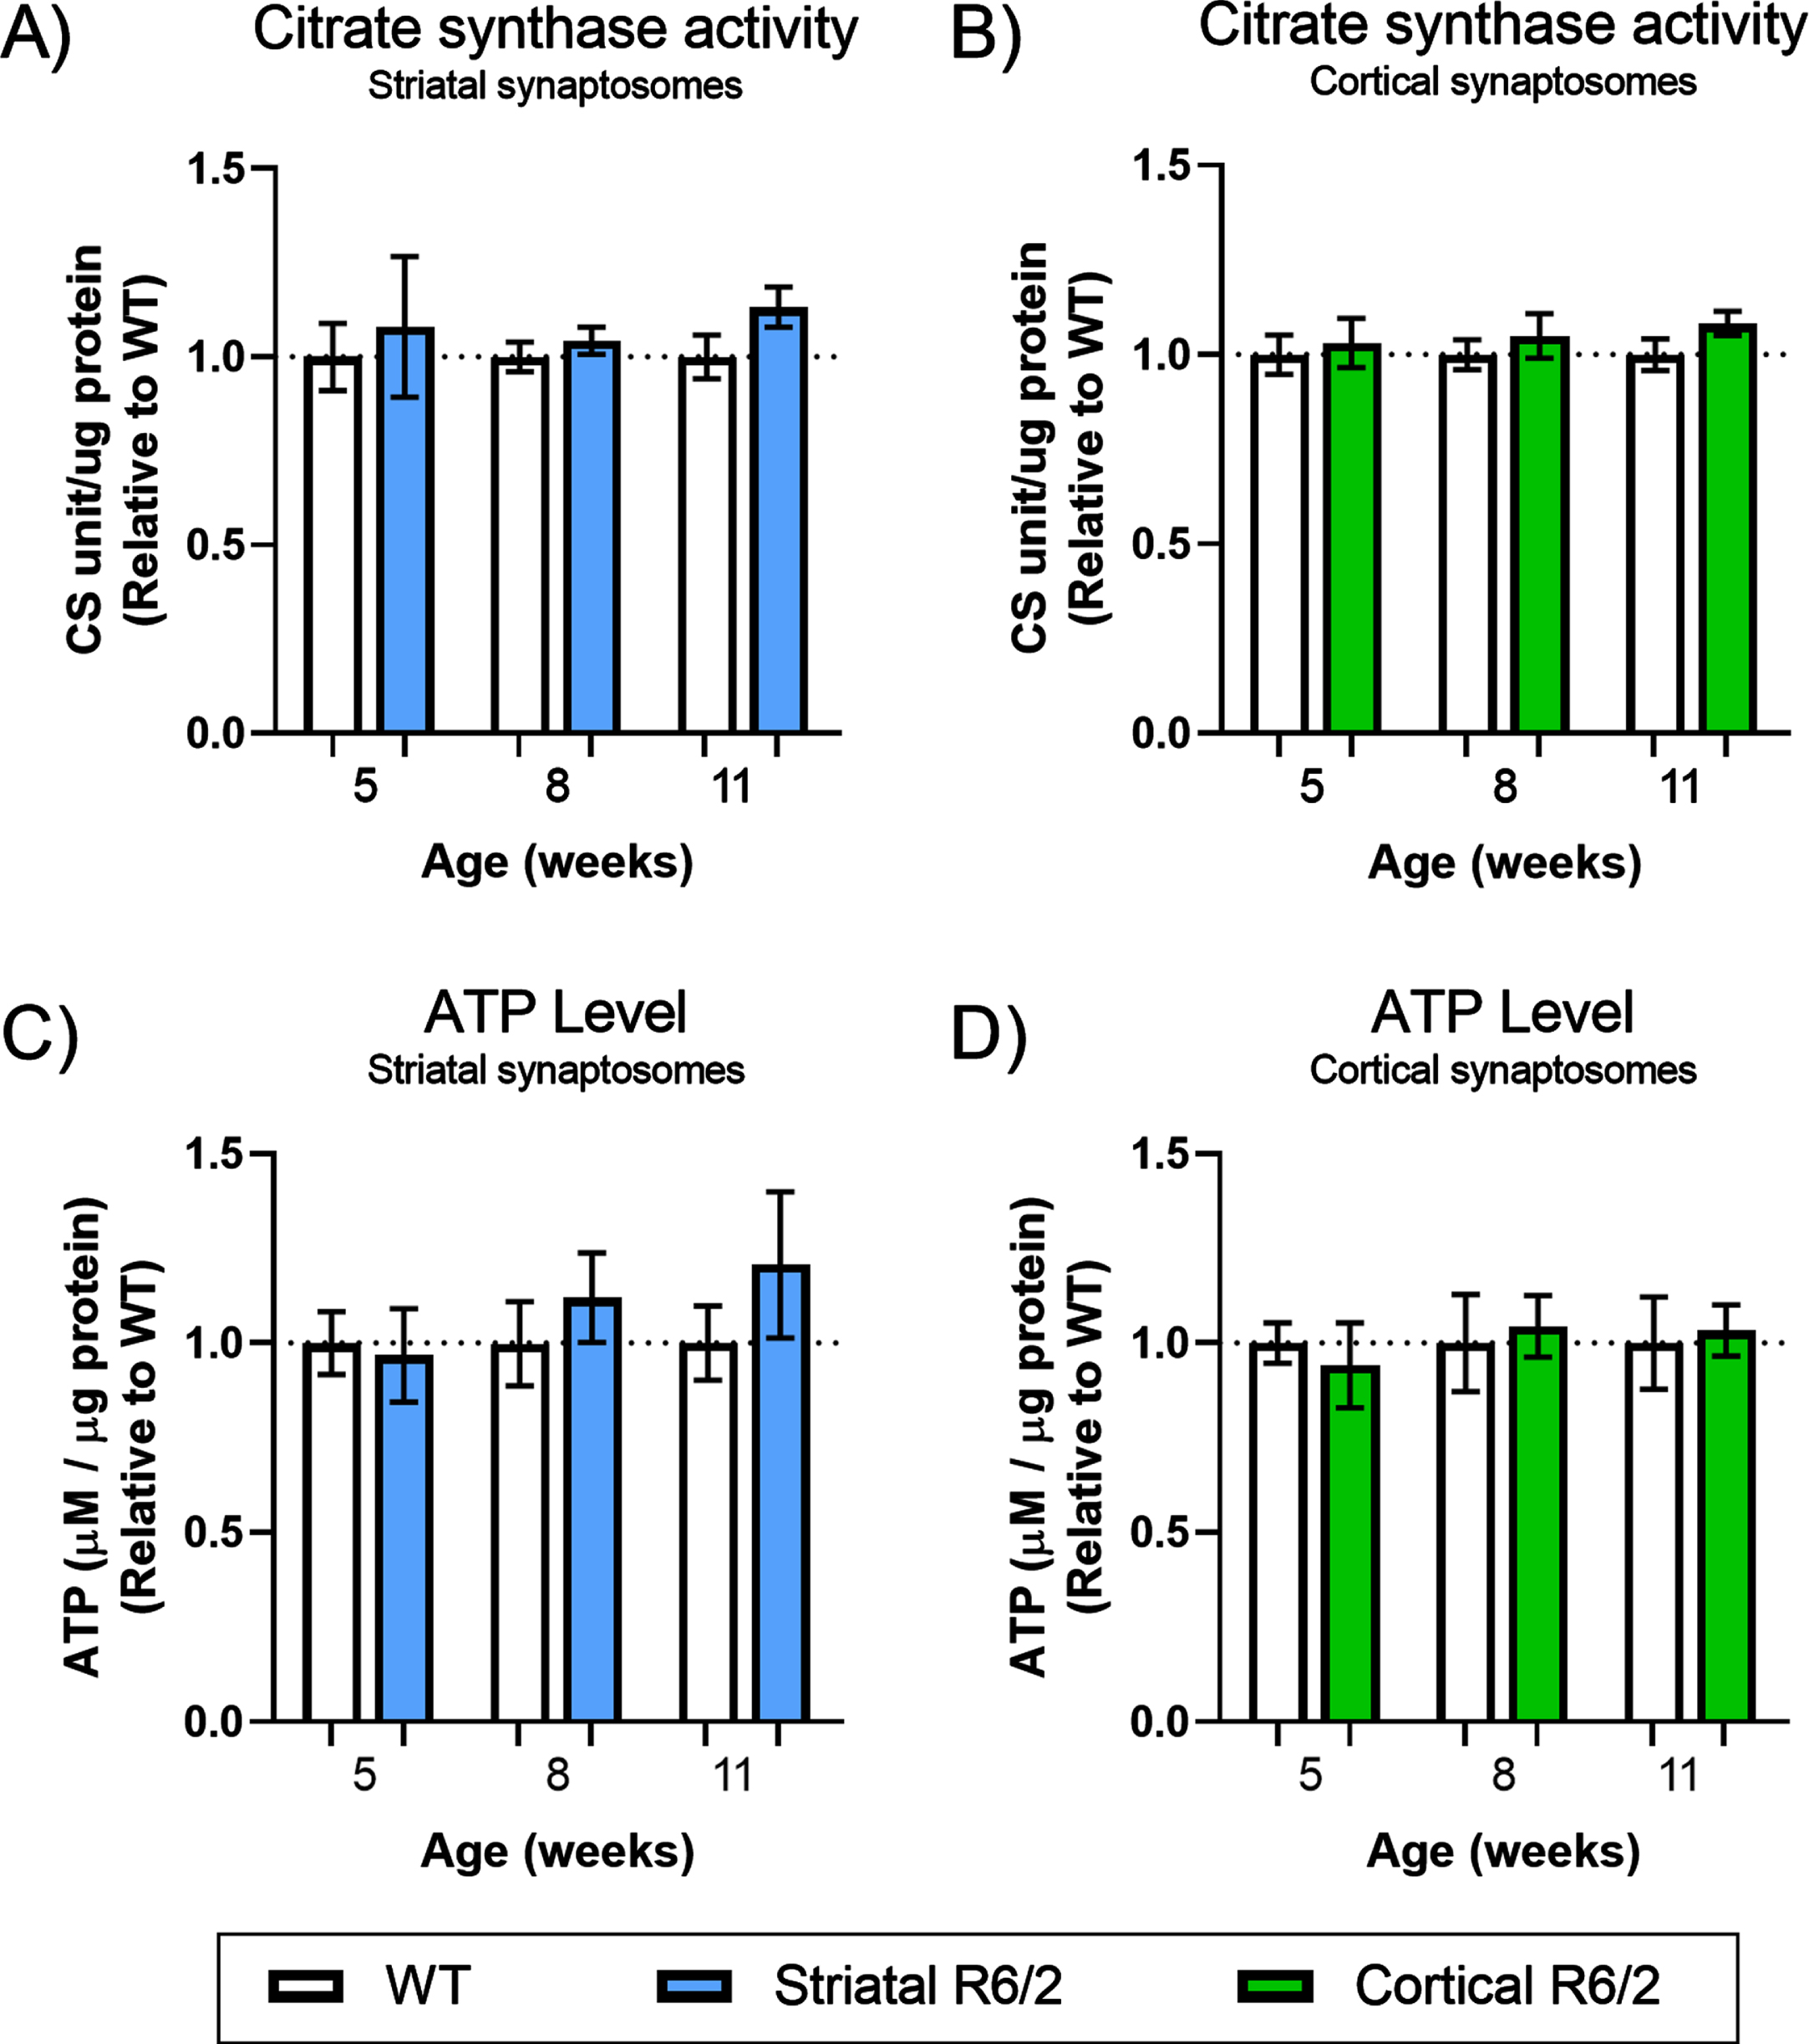
Functional state of resting synaptosomes in R6/2 brain. Metabolic activity of synaptosomes isolated from WT (clear bars) and R6/2 (colored bars) mice at three different stages of disease were assessed using two different methods. Bar plot (Mean±SEM of biological replicates, n = 6) representing the maximal citrate synthase activity in resting striatal (A) and cortical (B) synaptosomes and normalized to total protein content. Bar plot (Mean±SEM of biological replicates, n = 7) representing the endogenous pool of ATP in resting striatal (C) and cortical (D) synaptosomes and normalized to total protein content. All results are presented relative to WT within each week. No significant differences were found using unpaired Student’s t-test, applying a two-stage linear step-up procedure of Benjamini, Krieger and Yekutieli (Q: 5%) as correction for multiple testing.
The ratio between MitoTracker® Green FM and MitoTracker Red CMXRos can be used as an indication of the membrane potential per mitochondria (during the time allowed for MitoTracker staining), and thus reflects the functionality of the remaining mitochondria in the synaptosomes. Interestingly, we found a significant increase of this ratio of almost 50% in the late stage of disease in the striatal synaptosomes (q < 0.0001) from R6/2 compared to WT (Fig. 1H). Again, no changes were found in the cortical synaptosomes (Fig. 1I).
Collectively, these findings show that HD introduces loss of mitochondrial mass in striatum in the late stage of the disease, but that functional alterations in the remaining striatal synaptic mitochondria enables them to maintain the synaptic ATP levels.
Mitochondrial antioxidant levels are increased in striatal synaptosomes from R6/2 mice
Changes in mitochondrial function may lead to increased formation of ROS [48, 50]. Since increased ROS levels can be harmful, we examined ROS production in the striatal and cortical synaptosomes (Fig. 3A, B). The results indicate that synaptosomes from both striatum and cortex of R6/2 mice exhibit higher ROS production than those of the WT mice. In striatal synaptosomes, we saw a general tendency towards increased ROS production, yet not reaching significance (Fig. 3A), and in the cortical synaptosomes, we saw a significant increase in ROS production in the late stages of disease (q = 0.02) (Fig. 3B).

Synaptic reactive oxygen species (ROS) production and mitochondrial antioxidants in R6/2 brain synaptosomes. ROS production in synaptosomes isolated from WT (clear bars) and R6/2 (colored bars) mice at three different stages of disease. Bar plot (Mean±SEM of biological replicates, n = 8) representing striatal (A) and cortical (B) synaptosomes measured over 30 minutes (determined using Dihydrorhodamine 123 fluorescence) normalized to total protein content. Protein levels of mitochondrial antioxidants were assessed by western blotting in synaptosomes isolated from WT (clear bars) and R6/2 (colored bars) mice at three different stages of disease. Bar plot (Mean±SEM of biological replicates, n = 6) representing protein levels of SOD2 in striatal (D) and cortical synaptosome (E) relative to actin. Similarly, protein levels of acetylated SOD2 in striatal and cortical synaptosomes relative to actin were assessed (data not shown). Bar plot (Mean±SEM of biological replicates, n = 6) representing the calculated ratio between acetylated SOD2 and SOD2 total in striatal (G) and cortical synaptosomes (H) relative to actin. Bar plot (Mean±SEM of biological replicates, n = 6) representing protein levels of SIRT3 in striatal (J) and cortical synaptosomes (K) relative to actin. Representative western blots used to quantify the protein levels of total SOD2 and acetylated SOD2 in striatal (C) and cortical (F) synaptosomes and of SIRT3 in striatal (I) and cortical (L) synaptosomes. All results are presented relative to WT within each week and significant differences between WT and R6/2 were determined using unpaired Student’s t-test, applying a two-stage linear step-up procedure of Benjamini, Krieger and Yekutieli (Q: 5%) as correction for multiple testing. To illustrate tendencies, the calculated q-values are shown (*q < 0.05).
These measurements of ROS production in the synaptosomes reflect resting synapses, i.e., synapses removed from the neuronal network where the mitochondria thus have limited energy demands. Next, we wanted to investigate whether the isolated synaptosomes showed signs of a prolonged increase in ROS production in vivo as previously described in striatal synaptosomes and neurites in an HD knock-in mouse model [51]. To this end, we investigated the protein level of the most important mitochondrial ROS scavenger superoxide dismutase 2 (SOD2), as well as Sirtuin 3 (SIRT3) deacetylase, which is a mitochondrial activator of SOD2 [52]. Our results showed increased SOD2 protein levels in the striatal synaptosomes from 11-week-old R6/2 mice, reaching protein levels approximately twice as high as in the WT (Fig. 3D) (q = 0.029). We observed an increased relative level of SIRT3 in the late stage R6/2 striatal synaptosomes (Fig. 3J) (q = 0.0168). However, the protein level of acetylated SOD2 in the striatal synaptosomes from R6/2 was also significantly increased in R6/2 at 11 weeks of age relative to WT leading to similar ratios between acetylated SOD2 vs. total SOD2 level in striata from R6/2 and WT mice at all stages of disease (Fig. 3G). This indicates that the increased SIRT3 protein level does not lead to a corresponding increase in SIRT3 activity during R6/2 disease progression. In the cortical synaptosomes, we found no differences in the protein level of SOD2, SOD acetylation, or SIRT3 compared to WT (Fig. 3E, H, K). Together these results indicate that the mitochondrial antioxidant system of the striatal synapses from R6/2 mice is highly activated in the late stage of disease but may not reach activity sufficiently compensating for an increased ROS production.
Oxygen consumption in veratridine-activated striatal synaptic mitochondria is increased in R6/2 mice
To obtain a direct measurement of mitochondrial respiration, we investigated the OCR in striatal and cortical synaptosomes using a Seahorse Bioscience XFe96 analyzer with three different substrates/sub-strate combinations: 5 mM pyruvate (to assess mito-chondrial function independent of glycolysis); 2.5mM glucose (to investigate the glycolytic function of the synaptosomes); and 5 mM pyruvate supplemented with 2.5 mM glucose (aiming to investigate an excess substrate condition). The functional capacity and efficiency of mitochondria were assessed using a mitochondrial stress test protocol as previously described [53, 54]. We injected veratridine, oligomycin A (inhibiting the ATP synthase thus revealing the proton leak), FCCP (an uncoupling agent leading to maximal uncoupled OCR) and rote-none + antimycin A (inhibiting the mitochondrial respiration revealing non-mitochondrial OCR) (Fig. 4A) [54]. In each individual experiment, non-mitochondrial OCR was subtracted from all other OCR values.
As our previous examinations of the effect of mHtt expression on synaptic mitochondria had not identified any changes before disease onset (5 weeks of age), we performed OCR measurements in synaptosomes from R6/2 to the WT mice at 8 and 11 weeks of age. All isolated synaptosomal preparations responded with the expected changes in the OCR upon injection of the various compounds (Supplementary Figure 4), thereby demonstrating the presence of functional mitochondria as well as maintained glycolytic capacity. Basal mitochondrial OCR was similar between striatal synaptosomes from R6/2 and WT (Fig. 4B). The only difference in basal OCR was a significant reduction in the cortical synaptosomes in the presences of pyruvate alone (q = 0.0368 after FDR correction for multiple testing) in the 11-week-old R6/2 compared with WT mice (Fig. 4C), indicating that cortical, but not striatal, synaptosomes affected by late stages of HD may require the presence of glucose in order to sustain normal levels of mitochondrial respiration.
Basal mitochondrial OCR reflects resting synaptosomes. To activate the mitochondria in the synaptosomes, we used veratridine in order to mimic neurotransmission and maintenance/restoration of resting membrane potential. Veratridine induces a persistent activation of the voltage-sensitive Na+ channels, causing a depolarization across the plasma membrane. The depolarization creates an acute energy demand to restore sodium homeostasis and membrane potential, leading to an indirect activation of the mitochondria. The potential toxicity of veratridine on the metabolic activity were tested before use and showed no lasting effect of veratridine in any of the synaptosome fractions within the timeframe of the experiments (Supplementary Figure 3).
The veratridine-activated mitochondrial OCR is shown in Fig. 4D and 4E. Veratridine significantly increased the OCR relative to the basal mitochondrial OCR, in all but one synaptosomal fraction (Supplementary Table 3). In the R6/2 striatal synaptosomes we observed a general tendency, but not significant after correction for multiple tests, towards higher veratridine-activated OCR (compared to WT) in the presence of pyruvate (q = 0.0882) and pyruvate supplemented with glucose (q = 0.0882) at 8 weeks of age, i.e., around the time of disease onset (Fig. 4D). No effect was observed in the more progressed disease stage at 11 weeks of age, indicating no mHtt-induced increased OCR capacity in the late stages of the disease. Interestingly, we found an elevated proton leak in striatal synaptosomes when using pyruvate supplemented with glucose in both early (q = 0.0158) and late (q = 0.0158) stages of disease (Fig. 4F). In the cortical synaptosomes, we found no differences in the veratridine-activated OCR in R6/2 compared with WT in any of the substrate combinations (Fig. 4E) and also no differences in proton leak (Fig. 4G).
Next, we calculated the coupling efficiency reflecting the mitochondrial efficiency of the ATP production [48]. We found tendencies towards a decrease in coupling efficiency in the striatal synaptosomes from R6/2 compared to WT in the late stages of disease (Fig. 4H) both in the presence of pyruvate alone (q = 0.0844) and in the presence of pyruvate supplemented with glucose (q = 0. 0844). Changes in coupling efficiency indicate changes in the fraction of the mitochondrial oxygen consumption used for ATP synthesis. No differences were seen in the coupling efficiencies of the cortical synaptosomes (Fig. 4I).
Extracellular acidification rate reflects glycolysis in the synaptosomes
Glycolytic activity can be assessed in the Seahorse assay through the extracellular acidification rate (ECAR) [55]. Glucose as single substrate force the synaptosomes to perform glycolysis in order to produce the needed pyruvate to drive mitochondrial respiration. Synaptosomes may lose part of their glycolytic capacity over time [53]. Hence, we used ECAR data from the earliest time points of the Seahorse protocol. In the striatal synaptosomes from 8-week-old mice we only observed a tendency towards an increased ECAR after veratridine stimulation (Fig. 5) (q = 0.0893) which was not seen in synaptosomes from late stage mice. No significant differences between R6/2 and WT were seen in the cortical synaptosomes at any stage; however, a general trend towards lower ECAR in R6/2 cortices compared to WT was observed.

Extracellular acidification rate (ECAR) in synaptosomes from R6/2 mice. The ECAR of synaptosomes were assessed in the Seahorse assay when using glucose only as substrate and under basal (un-stimulated) and veratridine-activated conditions, respectively. Bar plot (Mean±SEM of biological replicates, n = 6–8) showing striatal (A) and cortical (B) ECAR of R6/2 relative to WT. Significant differences between WT and R6/2 were determined using unpaired Student’s t-test, applying a two-stage linear step-up procedure of Benjamini, Krieger and Yekutieli (Q: 5%) as correction for multiple testing. To illustrate tendencies, the calculated q-values are shown.
Increased non-mitochondrial OCR in striatal and cortical synaptosomes from R6/2 mice
During our investigations of the respiratory capacity of the isolated striatal and cortical synaptosomes, non-mitochondrial OCR was measured after addition of rotenone & antimycin A to the synaptosomes (see Fig. 4A). Non-mitochondrial OCR reflects oxygen consumption of non-mitochondrial cellular pathways, and is often considered inconsequential; however, we found significant, HD-induced changes in the non-mitochondrial OCR in both striatal and cortical synaptosomes around disease onset as well as in the late stages of disease (Fig. 6). In the striatal synaptosomes, the non-mitochondrial OCR was significantly increased in the R6/2 compared to WT mice in the late stages of disease and in the presence of pyruvate supplemented with glucose (q = 0.0026) (Fig. 6A). In the cortical synaptosomes, we found highly increased non-mitochondrial OCR compared to WT with all three substrate combinations (glucose: q = 0.03557; pyruvate: q = 0.00056; and pyruvate supplemented with glucose: q = 0.00499) around disease onset. This increase persisted at the late stages of disease (glucose: q = 0.04753; pyruvate: q = 0.00021; and pyruvate supplemented with glucose: q = 0.000139) (Fig. 6B). Collectively, these results indicate a strong link between the synaptic non-mitochondrial oxygen consumption and HD pathology, which interestingly is most predominant in cortical synaptosomes. This calls for further investigations of the mechanism and co-dependencies of these results.
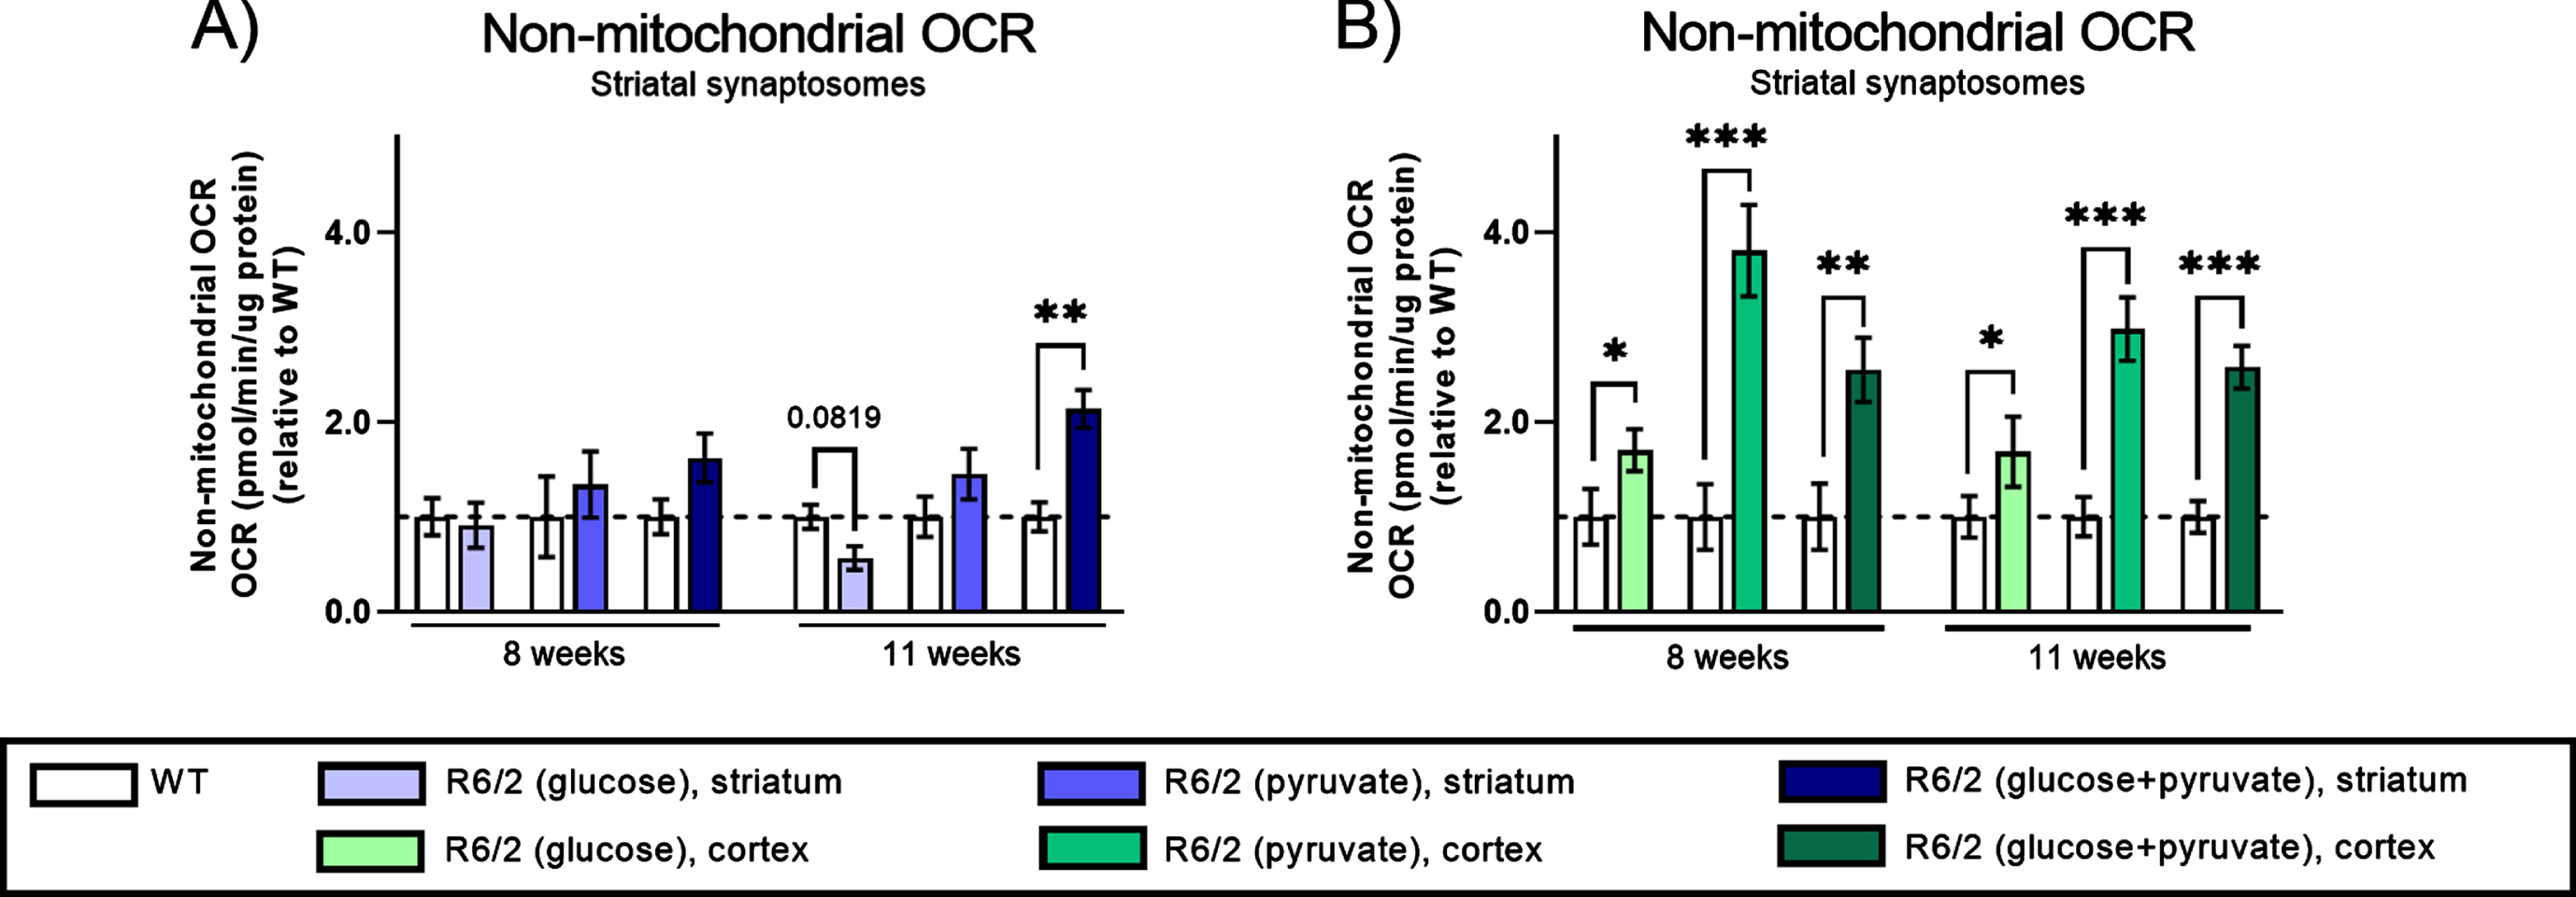
Non-mitochondrial oxygen consumption rate (OCR) in synaptosomes from R6/2 mice. Non-mitochondrial OCR was assessed after inhibition of mitochondrial function with rotenone & antimycin A as depicted in Fig. 4A. Bar plot (Mean±SEM of biological replicates, n = 6–8) showing non-mitochondrial OCR in striatal (A) and cortical (B) synaptosomes isolated from WT (clear bars) and R6/2 (colored bars) mice at two different stages of disease and in the presences of 2.5 mM glucose (light shades), 5 mM pyruvate (medium shades), and 5 mM pyruvate supplemented with 2.5 mM glucose (dark shades). All results are presented relative to WT and significant differences between WT and R6/2 were determined using unpaired Student’s t-test, applying a two-stage linear step-up procedure of Benjamini, Krieger and Yekutieli (Q: 5%) as correction for multiple testing. To illustrate tendencies, the calculated q-values are shown (*q < 0.05, **q < 0.01, and ***q < 0.001).
DISCUSSION
Mitochondrial respiration and mitochondrial dysfunction in HD have been investigated intensively using different models and methods in a variety of different experimental setups (for review, see [23, 24]). Our study distinguishes itself from previous studies by investigating the effect of mHtt on regional synaptic mitochondria and synaptic mitochondrial respiration in situ in isolated nerve terminals in a mouse model of HD, and by using veratridine to stimulate the isolated synaptosomes. We show that mHtt leads to loss of synaptic mitochondria in the striatum early in disease, but that mitochondrial ATP production is maintained, potentially by increasing respiration per mitochondrion at the expense of increased ROS production. Analyses of oxygen consumption in synaptosomes revealed that striatal synaptic mitochondria are more severely affected by mHtt than synaptic mitochondria from the cortex, displaying elevated proton leakage and reduced coupling efficiency during stimulation.
Mitochondrial mass, function, ROS production, and antioxidant levels, in synaptic mitochondria expressing mutant huntingtin
We found lower striatal mitochondrial mass in the late stage of disease in R6/2 mice when compared to WT. However, this was not reflected in lower citrate synthase activity, indicating that the total mito-chondrial capacity was similar between synaptosomes from R6/2 and WT. In accordance with the latter, no difference was found when assessing the mass of functional mitochondria using the membrane potential-sensitive MitoTracker Red. Furthermore, the ATP levels of the synaptosomes were similar in R6/2 vs. WT. These results thus do not reveal signs of reduced total metabolic function in the HD affected synaptosomes. Instead, a compensatory mechanism of increased metabolic activity per mitochondria in the striatal synaptic mitochondria seems to exist and can be hypothesized to counteract mitochondrial loss or fragmentation caused by mHtt in order to conserve normal metabolic level.
Dysfunctional mitochondrial respiration is one of the main producers of ROS within the cell. We found genotype-specific increases in ROS production in late stage cortical synaptosomes, but only a tendency to a similar increase in striatal synaptosomes. However, as mentioned in the results section, measurements of ROS production in resting, un-stimulated synaptosomes may not fully reflect the situation in vivo. We therefore analyzed levels of antioxidants in the synaptosomes. In striatum, we saw increased SOD2 expression, indicating prolonged augmented ROS levels in R6/2 striata. This conclusion is supported by the findings of Valencia et al. [51], who demonstrated enhanced protein oxidation in both striatal and cortical synaptosomes of HD140Q/140Q homozygous knock-in mice indicating high levels of ROS production in the synaptosomes.
Prolonged increased ROS is known to activate SIRT3 expression [56], upon which SIRT3 deacetylates and activates SOD2 [52]. Through this pathway, SIRT3 activation can act as a compensatory mechanism to avoid oxidative stress. In our study, we found increased levels of SIRT3 protein in striatal synaptosomes in the late stage of disease, indicating activation of a compensatory mechanism. However, the ratio of acetylated SOD2 was unchanged, which may indicate that the activity of SIRT3 is not increased correspondingly in the R6/2 synaptosomes. In previous studies, we and others have found results supporting this conclusion, showing that mHtt may inhibit the activity of SIRT1, another sirtuin deacetylase [41, 57]. However, previous investigations of the level of SIRT3 mRNA and protein in different HD models are conflicting [58–60].
Mitochondrial oxygen consumption, proton leakage, and coupling efficiency in veratridine-activated synaptosomes
Measurements of the basal mitochondrial oxygen consumption in resting synaptosomes revealed no significant differences between HD mice and WT controls except for a decreased OCR in late stage cortical R6/2 synaptosomes with pyruvate as only substrate. These results align well with our observations of maintained membrane potential, CS activity, and ATP levels in the un-stimulated R6/2 synaptosomes. In contrast, after veratridine-stimulation, we saw tendencies to increased respiration in synaptic mitochondria from striata from 8-week-old R6/2 compared to WT when using pyruvate, or pyruvate in combination with glucose, as substrates. In the stimulated R6/2 striatal synaptosomes, this was accompanied by an increase in mitochondrial membrane proton leak, reaching levels up to twice as high compared to WT synaptosomes, and most prominent when using glucose in combination with pyruvate as substrates where it was evident in both 8- and 11-week-old R6/2. An increased proton leak can be a response to an elevated proton motive force, serving as a protective mechanism to dampen the protonic pressure on the electron transport chain, thereby reducing a potential leak of electrons and serving as a protection against ROS production [61, 62]. Alternatively, an increased proton leakage may also be a sign of mitochondrial dysfunction, as the proton leakage will reduce the efficiency of the mitochondrial ATP production [48, 63]. Veratridine itself can increase the mitochondrial proton leak by leading to increased Na+/K+-ATPase activity increasing intracellular Na+, which subsequently activates the mitochondrial Na+/Ca2+ exchanger hereby increasing the proton-driven Ca2+ cycling across the inner membrane [53]. In itself, this does not explain why the R6/2 synaptosomes show highly increased proton leakage compared to WT. However, cells affected by mHtt have reduced capacity to handle large Ca2+ loads [64, 65], and their mitochondria depolarize more in response to Ca2+ [64, 66]; this is in line with our results of increased tendency to proton leakage in the HD-affected synaptic mitochondria.
Previously, the effect of mHtt on synaptic and non-synaptic mitochondria has been investigated by the Brustovetsky group in 6–8-week-old R6/2 mice [67] and 2- and 10-month-old YAC128 [68, 69]. In both mouse models, they found no differences in synaptic mitochondrial respiration between HD and WT mice, neither when comparing synaptic nor non-synaptic respiration. These findings seem to be in conflict with our result, as we find clear HD related effects on mitochondrial respiration. However, the experiments performed by the Brustovetsky group were carried out using in vitro mitochondria isolated from either whole brain or striatal synaptosomes, investigating oxygen consumption in the presence of either pyruvate (3 mM) in combination with malate (1 mM) or succinate (3 mM) in combination with glutamate (3 mM), and without veratridine [67, 68]. Therefore, findings of Hamilton et al. are most comparable to our measurements of basal respiration in the presence of pyruvate in the striatal synaptosomes isolated from 8 week old mice in which we likewise found no differences in synaptic mitochondrial respiration between R6/2 and WT. Additionally, since the cerebral cortex make up a large part of the brain, their results from whole brain synaptosomes could be comparable with our result in the cortical synaptosomes, also showing no difference in OCR.
Furthermore, we notice that investigations using isolated synaptic mitochondria purified from nerve terminals consistently showed no respiratory dysfunction as an effect of HD [67–69], whereas studies using isolated nerve terminals (synaptosomes) to study synaptic mitochondria in situ revealed significantly decreased ATP levels in axonal and dendritic terminals both from the cortex and the striatum [20, 70] and increased oxidative protein damage demonstrating increased levels of ROS [51]. These results suggest that the deleterious effects of mHtt on synaptic mitochondrial function rely on interactions with other cellular processes in the synapse.
In our studies, we saw tendencies towards decrea-sed coupling efficiency of the veratridine-activated striatal synaptic mitochondria from late stage symptomatic mice, when using pyruvate, or pyruvate in combination with glucose, as substrates. The coupling efficiency reflects the fraction of the oxygen consumed, that results in ATP production, and our results could therefore indicate an inefficient ATP production within the synapses, a conclusion that does not correlate with our findings of no significant differences in the ATP levels between R6/2 and WT mice. However, Orr et al. have shown significantly decreased ATP levels in synaptosomes isolated from the forebrain of Hdh-150 knock-in HD mice [20] and Wang et al. showed decreased ATP content in cortical and striatal synaptosomes isolated from 12–14-month-old mice from the same model [70]. This discrepancy could be explained by differences between mouse models, measuring methods, or simply reflect differences related to the energy demand in the synapses (at rest or during stimulation) when ATP level were measured. For future studies, we therefore suggest investigating the ATP levels in stimulated synapses, as insufficiency of the ATP production may only become evident during increased ATP demand.
Glycolytic activity in un-stimulated and stimulated synaptosomes
Assessment of the mitochondrial function using glucose as single substrate, and in intact synaptosomes as opposed to isolated mitochondria, allows for a concomitant investigation of the function of synaptic glycolysis [55]. It is conceivable, that the rate of glycolysis may be a limiting factor for the maximal mitochondrial respiration obtained, especially in synaptosomes stimulated to increase their ATP production, e.g., by veratridine. Several studies have reported insufficient glycolytic capacity under stimulation in both HD rat primary striatal neurons and HD iPSCs, respectively [71, 72]. However, in our study, investigating glycolytic activity in synaptosomes specifically, comparison of ECAR from R6/2 and WT synaptosomes showed no significant differences in neither striatal nor cortical synaptosomes.
Non-mitochondrial oxygen consumption
In our measurement of synaptosomal oxygen consumption, we surprisingly found large, genotype-dependent differences in the non-mitochondrial OCR which was highly influenced by brain region and the presences of different substrates. Most clearly, we found marked increases in the non-mitochondrial OCR in cortical synaptosomes from both early and late symptomatic R6/2 mice compared to WT, especially when using the combination of pyruvate and glucose as substrates. Non-mitochondrial oxygen consumption is a result of various cellular processes like protein folding, lipid and collagen synthesis and hydroxylation reactions. These cellular processes are mostly performed by members of a large super family of 2-oxoglutarate-dependent oxygenases [73, 74] or the activity of ROS-producing NADPH oxidases (NOXs) situated in either the cell membrane or the mitochondria [48, 75]. ROS originating from NOXs have previously been suggested to play a role in HD-associated oxidative damage [76]. Further investigations are needed in order to examine the nature and cause of the non-mitochondrial respiration evident in the synaptosomes affected by HD.
Suggested role of functional changes in synaptic mitochondria in HD
Synaptic mitochondria produce high levels of ATP in order to maintain the membrane potential required for normal synaptic function and homeostasis [77–79]. Synaptic mitochondria also play an important role in regulation of neuronal differentiation [80], axon initiation and growth [81], formation of neuronal circuits [82, 83], and regulation of presynaptic strength and synaptic plasticity [84–86]. The important role of mitochondria in synaptic growth and regulation is evident from experiments where mitochondrial dysfunction has been induced by affecting mitochondrial dynamics or transport of whole mitochondria, leading to deprivation of ATP supply and loss of synapses and dendritic spines [87–90].
The measurements of basal mitochondrial OCR in isolated synaptosomes reflect a situation where the neurons are resting, and revealed no differences between HD and WT. When stimulated to mimic depolarization during neurotransmission, the synaptic mitochondria located in striatal synaptosomes from early stage R6/2 mice displayed an increased mitochondrial respiration relative to WT, but with the expense of an increased proton leak. However, as the disease progresses, a gradual decrease in the coupling efficiency of the mitochondria occurs, together with an overall loss of mitochondria and an increased ROS production within the striatal synaptosomes. In contrast, the cortical synaptic mitochondria showed no change in coupling efficiency, and only exhibit increased ROS production in the late stages of disease. Therefore, our results indicate that the normal mitochondrial function of the cortical synaptosomes is retained longer than the in the striatal synaptosomes during disease development, which corresponds well with differences in striatal and cortical synaptic protein profiles as previously shown [22].
Collectively, the changes in striatal synaptosomes indicate the activation of compensatory mechanisms aiming to maintain normal mitochondrial function in HD. These may include maintaining normal levels of mitochondrial proteins, increased proton leak, and an upregulation of SOD2 protein levels, which all indicate an activation of the antioxidant system. It remains to be investigated whether these early changes have impact on neuronal differentiation and formation and maintenance of the neuronal circuits. However, as the disease progress the increased production of ROS and decreased coupling efficiency of the synaptic mitochondria suggest that these compensatory mechanisms fail to fully maintain normal function of the striatal synaptic mitochondria, especially when neurotransmission increases energy demand. This may, over time, lead to a compromised synaptic function resulting in loss of synapses, retraction of neurites, disruption of neuron signaling and eventually death of the striatal neurons within the HD brain.
In conclusion, our results show that mHtt expression affects the synaptic mitochondria selectively, depending on brain region, demonstrating that selective mitochondrial damage occurs early in disease and that these changes could be an important contributing factor initiating striatal neurodegeneration in HD. Furthermore, we demonstrate the occurrence of other pathogenic changes in the synapses, e.g., increased non-mitochondrial oxygen consumption and reduced glycolytic capacity. These changes likely contribute, modify, or augment the effect of mitochondrial dysfunction seen in the later stages of the disease. Future studies are needed to address this interplay specifically in the synapses affected by HD.
Footnotes
ACKNOWLEDGMENTS
We thank Rabab Nima for technical assistance, Jonas Treebak for donation of SOD2 antibodies and Asli Silahtaroglu for assistances and use of microscope. This work was supported by Arvid Nilssons Fond, Grosserer Valdemar Foersom & Hustru Thyra Foersom, født Ottos Fond, Læge Sofus Carl Emil Friis og Hustru Olga Doris Friis’ Legat, and Frode V. Nyegaard og Hustrus Fond.
CONFLICT OF INTEREST
The authors declare that they have no conflict of interest to report.
