
Abstract
Background:
Metabolic alterations contribute to disease onset and prognosis of Huntington’s disease (HD). Weight loss in the R6/2 mouse model of HD is a consistent feature, with onset in mid-to-late stage of disease.
Objective:
In the present study, we aimed to investigate molecular and functional changes in white adipose tissue (WAT) that occur at weight loss in R6/2 mice. We further elaborated on the effect of leptin-deficiency and early obesity in R6/2 mice.
Methods:
We performed analyses at 12 weeks of age; a time point that coincides with the start of weight loss in our R6/2 mouse colony. Gonadal (visceral) and inguinal (subcutaneous) WAT depot weights were monitored, as well as adipocyte size distribution. Response to isoprenaline-stimulated glycerol release and insulin-stimulated glucose uptake in adipocytes from gonadal WAT was assessed.
Results:
In R6/2 mice, WAT depot weights were comparable to wildtype (WT) mice, and the response to insulin and isoprenaline in gonadal adipocytes was unaltered. Leptin-deficient R6/2 mice exhibited distinct changes compared to leptin-deficient WT mice. At 12 weeks, female leptin-deficient R6/2 mice had reduced body weight accompanied by an increased proportion of smaller adipocytes, while in contrast; male mice displayed a shift towards larger adipocyte sizes without a significant body weight reduction at this timepoint.
Conclusions:
We here show that there are early sex-specific changes in adipocyte cell size distribution in WAT of R6/2 mice and leptin-deficient R6/2 mice.
INTRODUCTION
Huntington’s disease (HD) is a neurodegenerative disease caused by pathological expansion of CAG repeats in the huntingtin (HTT) gene. HD clinical diagnosis is based on motor symptoms related to mutant HTT (mHTT)-mediated neurodegeneration [1, 2]. However, non-motor symptoms including metabolic alterations are prevalent in HD and have been causally linked to brain areas involved in metabolic regulation, such as the hypothalamus [3–6]. Weight loss despite an increased appetite and/or high caloric diet is a prominent feature of HD [7–11]. There is an inverse relationship between body mass index (BMI) and disease progression, suggesting that underlying energy metabolism mechanisms may be central for disease severity [12, 13]. The R6/2 mouse is a transgenic mouse model of HD that, similarly to patients, exhibits a metabolic phenotype with a negative state of energy balance and weight loss starting in the mid-late stages of disease [14, 15]. Interventions that target the regulatory network of energy metabolism, such as ghrelin administration and diet, can delay but not prevent weight loss in R6/2 mice [16–19]. Furthermore, the leptin-deficient Ob/Ob mouse model of obesity exhibit weight loss when crossbred with the R6/2 mice (R6/2;Ob/Ob) [20], further indicating the deleterious effect of mHTT expression on the metabolic system.
White adipose tissue (WAT) is central for maintaining whole-body energy balance and body weight by adapting the storage and hydrolysis of triglycerides to meet the energy demand in other tissues [21]. HTT is ubiquitously expressed and there may be direct and potentially fat depot-specific effects of HTT in different adipose tissues [22]. Gene expression alterations in adipose tissue have been detected in clinical HD and in animal models of HD during early stages of disease [22–24]. A transgenic Drosophila model of HD that selectively expresses mHTT exon 1 in the fat body exhibit progressively smaller lipid droplets and decline in systemic lipid and carbohydrate levels [25]. Prior to weight loss, R6/2 mice exhibit increased adiposity and increased expansion of WAT in response to a high fat diet [19]. Once weight loss has initiated in R6/2, there is an indication of WAT browning that, functionally, would promote a negative energy balance [14, 27]. Hypothalamic mHTT overexpression in R6/2 mice causes increased mass of visceral, gWAT and subcutaneous, inguinal WAT (iWAT) depots, and as R6/2 mice progress towards weight loss there are gene expression changes such as reduced Peroxisome proliferator-activated receptor gamma (Pparγ) [26, 28]. WAT can dynamically adapt to changes in energy demand through hypertrophic and hyperplastic expansion, and there is cellular and functional diversity among adipocyte populations of different cell sizes. Cell size distribution analysis visualizes this heterogeneity and changes in adipocyte population dynamics can reflect inter-individual differences and pathological conditions such as insulin resistance [29–33]. Therefore, visualizing cell size distribution in WAT of R6/2 mice may indicate early changes preceding features of adipose tissue pathology.
There is a need to further understand the molecular and functional mechanisms of WAT changes in R6/2, particularly during the early stages before onset of weight loss and neuropathological features, a stage at which WAT and the metabolic system still appear responsive to intervention [4, 28]. In the present study, we, functionally and morphologically, characterized WAT in R6/2 mice of both sexes that exhibited similar body and WAT depot weights to age-matched WT mice. We performed the same array of analyses in leptin-deficient R6/2 mice (R6/2;Ob/Ob), that prior to weight loss develop an obese phenotype reminiscent of Ob/Ob mice.
MATERIALS AND METHODS
Ethical considerations
All experimental procedures using mice were conducted according to the guidelines stated in the ethical permit approved by the local Animal Ethics Committee in Lund-Malmö, Sweden (permit numbers 2505/2018, 973/2019)
Animals
All mice used in the study were group-housed (2–5 mice/cage) under a standard 12-h light/dark cycle at 22°C with ad libitum access to a standard chow diet and water. The breeding strategy used for the leptin-deficient R6/2 mice is described in [20]. Genotyping was performed on ear biopsies as described previously [20]. Samples were sent to Laragen (Laragen Inc., CA, USA) for CAG repeat determination. In the study we used two cohorts of R6/2 mice: R6/2(CAG307 - 340) (12 weeks of age) and R6/2(CAG278 - 298) (12- and 16 weeks of age). The CAG repeats of the present colonies results in a slower disease progression than R6/2 colonies with a shorter CAG repeat [34], and are in the present study considered to be in the early stages of disease at 12 weeks of age [20].
Body weight and adipose depot weights
Mice, fasted for nine hours (glucose uptake, lipolysis, cell size distribution, serum) or non-fasted (qRT-PCR) were anesthetized using an intraperitoneal injection of a terminal dose of pentobarbital (Apoteksbolaget, Lund, Sweden). Using an electronic scale, body weights were measured followed by careful dissection and weighing of the gWAT and iWAT depots. This was followed by immediate processing of the gWAT for each respective analysis as described below.
Fasting serum glucose
Fasting serum glucose levels were measured using a glucometer (Bayer Contour XT, Apoteket, Lund, Sweden) on a drop of blood collected from the heart at sacrifice.
Adipose cell-size distribution
Small pieces (4 × 4 mg) from gWAT were fixed in osmium tetroxide and cell-size distribution was determined by using a Beckman Coulter Multisizer 4e, counting 6,000 particles, taking the average from two runs. Data were analyzed using linear bins (20–240μm, 400 bins, bin-size 0.55μm, Multisizer 4e version 4.03).
Isolation and preparation of primary gonadal adipocytes
Primary adipocytes were isolated using an established protocol [35]. The gWAT was suspended in Krebs-Ringer Bicarbonate HEPES (KRBH) buffer, pH 7.4, containing 200 nM adenosine and 3 % (w/v) bovine serum albumin (BSA). Next, the tissue was minced and digested with collagenase (1 mg/ml), shaking, 37°C for 1 h and then filtered through a 400 mikron mesh. Floating adipocytes were washed 3 times in KRBH buffer and then used for cellular analysis.
Lipolysis in isolated gonadal adipocytes
Lipolysis was determined by measuring glycerol release. Isolated gWAT adipocytes (10% v/v in KRBH Buffer) were incubated shaking at 37°C for 30 min, non-treated (basal) or treated with isoprenaline (10 nM) or a combination of isoprenaline (10 nM) and insulin (10 nM). Following incubation, an aliquot of the media was taken for determination of glycerol content and analyzed by using the kit (F6428) from Sigma-Aldrich (St. Louis, MO, USA). 30μl sample (media) was added to 100μl free glycerol reagent and absorbance (540 nm) was measured after 15 min incubation at 37°C.
Glucose uptake in isolated gonadal adipocytes
Glucose uptake into adipocytes was analyzed as described previously [36]. gWAT cells in suspension (7.5% v/v in KRBH buffer) were incubated for 30 min with or without (basal) insulin (10 nM), followed by addition of D-14 C(U)-glucose (2.5μl/ml, NEC042, Perkin Elmer, Akron, USA) and an additional 30 min incubation. The experiment was terminated by centrifugation of 300μl of each cell suspension in microtubes containing 85μl dinonylphtalate oil to separate the cell fraction from the media. The cell fraction was dissolved in scintillation fluid (Ultima Gold, Perkin Elmer, USA) and subjected to scintillation counting.
Adipose tissue histology
Dissected gWAT depots from 12-week-old female mice from the R6/2(CAG278 - 298) cohort were placed in 4% paraformaldehyde in PBS (0.01 M) for fixation overnight followed by storage in 70% ethanol at 4°C. Paraffin-embedded sections of 7μm were cut and mounted on glass slides followed by Mayer’s Hematoxylin-Eosin (H&E) staining [37]. Histological images were taken at 10x magnification using a bright-light microscope (Olympus U-HSCBM, Olympus, Tokyo, Japan).
RNA isolation and quantitative real time PCR (qRT-PCR)
Dissected gWAT depots were snap-frozen in liquid nitrogen and stored at –80°C until further analysis. RNA was isolated using the E.Z.N.A. Total RNA Kit II (Omega Bio-Tek Inc., GA, USA). After homogenization an additional centrifugation step of 4°C 12,000 × g for 15 min was performed and the lipid monolayer carefully avoided when pipetting the supernatant [38] followed by downstream RNA isolation according to the manufacturer's protocol. cDNA synthesis was performed on 1μg RNA using the iScript cDNA synthesis kit (Bio-Rad, CA, USA). qRT-PCR analysis was performed using SsoAdvanced Universal SYBR Green Supermix (Bio-Rad, CA, USA). Samples from R6/2(CAG307 - 340) mice and age-matched WT mice of both sexes were run in triplicates using the CFX96 touch real-time PCR detection system and a 2-step amplification protocol (Bio-Rad, CA, USA). Gene expression was analyzed using the ΔΔCt method [39], and normalized to Acidic ribosomal phosphoprotein P0 (36b4), Peptidylprolyl isomerase A (Ppia) and Hypoxanthine-guanine-phosphoribosyltransferase (Hprt). Housekeeping genes were picked based on the geNorm algorithm [40] (package ‘ctrlGene’ v.1.0.1. in R v.4.2.1. [41, 42]). Primer sequences are listed in Supplementary Table 1.
Statistical analyses
Statistical analyses were performed using GraphPad Prism v.9.3.1. (GraphPad software Inc., CA, USA). Prior to statistical comparisons, data was assessed for normal distribution using the Shapiro-Wilk test. Parametric data were analyzed using Unpaired t-tests or the appropriate ANOVAs (one-way or two-way) followed by Tukey’s multiple comparison test. Data that did not pass normality were analyzed using the nonparametric Mann-Whitney test or Kruskal-Wallis tests followed by Dunn’s multiple comparisons. Data is presented as mean±SEM. p < 0.05 was considered statistically significant.
RESULTS
Inguinal WAT but not gonadal WAT decreases proportionally with body weight in leptin-deficient R6/2 mice
In the present study and cohort, at 12 weeks of age we found no significant difference in body weight between WT and R6/2 mice for either sex (Fig. 1A, B). While the percentage of total body fat has previously been assessed in the R6/2 and leptin-deficient R6/2 mice [20], depot-specific fat weights have not been evaluated. Therefore, we weighed the subcutaneous iWAT and the visceral gWAT. For 12-week-old R6/2 mice of both sexes, we found no significant difference in gWAT or iWAT weights (Fig. 1C, D). We further examined WAT depot weights in a 16-week-old cohort of R6/2 mice considered being at a later stage of disease progression ([34], for further details on mouse colony see: Materials and Methods) but compared to age-matched WT littermates there was no significant difference in gWAT or iWAT weights for either sex (Supplementary Figure 1A–D).

We have previously shown that leptin-deficient R6/2 mice exhibit progressive weight loss with an onset at 12 weeks of age [20]. We found significant main effects of leptin-deficiency and the R6/2 gene on body weight in male mice (Two-way ANOVA: R6/2 gene F (1, 42) = 6.484, p = 0.0146; leptin-deficiency F (1, 42) = 172.4, p < 0.0001) (Fig. 1A). For body weight in female leptin-deficient mice we found significant main effects and interaction between the R6/2 gene and leptin-deficiency (Two-way ANOVA: R6/2 gene F (1, 39) = 10.92, p = 0.0020; leptin-deficiency F (1, 39) = 504.6, p < 0.0001; interaction F (1, 39) = 4.757, p = 0.0353). Leptin-deficient R6/2 females but not males exhibited significantly lower body weights compared to Ob/Ob mice (Fig. 1A, B).
At this point, gWAT and iWAT depot weights were significantly higher in leptin-deficient mice than in WT and R6/2 groups (Fig. 1C–1F). Leptin-deficient R6/2 females exhibited a reduction in iWAT weight compared to Ob/Ob females (Fig. 1D) and there was a significant interaction between the R6/2 gene and leptin-deficiency for iWAT (Two-way ANOVA: F (1, 36) = 4.146, p = 0.0491). Simple linear regression analysis showed that respectively 58% and 30% of the variance in iWAT and gWAT depot weights could be related to the change in body weight for leptin-deficient female mice (Fig. 1G). In contrast, for leptin-deficient male R6/2 mice that at 12 weeks displayed comparable body weights to Ob/Ob mice, we saw only a significant relation of gWAT weight to body weight (Supplementary Figure 2).
Taken together, we found that prior to weight loss the distribution of depot weights relative to body weight is similar in R6/2 mice compared to their respective WT littermates. In leptin-deficient R6/2 females, reduced body weight is accompanied by proportional reduction in iWAT, but not the gWAT weight.
Altered adipocyte size distribution in gonadal WAT obtained from leptin-deficient R6/2 female mice
Within the same WAT depot, adipocyte sizes range from very small to very large, each with distinct cellular and functional properties [29, 30]. Cell size distribution analysis illustrates the proportion of adipocyte sizes in a given WAT sample [31, 33], commonly displayed as a bimodal cell size distribution curve, where the nadir (lowest point [32]) defines the cut-off between the small and large cell size populations.
Since adipocyte size is known to affect its cellular function [29, 30], we here assessed gWAT adipocyte size distribution using a Coulter counter. As expected, compared to WT and R6/2 mice, there was a clear right shift in adipocyte size in leptin-deficient R6/2 and Ob/Ob mice, especially pronounced in female mice, which is in line with increased hypertrophy of WAT during obesity (Fig. 2). Leptin-deficient R6/2 females exhibited significantly increased fractions of small cells than Ob/Ob females (Fig. 2A, B; Supplementary Figure 3A, B). In contrast, leptin-deficient R6/2 males exhibited a significantly lower fraction of small cells than Ob/Ob males (Fig. 2C, D; Supplementary Figure 4A, B). No significant difference in cell size distribution was found between WT and R6/2 of either sex (Fig. 2A–D), and assessment of the bimodal distribution of individual mice showed pronounced variability (Supplementary Figure 5A, B; Supplementary Figure 6A, B). Performing H&E histology in the R6/2 cohort showed a clear adipocyte expansion in Ob-bred female mice, while we were unable to accurately visualize any adipocyte size differences in R6/2 versus WT mice (Fig. 2E–H).
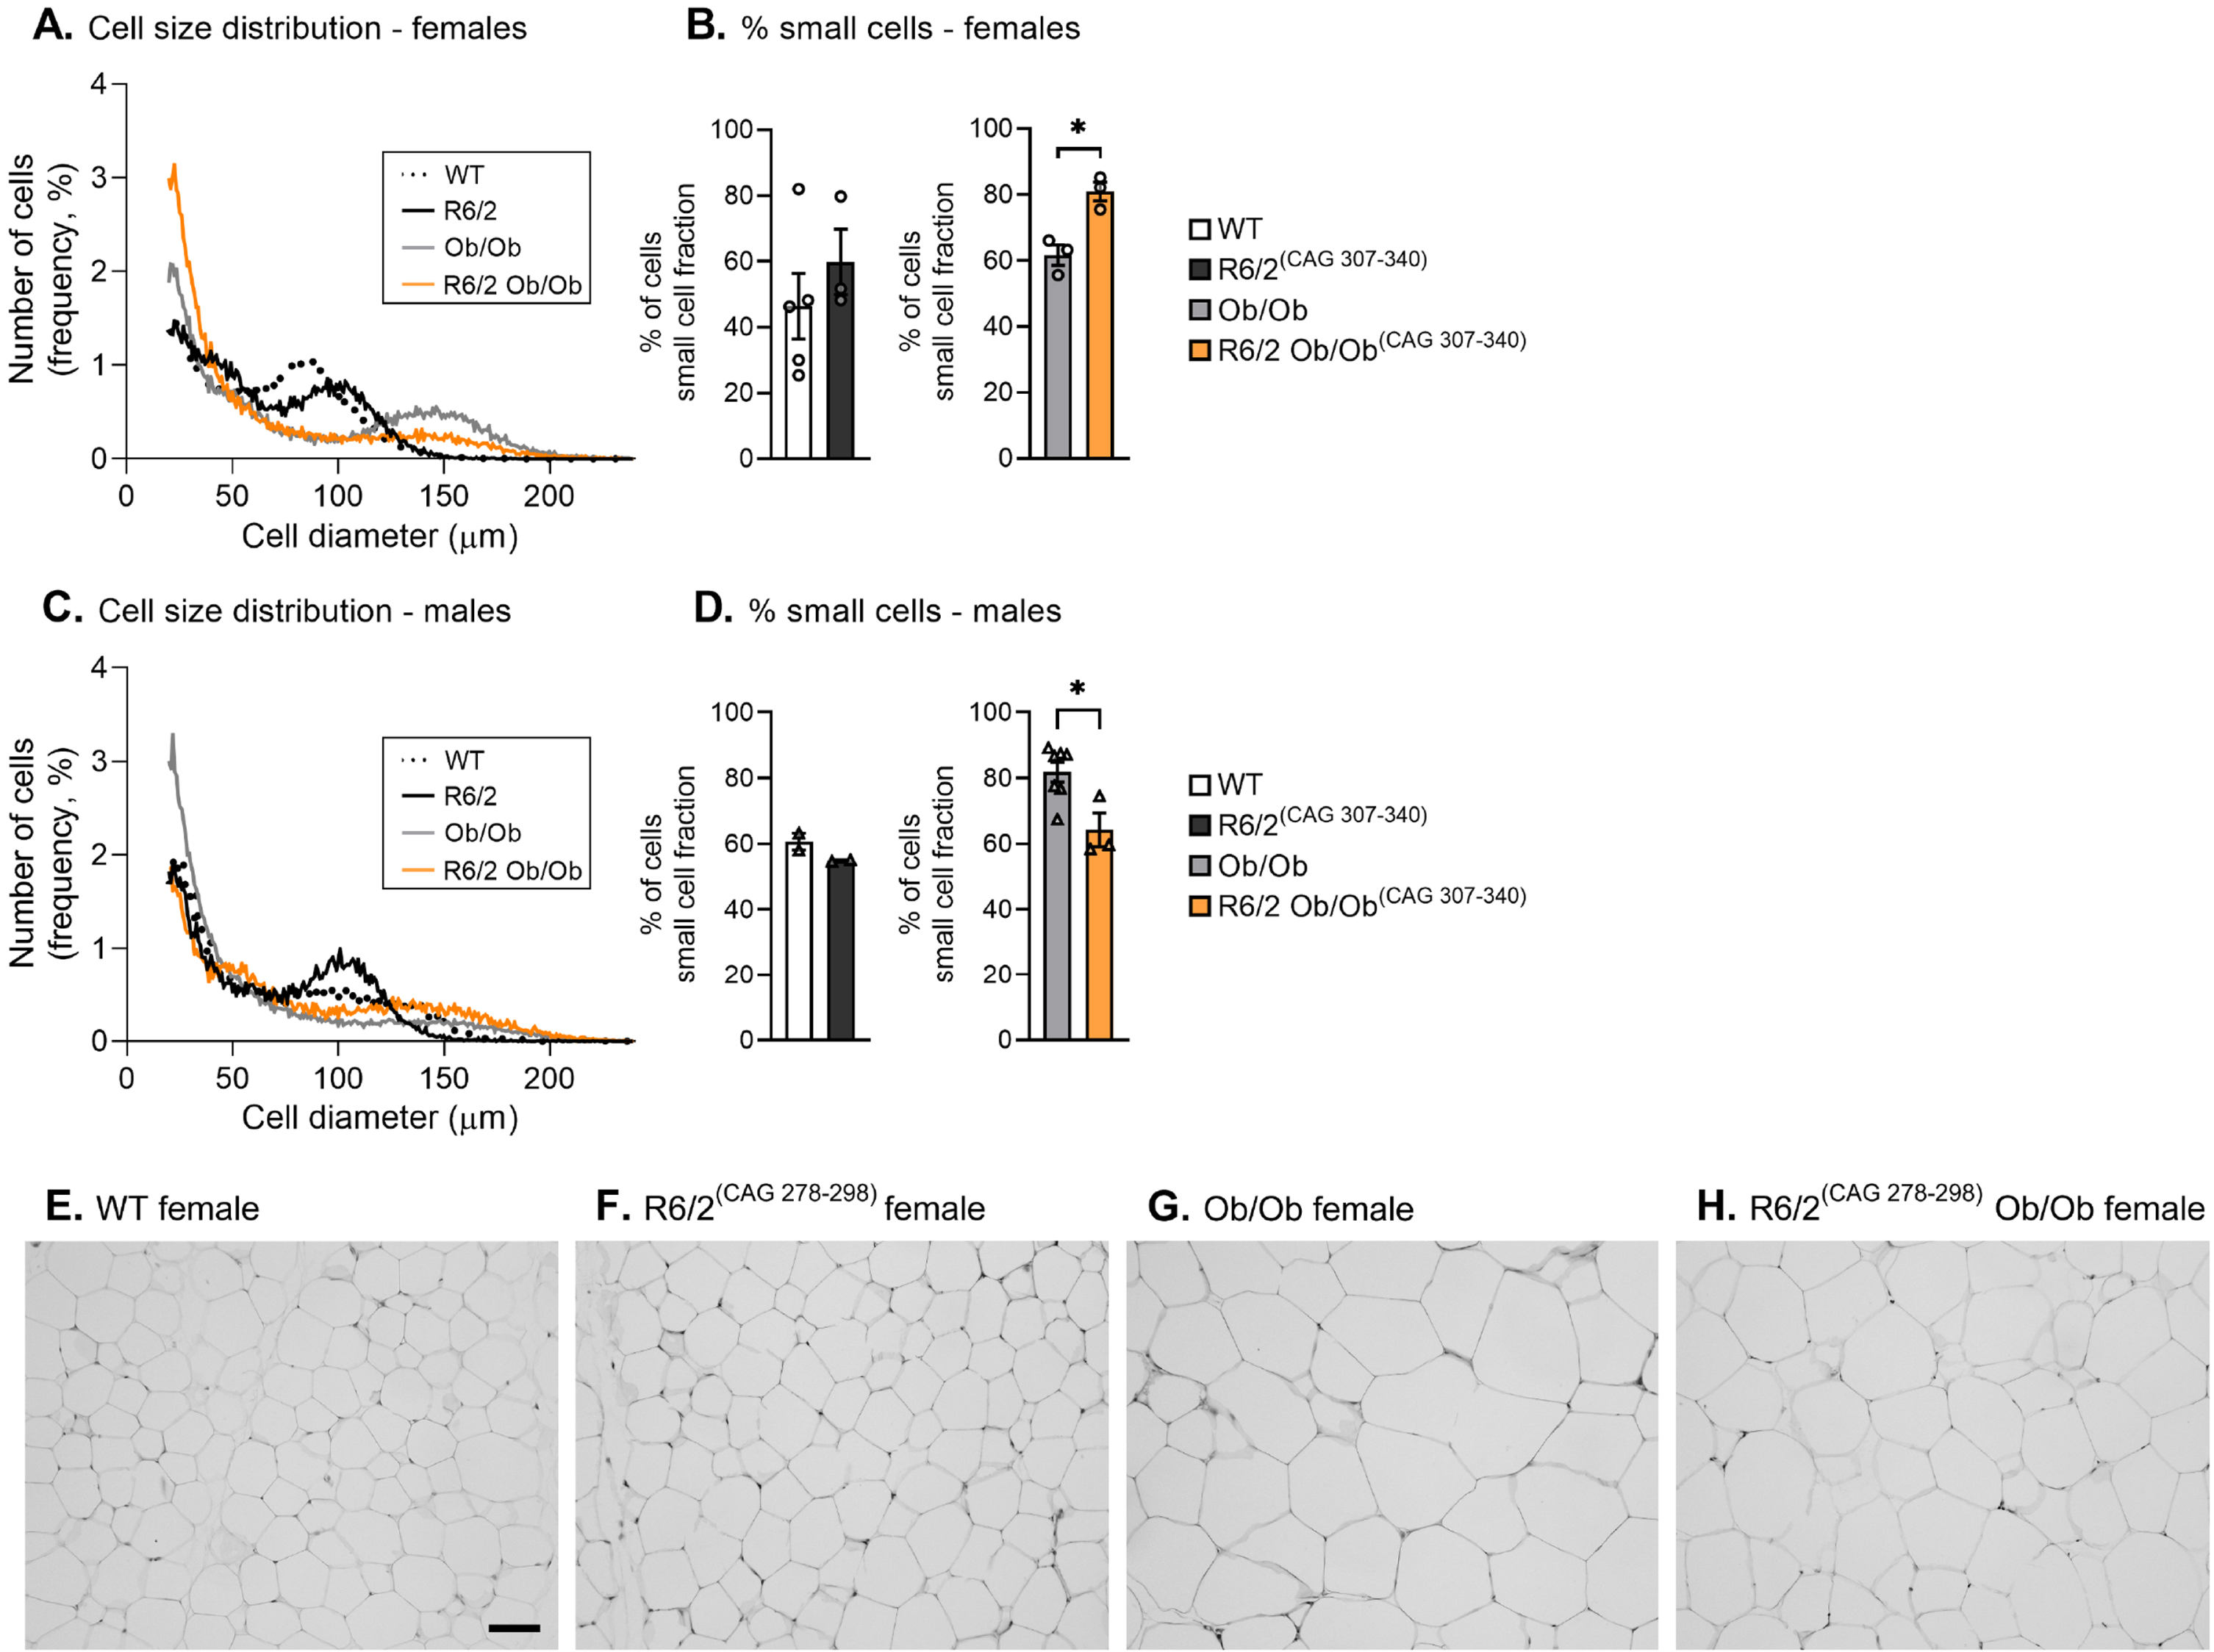
Taken together, while the gWAT mass was similar in all mice groups comparing R6/2 with respective controls at 12 weeks of age, we found shifts in the gWAT cell size distribution which could reflect early changes in adipose tissue metabolism.
Altered lipolysis in gWAT is not a feature preceding weight loss in R6/2 mice
We next performed functional analyses in gWAT to assess whether its regulation of lipid- and glucose metabolism, functions to maintain energy balance [43], was a feature preceding or contributing to weight loss in R6/2 and leptin-deficient R6/2 mice. Defects in isoprenaline-stimulated lipolysis have previously been shown in gWAT of R6/2 mice [19, 26], and Ob/Ob mice are genetically deficient in leptin that plays a central role in the lipolytic response mediated by the β-adrenergic system [44–46].
Lipolysis was assessed in cell suspensions from gWAT using two strategies: 10 nM isoprenaline and 10 nM isoprenaline combined with 10 nM insulin, in which insulin should mediate an inhibitory action on lipolysis [47, 48]. Stimulation with isoprenaline caused a significant increase in glycerol release for both WT and R6/2 females (Fig. 3A). Expressing the glycerol release as the % change (stimulatory effect of isoprenaline or inhibitory effect of insulin) showed no significant difference between WT and R6/2 females (Supplementary Figure 7A).

Isoprenaline-stimulated lipolysis in female and male gonadal WAT at 12 weeks of age. Cell suspensions isolated from the gWAT were either unstimulated (basal) or stimulated with isoprenaline or isoprenaline in combination with insulin. Statistical comparison was made within each genotype to compare the simple effect of treatment. A) In R6/2 females compared to WT females, there was a significant effect from genotype and treatment on lipolysis (Two-way ANOVA: genotype (F (1,33) = 15.54, p = 0.0004) and treatment (F (2,33) = 16.31, p < 0.0001), in which R6/2 females displayed significantly higher response to stimulation with isoprenaline. B) Lipolysis was low in Ob/Ob and leptin-deficient R6/2 females. C) In R6/2 males compared to WT males, there was a significant effect from treatment but not genotype (Two-way ANOVA: treatment (F (2,24) = 21.10, p < 0.0001). D) Similar to leptin-deficient females, there was no effect on lipolysis in leptin-deficient male mice. Mean±SEM. *p<0.05. Basal, untreated cells;+Iso, treatment with 10 nM isoprenaline;+Iso+Ins, combined treatment with 10 nM isoprenaline and 10 nM insulin; gWAT, gonadal white adipose tissue; R6/2;Ob/Ob, leptin-deficient R6/2 mice.
Next, we assessed leptin-deficient R6/2 females in comparison to Ob/Ob females. Leptin-deficiency in R6/2 altered the effect on lipolysis to a markedly diminished lipolysis in all conditions assessed (Fig. 3B). Overall, the lipolytic response in leptin-deficient R6/2 females was comparable to the response previously found for Ob/Ob mice [45].
For male mice, the lipolytic response (Fig. 3C) and the lipolytic effect of stimulation with isoprenaline combined with insulin (Supplementary Figure 7B) were similar between R6/2 and WT male mice in all conditions assessed. As observed for the female groups, the lipolytic response in leptin-deficient R6/2 males was comparably low to Ob/Ob mice with no significant impact from isoprenaline stimulation (Fig. 3D). Taken together, we found that lipolysis is unaltered in gWAT in R6/2 mice prior to weight loss. Induced leptin-deficiency through the R6/2;Ob/Ob crossbreed reduces lipolysis comparably to Ob/Ob mice, a feature that is present in both sexes.
Insulin-stimulated glucose uptake in gWAT is intact in R6/2 mice prior to weight loss
Insulin regulates glucose uptake in muscles and adipocytes by stimulating Glucose transporter type 4 (GLUT4) translocation to the plasma membrane to facilitate glucose uptake [49, 50]. R6/2 mice have been shown to develop hyperglycaemia and insulin resistance [51, 52]. We therefore assessed the uptake of tracer glucose (D-14 C(U)-glucose) in cell suspensions isolated from gWAT after stimulation with 10 nM insulin.
Leptin-deficiency reduced basal and insulin-stimulated glucose uptake in leptin-deficient R6/2 of both sexes, and overall comparably to results obtained in Ob/Ob mice (Fig. 4A, B; Supplementary Figure 8). In WT and R6/2 mice, stimulation with insulin increased glucose uptake (Supplementary Figure 8), but there was no significant difference in the magnitude of response for R6/2 compared to WT mice (Fig. 4A, B). However, at 12 weeks we observed a higher variability in insulin-stimulated glucose uptake for R6/2 males than females, and we found that respectively 35% and 43% of the variation in insulin-stimulated glucose uptake in gWAT of WT and R6/2 mice could be explained by the proportion of small adipocytes (Fig. 4C) and gWAT mass (Fig. 4D). Assessment of fasting serum glucose levels showed that there was no difference between WT and R6/2 or Ob/Ob and leptin-deficient R6/2 mice at this time point (Supplementary Tables 2 and 3).
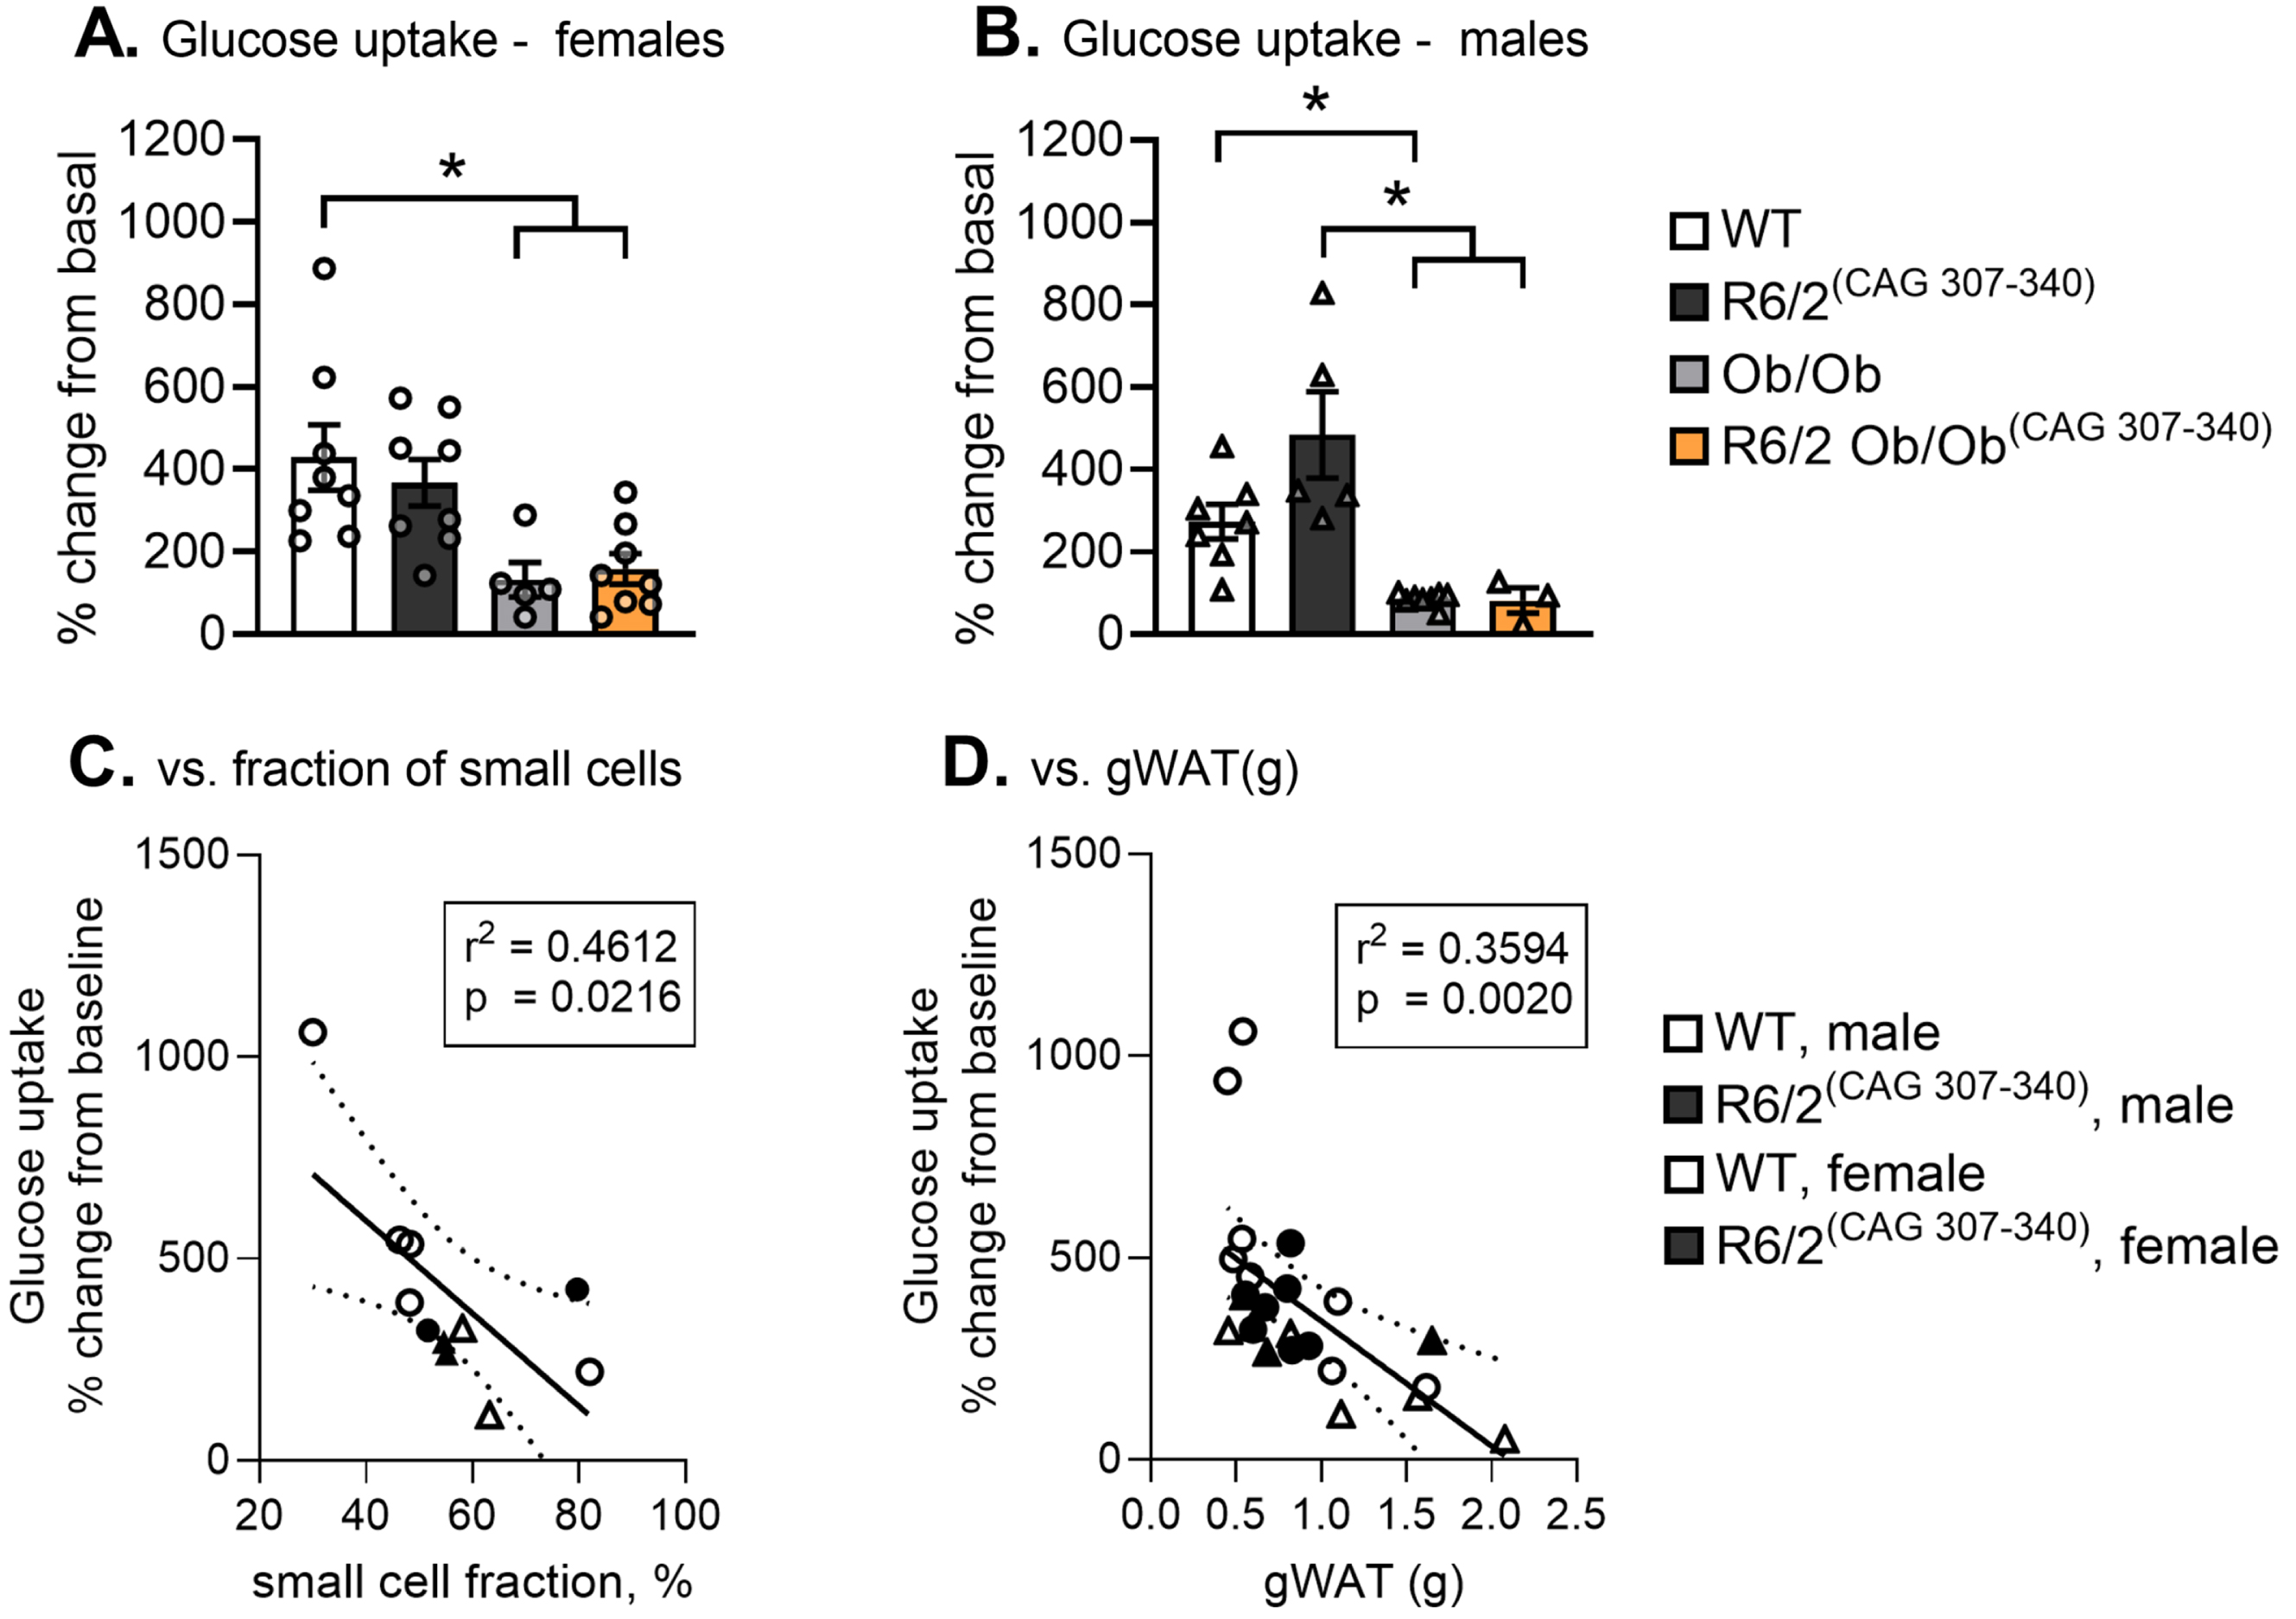
Taken together, we found that while the capacity of insulin to stimulate glucose uptake is intact in R6/2 mice prior to weight loss, R6/2 males in the present cohort exhibit higher variability in the response. Glucose metabolism in leptin-deficient R6/2 mice is comparably low and reminiscent of Ob/Ob mice.
Subtle gene expression changes in gWAT of R6/2 mice prior to weight loss
Transgenic expression of mHTT in mature adipocytes (3T3-L1 cell line) causes alterations in key adipocyte genes [22], indicating a direct effect of mHTT on the adipose tissue transcriptome. We therefore performed gene expression analysis in 12-week-old R6/2 and age-matched WT mice of both sexes. Candidate genes were associated with adiposity, WAT browning, lipolysis, fatty acid metabolism and/or linked to weight loss in HD animal models [22, 53–59]. We only detected subtle alterations in gene expression, such as an effect of the R6/2 gene on Adiponectin (Two-way ANOVA: R6/2 gene F (1, 25) = 7.423, p = 0.0116), an increase in Adipose triglyceride lipase (Atgl) in R6/2 males (mean difference 0.8863±0.7698 vs. WT males) and Insulin-like growth factor 1 (Igf-1) in R6/2 females compared to WT females (Mann-Whitney test: p = 0.0176, Kruskal-Wallis test: p = 0.2064) (Fig. 5).

DISCUSSION
In clinical HD and animal models, there are alterations in metabolism, and mechanisms underlying metabolic changes may contribute to the disease progression [6, 60–74]. The disease-causing HTT protein is expressed ubiquitously, and metabolic changes may therefore originate from both central and peripheral pathology [10, 11]. There are multiple studies that support a role for HTT in controlling both body weight and energy metabolism. For example, the YAC18 model of HD that expresses a wild-type full-length HTT transgene exhibits dose-dependent increases in body weight [75]. Also, transgenic short-fragment expression models like the R6/2 mice are associated with a catabolic energy state and weight loss that can be linked to both mHTT-mediated central- and peripheral pathology ([14, 66] and reviewed in [10]). As the major organ for energy storage, WAT controls systemic energy availability for other tissues. During early stages, R6/2 mice can exhibit higher adiposity relative to body weight and disproportional leptin levels to WAT mass [19, 22]. Furthermore, R6/2 male mice with reduced body weight, has an upregulation of pro-browning genes such as peroxisome proliferator-activated receptor alpha (Pparα) and an indication of BAT-like features in WAT [26]. Functionally, this would promote higher energy expenditure and could therefore be linked to later weight loss and energy deficits. Ob/Ob mice are leptin-deficient and exhibit increased food intake and reduced energy metabolism resulting in increased body weight and fat mass [76]. We have previously shown that both male and female R6/2 mice on a leptin-deficient background exhibit a dramatic weight gain and increased fat mass resembling leptin-deficient Ob/Ob mice [20]. Indirect calorimetry measured in leptin-deficient male R6/2 mice showed that body weight and fat gain were further accompanied by altered whole body metabolism comparable to Ob/Ob mice, with reduced oxygen consumption and activity levels [20]. Despite this close resemblance to Ob/Ob mice, leptin-deficient R6/2 mice, similarly to R6/2 mice, progress to weight loss as phenotypic changes progress [20]. As adipose tissue function is a critical determinant for systemic energy homeostasis and weight regulation [77], disease stage-specific adipose tissue changes may contribute to the shift from weight gain to weight loss in leptin-deficient R6/2 mice [20].
Here in this study, we wanted to examine if we could detect changes in WAT characteristics and function preceding weight loss and onset of HD phenotype. We here show that leptin-deficient R6/2, similarly to Ob/Ob mice exhibit significantly higher weights of both visceral (gWAT) and subcutaneous (iWAT) depots, and significantly diminished hormone response that are involved in regulating energy storage and release (lipolysis and glucose uptake) compared to R6/2 and WT mice. Leptin-deficient R6/2 females, at the time point assessed, had started to lose weight, and this weight loss was accompanied with proportionally reduced iWAT but not gWAT weight. The visceral WAT depots, such as gWAT, are one of the largest energy reservoirs in mice and the type of depot most strongly associated with metabolic disturbances [29, 78–82]. In a model of diet-induced body weight gain, subcutaneous and mesenteric WAT expands progressively with body weight while the expansion of gWAT starts to diminish with higher (>40 g) body weight, and this limited expandability of gWAT was accompanied by ectopic fat deposition [83]. During prolonged states of energy excess, such as in diet-induced obesity or in the present study leptin-deficiency, adipocytes can dynamically adapt by expanding through hypertrophy (increased size) or hyperplasia (increased numbers) [30, 84–86]. Using histology to capture the cellular heterogeneity in WAT is prone to sampling bias and observational bias, that not only makes it difficult to be representative of the given WAT sample but also inter-individual variability [87, 88]. The hypertrophic expansion in leptin-deficient mice can be readily detectable by histological analysis (as exemplified in Fig. 2), however subtle inter-individual variability, particularly for the small adipocyte populations, becomes complex. Therefore, in the present study we utilized the Coulter counter that, unlike histology, captures cell size distribution of a wide range from small to very large adipocytes [30–33]. Moreover, we found notable inter-individual variability in the bimodal cell size distribution between mice that were of similar age, genotype and distribution of fat weights, that further highlights the limitations of acquiring representative data using histological analysis. Shifts in cell size distribution may contribute to the diversity of the obesity phenotype and in turn obesity-related complications between individuals. Numerous studies have addressed the importance of adipocyte size and systemic metabolic health, both accumulation of hypertrophic adipocytes as well as impaired capacity to expand small adipocytes are found in pathophysiological conditions such as altered insulin sensitivity, altered glucose homeostasis, diabetes, and visceral- and ectopic fat accumulation [30–32, 89–94]. Characterization of gWAT in leptin-deficient R6/2 mice showed a shift in cell size distribution towards a higher proportion of small cells, which could be related to increased energy demand in other tissues (which then leads to adipocyte shrinkage) or a compensatory mechanism recruiting new adipocytes. While we on the group level found indication of increased adipocyte size in female R6/2 compared to WT, there was variability in individual mice. More observations will be needed to draw conclusions of this feature in R6/2 mice. Strikingly, alteration in adipocyte size was distinct in male and female mice, suggesting sex-specific differences, possible in a temporal fashion.
We further found a significant inverse correlation between glucose uptake and cell size distribution (proportion of small adipocytes) in gWAT. However, there was no significant difference in glucose uptake between leptin-deficient R6/2 and Ob/Ob mice, nor did we find any significant impact on systemic fasting glucose levels at the time of sacrifice. To fully visualize the adipocyte population dynamics and its effect on energy homeostasis, cell size distribution should be assessed in both subcutaneous and visceral depots [90]. The current study is limited by the focus on gWAT depot characteristics. We here chose gWAT, since gWAT is most strongly associated with metabolic disturbances [32, 96]. Further studies are needed to understand adipocyte population dynamics in-depth. Given that WAT is a dynamic tissue, it is not clear whether changes in cell size distribution in the visceral adipose tissue depot detected here reflect prior events or ongoing events. In mouse models of diet-induced obesity (high-fat diet feeding), it has been shown that adipocyte hypertrophy occurs immediately upon starting high-fat diet feeding, and the recruitment of new adipocytes is delayed to 3–4 days [97, 98]. Therefore, the underlying mechanisms of the shifts in cell size distribution observed here for R6/2 and leptin-deficient R6/2 mice need to be elucidated in more cohorts and more widespread time points. The leptin-deficient R6/2 mice are a complex mouse model that is impacted by both early obesity (Ob/Ob) and mutant HTT expression (R6/2), and therefore WAT characterization may need to be performed during much earlier time points, when body weight and fat accumulation is not as prominent as in the present study.
We also found subtle differences in WAT characteristics comparing R6/2 males and females. Estrogen influences WAT function and plays a role in pathophysiological states such as insulin sensitivity [95–97]. The impact of sex hormones on adipose function was illustrated in a study where castration caused increased adipocyte size in female but not male mice, and differentially affected cellular insulin sensitivity and lipid metabolism [99]. Thus, sex-specific differences add a layer of complexity to leptin-deficient R6/2 mice. It should be noted that, in this study, we have chosen a time-point early in the R6/2 pathology and before the previously described overt hypothalamic gonadal axis alterations [100].
In the present study, we only found subtle molecular and functional changes in R6/2 mice compared to WT. It has previously been found that R6/2 mice exhibit a significantly altered response to isoprenaline, decreased adipose cell area and higher quantity of small adipocytes [20, 26]. That we in this study do not find lipolysis differences in between groups compared to previous studies [19] could be due to differences in the experimental setup, such as the treatment duration. Furthermore, the length of CAG repeat in R6/2 is known to modify rate of disease progression [34] and could here also contribute to results differing from previous studies.
R6/2 mice display severe peripheral pathology which may partly be due to the direct expression of HTT in tissues, including the skeletal muscle, adipose tissue and liver [10, 22]. Notably, all three tissues are key for maintaining whole-body energy balance. As observed in the 16-week-old cohort of R6/2 mice, the reduced body weight was not accompanied by significant changes in gWAT or iWAT mass. The weight loss phenotype in R6/2 mice has been linked to severe muscle atrophy/wasting [51, 102]. Although we here focused on characterizing adipose tissue, inter-organ crosstalk plays a significant role in metabolic dysfunction [103], and adipose tissue dysfunction would severely affect skeletal muscle due to its dependence on fatty acids for energy consumption, particularly during exercise [104–107]
In conclusion, we show that subtle changes in the gWAT precede weight changes in the R6/2 model of HD. During states of hyperphagia and obesity induced by genetic leptin-deficiency, R6/2 mice show shifts in the distribution of small and large adipocyte populations in the visceral gWAT depot, which may be reflective of underlying events leading up to weight loss. Whether such changes relate to direct effects in the adipose tissue or a more systemic influence (e.g., skeletal muscle, ectopic fat deposition) on metabolic changes remains to be elucidated.
Footnotes
ACKNOWLEDGMENTS
The authors would like to thank Ann-Charlotte Selberg, Catarina Blennow and Susanne Jonsson at Lund University for excellent technical assistance.
FUNDING
The project was supported by grants from Vetenskapsrådet (2017-01080, 2021-00986; Maria Björkqvist and 2019-00978; Karin G. Stenkula).
CONFLICT OF INTEREST
The authors have no conflict of interest to report.
DATA AVAILABILITY
The data supporting the findings of this study are available within the article and/or its supplementary material or available on request from the corresponding author.