
Abstract
Background:
Huntington’s disease (HD) is an autosomal dominant, progressive neurodegenerative disorder debilitating mainly in adults.
Objective:
This study aimed to assess the trends in HD-related mortality regarding various demographic factors.
Methods:
Death certificates from the CDC WONDER were studied from 1999 to 2019, for HD-related mortality in adults aged 25 + years. Age-adjusted Mortality Rate (AAMR) per 100,000 persons and Annual Percentage Change (APC) were calculated and stratified by year, age groups, gender, race/ethnicity, state, census region, urbanization, and place of death.
Results:
Between 1999 to 2019, 22,595 deaths occurred in adults due to HD. The AAMR increased from 0.43 to 0.54 during this period (APC = 0.50; 95% CI: 0.18 to 0.84). Old adults (65–85 + years) had the highest overall AAMR, followed by middle-aged adults (45–64 years) and young adults (25–44 years) (AAMR old: 1.01 vs. AAMR middle-age: 0.68 vs. AAMR young: 0.16). Men had slightly greater overall AAMRs than women (AAMR men: 0.54 vs. AAMR women: 0.48). When stratified by race, non-Hispanic (NH) Whites had significantly higher mortality rates than NH African Americans (AAMR NH White: 0.61 vs. NH African American: 0.35), while the AAMR were lowest in Hispanic/Latino (0.28). The AAMRs also showed variation by region (overall AAMR: Midwest: 0.63, Northeast: 0.47, West: 0.48, South: 0.46), and non-metropolitan areas had higher HD-related AAMR (0.66) than metropolitan areas (0.47).
Conclusions:
HD-related mortality in US adults has increased since 1999. Reflecting on the variations in trends observed, new strategies are required to optimize the quality of care in long-term care facilities.
Keywords
INTRODUCTION
Huntington’s disease (HD) is a neurodegenerative, autosomal dominant disorder that affects adult patients usually in their late thirties or forties and their clinical condition gradually progresses to death.1, 2 According to a study by the European Huntington’s Disease Network (2017), 3 the median survival from symptom onset to death was 35 years (95% CI: 29.2–40.8 years), and that from motor diagnosis to death was 24 years (95% CI: 20.8–27.2 years). Reportedly, the most frequent cause of death was pneumonia (19.5%), followed by other infections (6.9%), suicide (6.6%), cancer (3.4%), stroke (2.6%), and trauma (0.9%). Regarding place of death, the most common location was the hospital (29.8%), while the least number of deaths occurred in hospice care facilities (3.3%). 3
Studying the mortality trends of HD over the past two decades is an essential step in obtaining valuable insights regarding the population subsets at the highest risk. This will pave a path toward the development and improved efficacy of different, targeted treatments, interventions, and standards of care. Therefore, in this study, we sought to evaluate demographic and regional differences in HD-related mortality from 1999 to 2019 within the United States. To our knowledge, this is the first HD mortality analysis, based on the CDC WONDER database, for the specified time duration. In presenting this analysis, we also hope to serve as a baseline for future studies, focused on exploring potential shifts in the disease’s mortality rate.
MATERIALS AND METHODS
Study setting and population
The Centers for Disease Control and Prevention Wide-Ranging Online Data for Epidemiologic Research (CDC WONDER) database provides mortality data for the U.S. population through death certificates for 50 states and the District of Columbia. 4 This information is categorized by age, race, gender, state, county, and geographical region and has been previously used to analyze the trends of various neurological diseases. 5 In this retrospective observational study, data pertaining to the annual occurrence of HD-related deaths were extracted to analyze trends among adults in the US, during 1999–2019. The Multiple Cause of Death Database was used to extract data for HD-related deaths mentioned either as a primary or contributing cause of death, anywhere on the death certificate. We defined the ‘primary cause of death’ as the most probable reason for the decedent’s death and ‘contributing cause of death’ as any other diseases or conditions linked to death, regardless of the sequence in which the terms were mentioned on the death certificates.6, 7
The International Classification of Diseases 10th Revision (ICD-10) code G10 was used to include all deaths related to HD in individuals aged≥25 years; the same ICD code has previously been described in other administrative databases to identify HD. 8 The mortality for the below 25 years age range was found to have low statistical power (≈12 cases per year; total 253 in 21 years), which would cause dilution of our results and that range was thus excluded. Previous studies analyzing CDC WONDER data have used a similar age range to represent adult populations. 9 Since the data used are publicly available by the government and present de-identified information, no informed consent or ethical committee approval was required for conducting the study. 10 This analysis was conducted in accordance with the Strengthening the Reporting of Observational Studies (STROBE) guidelines for reporting. 11
Data abstraction
We collected data for population size, year, age, gender, race, urbanization, census region, and place of death for all HD-related deaths for each year from 1999 to 2019. Race/ethnicity was classified as follows: Non-Hispanic (NH) White, NH Black or African American, Hispanic or Latino, NH American Indian or Alaskan Native, and NH Asian or Pacific Islander. 7 The data for NH Alaskan Native and NH Asian populations could not be included due to unreliability or suppression of the age-adjusted mortality rates (AAMR) as quoted by CDC WONDER. The following age groups were defined: 25–34, 34–44, 45–54, 55–64, 65–74, 75–84, 85 + years. We divided the data into three age group categories: young adults (25–44 years), middle-aged adults (45–64), and old adults (65–85+) for the analysis by age. 12 Place of death data were divided into medical facility, decedent’s home, hospice facility, or nursing home/long-term care center. For urban-rural classifications, statistics from the National Centre for Health Urban-Rural Classification Scheme were used to sort the population into urban (large metropolitan area [population≥1 million], medium/small metropolitan area [population 50,000–999,999]) and rural (population < 50,000) counties per the 2013 U.S. census classification. 13 Regions were defined as per the US Census Bureau definitions as Northeast, Midwest, South, and West. 14
Statistical analysis
To allow for a descriptive analysis of HD-related mortality trends spanning 1999–2019, crude mortality rates (CMRs) and age-adjusted mortality rates (AAMRs) per 100,000 population were calculated for sociodemographic variables such as age, gender, ethnicity/race, and urban/rural status. We calculated AAMR by standardizing HD-related deaths to the year 2000 U.S. population and where appropriate, reported 95% confidence intervals (CIs) as well. 14 To determine any significant changes in AAMR over time, the associated annual percent changes (APCs) were computed with 95% CI in AAMR, using the Join-point Regression Program.15, 16 Year was used as the independent variable in all analyses, while age, gender, race/ethnicity, geographical region, and urbanization status were used as by-variables in separate analyses. The APC was derived for a set interval specified by two joinpoints. The software calculated a weighted average of slope coefficients, where each segment’s weight corresponds to its length relative to the total interval. This weighted average slope is then transformed into an APC, summarizing the trend concisely over the specified period. The method for calculating APC and its 95% CI from their weighted average slopes is described elsewhere.15, 17 This method utilizes log-linear regression models at instances of temporal changes to detect noteworthy alterations in AAMR trends. The APCs are dichotomized as either increasing or decreasing by examining if the slope describing the change in mortality rates demonstrates significant deviation from the zero. Where a significant variation occurs, a “joinpoint” is introduced. A two-tailed p-value<0.05 was considered significant in all cases.
RESULTS
A total of 22,595 HD-related deaths occurred between 1999 and 2019. The number of deaths due to HD was 771 in 1999 and 1,355 in 2019. The overall AAMR increased from 0.43 (95% CI = 0.40 to 0.46) in 1999 to 0.54 (95% CI = 0.51 to 0.56) in 2019 (APC; 0.50; 95% CI: 0.18 to 0.84). See Supplementary Tables 1 and 2. Information for the place of death was available for 21,627 deaths while 968 (4.3%) of deaths were listed as others or unknown. Of these, 51.4% occurred in nursing homes/long-term care facilities, 20.0% occurred at the decedent’s home, 20.3% at medical facilities, and 4.0% at hospice facilities. See Supplementary Table 9.
HD-related deaths stratified by age
The trend for HD-related deaths was consistently highest in older adults (overall AAMR: 1.01; 95% CI: 0.99 to 1.03, APC: 0.74; 95% CI: 0.34 to 1.18) throughout the study period. We also observed considerably lower mortality rates in young adults which remained steady (overall AAMR: 0.16; 95% CI: 0.15 to 0.16; APC: 0.13; 95% CI: –3.64 to 3.93) when compared to middle-aged adults in whom there was a rise in AAMRs from 1999 to 2019 (overall AAMR: 0.68; 95% CI: 0.67 to 0.69, APC: 0.45; 95% CI: 0.02 to 0.90). See Fig. 1 and Supplementary Tables 2 and 3.
Huntington’s disease-related AAMRs stratified by age per 100,000 US population (1999–2019). *p < 0.05.
HD-related AAMR stratified by gender
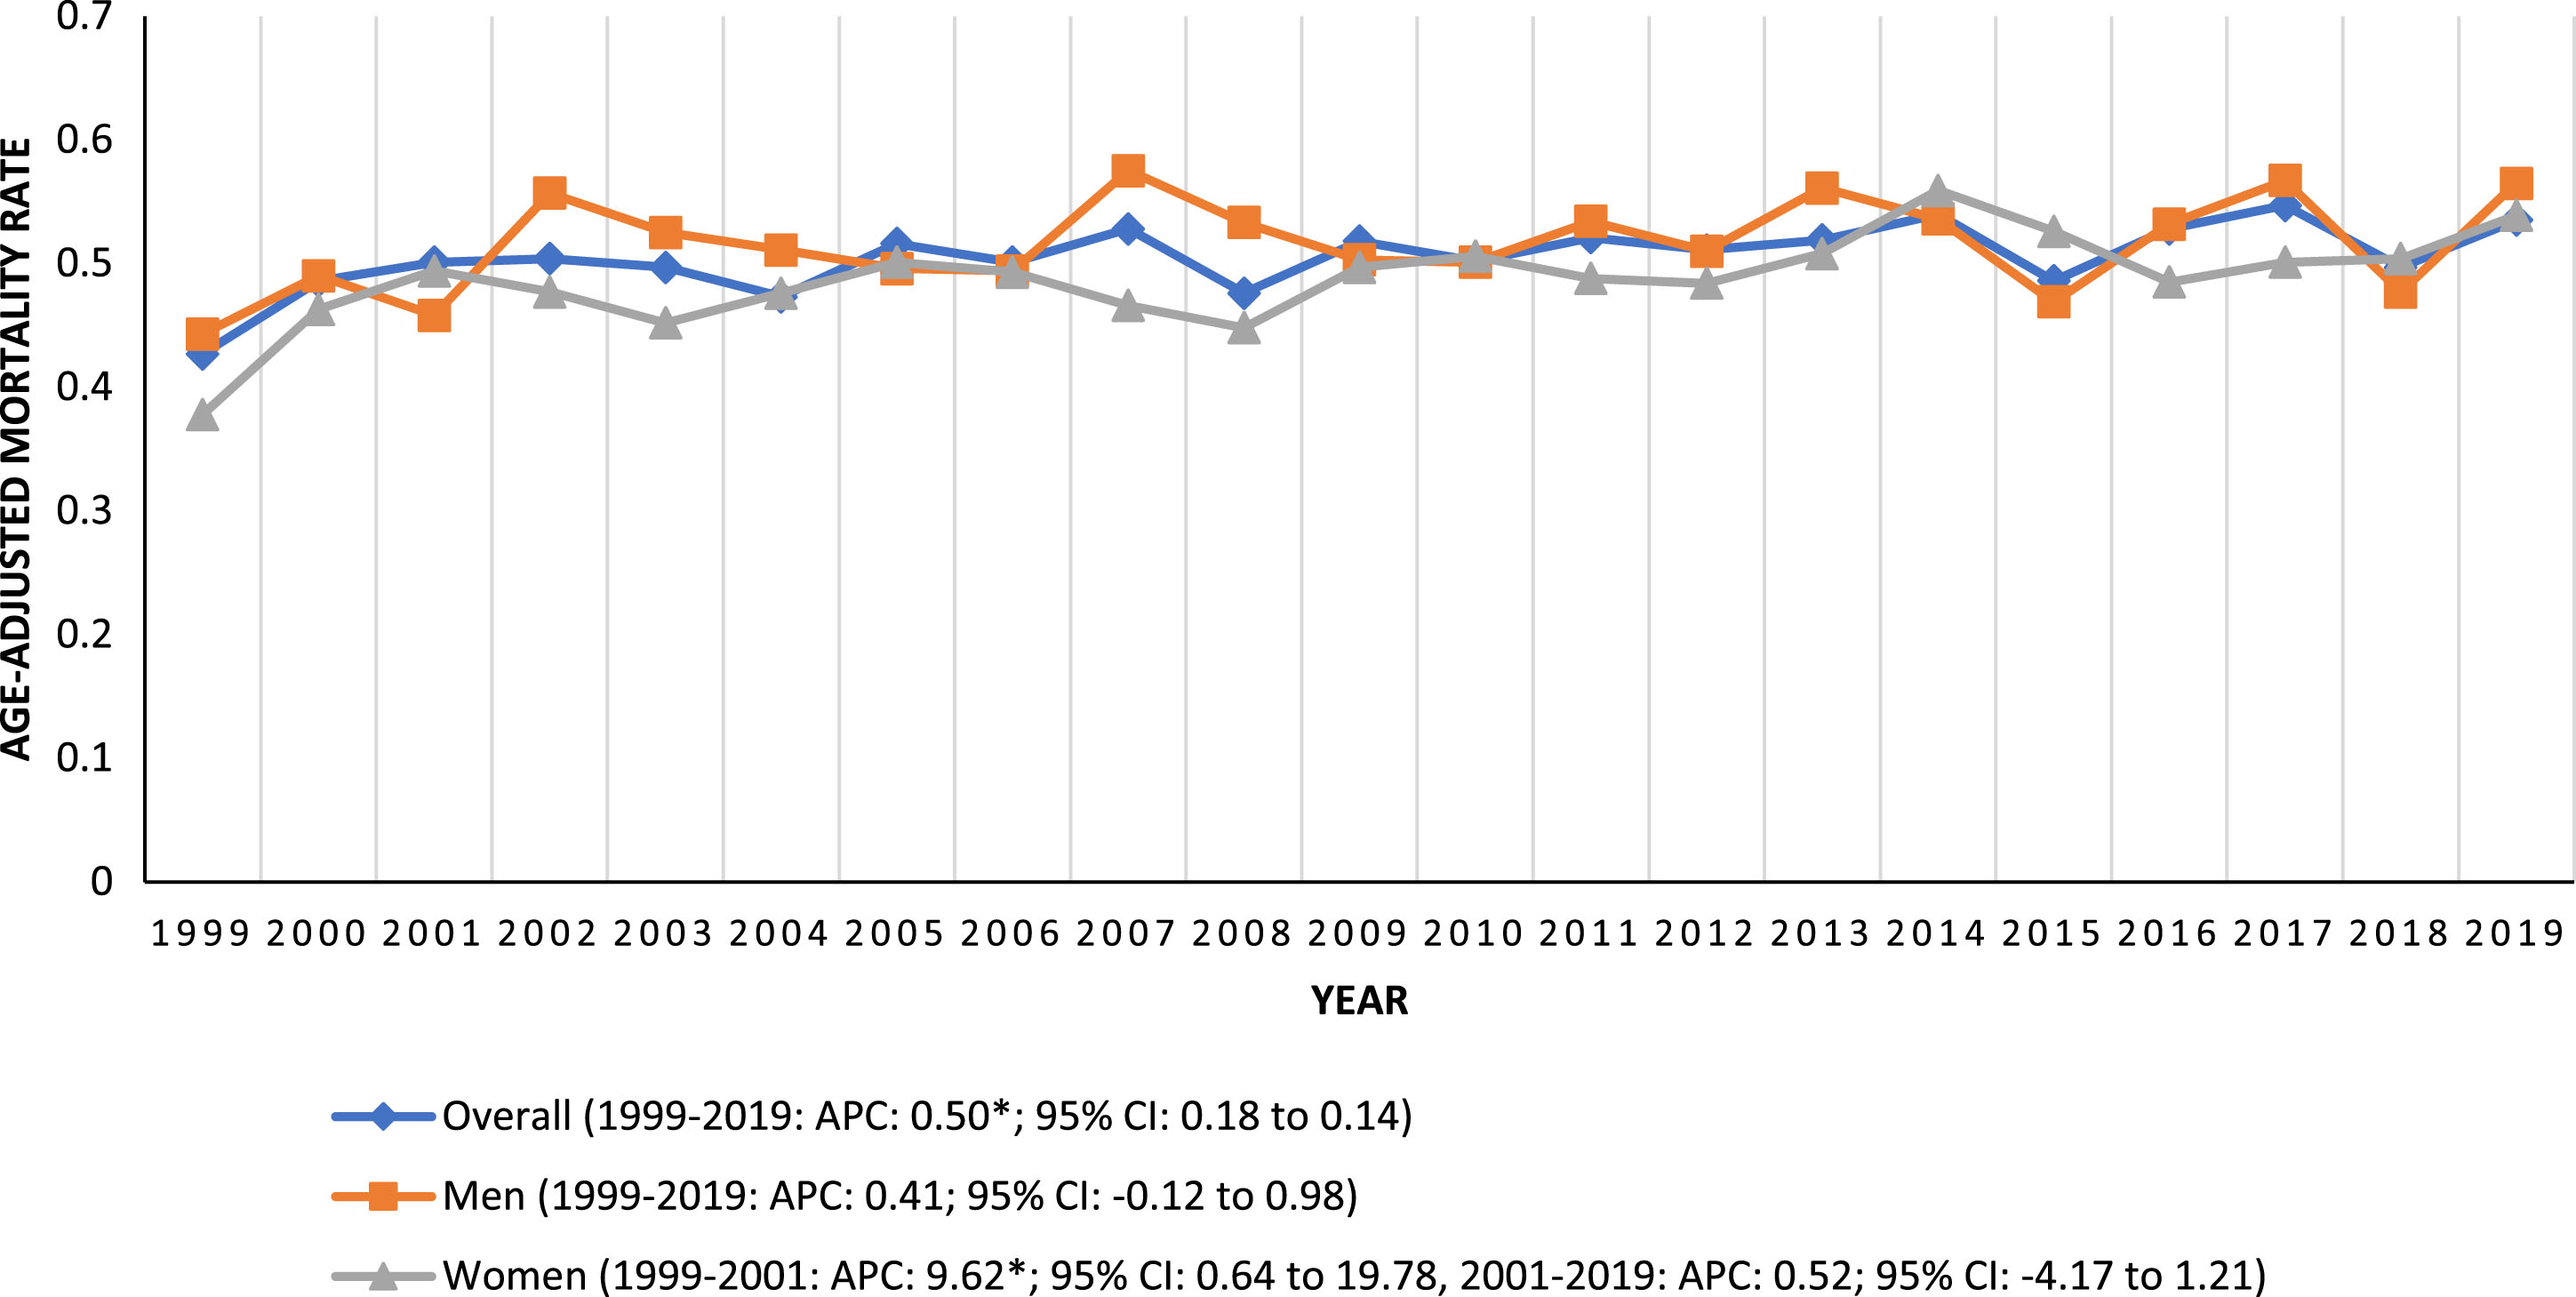
The HD-related AAMRs were generally higher in men than in women. However, the mortality rate for men remained stable throughout the 21 years while the mortality rates for women demonstrated two segments. Initially, a steep rise from 1999 to 2001 and then a stable period afterward till 2019 (Men: overall AAMR: 0.54; 95% CI: 0.53–0.55; APC: 0.41; 95% CI: –0.12 to 0.98, Women: overall AAMR: 0.48; 95% CI: 0.47–0.49; 1999–2001: APC: 9.62; 95% CI: 0.64 to 19.78, 2001–2019: APC: 0.52; 95% CI: –4.17 to 1.21). See Fig. 2 and Supplementary Table 4.

Huntington’s disease-related AAMRs per 100,000 stratified by gender, 1999–2019. *p < 0.05.
HD-related AAMR stratified by race/ethnicity
When stratified by race/ethnicity, AAMRs were consistently highest among NH White patients followed by NH Black or African American and Hispanic or Latino (overall AAMR NH White: 0.61; 95% CI: 0.60–0.61, NH Black or African American: 0.35; 95% CI: 0.33–0.37, Hispanic or Latino: 0.28; 95% CI: 0.26–0.29). All three ethnic groups showed an overall increasing trend, but we observed two segments for NH Whites. Initially, a steep rise in AAMR from 1999 to 2002, followed by a period of stability till 2019. Moreover, the highest overall slope for mortality rates was observed for NH Blacks, followed by Hispanics or Latinos and NH Whites. (NH Black or African American: APC: 1.97; 95% CI: 1.07–3.01, Hispanic or Latino: APC: 1.41; CI: 0.17–3.09, NH White: 1999–2002: APC: 4.84; 95% CI: 1.07–11.49, 2002–2019: APC: 0.61; 95% CI: –0.68 to 0.94). See Fig. 3 and Supplementary Table 5.

Huntington’s disease-related AAMRs per 100,000 stratified by race, 1999–2019. *p < 0.05.
HD-related AAMR stratified by geographic region
States that fell into the top 90th percentile were Indiana, Vermont, Montana, Iowa, West Virginia, and Nebraska, which had AAMRs greater than double that of those that fell below the 10th percentile: Nevada, New Mexico, Florida, Hawaii, the District of Columbia (See Supplementary Figure 1 and Supplementary Table 6).
On average, throughout the study period, the highest mortality was observed in the Midwestern region (overall AAMR: 0.63; 95% CI: 0.62–0.65), while the Northeast and West regions had approximately similar and slightly higher AAMR values than the South (Northeast: overall AAMR: 0.47; 95% CI: 0.46–0.49, West: overall AAMR: 0.48; 95% CI: 0.47–0.50, South: 0.46; 95% CI: 0.45–0.47). The AAMR for the Southern region displayed a fluctuating trend with an overall rise from 1999 to 2019. From 1999 to 2006, there was an increase in AAMR followed by a stable period till 2009. The AAMR rose again till 2014, followed by a fall in rates till 2019 (1999–2006: APC: 3.58; 95% CI: 2.49 to 6.30, 2006–2009: APC: –3.26; 95% CI: –5.77 to 0.41, 2009–2014: APC: 3.81; 95% CI: 2.08 to 8.16, 2014–2019: APC: –2.06; 95% CI: –4.77 to –0.56). Meanwhile, the North-eastern region showed two different segments. Firstly, a remarkable increase until 2002 (APC: 9.90; 95% CI: 3.49 to 24.26), followed by a period of stability until 2019 (APC: –0.11; 95% CI: –0.82 to 0.39). The AAMR for the Midwestern region increased significantly, when compared with the West region which showed a stable period from 1999 to 2019 (Midwest: APC: 0.76; 95% CI: 0.30 to 1.24, West: APC: 0.22; 95% CI: –0.26 to 0.72). See Fig. 4A and Supplementary Table 7.

Huntington’s disease-related AAMRs per 100,000 stratified by census region and urbanization in adults in the United States, 1999–2019. *p < 0.05.
HD-related AAMR stratified by urbanization
Nonmetropolitan areas had consistently higher HD-related AAMRs than metropolitan areas throughout the study period, with overall AAMRs of 0.66 (95% CI: 0.64–0.68) and 0.47 (95% CI: 0.47–0.48), respectively. AAMRs of both metropolitan and nonmetropolitan areas rose from 1999 to 2019, but the increment in metropolitan areas was much more gradual. AAMR of metropolitan areas increased from 0.42 (95% CI: 0.39–0.45) in 1999 to 0.50 (95% CI: 0.47–0.53) in 2019, whereas in nonmetropolitan areas it increased from 0.45 (95% CI: 0.37–0.52) in 1999 to 0.70 (95% CI: 0.61–0.79) in 2019. (Metropolitan: APC: 0.60; 95% CI: 0.20–1.03, Nonmetropolitan: APC: 1.40; 95% CI: 0.65–2.16). See Fig. 4B and Supplementary Table 8.
DISCUSSION
This descriptive epidemiological study was conducted to determine the trend in demographic factors associated with the mortality of patients with HD over the past two decades in the US, using the CDC mortality database. Several key findings are worth mentioning. First, HD’s mortality rates increased progressively from 1999 to 2019. The same holds for women, rural and urban populations of the US; however, the AAMRs were higher in men and non-metropolitan areas. Second, an increasing trend was observed for the three ethnicities that were included in our study, but the NH White population had the highest HD-related AAMR. Third, the older adults had significantly higher mortality rates than the other two age groups – being 1.5 times greater than the middle-aged adults, and 6.5 times that of the young adult population. Fourth, the greatest mortality rates were observed in the Midwestern US. Finally, the number of deaths occurring in nursing homes was remarkably higher than in any other setting.
The mortality rates associated with HD in our study were lower than those reported by Lanska et al., who analyzed the trends of HD-related deaths from 1971 to 1978 in the US (overall Annual AAMR: 2.12 per 1,000,000 population). 18 Not only that, but our analysis also depicted an increasing trend in mortality throughout our 21-year study duration, up until 2019. This is consistent with the trends observed in some European countries, including Spain (from 1999 to 2013) and Norway (from 1986 to 2015).19, 20 Although we analyzed a different period from the aforementioned studies, there is sufficient overlap to imply that the prevalence of HD has increased over time, reflected by an increase in mortality rates observed in these studies. This potential ‘rise in prevalence’ may be explained by the increased life expectancy in the US due to advancements in screening, diagnosis, reporting of cases, and better access to medical facilities. 21 As a greater number of individuals live to the age where the symptoms of HD manifest, the number of diagnosed cases has increased as well.
Moreover, the mortality rates were slightly lower for women than for men, despite the overlap between the two genders (See Fig. 2). Men and women differ in terms of the burden of the disease and the age of onset of HD. However, women were more likely to experience a faster disease progression, according to Zielonka et al.’s analysis of gender differences in HD in Europe. 22 This ‘small, but statistically significant and complex gender effect’ was linked to biological factors of an aggravating nature in women suffering from choreatic disorders, to hormonal and genetic factors, concurrent disorders, and medication use as well as to a negative correlation of HD severity with plasma testosterone in men. 22 On the contrary, Solberg et al. noted no significant difference in the age of death among HD-affected individuals based on gender, in Norway, from 1986 to 2015. 20 Both these points hold interesting implications when combined with our finding of the AAMRs for men being slightly higher than those for women. This could probably result from region-stratified population differences and the relative proportions of men and women with HD. However, another study in the US from 2003 to 2016 concluded that women had slightly higher HD prevalence rates than men, which is also contrary to our findings regarding mortality. 23 This disparity provides strong grounds for further research on the gender differences associated with HD-related mortality in the future.
Regarding age, older adults had the highest mortality rate followed by middle-aged adults in comparison to the overall HD population (Old adults: 1.01, Middle-age: 0.68, Overall: 0.50). The overall high rates in this population are directly related to the onset of symptoms which occur commonly in the third or fourth decade and progress later in life. 24 Older adults may experience several complications due to age-related changes or weakened immunity, such as nutritional deficiencies, injuries due to physical imbalance, muscle stiffness, swallowing difficulties, as well as weakened respiratory muscles leading to aspiration pneumonia, which is usually fatal. 19 Furthermore, older individuals may present with multiple comorbidities, leading to a worse prognosis. The age of onset of disease has also been previously described as a factor associated with disease duration. HD arising during mid-life ages (young and mid-adulthood) have a longer duration of illness as compared to juvenile and late-onset cases. This disparity may result in the accumulation of deaths in the old age population as reflected by our analysis. 25 Better management options and healthcare programs are required to reduce the mortality burden of this vulnerable population, and future studies should explore this area.
While the AAMRs were stable in young adults, middle-aged adults exhibited a gradual rise in mortality rates. Multiple factors are likely involved, but the increased risk of suicide is worth discussing here. During the middle years of life, individuals face difficulties in coping with heightened social and financial responsibilities, more so for cases compounded by debilitating health conditions like HD and its psychiatric sequelae. Additionally, young people with HD might observe the devastating course of this disease in other affected patients or relatives, ultimately developing suicidal ideation after getting diagnosed.26,27, 26,27 In the past, attention has also been drawn to suicide-related HD deaths being underestimated because of the possibility of individuals committing suicide in their mid-adulthood before being diagnosed, arising from a fear of getting diagnosed and becoming a burden to their kin. 20 These factors highlight the importance of the biopsychosocial approach for the management of HD in this age demographic and how counseling and targeted strategies should involve the patient, their caregivers, and the relatives at risk.
In addition, our results showed a significant difference between AAMRs of different races or ethnic groups. The AAMRs were highest in NH White patients, followed by NH Black or African American, and Hispanic or Latino patients. The available data only showed reliable trends for these three races. According to a study by Bruzelius et al., White patients had the highest age-adjusted diagnostic frequency (AADF) for HD in the US, followed by Black or African American subjects, although the difference between the two was not drastic. 23 This reinforces our finding which indicated that NH White patients had the highest rate of mortality from HD. However, the difference between the rates for NH White patients and NH African American patients was slightly more notable in mortality trends (AAMR White: 0.61 vs. Black: 0.35; 1.7 times higher in White) as compared to their diagnostic frequencies (AADF White: 6.73 vs. Black: 5.65; 1.2 times higher in White). This may be partly explained by the genetic predisposition of HD in White patients and the increased frequency of Huntington’s disease-like illness (HDL2) in patients of African descent. 23 Since CDC WONDER does not provide the data for the two conditions separately, further studies are warranted to investigate the disparity in mortality observed. Despite the rarity of HDL2, its higher prevalence among individuals of African descent indicates that it may influence the reported mortality rates, thereby potentially confounding the data attributed to HD.
As for census regions, the Midwestern region had the highest HD-related mortality burden compared to other regions of the USA. This regional disparity may partly be because of differences in diagnostic procedures and referral patterns, the extent of implementation of guidelines, access to insurance, quality of health care, increased burden of other neurodevelopmental disorders, and lack of attention towards rare diseases such as HD. 21 We also observed substantially high APC in mortality rates for the Northeast during the period from 1999–2002, despite having several wealthier states like New York, Massachusetts, and Connecticut. A potential explanation for this can be the failure to access healthcare services, led by concerns regarding genetic discrimination in insurance and employment, among affected individuals of high-earning households.23,28, 23,28 Further, the Northeast region is also reported to have the greatest stability in insurance coverage compared to other regions, due to Medicaid expansion in the majority of its states, which may account for the low overall AAMR observed as compared to the Midwest. 29 The exploration of exact risk factors is only possible via population-based large studies conducted in these regions.
Non-metropolitan areas presented a much higher rate of mortality, likely due to the lack of medical facilities available in such places. Non-metropolitan areas often lack sufficient medical professionals and advanced diagnostic methods— such as genetic testing and advanced imaging techniques. Additionally, individuals living in remote places are often unaware of such techniques and may hesitate to seek appropriate medical care. 30 The mortality in non-metropolitan areas also increased at a more rapid rate. The same trends have been observed in previous studies, demonstrating the disparity in rural-urban healthcare. 31 Lastly, concerning the place of death, over half of the deaths due to HD occurred in nursing homes and a substantial proportion in homes and medical facilities. Potential reasons for this may include reliance on supportive care and rehabilitation due to limited and less successful therapeutic options. However, when compared to other countries, the mortality in nursing homes is substantially higher in the USA. 32 This underscores the importance of developing strategies to provide better care in such facilities and educating the patients and their relatives regarding good at-home care to reduce the burden on the healthcare facilities.
Limitations
We encountered several limitations in our study. Firstly, there is a risk of HD having been misrepresented or excluded from death certificates as a cause of death, due to the dependence of our study on ICD codes. Secondly, there was no information regarding the clinical factors, lab values, or genetics that could be utilized to stratify mortality according to the various disease stages. Thirdly, we also attempted to exclude the rare juvenile-type HD from our study, by adjusting the age from 25–85 + years, which may hinder understanding of the entire spectrum of the disease. Since CDC Wonder lacks codes for further classification of HD, there could still be a chance of presence of mortality from the juvenile-type HD cases due to the overlap of age of mortality with adult-onset cases. Fourthly, we encountered suspended or missing data for hospice facilities from 1999 to 2003, which prevented us from analyzing the trends during this period. Also, we were unable to study data for the Alaskan/Native American and Asian/Pacific Islander as the data for these minor ethnicities were either missing or suppressed, hence, the dataset included may not truly represent the whole US population. Lastly, there were no data available on socioeconomic determinants, treatment, and management of the condition.
Conclusion
Our results showed an overall increase in the AAMR for HD-related mortality from 1999 to 2019 in the United States. The AAMR for men was slightly higher than for women. Older adults (65–85 + years), NH White patients of HD, individuals in the Midwestern region of the United States, and individuals in non-metropolitan areas displayed the highest AAMRs. These trends raise further questions on the risk factors of HD-related mortality, and future research should focus on determining the causes of these trends. Another crucial area of future work would be to study suicide-related HD deaths in more detail, especially the factors in the patients’ environment that prove protective. Finally, some other aspects that warrant attention are the relationship of CAG repeat length to the age of death, the factors that are associated with slower progression of the disease, and strategies that can improve the quality of in-home care to reduce the burden on long-term care facilities in the US.
Footnotes
ACKNOWLEDGMENTS
The authors would like to thank the Research Council of Pakistan (RCOP) for their support along all aspects of conducting this study.
FUNDING
The authors have no funding to report.
CONFLICT OF INTEREST
The authors have no conflict of interest to report.
DATA AVAILABILITY
This retrospective study uses online, publicly available, de-identified mortality data collected by the US government.![]() " href="#ref004" id="a-74">
4
" href="#ref004" id="a-74">
4