



Abstract
This article is devoted to the search for a generating function for network delay simulation. We justify the choice of the measurement system used to collect delay data with microsecond accuracy. Experimental data are employed in order to form a hypothesis regarding the exponential type of delay. The paper is restricted to the study of the simplest two cases: the linear and quadratic dependence of the delay distribution function. The application of the Pearson criterion led to the conclusion that an exponential distribution can be used to describe network delay, but is valid only for small periods from 10 to 30 minutes. We also justify the expression for the distribution function and generating function for further theoretical and experimental calculations.
Keywords
Introduction
The use of real-time applications on the Internet, especially the transmission of audio and video information, is becoming more and more popular. The major factors defining the quality of such services are the quality of the equipment (codecs and video servers) and the quality of the network connection. In order to guarantee the availability of the demanded services, ISPs should provide not only the required available bandwidth for voice and video applications but also appropriate values of delay D, network jitter j and packet loss p [6].
Another class of tasks for which knowledge of delay distribution types is essential is that of networked control systems [30]. More recently, networked control systems have started to use global networks and the Internet. In this case the systems must take into account both the random character of packet delay distribution, as well as their large average values [28]. However, until now, the results of advanced network research have not been used in control theory, with no algorithms as yet created on their basis.
During the transmission of control signals through a TCP/IP network, packets of control data carrying the information arrive non-uniformly, with some packets potentially lost during transmission over the network and not reaching their destination. In order to describe this irregular process, a special variable known as Internet packet delay variation (IPDV) or jitter j has been introduced [10]. In order to improve the efficiency of control algorithms, packet delays and their variation, as well as the percentage of packet losses, must be reduced as much as possible. Similar algorithms are used for the transmission of voice and video streams [20], in various grid systems [5,24], the control of robust systems [19] and in network computer games [4].
As a first step, we would like to review the most important research examining network delay distribution types. In such work the following terms and definitions are commonly used:
Round-trip time (RTT): the time required for a packet to travel from the test host to a remote computer that receives the packet and then retransmits it back to the source [2].
One-Way Delay (OWD): the time in seconds that a packet spends in traveling across the IP network between two synchronised points A and B [1].
Such work would be impossible without the European Regional Internet Registry’s (RIPE NCC) online monitoring system for the global network, which measures delay, network jitter, packet loss and trace routes. The first version of the RIPE system, known as Test Box [27], synchronises via GPS, thereby allowing delay measurement at an accuracy of up to 10−6 seconds. However, the cost of such measurement was high, particularly in terms of labour. The second version of the system, RIPE ATLAS [23], was subsequently installed based on simple and inexpensive devices. Therefore, although the system has become more popular, it has also declined in accuracy [26].
Another area of application for this type of research is network simulation. Many software packages are able to emulate the transmission of packets through TCP/IP-based networks, based on the assumption that the type of delay distribution is unknown. Our goal is not only to identify the type of delay distribution but also to propose a generating function for traffic emulators. Subsequent work will involve the construction of a special patch for well-known network emulators such as INET/OMNET++ [29] and NS2 [16].
The paper is organised as follows: Section 2 provides a brief overview of previous work on this subject. Section 3 discusses the theoretical background of the model. Section 4 is devoted to a description of the experimental methods employed to determine the type of delay. The principles upon which distribution types are selected are discussed in Section 5. Statistical hypothesis testing is carried out in Section 6. Section 7 describes the tests conducted for the generation of the new Internet Protocol (IPv6). Section 8 concludes with the generation of a delay function for use in simulations and control theory.
Related works
Attempts to find an analytical expression describing the values of packet delay began with the start of operation of the global network. A little later Almes et al. has developed standards [1,2] that define the various performance metrics of IP networks, including delay. Then numerous works were published, where attempts are made to write an expression for the generation function for network delay.
Elteto and Molnar [13] obtained measurements of round-trip delay in the Ericsson Corporate Network; complex analysis of the received data enabled them to draw conclusions regarding the network delay distribution type. The main finding of this research was that the Round-Trip Times are well approximated by a truncated normal distribution.
Konstantina Papagiannaki et al. [25] measured and analysed packet delays between two adjacent routers in the core network. Based on the obtained measurements, they then made conclusions regarding the factors influencing delay occurrence. They also found very large delays that could not be explained by the way packets are processed in routers using the FIFO algorithm.
Authors of the article [18] proposed a separation of the network delay into two components, i.e. these are the physical and telecommunication components (deterministic and stochastic delay). However, the authors have tried to use for simulation the distribution with a heavy tail, which is a deliberate mistake. It is well known that the delay has finite both average value and the standard deviation while a heavy-tailed distribution characterized by an infinite mathematical expectation.
Another group of authors [9] came very close to our solution, as they used the GPS synchronization to measure One-Way Delay. However, their data collected during the experiment too rare, once in 300 seconds. In addition a very limited set of directions are used.
Many works [3,21] explore only one direction, an insufficient number of data and use nontransparent measurement technology. The second paper [3] discusses only one set of data collected on the anomalous way of the network. Authors should ensure proper configuring routers before making generalized conclusions about the universal type of distribution for packet delay.
Following a review of articles, we can conclude that for a complete analysis of the packet delay data in the global network should fulfill a number of conditions. These include
Data should be collected from many different directions, collected by means of a global measurement system.
Each data set must contain a large number of measurements, the data acquisition rate must be changed.
It is necessary to use one-way delay measurement mechanism, which in turn requires time synchronization using the mechanisms of GPS/Glonass.
In order to simplicity the construction of the generating function, we need to test the simplest distribution.
Implementation of these requirements are addressed in this article. But we begin with the theoretical assumptions.
Theoretical premises
In 1999, Downey [12] was the first to identify the linear dependence of the minimum possible round-trip time on the size of transferred packets. In 2004, precise experiments conducted by Choi et al. [8] and Hohn et al. [17] proved that the minimum fixed delay component
Further research [7,18] has shown that the network delay consists of two components. The first component is due to the laws of physics, it is related to the finite speed of light/electromagnetic waves through the links and the routers. Its distinguishing feature is that it brings a fixed contribution to the network delay. This contribution for each path can be estimated using the minimum time of packet delivery
The second component of the delay may be called a telecommunications component. This component is described by the queuing theory and it is associated with the information processing at all layers of the network hierarchy. The principal feature of this component is that it sets the variable part of the delay.
Equation (1) allows to select individual components of network delay. Let
The value
The value of
Selection of measurement infrastructure
In order to determine the distribution type for a variable delay component
Taking into account the above-mentioned comments, it was considered that the ideal measurement system for the purposes of the present study was the RIPE Test Box, which measures one-way packet delay with microsecond accuracy. Unfortunately this system was decommissioned in June 2014. The number of measurement boxes in the global measurement infrastructure reached 80 units, covering all of the major global Internet centres and reaching their highest density in Europe. In order to prepare the experiments, three Test Boxes were installed in Moscow, Samara and Rostov on Don during the period 2006–2008 within the framework of RFBR Grant 06-07-89074. Each RIPE Test Box represents a server under the management of a FreeBSD operating system, together with the connected GPS receiver.
As the characteristic duration times of the investigated processes (packet delay, jitter) range from 10 ms to 1 sec, the system hours of a RIPE Test Box can be considered sufficient for reliable measurement. Delay data were collected for three years (2009–2012) from boxes located in Amsterdam (tt01.ripe.net, RIPE NCC at AMS-IX), Samara (tt143.ripe.net, SSAU), Moscow (tt146.ripe.net, IOCh RAS), Bologna (tt17.ripe.net) and Melbourne (tt74.ripe.net). The precision of packet delay measurement [14] was 2–12 µs. Test results are available via telnet, corresponding to RIPE Test Box on port 9142.
For further analysis, we collected more than 40 different data sets, some of which contained up to 5000 measurements. All these data were subsequently processed. It is important to record data at both ends of the investigated connection simultaneously. Unfortunately, our data were not sufficiently representative for the analysis of delay in the IPv6 networks and as a result it was necessary to use a less precise measurement system.
Only two measuring systems, PingER [22] and RIPE Atlas, were considered suitable for our purposes. Both of these systems measure the round-trip time between measuring units and also establish routes. The difference between these systems is that whereas PingER is implemented at the software level, RIPE Atlas is essentially a hardware solution. The RIPE NCC, one of five Regional Internet Registries (RIRs) that support the global operation of the Internet, coordinates RIPE Atlas. As we participated in the RIPE Test Box development programme and were among the first users of the new RIPE Atlas system, we have established a trusting relationship with specialists at the RIPE NCC control centre. In July 2016, the system was used by more than 8000 probes and 200 anchors, about half of which worked in IPv6.
It should be noted that all the above mentioned systems use active measurement. In order to performe the measurement test ICMP packets with timestamps are generated. Network delay is calculated by comparing these timestamps with own time of measuring stations. In order to improve the accuracy of proper time can be synchronized via GPS. The use of packets of different sizes is provided for measuring the available bandwidth of end-to-end connections.
Select the type of distribution
The collected experimental data enabled the construction of a cumulative distribution function
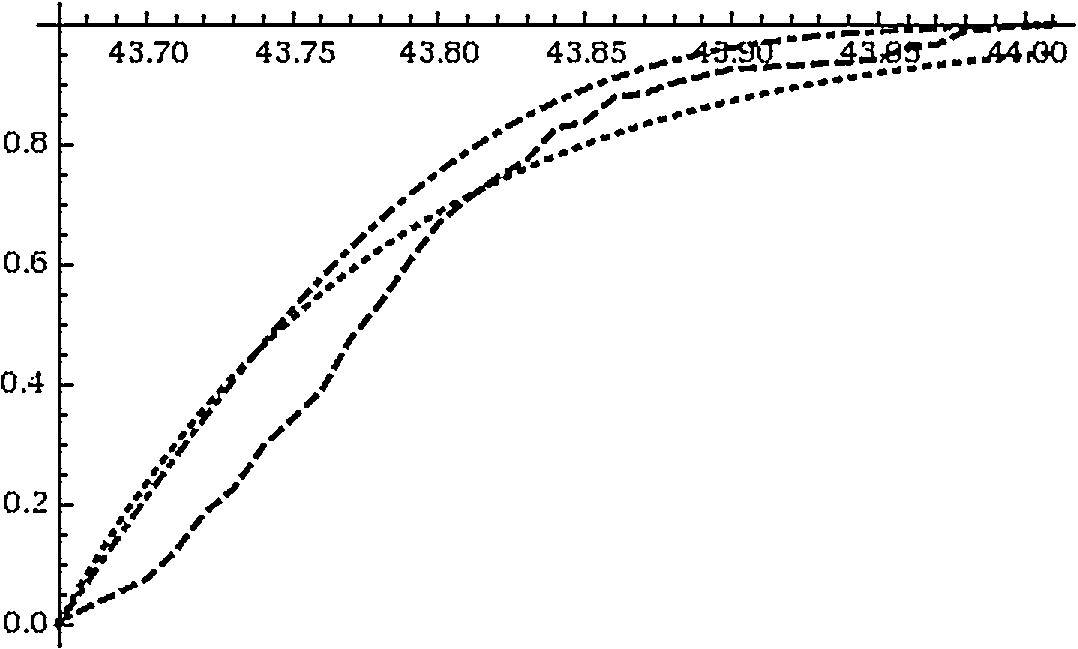
Experimental (dash), normal (dash-dot) and exponential (dot) CDFs, precise testing. Direction: tt01 ⇒ tt143,
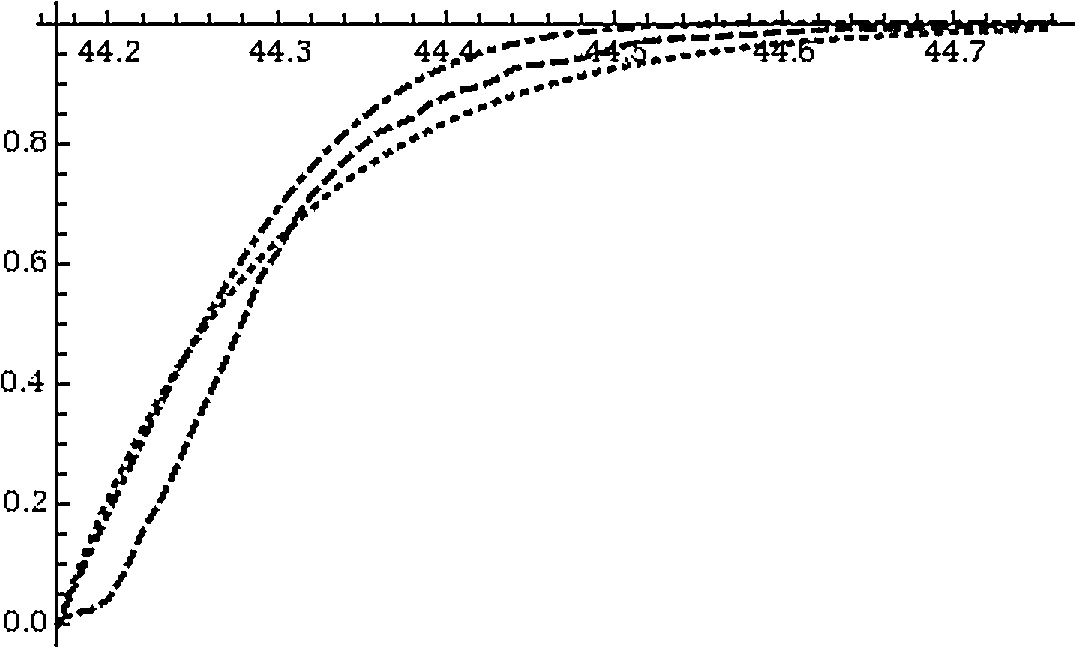
Experimental (dash), normal (dash-dot) and exponential (dot) CDFs, precise testing. Direction: tt01 ⇒ tt143,
The linear dependence leads to an exponential distribution. Normalisation conditions allow the following expression:
The quadratic dependence of the cumulative distribution function
It should be noted that all statistical data were gathered for a fixed packet size W. By default for the RIPE Test Box, this is equal to 100 bytes. In Section 8 we update a cumulative distribution function
In selecting the distribution type, we used two rough methods that allow for the initial selection of hypotheses: Pearson correlation coefficients and a graphical method. Let us designate a
Although the collected volume of data enables the running of multiple tests, here only the typical results of the inspections are presented. The result of these tests are shown in Table 1, where the
Precise measurements
With the exception of the correlation coefficients, it is possible to compare graphical representations in the form of cumulative distribution functions (CDF), showing all three studied functions on a common plot. In the uniform graphs (Figs 1, 2) the dashed line represents an experimental curve, the dot-dash curve the normal allocation and the dotted curve the exponential distribution.
The specific plots displayed in Figs 1 and 2 illustrate the dependence of these CDFs on the delay of a packet on a site from Amsterdam to Samara (tt01 ⇒ tt143). The first plot describes the testing of a network with packages of 100 bytes and the second plot corresponds to packages of 1024 bytes. Time on the x-axis is measured in milliseconds.
The experimental results presented above generally indicate that packet delay in a global network can be described by an exponential distribution. Thus, as shown by our research, the random variable of packet delay between two network points is arranged on an exponential low with the parameter calculated from experimental values according to Eq. (6).
However, not every investigator engaged in control theory is able to access RIPE Test Boxes or equipment with which to make high-precision measurements. The following section thus presents a technique which involves the use of data from well-known utilities and which does not require expensive equipment.
For testing we used the ping utility, as it is the most widely adopted resource employed for the verification of connection quality in TCP/IP networks. It should be stated that this utility measures round-trip time rather than one-way delay.
The data received with help of ping were precise to the millisecond and thus were exact enough to judge delay distribution. The ping utility here enabled the testing of connections between the following points: AIST–New Zealand (tt47.ripe.net), Volgatelekom–Australia (tt74.ripe.net) and SSAU–Melbourne (tt74.ripe.net). The following servers in the RIPE measurement system were used as remote hosts: AIST, Volgatelekom (VT), Infolada and SSAU, which are all local Internet Service Providers from the Samara region of Russia. After processing the obtained data via the above-described algorithm, the results presented in Table 2 were derived.
ping measurements

Experimental (dash), normal (dash-dot) and exponential (dot) CDFs, precise testing. Direction: Samara ⇒ Holland,

Experimental (dash), normal (dash-dot) and exponential (dot) CDFs, precise testing. Direction: Infolada ⇒ Athens,
The above results were then used in the definition of the distribution types shown in Figs 3–5.

Experimental (dash), normal (dash-dot) and exponential (dot) CDFs, precise testing. Direction: SSAU ⇒ Australia,
It should be noted that the ping utility allows users to automatically find values of the variables
The verification executed in the previous section regarding the conformity of distribution types is rather preliminary in character. In this section the Pearson’s chi-squared test will be used for further checking.
As mentioned earlier, numerous data sets were collected via RIPE Test Boxes, with delay magnitudes recorded at an interval of 2 seconds for periods of 2–3 hours. More than 40 of these data sets were gathered for further processing.
Pearson’s chi-squared test is described in detail in many textbooks, for example [15]. The present section therefore includes only a brief demonstration of the basic stages of calculations. Table 3 includes data for the following four parameters:
Dimension of observations N (number of measurements); n is the number of cells. All observations N are divided among n cells according to Sturgess’ rule t is the value of the test-statistic;
If
Testing was performed in automatic mode, with a special script written with which to analyse the data and to assist in forming an opinion regarding the acceptability of the hypothesis. The initial data were divided at intervals of 50, 100, 200, 250, 500, 1000 and 2000 values and then tested using Pearson. The obtained test results appeared typical; examples can be found in Tables 3, 4.
As a first step we will check RIPE Test box data conformity with the exponential distribution. From Table 3 it follows that within 500-second intervals (250 measurements) the packet delay is distributed based on the exponential law.
Verification of exponential distribution, Samara–Amsterdam, (tt143 ⇒ tt01), packet size 100 bytes
Verification of exponential distribution, Samara–Amsterdam, (tt143 ⇒ tt01), packet size 100 bytes
This result is universally repeated for all data sets collected by us. That is, the test results suggest that the exponential distribution is true for small samples, with the duration of such samples here limited to 30 minutes.
The data received via RIPE Test Boxes were also checked for conformity to the truncated normal distribution, see Table 4. The results of the Pearson’s chi-squared tests enable the rejection of the hypothesis regarding the truncated normal distribution for the description of the packet delay process.
Verification of truncated normal distribution, Samara–Amsterdam, (tt143 ⇒ tt01), packet size 1024 bytes
This section is devoted to the delay occurring in IPv6 networks. The implementation of IPv6 is rapidly increasing in popularity due to the almost complete exhaustion of available IPv4 addresses for regional and local Internet registries. The study of packet delay in networks based on a new communication protocol is essential in order to find solutions to problems associated with the mathematical modelling of traffic across the network, for real-time systems including video and voice over IP (VVoIP) applications, and for examining network performance characteristics such as bandwidth.
In order to select the distribution function that best approximates the delay distribution, the chi-squared test was again adopted for the verification of statistical hypotheses. Baseline data were collected using two measurement systems: RIPE Test Box and RIPE Atlas. Although the RIPE Atlas is not as accurate, it has a much greater reach. More than 20 data sets were recorded, all of which were subsequently processed. As many of the results were repeated, typical examples are shown below.
The exponential distribution and truncated normal distribution were selected for the testing of statistical hypotheses. Table 5 below summarises the results of applying the criterion for the hypothesis of an exponential distribution of the variable component of packet delay. Accordingly, Table 6 shows the results for a truncated normal distribution.
IPv6 results for the exponential distribution
IPv6 results for the exponential distribution
IPv6 results for the truncated normal distribution
Analysis of Tables 5 and 6 reveals that the experimental results for all three considered routes can be statistically satisfactorily approximated by an exponential distribution, albeit only for a small sample volume.
The test results for IPv4 and IPv6 networks differ because the packages were sent at different time intervals of two seconds and thirty seconds, respectively.
The exchange of test packets takes almost one hour for successful completion according to Table 5. During this period the network configuration has enough time to change so that the parameters of the described models are not suitable for a sufficiently accurate approximation of the delay values.
Knowing the packet delay distribution type enables the construction of a generating function that simulates this delay for a series of packets, corresponding to the real behaviour of the network. This feature is of practical interest for design tasks and the administration of real-time systems, as well as the simulation of computer networks in emulator programs.
As in real-life Internet processes the size of transferred packages can vary, the cumulative distribution function should therefore be updated. The distribution confirmed by the above experiments describes the variable part of the delay
It is important to note that the delay data received via the use of packages of varying length account for the network jitter j (delay variation) [11]. Therefore, the best controlling algorithm will form packages of identical size. The ping utility is especially useful for such delay definition as it includes a special key for the resizing of test packages (-l in Windows, -s in Linux).
In addition to tasks related to control theory, the presented model can also be applied to the writing of global network traffic emulators [29]. Until now the type of delay distribution exhibited by network traffic has been unknown, with traffic emulators thus using their own functions for delay generation. On the basis of the type of delay found here (see Eq. (11)) it is possible to write the following generating function:
In this equation the content distribution function (CDF)
It should be noted that in this paper we have tried to describe the basic component of a random variable, which is the packet delay in the network. This component is described by the third term in Eq. (3). At the same time, the second term from Eq. (3) also contributes to generating function, this contribution is due to changes in available bandwidth. Probably the constant fluctuations in available bandwidth due to the small time interval during which the parameters of the generating functions remain constant. Modeling delay fluctuations related to changes in available bandwidth, requires additional measurements. As an upgrade generating function should test the sum of two distributions. The main distribution is defined by at least 90% of the contribution will be exponential one, as shown above. Subsidiary distribution describing the values near the minimum delay could be normal distribution.
Conclusion
In the present work, the exponential distribution was selected for the description of the packet delay process in global networks. In comparison to the truncated normal distribution, the exponential distribution exhibited the best correlation with experimental results and was verified via the use of statistical methods.
An experimental scheme was developed for the statistical verification of hypotheses regarding the distribution of delay in a global network. Experimental data sets were gathered using RIPE measurement systems (RIPE Test Box and RIPE Atlas) with microsecond precision, and by means of the standard ping utility. This utility is able to measure round-trip time to within milliseconds.
The results of Pearson’s chi-squared tests revealed that the hypothesis for an exponential distribution can be accepted, albeit only for a brief period limited to 30 minutes. Distribution parameters remain constant during intervals of at least 500 seconds. Upon a change in network conditions, elementary ping testing via a series of 20 packets will enable the exponential distribution parameters to be varied instantly.
An explicit form of cumulative distribution function for both normal and exponential delay distributions has been derived, together with a generating function for packet delay that can be used in global network traffic emulators. Our results could be applied in at least in three areas of computer networking: networked control systems, real time streaming (voice and video) and network simulators.
Unfortunately, the resulting distribution function has a significant limitation. It can be applied for periods not longer than half an hour. This statement is true for the different routes. Such a limitation is due to shortcomings selected to test the distribution type. Distribution type should be modified taking into account the contribution of all members of Eq. (3). This work is scheduled to perform in the near future; we launched a new data collection about the one-way delay on the modified measuring devices.
We are currently completing the construction of new measuring system, which includes a GPS/Glonass sensor to synchronize system clocks and measuring tool for OWD. With this system, we hope to conduct additional measurements, especially in IPv6 networks. On the basis of these measurements, it is planned to conduct additional testing and upgrading of generating functions, in order to extend the scope of the described model.
Footnotes
Acknowledgements
This work was supported by grant of the Russian Foundation for Basic Research (RFBR) 16-07-00218a. This work was supported by Ministry of education and science of Russian Federation (project 2930) in the framework of the implementation of the program of increasing the competitiveness of SSAU among the world’s leading scientific and educational centers in 2013–2020 years.
In summary we would like to thank Leonid Fridman, Professor at the University of Mexico, for fruitful dialogue during which the idea for this article took shape. Thanks also go to technical staff at RIPE NCC, especially Ruben van Staveren and Roman Kalyakin for their constant assistance in understanding the subtleties of a measurement infrastructure. Finally, we would like to express our gratitude to the Wolfram Research corporation, which firstly marked our preprint and allowed us license to use Mathematica.