
Abstract
In order to extract value from data, data mining and data software technology are widely used in the industry. This study mainly discusses the precise mining of location data in communication field based on big data. Signaling preprocessing layer mainly obtains signaling message through acquisition module, filters FISU message in signaling message, judges abnormal message frame, and stamp it with time stamp, which provides effective data source for next processing. Signaling access layer mainly completes the function of signaling link access, mainly using high resistance jumper technology, time slot convergence technology, optical access technology and 155mdxc conversion technology to access 2 m link and 155 m link respectively. The signaling collection module must collect directly or via a link through DXC in order to reach the front-end data collection machine and access the signaling collection module of the front-end machine. The Signaling Collection Module also completes some of the message processing work. The presentation layer is the window of human-computer interaction of the whole system, which presents to users with friendly interface and perfect functions. The main goal of real-time big data analysis is to obtain signaling data sent by signaling acquisition system, and screen out the effective information in signaling data according to monitoring conditions, and then analyze the final real-time monitoring results. Geographic information module provides visual map control for the regional monitoring big data analysis module. The difficulty of system development can be reduced by using the existing WebGIS map toolkit. When the call from the Customs Bureau of Unicom in different cities is called into the mobile gateway Bureau, the call is rejected by the mobile customs bureau. The call time is 0 seconds, of which the interception success rate is up to 90% within 1 s. This research is of great significance for the better development and maintenance of signaling network and monitoring system.
Keywords
Introduction
With the use of No. 7 signaling, the voice path and signaling are transmitted independently by dedicated link, which leads to the emergence of independent signaling network. Because the signaling system is a kind of digital signaling system, the signaling capacity of the corresponding signaling network is very large. Its purpose is not only to transmit all the signaling of the telephone, but also to support all the telecommunication service networks using digital signaling. Therefore, the signaling network is the support network of various service networks and the neural system of telecommunication communication network.
A complete, sophisticated signaling monitoring system must have real-time monitoring and comprehensive statistical analysis. The real-time monitoring function includes: monitoring and analyzing the operation status of signaling network, signaling protocol analysis, signaling network alarm, signaling network performance and network billing, etc. A comprehensive statistical analysis is carried out to analyze the data of the database formed by the real-time monitoring to obtain the operation information of the signaling network. The statistical analysis contents include: network protocol statistical analysis, alarm log, fault statistical analysis and network performance statistical analysis.
The formal definition of the corpus can make the concept of big data develop more coherently, because it only relies on the basic elements of the current state-of-the-art technology and is consistent with mos. Mauro AD identifies and describes the most prominent research areas related to “big data” and proposes a thorough definition of the term. He analyzed a compelling corpus of industry and academic articles related to big data to discover commonalities between the topics dealt with. He also compiled a survey of existing definitions in order to produce a more solid definition to cover most of the work happening in the field. His research lacks data [18]. Xu looks at privacy issues related to data mining from a broader perspective and studies various methods that can help protect sensitive information. His research process is too simple [26]. Cai first provides a functional framework that can identify areas for the acquisition, management, processing and mining of big data of the Internet of Things. Then analyzed the current research in the application of the Internet of Things, in addition, identified the challenges and opportunities related to the Internet of Things big data research. Finally, under the proposed research framework of the Internet of Things, some unresolved problems and some typical examples are given. His research method is not novel enough [5]. Chi believes that a large number of Earth Observation (EO) satellite and airborne sensors from many different countries provide a large amount of remote sensing data. He specifically analyzed the challenges and opportunities brought by big data in the remote sensing application environment. The focus is to analyze the exact meaning of big data in remote sensing applications and how big data can provide added value in this case. In addition, he described the most challenging problems in managing, processing, and effectively using big data to solve remote sensing problems. To illustrate the above aspects, he discussed two cases of using big data. His research lacks data [7]. Baccarelli formalized this paradigm, discussed its most important application opportunities, and outlined the main challenges of implementing real-time energy-saving management of distributed resources available on mobile devices and Internet-connected data centers. It also includes performance analysis of small-scale prototypes to gain insight into the trade-offs between energy and performance that can be achieved through the optimized design of the resource management module. Although his performance comparison with some of the most advanced resource managers confirms this discussion, the research lacks innovation [2].
This study mainly discusses the accurate mining of positioning data in communication field based on big data. The signaling preprocessing layer mainly obtains the signaling message through the acquisition module, filters the FISU message in the signaling message, judges the abnormal message frame, and stamps the time stamp to provide an effective data source for the next processing. Signaling access layer mainly completes the function of signaling link access. It mainly uses high resistance bridging technology, slot convergence technology, optical access technology and 155mdxc conversion technology to access 2 m link and 155 m link respectively. The signaling acquisition module needs to collect directly or transmit to the front-end data acquisition machine through the DXC centralized link, and access to the signaling acquisition module on the front-end machine. The signaling acquisition module completes part of the message processing work at the same time. The presentation layer is the window of human-computer interaction of the whole system, which presents users with friendly interface and perfect functions. The contribution of this paper is to set up the signal preprocessing layer, signal access layer, and collect data from the signal acquisition module. Using the existing WebGIS map toolbox can reduce the difficulty of system development. The research in this article is of great significance to better develop and maintain the signaling network and monitoring system.
Positioning data in the communication field
Big data
In order to make the collected data more efficient, relatively safe data collection techniques are generally used [13,22]. The signaling monitoring platform makes data collection and processing compatible, supports the customization of any type of data source of the secure data management system, and supports transmission through various data channels [1]. The diversified protocol also supports log counting, log acquisition, and simple data processing. The signaling monitoring platform is very prominent among similar technologies by virtue of rich data acquisition sources, information transmission channels, information screening and processing, multiple storage methods, and complete management functions. As the basic technology of data processing, database storage, virtualization technology, etc., cloud computing is also permeating everywhere. It is not difficult to understand that big data platform technology is also a decentralized framework derived from source computing. One of its advantages is that a large amount of data can be collected for comprehensive analysis. Hadoop’s decentralized system infrastructure is currently the most extensive data processing system widely used to process big data. A Hadoop cluster with 5000 nodes is used to support the advertising system. In addition, it is also used for Web search research [14,20].
The potential energy of big data resources can be expressed as formula (1) [27]:
Where ω is an expression used to balance the Hessian determinant? According to system resource optimization configuration requirements, let [4]:
Among formula (2) and formula (3),
Given a distance threshold d, the accuracy of the reconstructed point set γ is defined as the result of the accumulation of all points as formula (5) [3].
Similarly, for any real three-dimensional point
The recall rate of the reconstructed model R for a given distance threshold d is defined as formula (7) [15]:
Because there is no effective means of acquiring knowledge, although the data generated during the production process has increased dramatically, there is almost no useful information obtained from it [9].
Call data record (CDR)
The combination of CDR refers to the combination of the received CLR data into a call record with complete information such as OPC, DPC, caller, called, etc., and then send it to related application modules that require real-time CDR data through the tcp interface (such as the connection rate, Billing etc.), and write data to the database at the same time. In order to realize that different threads can access CDR and CLR data, a shared memory segment is used to share CDR and CLR data. At the same time, the CDR (CDR_Shm) shared memory is created only to prevent the thread writing the database and the tcp communication thread from blocking, so the size of the shared memory can be set to be small, and it can save CDR data for 1–2 minutes at the same time. The shared memory is set in a ring shape, which reduces the deletion work of clearing the CDR data that has been stored in the library. The purpose of creating the CLR thread is to combine all the CLRs of the call into a CDR after the end of a call. Since the duration of a call may be short (such as several seconds) or long (such as tens of hours), the shared memory of the CLR must be set large enough. At the same time, when a call is completed and a marked CLR (such as no answer, disconnection signal, etc.) is generated, the main thread starts from the beginning of the shared memory segment to find the matching CLR one by one, once it finds a matching CLR. CLR record, mark the record as “combined”, write the position of the record into a global array, and notify the thread of the CDR combination. After the thread of the CDR combination receives the information of the combined CDR, it will be based on the global array. The value of all CLRs that meet the conditions are taken out and combined. When writing a CDR into the CDR database, it is not written into the database when a CDR is generated. In order to reduce the load of the CDR database, and the database application has no real-time requirements, the method of batch processing and storage (for example, busy When the time reaches 10,000, it will be written to the database, and it will be written to the database every 1–2 minutes in idle time). Taking the Sybase database as an example, the write mode of bcp can be used [8,28].
Record real-time tracking, that is, the user queries the user’s real-time signaling message according to the query requirements (calling number, called number, calling IMSI, called IMSI). The user sends the filter conditions through the interface and obtains it from the server by the front-end machine. The collected real-time signaling messages are sent directly to the user interface without going through the expansion process [6]. In order to understand the user’s status and usage in real time, the real-time tracking principle is shown in Fig. 1.

Principle of real-time tracking.
Let the input of any neuron j in a certain layer be
The Signal Collection Gateway (SCG, Signal Collection Gateway) obtains the original signaling data from the mobile communication network and provides the required data to the aggregation equipment. As the country is now in the relatively mature 2G network + 3G network in its infancy, domestic and foreign operators are currently actively promoting the construction and application of signaling monitoring systems to discover, process and coordinate network problems more quickly and accurately, and improve customer perception. Now with the help of the signaling monitoring system, it is now generally used as follows: the tracking function of the designated number is used to process and analyze specific complaints and failures; the statistical analysis of performance indicators, including detailed analysis of various failures, is mainly used to improve KPI performance indicators. Furthermore, the aim is to improve network quality; analyze interconnection relay and business volume; analyze peer operators’ operations, such as customer scale, key account analysis, etc.; analyze short message service; special analysis of other new services, such as color ring back tones, GPRS, etc.; terminal quality analysis; customer perception analysis, etc. It can be seen that the current functions of signaling monitoring mainly include five aspects: auxiliary troubleshooting, real-time monitoring of the network, analysis of network assessment indicators, analysis of illegal communication between networks, analysis of inter-network services, and verification of bills [19,25].
If j trees are generated in the boosted tree model, then [24]:
Among formula (11)–(12),
In the above formula (13),
Where n is the sample size, and the predicted value obtained by establishing each supervised learning prediction model training is
Positioning data experiment in the communication field
Structural model of the signaling monitoring system
The signaling monitoring system adopts distributed processing, and the system structure design aims at high efficiency, flexibility and reliability. The system uses a 4-level step-by-step calculation model, and each calculation step is supported by corresponding hardware and software. This model effectively solves the system load balance, improves the flexibility of the monitoring system, makes the monitoring system flexible, and maintains the best centralization of the system, thereby reducing system construction and maintenance costs. The signaling pre-processing and acquisition layer are logically connected through hardware, which can actually be regarded as a layer.
The signaling preprocessing layer mainly obtains signaling messages through the collection module, filters FISU messages in signaling messages, judges abnormal message frames, and stamps time stamps to provide an effective data source for the next processing. The signaling collection layer manages and collects the message data of multiple collection modules in real time, and sends it to the next process after processing. The signaling processing layer analyzes and processes the received original messages according to the No. 7 signaling protocol and logical relationships, and forms various types of CDR/TDR (composite complete signaling records), and calculates various analysis and statistical results according to statistical requirements. The data storage layer saves the results in a database or file in an appropriate manner according to the results of the signaling processing layer. The application layer presents the result data to the maintenance personnel according to the user’s business logic.
System hardware architecture
The system hardware structure logically consists of five parts: signaling access layer, data acquisition layer, processing layer, storage layer and presentation layer.
The signaling access layer mainly completes the function of signaling link access. It mainly uses high-impedance crossover technology, time slot convergence technology, split optical access technology and 155MDXC conversion technology to realize the access to 2M link and 155M link respectively.
The main system of the data collection layer collects signaling data. The data acquisition and processing work is completed by the front-end computer in the system. The front-end computer includes a signaling acquisition module and an industrial-grade industrial control computer system. Signaling collection module. It needs to be collected directly or transmitted to the front-end data acquisition machine through the DXC centralized link, and connected to the signaling acquisition module on the front-end machine, and the signaling acquisition module completes part of the message processing work at the same time.
The signaling acquisition module supports access monitoring of high-speed 2M signaling links and Nx64k signaling links. A single module provides 16 2M input ports. The board-level processor chip on the acquisition module ensures that the maximum processing capacity of the single module can be processed 32 64K signaling links with full load of 1Erl. At the same time, there are also an acquisition module for supporting 155M link access monitoring and an acquisition module for supporting data network testing to meet the needs of different test types.
As an important source of network signaling information, the monitoring system can provide other systems with the signaling information needed for extended services. The interface server completes the work of the monitoring system to provide information to the outside world. The independent interface server provides information to the outside to ensure the independence of the interface, reliability and scalability. The storage layer is mainly responsible for the preservation of system data. The database server stores CDR/TDR, alarm information, performance statistics, business statistics, fact table data generated by pre-statistics, etc., and calculates, sorts, counts, and analyzes CDR/TDR at the same time. Because a large amount of data is stored in the database server, its data space is usually established on a disk array, which provides a large-capacity, highly reliable storage medium.
The presentation layer is the human-computer interaction window of the entire system, which is presented to users with a friendly interface and perfect functions. The user realizes functions such as system operation, maintenance, and status presentation through the operating terminal. The system operating terminal uses a graphical user interface to directly access the database. The presentation layer application presents the results to the user after further processing after the data is obtained. The system hardware architecture is shown in Fig. 2.
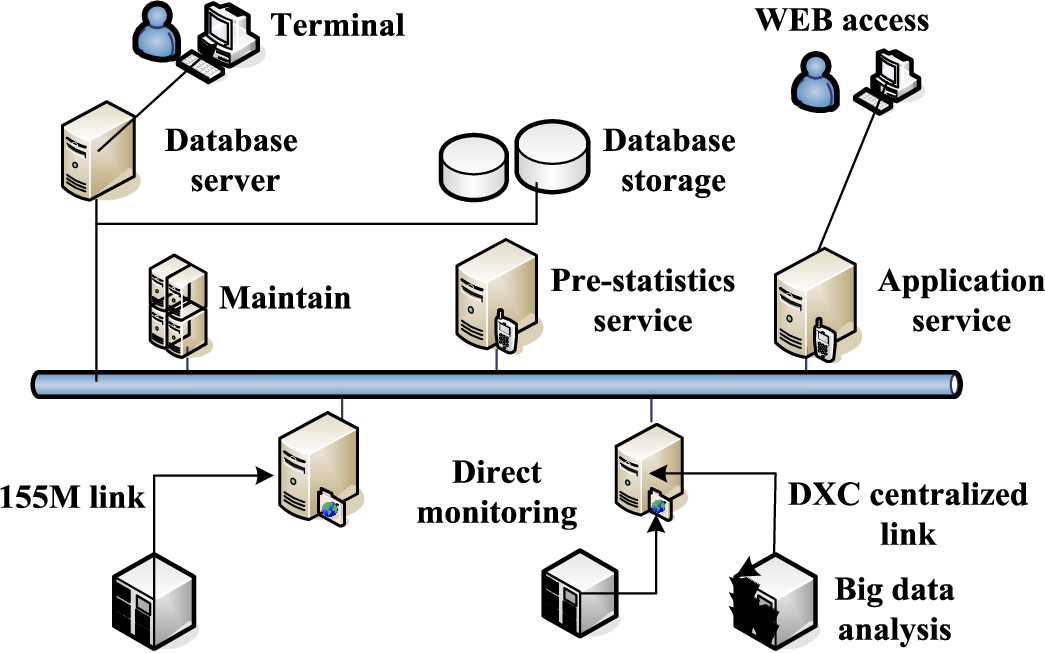
System hardware architecture.
The communication network mainly uses the computer network to connect the link access layer, the data acquisition layer and the data processing application layer to form a system. Since the communication network has a relatively large impact on the reliability, accuracy and real-time performance of the system, the system has relatively high requirements on the computer communication network. According to the geographical distribution of the central station, workstations, remote stations, front-end equipment and signaling network monitoring and maintenance system, the center is connected by a local area network. Usually, a local area network is built in the back-end data processing center and the maintenance management center, and the CDR server and the database server are connected. Application server, maintenance terminal and other equipment interconnection. Since the data access part is usually distributed relatively scattered, the data access is transmitted in the way of wide area network. WAN data transmission can use two reliable transmission networks at the same time (including DCN, digital data network (DDN) and packet switching network (CHNAPAC) and other multiple transmission methods). These two transmission methods are mutual backup to ensure the reliability of management system transmission.
(1) The signaling acquisition module provides data support for the regional monitoring big data analysis system. The signaling acquisition system performs processing such as elimination and deduplication of the signaling data obtained from the signaling monitoring system, and distributes the preliminarily processed signaling data to provide information to the regional monitoring big data analysis system. Make the data source.
(2) The geographic information module provides visual map controls for the regional monitoring big data analysis system. The regional monitoring big data analysis system needs to provide users with convenient map operations and present intuitive map regions. Using the existing WebGIS map toolkit can reduce the difficulty of system development.
(3) The system administrator module is mainly used for the maintenance of system base station information, personnel information and other data, and realizes the management of the system.
(4) The area monitor module, through the system management interface, realizes the operation of the main functions of the system, including area monitoring tasks and area range settings for area real-time monitoring, area history search time range and area settings, and area real-time monitoring results Permission to view and view regional historical search results, so as to realize the use and operation of the main functions of the real-time big data analysis module.
Big O complexity represents the changing trend of code execution time with the growth of data scale. In fact, it does not specifically represent the real execution time of the code. It can also be called progressive time complexity, or time complexity for short. The time complexity used in this paper is of constant order of magnitude in running time, and only the highest-order term in the time function is retained. Under the condition that the highest-order term exists, the coefficient in front of the highest-order term is omitted.
Functions of real-time big data analysis module
The main goal of the real-time big data analysis function is to obtain the signaling data sent by the signaling acquisition system, filter out the effective information in the signaling data according to the monitoring conditions, and perform analysis to obtain the final real-time monitoring result. The main requirements for real-time big data analysis functions are as follows:
(1) Being able to obtain real-time signaling data from the signaling acquisition system
The regional real-time monitoring big data analysis system obtains real-time signaling data through the specific kafka output interface of the signaling collection system, and can use the Web Service capability opening module of the signaling collection system to establish a connection, and propose authentication and real-time query requests. The real-time big data analysis module obtains the timing diagram of real-time signaling data from the signaling acquisition system. The process is described as follows:
1) The real-time big data analysis module sends an authentication request to the signaling acquisition system;
2) The signaling collection system performs authorization authentication and returns the authentication result;
3) The real-time big data analysis module sends real-time data requests to the signaling acquisition system;
4) The capability opening module of the signaling acquisition system detects the occurrence of a real-time query request and sends the Kafka output interface connection information;
5) Establish a connection between the real-time big data analysis module and the Kafka output interface of the signaling acquisition system;
6) The real-time big data analysis module analyzes the real-time signaling data and outputs the real-time monitoring results of the area.
(2) Being able to monitor and analyze the communication behavior of mobile users in the designated area in real time
The real-time signaling data analyzed by the system comes from the signaling collection system, which can obtain user dynamic events of the operator’s core network, including Cell-ID events such as Voice Event and Location Update Event, SMS call event (Sms Send receive Event). Therefore, the communication behavior analyzed by the real-time big data analysis function should include the following categories:
1) For receiving and making calls, the specific content should include the calling number, called number, call type (calling and called), location area (LAC) where the business occurs, cell-ID where the business occurs, call time, the duration of the call.
2) To receive and send short messages, the specific content should include the calling mobile phone number, the called mobile phone number, the type of the short message event (sending∖receiving), the cell (Cell-ID) where the service occurs, the sending or receiving time, and the length of the short message.
3) Location update. The specific content should include the user’s mobile phone number, user location area (LAC), user’s current cell (Cell-ID), location update time, location update event type (normal location update∖periodical location update). The real-time big data analysis function needs to realize the real-time screening of the call, short message, switch and position change signaling data in the area, so as to realize the screening of the mobile users and their communication behaviors in the designated monitoring area.
(3) The analysis results contain detailed communication behavior and personnel information
The value density of signaling data is low. The real-time signaling data after screening and analysis only includes signaling information such as Cell-ID, mobile phone number and time, but detailed communication behavior and corresponding personnel information should be displayed on the interface. The signaling analysis function should be able to correlate personnel information and obtain detailed analysis results.
Real-time tracking interface presentation
The real-time tracking function needs to understand and analyze the protocol involved in a complete call process or SMS process, from which, according to different message types, the various protocols are associated to form a complete process. Therefore, the real-time tracking function needs to track all services and network signaling triggered by users, and the process must be comprehensive. The user queries the user’s real-time signaling message according to the query requirements (calling number, called number, calling IMSI, called IMSI). After the user passes the setting conditions, the traced number signaling message can be displayed on the interface.
Results and discussion
Signaling display analysis
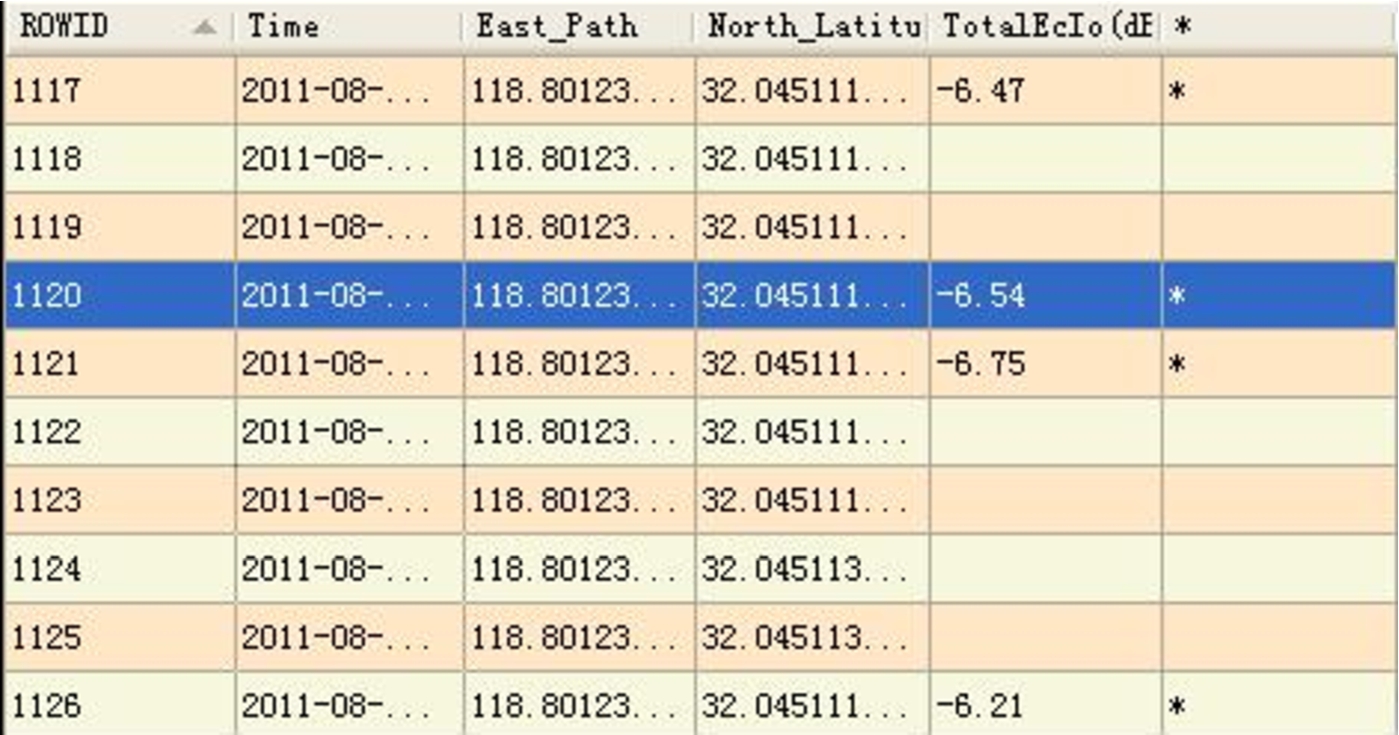
After clicking the query button on the interface, the filter conditions will be called from the interface, and then the data that meets the filter conditions will be statistically analyzed, and the statistical results will be generated according to dimensions and indicators. The so-called dimensions are the query time, OPC, DPC, and operation code. Office route information, the specific query results are shown in Table 1.
Specific query results
Specific query results
The statistical results are generated for each statistic based on the information of one office direction. The statistical results are of Err type. After the statistics of the signaling messages of a certain office direction, the total number of times, the number of successes, the success rate, and the number of failures are displayed. For failed messages, count the number of records corresponding to each failure reason value. The factors not mentioned in the article have no significant difference. The signaling display is shown in Fig. 3.
Signaling display (http://alturl.com/bbfq4).
For the calculation of the number of successes, sum up and add the successful signaling messages in the result code, and the rest are the failed signaling messages. The success rate is the number of successes divided by the total number of times, and the number of failures is expanded for each reason., Count the number of failure reasons. The result code of the signaling message is shown in Table 2.
Signaling message result codes
In the interface, according to the statistical results, the data information of the indicator can be dynamically displayed, such as the number of successes, the success rate, the number of failures, etc. The data information of the dynamic display indicator is shown in Table 3.
Data information of dynamic display indicators
After the establishment and application analysis of the monitoring system carried out by the signaling monitoring system in the provincial mobile company, the network problems reported recently were collected from the scene, and the cooperation of the 2G-BSC after connecting to the 3G switch was checked through the signaling monitoring system, and the A interface was checked The quality of the wireless network is problematic, and some network problems have been discovered. Based on the current monitoring scope and the overall situation, through the “Overall Distribution of Services” function module, based on the overall distribution of services from the bureau to GS12-2GBSC, the services are mainly divided into location update services, call services, SMS services, supplementary services, and other services. From the statistical data, it can be known that the “location update service” accounts for a relatively high proportion of the overall, indicating that the coverage of CI (cell) is somewhat small, resulting in frequent location update services, and the coverage of CI (cell) needs to be adjusted and optimized. The relationship between visits and service times is shown in Fig. 4.
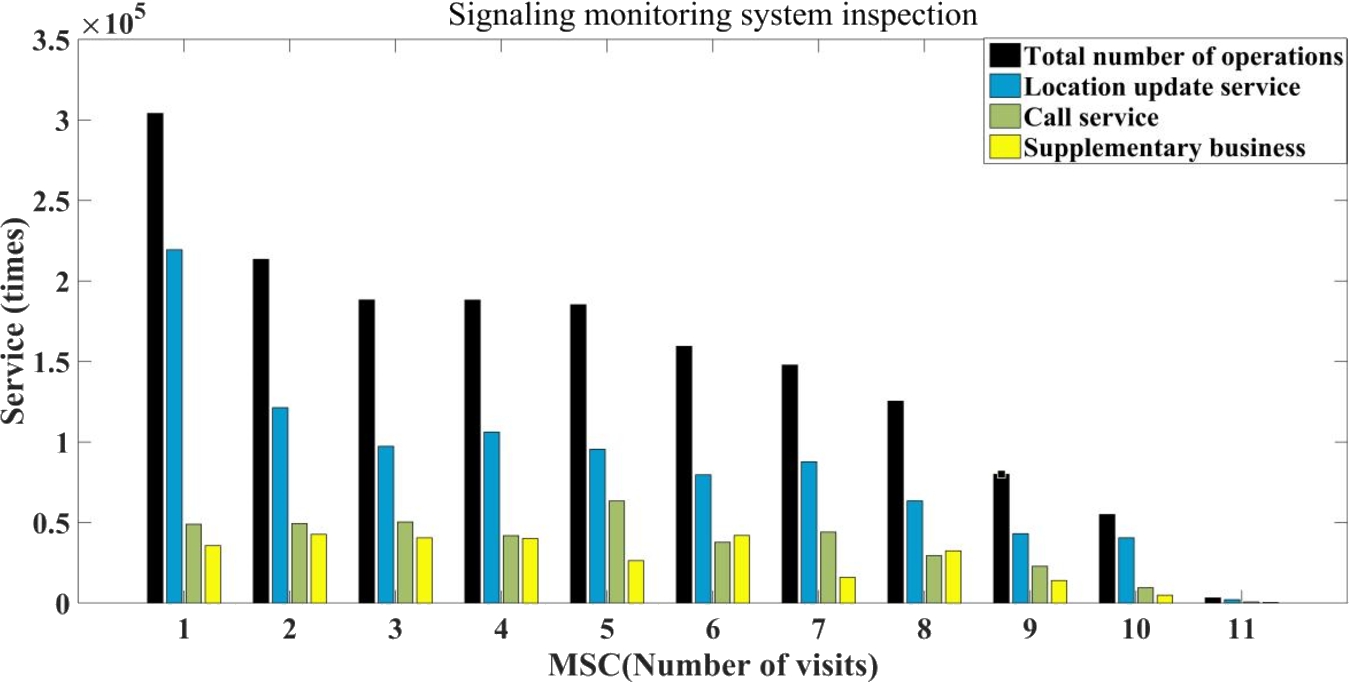
The relationship between visits and service times.
The statistics of business trends at different times are shown in Fig. 5. Through the comparative analysis of multiple periods, it can also be seen that the difference between the location update service and the call service is always large. The gap between call and SMS is small and the ratio is reasonable.
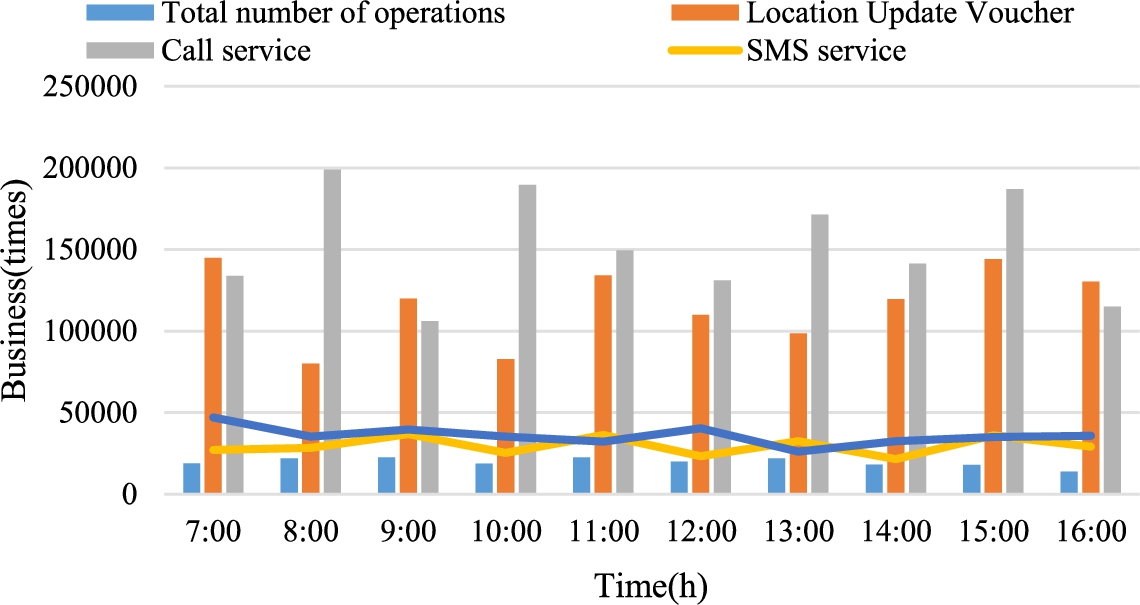
Statistics of business trends at different times.
The signaling monitoring system receives signaling messages between switches in real time, forms call records and stores them in the database. The monitoring system can generate a statistics every 5 minutes. For example, the network operation statistics from 9:55 to 10:00 can be generated at 10:05, which is timelier than the report of the switch (usually with a granularity of 1 hour). Using this feature, we collect the statistical values of the signaling monitoring system through the network management system, and express them in the form of graphs, etc., which can monitor the operating status of the network in quasi real-time. For example, on August 5 and September 9, 2019, when the monitoring personnel found that the network connection rate curve of G2 and GS9 had declined, they notified the technical support engineer in time. Through analysis, it is found that users in other provinces continuously dial roaming numbers of city end bureaus, resulting in the decrease of connection rate. After blocking these numbers, the network connection rate returned to normal. The average delay of the first paging and the average delay of the second paging are shown in Fig. 6.
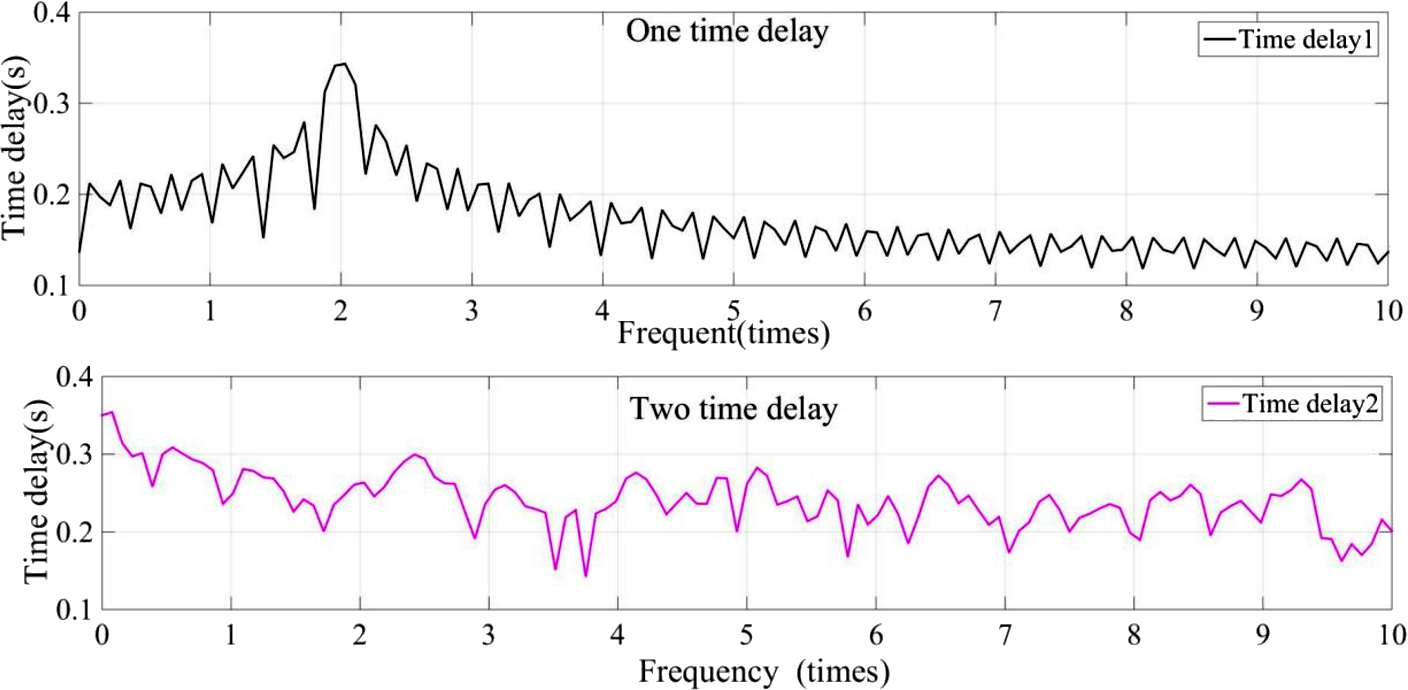
The average delay of a paging and the average delay of a second paging.
In order to better present the interception effect of inter-network harassment and fraud phone numbers, the inter-internet signaling tracking system is used to search for the inter-internet caller’s signaling according to the number that has been intercepted by the inter-internet blacklist, and a large number of inter-internet callers can be found. The call has been successfully intercepted by the gateway office. The verification showed that during November 2019, 4 inter-network harassing calling numbers, calling into the mobile gateway office from China Unicom gateway offices in different regions and cities, the call was rejected by the mobile gateway office, and the call time was all 0 seconds. With the increase in the number of calls, the interception rate is gradually increasing. The interception failure rate within 1 second is shown in Fig. 7. The interception success rate within 1 s is as high as 90%, and the interception effect of inter-network harassment numbers is actually visible.

Interception failure rate in 1 second.
This study mainly discusses the accurate mining of positioning data in communication field based on big data. The signaling preprocessing layer mainly obtains the signaling message through the acquisition module, filters the FISU message in the signaling message, judges the abnormal message frame, and stamps the time stamp to provide an effective data source for the next processing. Signaling access layer mainly completes the function of signaling link access. It mainly uses high resistance bridging technology, slot convergence technology, optical access technology and 155mdxc conversion technology to access 2 m link and 155 m link respectively. The signaling acquisition module needs to collect directly or transmit to the front-end data acquisition machine through the DXC centralized link, and access to the signaling acquisition module on the front-end machine. The signaling acquisition module completes part of the message processing work at the same time. Presentation layer is the window of human-computer interaction of the whole system, which presents users with friendly interface and perfect functions. The main goal of the real-time big data analysis function is to obtain the signaling data sent by the signaling acquisition system, filter out the effective information in the signaling data according to the monitoring conditions, and analyze it to get the final real-time monitoring results. Geographic information module provides visual map control for regional monitoring big data analysis module. Using the existing WebGIS map toolkit can reduce the difficulty of system development. This research is of great significance for better development and maintenance of signaling network and monitoring system. In the future, under the conditions that big data is becoming more and more developed, the precise mining of communication positioning data is extremely important, and it can also promote the development of the communication field.
Conflict of interest
The author has no conflict of interest to report.