
Abstract
Intrusion Detection is very important in computer networks because the widespread of internet makes the computers more prone to several cyber-attacks. With this inspiration, a new paradigm called Intrusion Detection System (IDS) has emerged and attained a huge research interest. However, the major challenge in IDS is the presence of redundant and duplicate information that causes a serious computational problem in network traffic classifications. To solve this problem, in this paper, we propose a novel IDS model based on statistical processing techniques and machine learning algorithms. The machine learning algorithms incudes Fuzzy C-means and Support Vector Machine while the statistical processing techniques includes correlation and Joint Entropy. The main purpose of FCM is to cluster the train data and SVM is to classify the traffic connections. Next, the main purpose of correlation is to discover and remove the duplicate connections from every cluster while the Joint entropy is applied for the discovery and removal of duplicate features from every connection. For experimental validation, totally three standard datasets namely KDD Cup 99, NSL-KDD and Kyoto2006+ are considered and the performance is measured through Detection Rate, Precision, F-Score, and accuracy. A five-fold cross validation is done on every dataset by changing the traffic and the obtained average performance is compared with existing methods.
Introduction
In the recent years, the internet has emerged as a routine and important necessity for people. Due to its widespread utilization in different fields like entertainment, teaching, and electronic communication, the demand for internet has risen very quickly. However, the widespread utilization of internet causes so many problems for people by inserting different kinds of cyber-attacks into the computer networks. In general, the attack or malicious intrusion enters into the computer information servers may break the security policies, i.e., availability, integrity and confidentiality (AIC). Hence there is a serious necessity to develop a novel cyber-security mechanism and it was attracted the attention of researchers from both academic and industry. Even though there is a huge availability of different security provision mechanisms like firewalls, user authentications and data encryptions, many organizations suffers from different kind of cyber-attacks [1]. Furthermore, Intrusion Detection Systems (IDSs) and Intrusion Prevention Systems (IPSs) can be utilized as a security measures in the network that can undertake the responsibility of malicious activities detection and prevention if the traditional firewall cannot provide effective protection of cyber-attacks. These systems are can be developed as a software application and also as a hardware appliance can analyze the network traffic automatically and notify the security concerns to the management office if required [18].
In general, according to the methodology followed for the intrusion detection the IDSs are broadly categorized into two distinct categories such as pattern matching methods and statistical anomaly method. The former one is also called misuse-based IDS or signature based IDS and it is able to detect the known attack patterns based on the patterns stored in the IDS database [17]. In these models, the audit logs are verified for the patterns those are interpreted as previous attack signs. If the IDS found that the pattern of newly incoming record is matched with any of the patterns stored in the IDS database, then it generates an alarm and to give a notification to security manager. However, the major drawback with pattern matching IDS models is their inability to identify the unknown attacks for which their patterns are not stored in the IDS database. On the other hand, the second one called anomaly based IDS searches for abnormal behaviors. In these models, the patterns of normal behaviors are stored.If the IDS found that the new incoming record has deviated with the profile of normal patterns then it is considered as attack and the IDS generates an alarm to give notification to the security manager. Even though this model can identify the unknown attacks, the main drawback is their higher false positives [31,45].
Even though the current IDS models have attained promising results in the detection of several kinds of attacks, the major challenge is the size of current network traffic data [2]. The huge sized network traffic data slow down the process and may consequences to unsatisfactory detection performance due to the difficulties occurred at computations of such data. The classification of such large sized data generally leads to too many computational difficulties and consequences to heavy computational complexity. For example, consider the standard intrusion dataset, i.e., KDD cup99. This dataset has almost five million training data connections and two million testing data connections. Such kind of data makes the IDS to fail and consequences to poor performance. Moreover, the large scale dataset consists of duplicate, redundant, and noisy information which results in critical challenges to data modelling and knowledge discovery. Further, the datasets are labeled in such a manner even for small changes in the features, they are considered as one different connection. This is one more due to which the size of dataset increases and results in heavy burden to the system.
To solve these problems, in this paper we propose a new IDS model which mainly concentrates on the removal of duplicate connections in intrusion datasets. Our main focus is made on the training data because to get a better performance the training data must be more. But as the training data increases, the system suffers from huge computational complexity. Hence, we propose a novel connections selection followed by feature selection mechanism based on linear and non-linear statistics of training data. Furthermore, we also employ a clustering mechanism through Fuzzy C-Means algorithm over the training data before subjecting it to feature selection. A simple and adaptive normalization process is also proposed to make the data uniform in nature. For connections selection, we employ correlation and for feature selection we employ Mutual Information between the traffic connections of training data. At testing, we apply feature selection through Sliding Window assisted Mutual Redundancy method and the obtained features are fed to SVM classifier for classification.
The rest of the paper is structured as follows; the details of the literature survey are outlined in Section 2. Section 3 explores the full-pledged details of proposed IDS model. Details of simulation experiments are discussed in Section 4 and conclusions are provided in Section 5.
Literature survey
Due to the possibility of different kinds of network compromising attacks, the computer needs to get updated every time and this updating always adds new features to the database. In the case of misuse based IDS, the new features belongs to the characteristics of different attacks while in the case of anomaly based IDS, the new features belongs to the characteristics of non-attacks (normal). Due to this continuous updating process, the database size increases quickly and for newly coming record, the detection takes much more time. Hence the feature selection is important in which instead of training the entire connection, only few features are updated those have similar semantics with the features trained already. Hence the feature selection followed by computational complexity reduction is the main research direction in IDS and most of researchers concentrated and developed so many methods [15,22,25,33].
Amiri et al. [6] proposed two different methods for feature selection based on linear and non-linear properties of Intrusion data. This approach proposed anew measure called feature goodness for feature selection. For linear analysis and non-linear analysis, they have employed linear correlation coefficient and mutual information respectively. Further for classification purpose, they have employed an improved version of Support Vector Machine (SVM) called Least Squares SVM (LS-SVM). Experimental analysis sis done with the help of KDD cup 99 dataset and performance is measured through classification accuracy.
Similarly, Ambusaidi et al. [3–5] also focused towards the feature selection based on statistical properties of network traffic connections in IDS. They proposed a new method called Flexible Mutual Information based Feature Selection (FMIFS) to extract only a subset of features those are discriminative and efficient to represent intrusion data. Further, they also employed Linear Correlation Coefficient (LCC) for linearity analysis between traffic connections. They successfully extracted only a few set of features those have independent and also have more contribution towards the class. Further for classification, they applied LS-SVM and the simulation experiments are conducted on the three standard intrusion datasets such as KDD cup99, NS-KDD and Kyoto2006+.
Zhao et al. [48] proposed a new feature selection algorithm called Redundant Penalty between Features based on Mutual Information (RPFMI) to select optimal features. The RPFMI considers three factors during the feature selection; they are redundancy between features, the effect between selected features and classes and the relationship between classes and candidate features. Two datasets such as KDD Cup99 and Kyoto 2006+ are employed for experimental validation and the performance is measured through accuracy measure.
To solve the feature selection problem and to select only optimal features for network traffic connections in IDS, Mohammadi et al. [28] proposed four feature selection algorithms such as Feature Grouping based on Pairwise MI, Feature Grouping based on LCC (FGLCC), Multivariate LCC based feature selection (MLCFS) and Feature Grouping based on Multivariate Mutual Information (FGMMI). Further for classification, they applied LS-SVM and the simulation experiments are conducted on KDD cup99, and NS-KDD and datasets. Due to the consideration of both linear and non-linear features, they assumed that it can be implementable on any kind of IDS. However, the major problem is the presence of duplicate connections at training phase which introduces a computational burden over the system.
Song et al. [40,41] proposed a Modified Mutual Information based feature Selection (MMIFS) method for Intrusion detection. After the selection of features through MMIFS, they employed the C4.5 classifier for classification purpose. For simulation purpose, they used KDD Cup99 dataset and performance is measured through accuracy measure.
Farahani [12] proposed a new method called Cross-Correlation based feature selection (CCFS) and employed four classifiers for classification purpose. The four classifiers are namely K-nearest neighbor (KNN), Decision Tree (DT, Naïve Bayes (NB) and SVM. Here the main intention of CCFS is the dimensionality reduction thereby the reduction of computational burden. For simulation purpose, they have considered four datasets such as KDD Cup99, NSL-KDD, AWID and CIC-IDS2017 and the performance is measured through accuracy, recall and precision.
Unlike the method those employed statistical measured for feature selection, Ji et al. [21] considered signal processing method for feature selection. They employed the complete work in three phases such as feature selection, visual analysis and classification. For feature selection, they employed Multi-level Discrete wavelet transforms (MDWT) [10], for visual analysis Principal Component analysis (PCA) and for classification, SVM was employed. NSL-KDD dataset is used to validate the developed IDS model. However, the data connections related to data traffic won’t have any significance of high land low frequencies.
Some authors focused on the clustering and employed different clustering methods for Intrusion Detection [20,29]. Sandosh et al. [37] employed modified K-means clustering algorithm for data segmentation. In this approach, the authors proposed an enhanced IDS via agent clustering and classification based on outlier detection (EIDS-ACC-OD). At the start, the pre-processing is employed to eliminate the unnecessary spaces through outlier detection and the employed modified K-means for segmentation. Finally they employed KNN algorithm for the classification of attacks.
Yang et al. [46] employed the Fuzzy aggregation model to reduce the size of training data by proposing a Modified Density Peak Clustering (MDPCA) [34]. This approach tried to reduce the size and also ensures the imbalance of the samples by dividing the training data into several blocks with similar semantics. Every subset of trained with the help of Deep Belief Networks (DBNs) [16]. For every subset, one sub-DBN is used for training through which the system can learn the high level abstract features and reduces the data dimensions. For simulation purpose, they have employed two datasets such as NSL-KDD and UNSW-NB15 and the performance is measured with accuracy, recall, precision and F-score.
Jackins and Punithavathani [19] proposed an unsupervised method based on hybrid clustering algorithm by combining Fuzzy C-Means algorithm and Incremental Support Vector Machine (ISVM) for anomaly detection. After FCM and ISVM, the processed data is fed to DBSCAN algorithm for further anomalies detection. For simulation purpose, they have employed two datasets such as KDD Cup99 and Gure KDD Cup database [32] and the performance is measured with true positive rate.
Hajisalem and Babaie [14] proposed a hybrid method for Intrusion detection by combining two algorithms such as Artificial Bee Colony (ABC) [13] and Artificial Fish Swarm (AFS) [7,26]. For the removal of redundant information from intrusion dataset, they have employed FCM and Correlation based feature selection algorithms. Additionally, they employed If-Then rule through CART [9] method for the detection of normal and anomaly records based on the selected features. The simulation is done one two datasets such as NSL-KDD and UNSW-NB15 and the performance is measured through detection rate, false positive rate, computational complexity and time cost.
Elbasiony et al. [11] proposed a hybrid IDS algorithm for the detection of bot anomalies and misuses. In misuse detection, they employed the Random Forests classifier to train the intrusion patterns and then perform matching between test patterns and trained patterns. Further, for anomaly detection, they used a weighted K-means clustering and cluster the network connections. KDD Cup99 dataset is used for the simulation experiments. Recently a one more method is proposed for intrusions detection based on K-means. Meng et al. [27] proposed an improved version of K-means algorithm for Intrusion detection in computer networks. Initially, the PCA algorithm is applied to reduce the dimensionality of dataset and then the outlier detection is used for the elimination of outliers that have great impact on the final clustering results. The initial clustering center is chosen with the help of distance such that it can get an optimal local solution and then the K is used t get final cluster centers. Simulation is done with the help of KDD Cup99 and the performance is measured through detection rate, and false positive rate.
Proposed approach
Overview
In this paper, we propose a new Intrusion Detection mechanism based on statistical processing and machine learning algorithm. Here our main intention is to remove the duplicate information in the Intrusion detection process (at both training and testing). In IDS, to detect the intrusion, initially the system needs to get trained about the intrusions. At the training phase, with an increase in the size of data, the detection performance increases. However, as the size of data used for training increases, the computational complexity also increases. Hence in our proposed model, we mainly focused on the reduction of duplicate or redundant data connections and also the features from every connection. For this purpose, we proposed a new feature selection mechanism called Mutual Clustered Redundancy based Feature selection (MCRFS) by combining two different methods based on linear and non-linear statistics of data. We employ the linear method for the elimination of duplicate connections while we employ the non-linear method for duplicate features removal. Under linear method, we employed the Pearson Correlation Coefficient (PCC) and at non-linear method, we employed Mutual Information (MI). In our model, initially we propose a data pre-processing approach based on the normalization. Next, the normalized data is subjected to clustering and here for clustering purpose, we employed Fuzzy C-Means (FCM) clustering algorithm. The clustering is applied only over the training data and once the clustering is completed, the data is subjected to feature selection and the final features are trained through SVM algorithm. In the case of testing, we apply normalization followed by feature selection and classification. The complete block diagram of proposed IDS model is shown in Fig. 1.
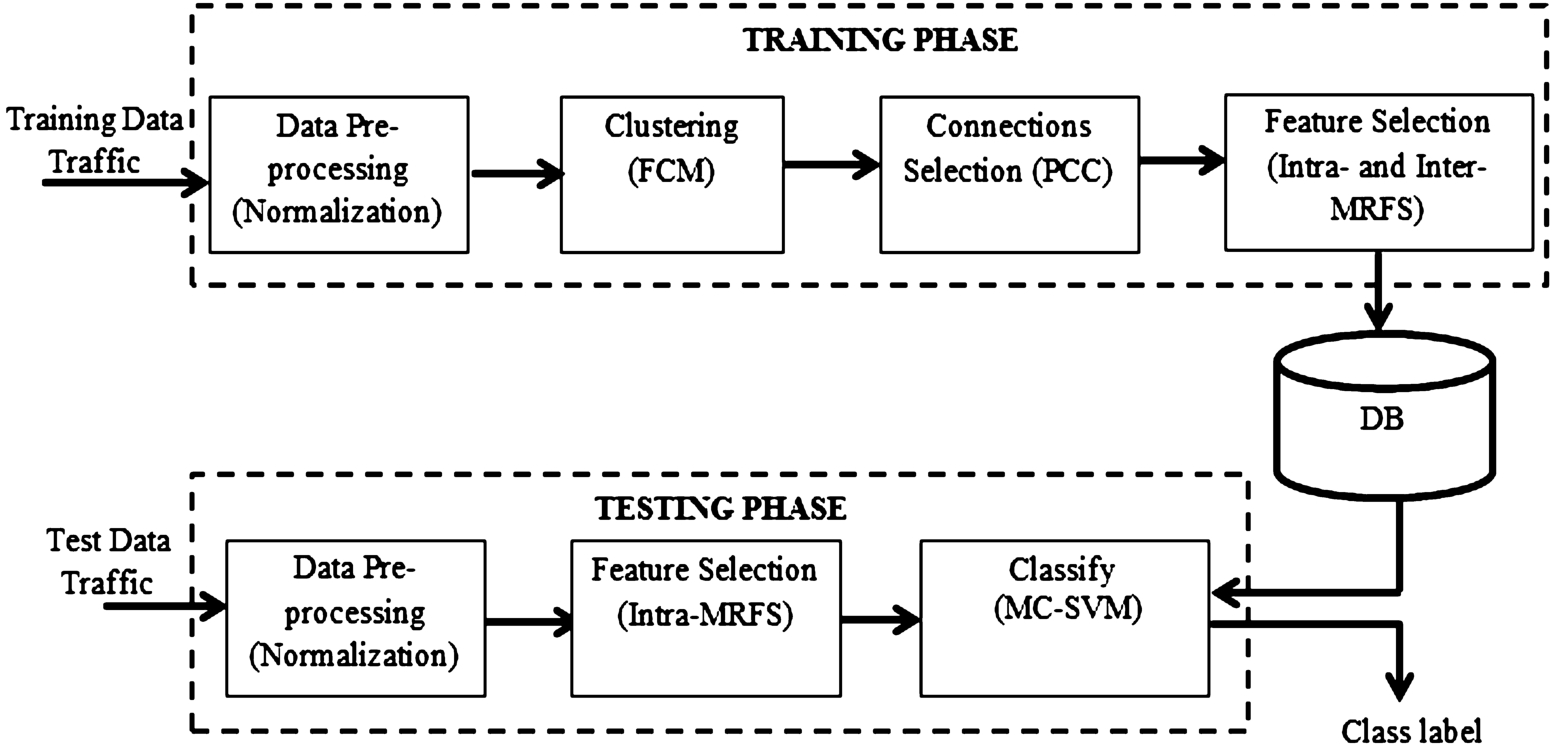
Block diagram of proposed IDS model.
Data pre-processing is an important step in IDS. Even though it consumes a considerable time for processing, it is necessary to implement because the raw data comes from heterogeneous environments and can be inconsistent, incomplete, redundant and noisy [24]. Hence it is necessary to transform the raw data into some suitable form for the analysis and knowledge discovery. For example, consider NSL-KDD dataset, every traffic connection is represented with a set of features and they are not in same format. Some features are symbolic in nature, some features sand numerical and some features are binary format. To process this dataset, all the features are needed to be in uniform format. Similarly, consider a one more dataset called CIC-2017IDS in which the feature called “Fwd Header Length” appears twice in every traffic connection. Further, there is a one more feature called “Flow Packets/s” which contains abnormal values like ‘NaN’ and ‘Infinity’. Some more intrusion datasets are there in which the traffic connections are incomplete and also have missing features. Hence to sort out all these problems, a data processing is needed and it varies from dataset to dataset. For NSL-KDD dataset, the pro-processing follows a normalization process while for CIC-IDS2017 [38] dataset, the data preprocessing includes the removal of duplicate features and replacement of incomplete or missing features with zeros.
Consider the NSL-KDD dataset in which each and every connection have 41 features. Among these 41 features, the features 2, 3 and 4 are in the symbolic form and the remaining features are in numerical form. Here the feature 2 is protocol, feature 3 is flag and feature 4 is service. Except these three features, the remaining 38 features are continuous and are of numerical values. The details of these three features are shown in the following Table 1.
Details of symbolic features of NSL_KDD dataset
Details of symbolic features of NSL_KDD dataset
As demonstrated in the above Table 1, we can observe that there are four different protocols (i.e., TCP, UDP, ICMP and ARP) and 13 different Flag types (OTH, REJ, RSTO, RSTOS0, RSTR, RSTRH, SHR, SF, S0, S1, S2, S3, SH) and totally 70 different service types. These three features are subjected to normalization. For normalization purpose, we consider the probability of occurrence of each feature. For example consider the Protocol column in NSL-KDD dataset. In this column, initially we measure the total number of occurrence of TCP protocol and the obtained count is divided by the total length of column. The Step by step process of normalization is demonstrated here;
Where
Where
Step 4: Measure the probability of each feature as
Where
For other datasets, if we observe the incomplete connections, then the connection is completed by adding zeros in sufficient number. Similarly for the datasets which have connections with abnormal values like NaN and Infinity, they are replaced with 0’s.
Clustering is applied here only over the training data. Since the size of training data is very large, at classification, the classifier suffers with huge computational complexity when it performs matching between training data and test data. In the case of IDS, the training phase requires a larger number of traffic connections and then only the performance of IDS will be good. However, as the size of training data increases the complexity also raises. Hence we have focus on the training data which should be less sized and more informative. Means we have to train larger sized data in a compact manner. To sort out this problem, clustering is one possible way which groups the data with similar semantics. In clustering, the data is represented in the form of clusters. Consider the NSL-KDD dataset in which the original training data have 125,973 connections. Training of all these connections creates a huge burden over the system. Hence we apply clustering over the training data and cluster the entire data into several clusters. At here, the total number of clusters into which the data needs to get clustered is completely user dependent. For instance, to cluster the NSL-KDD dataset we consider five clusters.
In our method, for clustering purpose, we use the most popular Fuzzy C-means clustering (FCM) algorithm. FCM is initially proposed by Bezdek [8]. Due to its novel properties such as simplicity of implementation, output validity, heterogeneity between subsets, homogeneity within subsets and concerning data in same subset, FCM is used here for clustering purpose [23,47]. Before applying the FCM clustering over the training data, we compute the entropy of very connection in the dataset. Consider the dataset X with size
Where
Where m is a real number greater than 1,
And
The iteration process is terminated when the following condition met
Where ε is the termination threshold which lies in between 0 and 1 and q indicates the iteration number. At the start of the iteration, i.e., q = 1, C number of cluster centers are randomly selected and an initial fuzzy membership function is measured between all entropy values and cluster centers. After this process, based on the obtained values, the cluster centers are updated. This process is repeated until the condition shown in Eq. (7) is met. Once the termination condition is met, the connections are grouped based on the indices of entropy values present in each cluster. Based on this process, we can state that the clustering of connections with similar semantics will reduce the unnecessary computational burden over the system. Moreover, we also analyzed that the different traffic connections of same class have only small deviations in their feature values. Clustering of such kind of connections will improve the efficiency and lessens the computational burden over the system. After the completion of clustering, we focus on eth removal of duplicate connections in every cluster and it was accomplished through the correlation statistics of data connections in every cluster.
Correlation based connections selection
Once the entire training data is grouped into different clusters, then our responsibility is to find the duplicate connections and their removal from every cluster. Here the meaning of duplicate connections specifies the connections with similar attributes. For example, in the NSL-KDD dataset, the total number of normal training connections at training is 67,343 which are very large in number. If all these connections are processed, then it constitutes a huge computational burden over the system. Hence we focus on the detection and removal of duplicate connections in every cluster based on correlation properties. For this purpose, we use the standard Person Correlation Coefficient (PCC) which finds the linear relations between two variables [30]. Consider two connections, X and Y from any cluster, the PCC is calculated as
Where
And
Where
Here
After the computation of threshold, every value of Q is compared with the threshold T to find out the duplicate connections. If the value of
Feature selection through mutual redundancy
Once the connections are finalized for every cluster, then we apply feature selection method to find out the set of features which can contribute more towards the representation. In our method for feature selection, we apply a sliding window assisted mutual redundancy method. Here we try to find the non-linear relation between the connections of same cluster. For a cluster, we understood that the connections are linearly related but the features are non-linearly related. Hence we need to find the non-linear relation between features and only few features are selected from every connection those have more contribution towards the class representation. For feature selection process, we followed our earlier contribution [44] in which we apply Sliding window as a preprocessing and Duplicate Mutual Information (DMI) for feature selection. In this method, we initially divide the entire connections into several blocks of equal size through sliding windows of size 5. Consider
Where
Where
Where
In the case of If If If
Simulation experiments
In this section, we discuss the details of simulation experiments conducted over the developed IDS model. For the simulation purposes, we used MATLAB software and a personal computer with 1 TB hard disk and 8 GB RAM. To show the effectiveness of developed model, we simulate it over different datasets with different characteristics. Initially we explain the details of dataset and their settings made before processing for simulation. Next we explore the details of results derived during the simulation and finally a simple comparison is explained through which we can prove the effectiveness of our method.
Datasets
During the evaluation of IDS, the major challenge faced by researchers is the discovery of an appropriate intrusion dataset. Capturing a real time intrusion dataset is a great issue for all researchers since it required a lot of components that are considered as critical for the researchers. Due to this reason, many researchers consider the simulated datasets such as most well-known KDD Cup 99 dataset [35], NSL-KDD Dataset [42] and Kyoto 2006+ dataset [39]. According to the Tsai et al. [43], most of researchers utilized the KDD Cup99 dataset for experimental validation. Moreover, these three datasets are of different sizes and also have represented with different set of features. Hence, in order to ensure a fair and rational comparison with the existing methods, we have selected these three datasets to assess the performance of our IDS model. The details of every dataset are demonstrated here;
KDD Cup99 dataset
The KDD Cup 999 dataset is one of the most popular dataset which is generally used by many researchers. This dataset is constructed in the year of 2000 and it is built based on the data captured in one IDS evaluation program. This Dataset consists of totally five different classes such as Normal, Denial of Service (DoS), Probe, User-to-Root (U2R) and Remote-to-Login (R2L). Among these five, the first one is normal and the remaining are attacks. This dataset approximately consists of five million training traffic connections and two million test traffic connections. Each connection is represented with 41 features which are classified into three different classes; they are Basic features, Traffic features, and content features. Further the Traffic features are classified as same host features and same service features. Here the main intention behind the consideration of KDDCup 99 dataset for simulation is the availability of huge number of connections for every class. The details of training and testing connections of KDD Cup 99 dataset are shown in the Table 2.
Statistics of the KDD Cup99 dataset
Statistics of the KDD Cup99 dataset
The NSL-KDD dataset is a revised version of KDD Cup 99 dataset that was constructed by Tavallaee et al. [42]. This dataset have less number of traffic connections when compared with the KDD Cup 99 dataset. Similar to the KDD Cup99, in NSL-KDD also, each connection is represented with 41 features and total number of classes present are four (normal, DoS, Probe, U2R and R2L). Further, the NSL-KDD includes three dataset such training (10% of KDDCup99 and
Statistics of the NSL-KDD dataset
Statistics of the NSL-KDD dataset
Kyoto2006+ is one more standard intrusion dataset that was constructed by Song et al. [39]. In this dataset, each connection is represented with 24 features and they are categorized into two categories; they are conventional features and additional features. Among the 24 features, the first 14 are derived based on the features of KDD Cup99 dataset. Among the total 41 features of KDD dataset, only 14 features are considered here which has more significance and they were acquired based on the Honeypot deployed in the University of Kyoto. In addition, during the observation in Kyoto University, 10 more features are extracted which may enable the users to investigate the ongoing process in network. For experimental analysis, here we have considered the data acquired on the dates of 12, 13, 14, 15, and 16 of November 2006. From these dates, totally we have procured 93240 connections among which the 71885 are attacks and 21355 are normal. This categorization is done based on the label present in the dataset. Among the 93240 connections, we have employed 70% for training and the remaining 30% for testing. Means among the 71855, 50320 connections are used for training and remaining 21565 connections are used for testing. In the case of attacks, among the available 21355 connections, 14950 are used for training and 6405 are used for testing.
Results
The performance of developed ID model is asses with respect to the capability of its correct assessment of every class. For this assessment, we conduct a five-fold cross validation on every dataset by changing the traffic connections. At every validation, the total number of connections used for training and testing is kept constant but used different connections for training and testing. After the simulation process, the complete detected results are represented in a confusion matrix. Based on these confusion matrices, we measure the performance with different performance metrics such as Detection Rate, Precision, F-Score, False Negative Rate (FNR), False Positive Rate (FPR), False Alarm Rate (FAR) and Accuracy. For the simulation of KDD Cup99 dataset, we used the available 10% KDD Train and KDD Test data. Next, for the simulation of NSL-KDD, we used the connections is
Confusion matrix of results from the simulation of KDDTest of KDDCup99 dataset
Confusion matrix of results from the simulation of KDDTest of KDDCup99 dataset
Performance metrics of proposed method for KDDTest of KDDCup99 dataset
The values shown in Table 4 are the results obtained after the simulation of developed IDS model over the KDD Cup 99 dataset. Here for the simulation, we consider totally 3, 11, 029 traffic connections. The values demonstrated here are the best values those are obtained in our five-fold cross validated simulation. At this phase, due to the more number of possibilities of DOS attacks, we consider more number of connections for DoS Category. The two attacks namely DoS and Probe are called major attacks and the remaining R2L and U2R attacks are called minor attacks. Due to this reason, we can observe a less number of connections of these minor attacks in every dataset. Further, we measure the performance through the performance based on values shown in Table 4 and the resultant values are shown in Table 5. From this table, we can see that the maximum DR (96.3212%) is observed for Normal and minimum DR (73.6154%) is observed at U2R. Similar, the maximum precision (99.1554%) is observed at DoS and minimum precision (15.2314%) is observed at U2R. Since the U2R is a minor attack which has less information at training phase, we obtain a less DR and Precision. Next, the FNR and FPR simply follow an inverse relation with DR and PPV respectively and FAR is the average of FPR and FNR. Finally we measured the F-score for every class and the maximum value is observed at DoS class and minimum value is observed at U2R. The major intention behind the consideration of KDD Cup 99 dataset for simulation is that it has a huge number of record which can help in the realization of our concept, i.e., correlation based connections selection. At this phase, we remove the duplicate connections and trains only informative connections. Generally with the decrement in the connections number at training the system may lose some information and consequences to less performance. But we can see from the obtained results, we have gained satisfactory results and the main reason is information preservation through correlation calculation.
Confusion matrix of results from the simulation of
Performance metrics of proposed method for
After the simulation of developed IDS model over NSL-KDD dataset, the obtained results are demonstrated in the form of confusion matrix in Table 6. At this phase, for the simulation purpose, we considered the 75% of traffic connections from KDDTest+ and as usual 100% of connections are used from KDDTrain+. Since there is possibility to reduce the number of training connections through our proposed method (correlation based connections selection), we considered an entire connections set for training. Even though the NSL-KDD dataset is a selective one which was retrieved from large sized KDD Cup 99 dataset, it also has some redundant and duplicate connections particularly at normal class. For normal class, almost the KDDTrain+ has 67343 connections which is a very huge number. Training of this many connections constitutes a larger burden over the system. Hence it was subjected to clustering followed by correlation to remove the connections with duplicate semantics. From the results shown in Table 6, we can observe that our new model classified all types of classes effectively even though the trained data is less. Since we select the connection and the respective features based linear and non-linear properties of data, the loss if significant information is less. From the performance analysis shown in Table 7, we can see that the maximum DR (96.9964%) maximum PPV (97.3121%) is observed for Normal class while the minimum DR (79.3314%) and minimum PPV (65.3484%) is observed for U2R class. Further the FPR and FNR follows inverse relation with PPV and DR respectively.
For further simulation, we approached a simple dataset called Kyoto2006+. Under this dataset, there is only two classes. They are normal and attacks. From the results shown in Table 8 and Table 9, it can be seen that both classes have optimal performance. In this case, due to the possibility of only two classes, slight higher values of FPR can be observed. Means the false positives count is high. The main reason is that even for a small deviation in the features of an incoming traffic connection, the system classifies it wrongly. Hence the PPV of attacks is observed to be only 80.8854% which is relatively lower value. On an average the overall performance is observed to be high.
Confusion matrix of results from the simulation of Kyoto2006+ dataset
Performance metric of proposed method for Kyoto2006+
Performance comparison of proposed method with recent methods
Table 10 shows the details of comparative analysis between the proposed and several existing IDS models. In This comparison, we consider the maximum performance measures that were observed in their articles. Since our MCR-FS is oriented to two new contributions, the comparison is employed with the methods those have same methodology. For instance, the methods RPFMI [48], FGLCC [28], FSVM [4], MMIFS [40,41] are mainly concentrated on the feature selection and commonly taken the Assistance of Mutual information. All these methods developed a revised version of MI which can measures the non-linear dependency and select et features those have higher independency. After feature selection, they have considered different machine learning algorithms for classification. Unlike these methods, CCFS [12] used correlation measure for the feature selection and they have considered the linear relations between intrusion traffic connections. However, the intrusion data is not restricted to a single orientation, i.e., the data connections are both linear and non-linearly connected. For such kind of data, the feature selection method must be in such a way it should derive both relations and select only optimal features which satisfies both constraints. Unlike these methods, MDWT [21] applied DWT for feature selection process. However, in text data, there is no matter of frequencies. Even though it has gained a better accuracy, this kind of approach won’t opt for Intrusions detection. Next, some methods like MDPCA-DBN [46] and IK-Means [27] applied clustering techniques to reduce the burden of computational complexity by removing the excess data from train data. However, they didn’t check the relations between the connections of same cluster. Since the connections belong to a single cluster may have similar semantics, the removal of such kind connections will lessen the computational burden. At this phase, the random removal may consequences to worst classification performance. A perfect measure is required through which the exact relation between the connections of a single cluster may estimate. In our present contribution, we concentrated on this fact and employed a correlation based connections selection from every cluster. At this phase, the linear relations between the connections are found and the connections those are too similar are removed. Further at feature selection, we employed non-linear measured and removed the duplicate features according to our earlier contribution i.e., MRFS-MC-SVM [44]. Hence our method has achieved a maximum accuracy compared to the all existing methods.
Conclusion
In this paper, we developed a new IDS model to detect intrusions in computer networks based on the statistical processing and machine learning. The statistical processing techniques include Correlation and Mutual Information. Next the machine learning algorithms includes FCM and SVM. The main responsibility of correlation measure is to discover the duplicate connections in training data while the main responsibility of Mutual Information is to find the duplicate feature in every connection. Next, the FCM is employed to cluster the training data into different cluster such that the system suffers with less computational burden. Finally the SVM executes the task of classification. For experimental analysis, three standard datasets such as KDD Cup 99, NSL-KDD and Kyoto2006+ are used and subjected to a five-fold cross validation be chaining the training testing connections. At every dataset, we attained a satisfactory result in the classification of attacks and normal. On an average, the obtained accuracy is observed as 97.6695% while the average false alarm rate is observed as 0.7012% which is much better compared to the state-of-art methods.
Conflict of interest
None to report.