
Abstract
In the next generation wireless networks, the number of connected terminals to the network, communication protocols, and the channels available will be increased, thus network slicing will become more important. Also, vehicles, buses, trains and motorcycles are considered communication terminals. These communication terminals should have independent network management considering their movement such as joining and leaving the networks. Therefore, Delay-Disruption-Disconnection Tolerant Networking (DTN) has been attracting attention for their potential support of inter-vehicle communication. In this paper are presented the Contact-Time (CT) based and Adaptive-Timer (AT) based Message Suppression (MS) methods for Vehicular DTN. For the CT-based MS method are used three DTN protocols for Vehicle-to-Vehicle (V2V) and Vehicle-to-Infrastructure (V2I) communication. For AT-based MS are used conventional Epidemic and two proposed Epidemic-based methods for V2V communication. We compare MS method, Message Suppression Controller (MSC) and MSC with Adaptive Threshold (MSC-ATh). The simulation results show that MSC-ATh performs better than other approaches. The storage consumption is improved when the number of vehicles increases and there is no reduction in PDR even if the message suppression is enabled. For Epidemic, when the number of Road-Side Units (RSUs) is 16, the results of PDR are the best compared with other DTN protocols. The MSC-ATh method is about 22% better than Epidemic for storage consumption. Also, the delay performance of MSC-ATh is improved by increasing the Suppression Coefficients (SCs) and number of vehicles.
Introduction
In order to realize a resilient and vigorous society, the information and communication network infrastructure based on Beyond 5G should be inclusive, sustainable and highly dependable [3,24]. Inclusive life requires a network system that supports the infrastructure of a society. The network should be designed to have low loss, convenience and sustainable growth. Moreover, the future networks should support human-centered society where security and safety are maintained and trust in a relationship is strong even when unexpected situations such as COVID-19 pandemic occur.
In the future wireless networks, vehicles, buses, trains and motorcycles are considered communication terminals. With the rapid improvement in the communication area covered by a single terminal, the core network at the edge will become more important to control. Also, the number of connected terminals to the network, communication protocols, and the channels available will be increased, thus network slicing becomes more important. These communication terminals should have independent network management considering their movement such as joining and leaving the networks. Therefore, Delay-Disruption-Disconnection Tolerant Networking (DTN) has been attracting attention for their potential support of inter-vehicle communication [6–8,12,19,30]. Many researchers and developers have proposed several algorithms for message ferrying [1,5,9,14–17,20,23,26,31,32,34,35]. Due to the overhead of the conventional DTN approach, the consumption of network resources and storage become critical issues. Therefore, recovery approaches have been recommended as possible solutions to solve these problems [10,13,27,28,33].
In this paper, we present the Contact-Time (CT) based and Adaptive-Timer (AT) based Message Suppression (MS) methods for Vehicular DTN. For the CT-based MS method, we use three DTN protocols for Vehicle-to-Vehicle (V2V) and Vehicle-to-Infrastructure (V2I) communications. For the proposed AT-based MS, we use conventional Epidemic and two enhanced Epidemic-based methods for V2V communication. The simulation results show that Message Suppression Controller with Adaptive Threshold (MSC-ATh) performs better than other approaches. The storage consumption is improved when the number of vehicles increases and there is no reduction in Packet Delivery Ratio (PDR) even if the message suppression is enabled. For Epidemic, when the number of Road-Side Units (RSUs) is 16, the results of PDR are the best compared with other DTN protocols. The MSC-ATh method is about 22% better than Epidemic for storage consumption. Also, the delay performance of MSC-ATh is improved by increasing the Suppression Coefficients (SCs) and number of vehicles.
The structure of this paper is as follows. In Section 2 is introduced the related work. In Section 3 is explained the simulation modeling. In Section 4 is presented the proposed CT-based MS method and its evaluation. In Section 5 is explained the proposed AT-based MS methods for inter-vehicle communications and their performance evaluation. In Section 6 are given conclusions and future work.
Related work
DTN
The DTN can provide sustainable internet connectivity for space missions [7,19,30]. The space networks are susceptible to link failure, disconnection and significant delay. The intermediate nodes in Vehicular DTN keep bundle messages in their storage before transmitting them to other nodes. The RFC 4838 [4] specifies the network architecture.
Presently, many DTN protocols such as Epidemic [18,29], Direct Delivery, Spray and Wait (SpW) [25] and MaxProp [2] protocols are proposed. The Epidemic protocol is performed by using two control messages to replicate a bundle message. The bundle protocol is specified in RFC 5050 [22]. Each node periodically broadcasts a Summary Vector (SV) in the network. The SV contains a list of stored messages for each node. When the nodes receive the SV, they compare the received SV to their SV. The node sends a REQUEST message if the received SV contains an unknown bundle message. In this method, consumption of network resources and storage state become critical issues, because the nodes replicate bundle messages to adjacent nodes in their communication range. Then, the received bundle messages remain in the storage and the bundle messages are continuously replicated even if the end-point receives the messages. Thus, recovery schemes like timers and anti-packets may delete replicated bundle messages in the network.
Due to the high latency of the sparse network, the anti-packet deletes duplicated messages too late. In the typical anti-packet, the endpoint broadcasts the anti-packet, which comprises a list of received bundle messages. Then, the nodes remove messages and duplicate the anti-packet. In the case of the typical timer, the messages have a lifetime and are removed at regular intervals after their lifetime has elapsed. Therefore, an adaptable lifetime algorithm is needed for utilizing in various environments.
The Direct Delivery does not send a copy of the bundle message to intermediate vehicles. It sends the bundle messages to the end-point directly. The SpW achieves its goal of optimizing network resources by imposing a strict upper limit on the number of copies of each bundle message allowed in the network. The procedure is broken down into two distinct phases: the spray phase and the wait phase. When compared to Epidemic, it is possible to reduce the cost of communicating with others.
The MaxProp is able to solve the problem of storage by prioritizing not only the schedule of packets to be dropped, but also the schedule of packets to be transmitted to other vehicles. The MaxProp will send packets with a high priority when it makes contact with a vehicle that is adjacent to it. These packets will be sorted according to their hop count. When the storage becomes full, the MaxProp will discard the packets with a low priority. These packets are arranged according to the likelihood that they will be delivered.
Inter-Vehicle Communication based on V2V and V2I
The IEEE 802.11p is an approved amendment to the IEEE 802.11 standard that supports Wireless Access in Vehicular Environments (WAVE). It specifies 802.11 enhancements required to support applications for intelligent transportation systems. The 802.11p standard is based on the IEEE 802.11 architecture, but version “p” is designed for V2V and V2I communication in Vehicular Ad-Hoc Networks (VANETs). This technology uses the 5.9 GHz frequency band in different places such as cars, open spaces and downtown. This standard says that WAVE is the signaling method and interface functions that are controlled by physical layer devices in situations where physical layer properties change quickly and information exchanges are short. This standard gives a set of rules for making sure that wireless devices can talk to each other in environments and times that change quickly.
Simulation modeling
We implemented the proposed methods in Scenargie [21] simulator. We carried out the simulations using Scenargie and send bundle messages between start-point and end-points. The number of end-points and support for mobility depend on the scenario and are explained in the following sections.
Setup for CT-based MS method
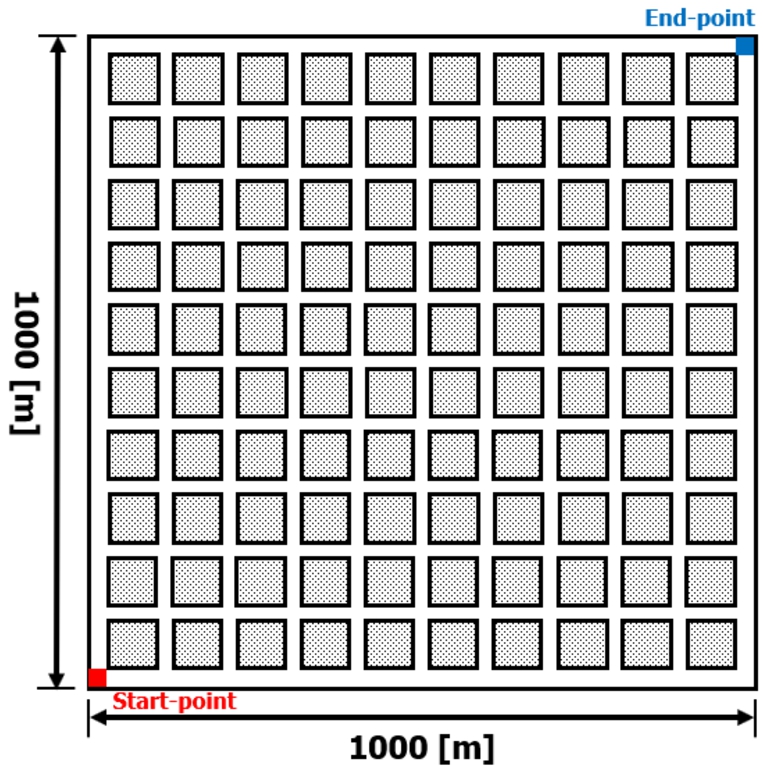
In Fig. 1, we show a grid road model with RSUs to evaluate our proposed CT-based MS method. We consider an urban grid scenario with 300 vehicles in the network. Twenty RSUs are built as shown in Fig. 1. When there are four RSUs, they are distributed evenly around the region at the four corners. Simulation parameters are shown in Table 1.

Model of grid roads considering 300 vehicles and maximum 20 RSUs.
Simulation parameters for CT-based MS method
We consider a scenario within an urban grid with 50, 100 and 150 vehicles/km2. Within the structure of the road model, we consider the buildings at each corner (see Fig. 2). In this scenario, RSU is committed in ten percent of the intermediate vehicles. In our simulations, we considered IEEE 802.11p standard, which is intended to provide a set of specifications with the goal of ensuring interoperability between wireless devices that can communicate in environments that are prone to rapid change during specific time periods. Table 2 shows the parameters that are used to evaluate the AT-based MS methods. The proposed AT-based methods do not depend on RSU. The following proposed methods are based on Epidemic protocol and send bundle messages from start-point to end-point for different parameters.
Message Suppression Controller (MSC) MSC with Adaptive Threshold (MSC-ATh)
The total distance between the start-point and the end-point is about
Road model with fixed start-point and end-point.
Simulation parameters for AT-based MS method
Nowadays, the RWP mobility model is utilized in the large majority of simulations. In RWP mobility model, every node is considered mobile and the nodes go from one way-point to another way-point. The following guidelines are followed by every node in the network.
The node determines an initial starting position within the simulation area based on a random seed (
It selects a location at random selected from the region to serve as the next way-point (W).
Then, it starts driving in the direction of the destination W at a speed that is randomly selected from the range of
After reaching destination W, the node pauses for a time randomly chosen
Then it repeats steps (2) to (4) until the simulation time
The RWP mobility model is based on GIS and has been designed to be applied to VANETs. It restricts the movement of vehicles to the streets that are indicated by the map data for real cities. Additionally, it limits the mobility of vehicles based on the vehicular congestion situation and simplifies traffic control methods. The runtime and memory usage of the mobility model are moderate and the model scales well with the size of the simulated network. We considered a GIS-based RWP mobility model to control the movement of vehicles.
Description of CT-based MS method and its evaluation
In this section, we present a CT-based MS method for V2V and V2I communication.
Overview of CT-based method
In [11], we have proposed CT-based MS method. The proposed method works together with typical DTN protocols such as Direct Delivery, SpW and Epidemic. MS method use three control packets to manage for delivering the bundle message (see Table 3).
Control packets information for CT-based MS method
Control packets information for CT-based MS method

Sequence chart of CT-based MS method.
The RSUs send MS-HELLO message to vehicles at each interval. In the case when a vehicle, let say vehicle B, receives two messages from vehicle A, it sends the messages to other vehicles except vehicle A, as shown in Fig. 3. When vehicle B receives MS-HELLO message again from the same RSU, vehicle B sends the Acknowledgment (ACK) to the RSU. Then, RSU sends to vehicle B the MS-Request. When the RSU receives the ACK from some vehicles, the RSU knows the number of vehicles close to RSU. When vehicle B receives the MS-Request, it does not send the bundle messages to other vehicles, but keeps them in the storage. Thus, the volume of bundle traffic can be decreased.
We evaluated by simulation the network performance of a Non-Line of Sight (NLoS) scenario by sending the bundle messages for three DTN protocols. The NLoS communication environment is established by placing RSUs across building obstructions. There have been a total of forty iterations for each simulation.
Figure 4 shows the simulation results of PDR for different DTN protocols and RSUs. When the number of RSUs is zero (see the red line in Fig. 4), it indicates that RSUs are not constructed in grid road environments. This is the case for Conventional Epidemic, which does not use the CT-based MS method.
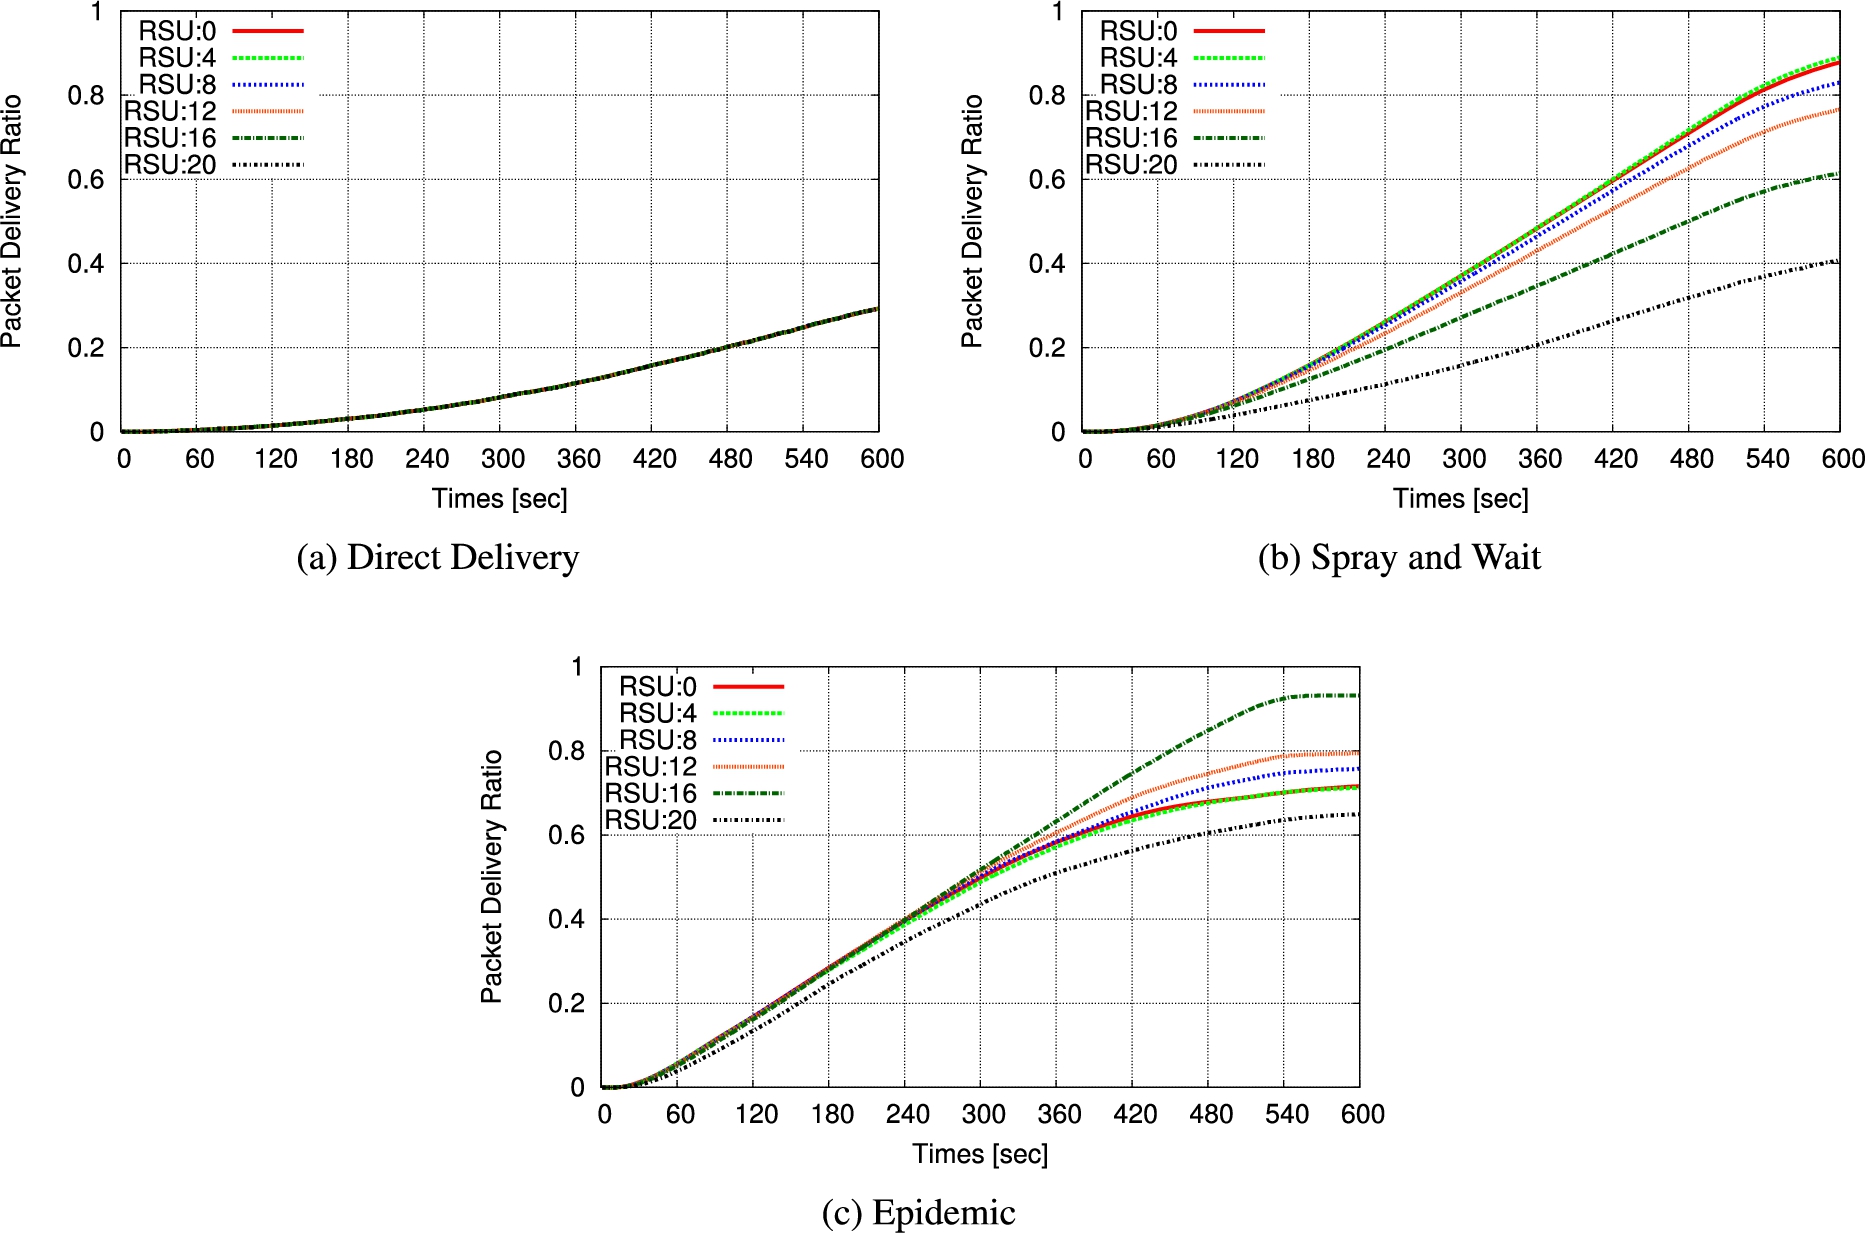
Results of PDR for different protocols.
For Direct Delivery (see Fig. 4(a)), we can see that results of PDR for this scenario are the same for different number of RSUs, because the start-point sends the bundle message to end-points directly. For Spray and Wait (see Fig. 4(b)), the results of PDR decreases with increasing the number of RSUs in the grid road environment. For Epidemic (see Fig. 4(c)), when the number of RSUs are more than 8, the PDR is higher than other DTN protocols, because RSU sends frequently MS-Request to vehicles. The difference of PDR is smaller than SpW with the increase of number of RSUs. In addition, when the number of RSUs is 16, the results of PDR is the best compared with other cases.
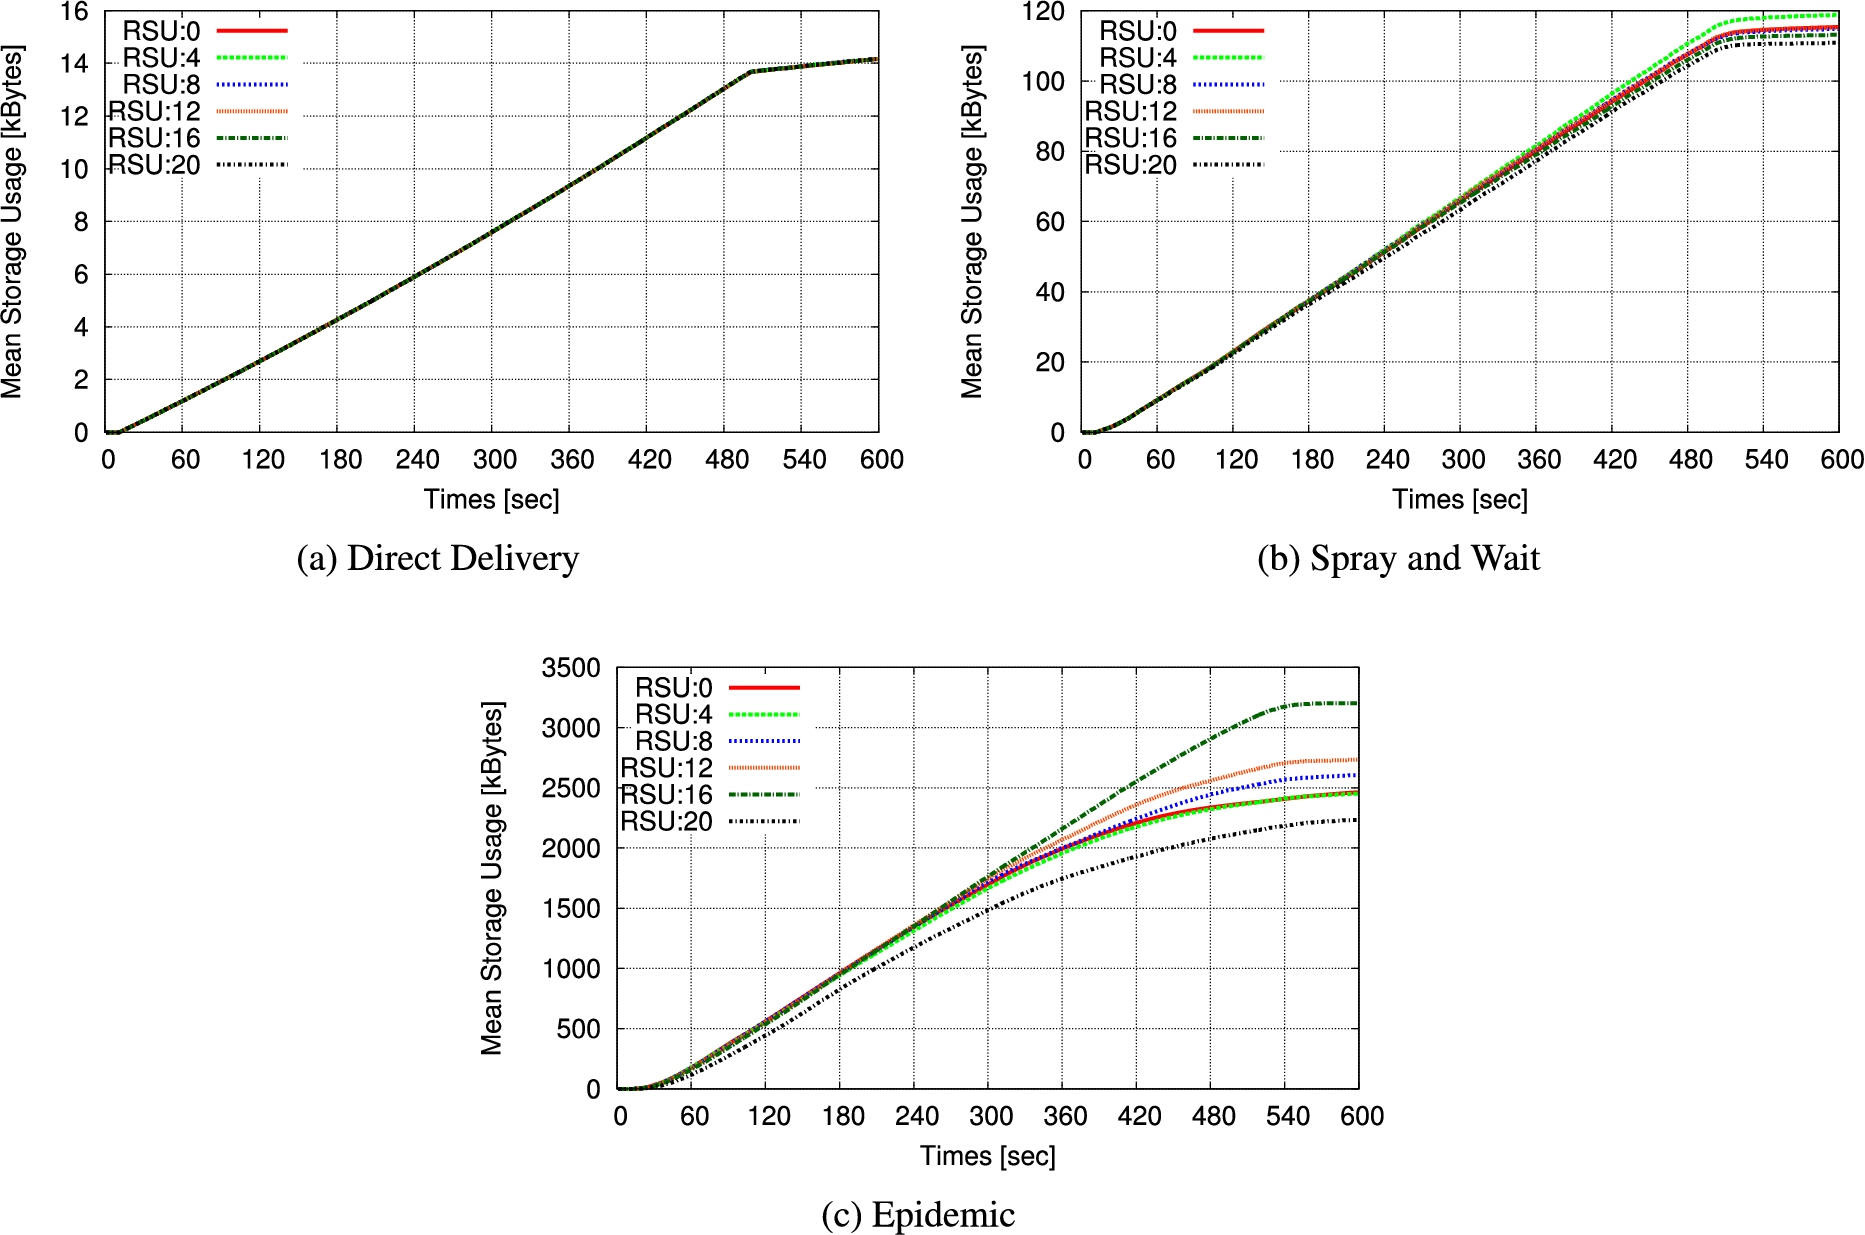
Results of storage usage for different protocols.
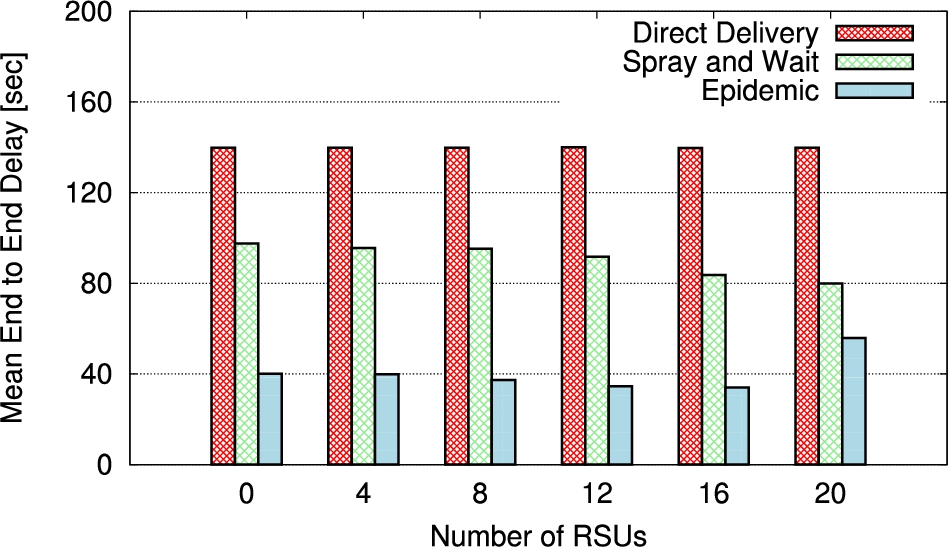
Results of mean E2E delay for different protocols.
Figure 5 shows the simulation results of the storage usage for different DTN protocols and RSUs. The bundle protocol starts to send bundle messages after 10 seconds. In Fig. 5(a), during the first transmission phase the mean storage usage increases proportionally because the number of stored bundle messages increases. After this phase, the storage usage increases slowly. In addition, the difference of the performance between different number of RSUs is very small. In Fig. 5(b), we found that mean storage usage is higher than the results of conventional Epidemic (RSU = 0). But, the storage usage is decreased when the number of RSUs reached twenty.
Figure 6 shows the simulation results of mean End-to-End (E2E) delay. It should be noted that only the data that successively reaches the endpoints are measured for the delay. The conventional method has a longer mean E2E delay than our proposed MS method, unless the number of RSUs is twenty. This is due to the proximity between the starting point and the RSUs. When many vehicles switch to MS, they do not transmit the bundle message to other vehicles.
Overview of AT-based methods
Considering the evaluation results of CT-based MS method, we found that a good performance is achieved by combining CT-based method and Epidemic. Therefore, for two proposed AT-based MS methods we consider only the combination with Epidemic. These methods do not require the use of RSUs and instead implement suppression control based on the information obtained from neighboring nodes. This helps to decrease the overhead while support the mobility. We present the characteristics of the proposed AT-based MS methods in Table 4.
Comparison of MS methods
Comparison of MS methods
The MSC runs message suppression procedures without V2I communication. It works together with SpW, MaxProp and Epidemic protocols. Each vehicle has a MSC, which is embedded in on-board unit of the vehicle. The MSC has active or inactive states. We present the flowchart of MSC algorithms for two states of vehicles in Fig. 7. About 10% of MSCs in the network are activated and send MS messages (such as MS-HELLO, MS-ACK and MS-REQUEST) to adjacent vehicles. These vehicles are called MSCVs. When MSCV receives HELLO message from other vehicles, the MSCV stores the bundle ID and source node ID in the memory (see Fig. 7(a)). In addition, MSCV detects the number of neighboring vehicles N to calculate the duration of message suppression.
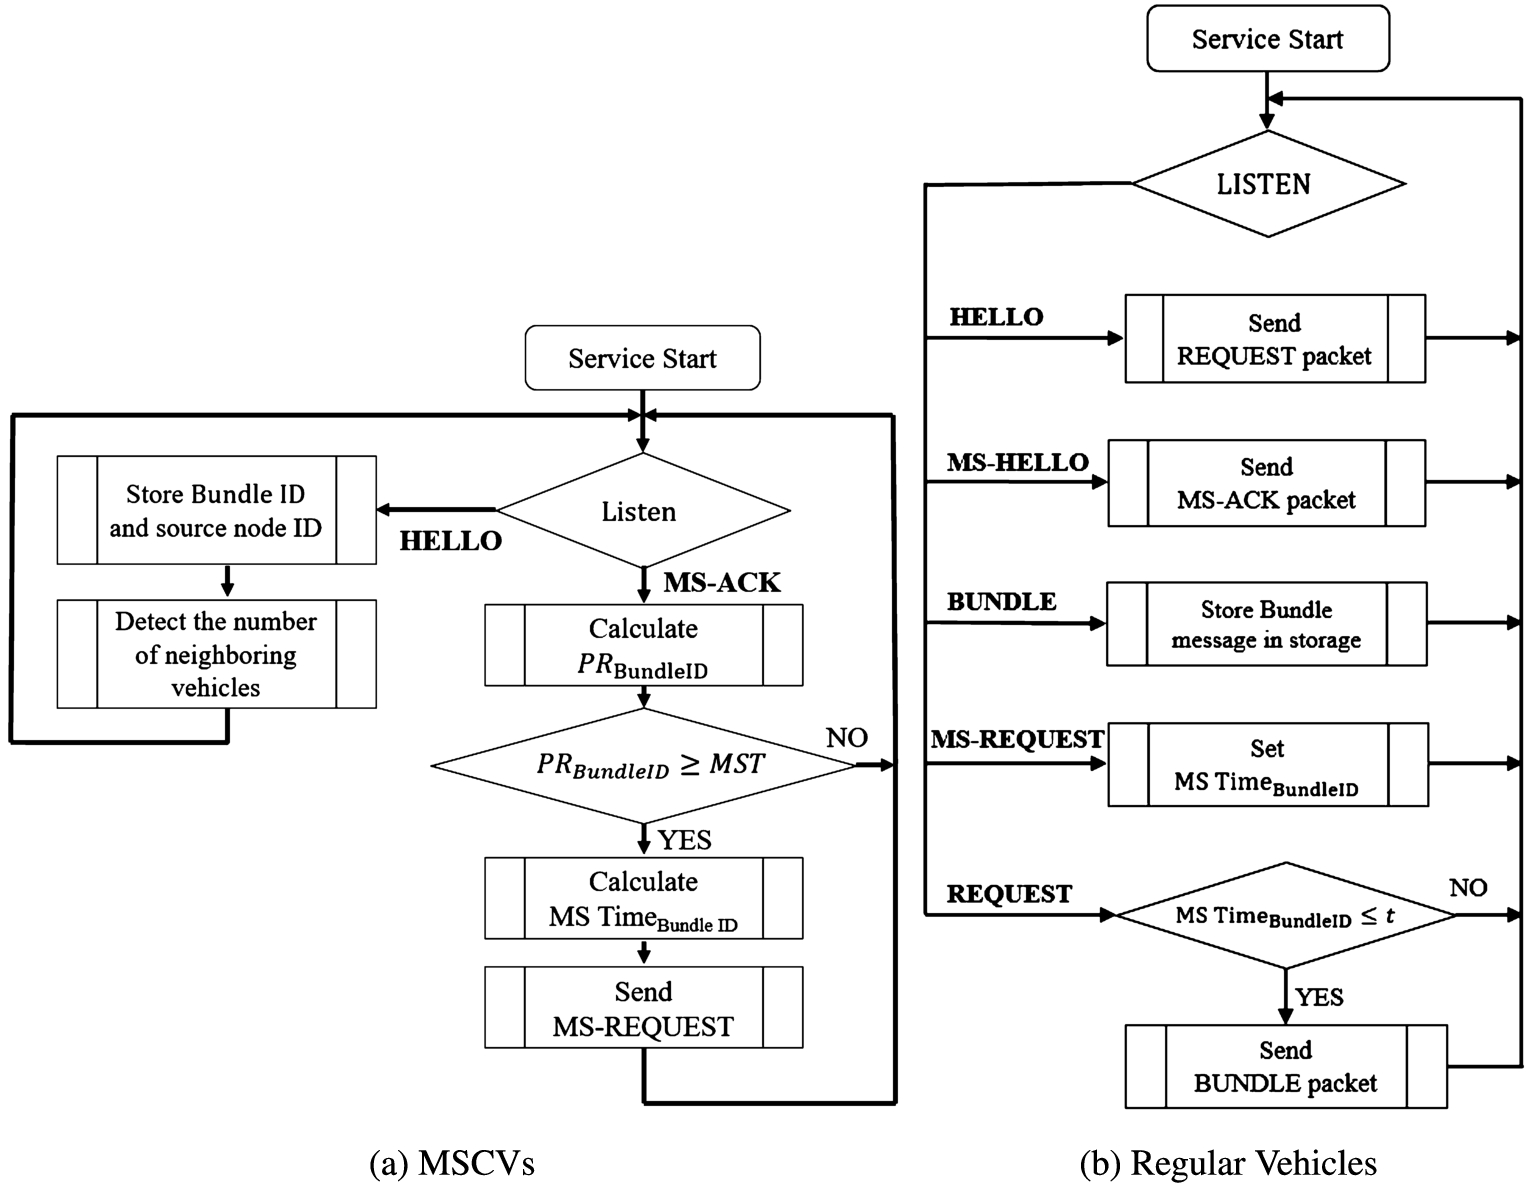
Flowchart of MSC for MSCV and regular vehicles.
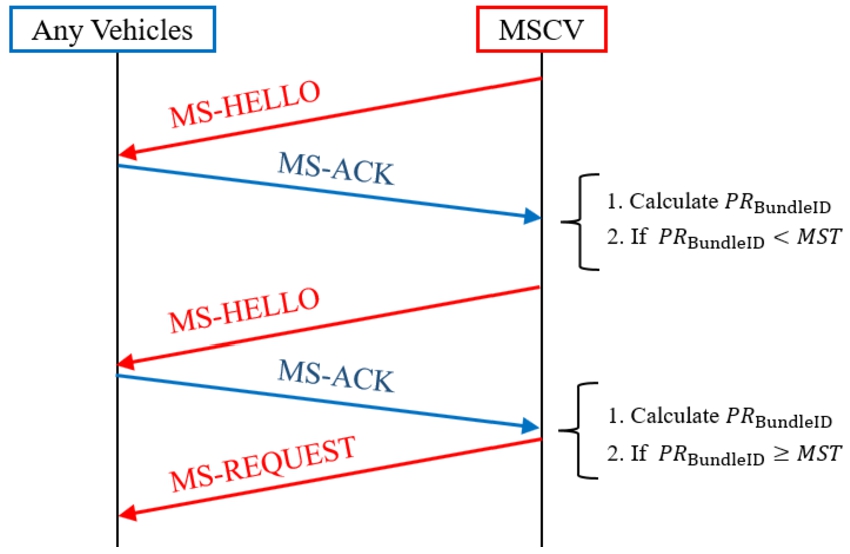
Sequence chart of MSC.
As shown in Fig. 8, the MSCV sends MS-HELLO packet to vehicles in intervals of 1 second. For example, when vehicle receives the MS-HELLO from MSCV, it sends a MS-ACK to the MSCV. When the MSCV receives the MS-ACK from a vehicle, the MSCV calculates Possession Rate of the Bundle ID (
The stored N will be reset every 2 seconds. In order to reduce the storage usage in the network, we use three addition packets as shown in Table 5. When a vehicle receives HELLO packet from other vehicles, the other vehicles send REQUEST packet to the vehicle. Then, if
Control packets information for MSC and MSC-ATh
In the conventional MSC, we considered a fixed threshold value of MST. For instance, when
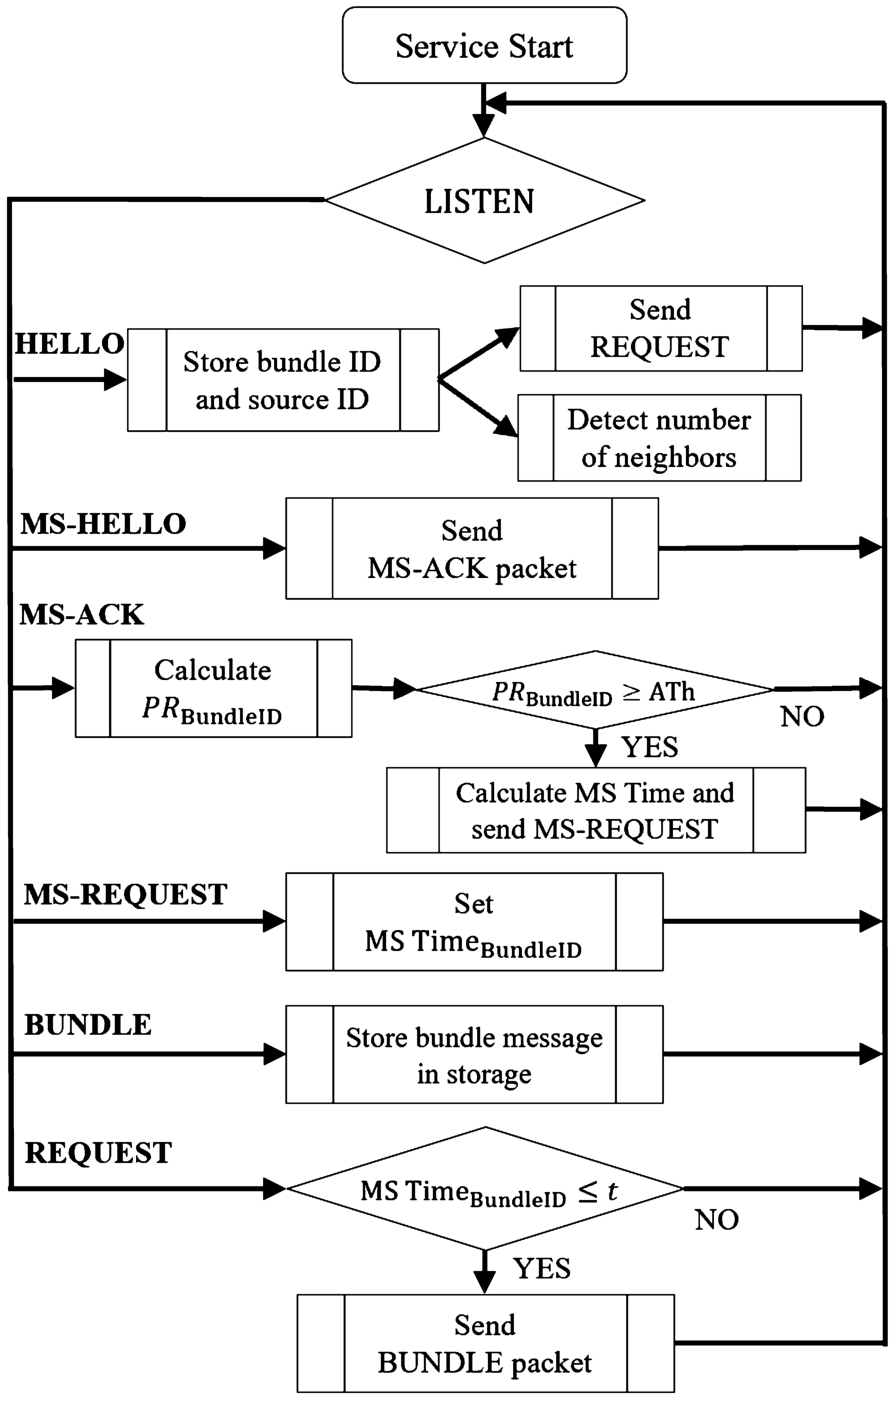
Flowchart of MSC-ATh.
When vehicle receives MS-HELLO from MSCV, it sends a MS-ACK to the MSCV. In this case, vehicle receives many MS-HELLOs in a short time, thus increasing processing overhead. For this reason, we proposed an Adaptive Threshold (ATh) for MSC to solve the problem. The method increases efficiency by sending fewer reply packets than the conventional MSC. The ATh has a timer as shown is Fig. 9.
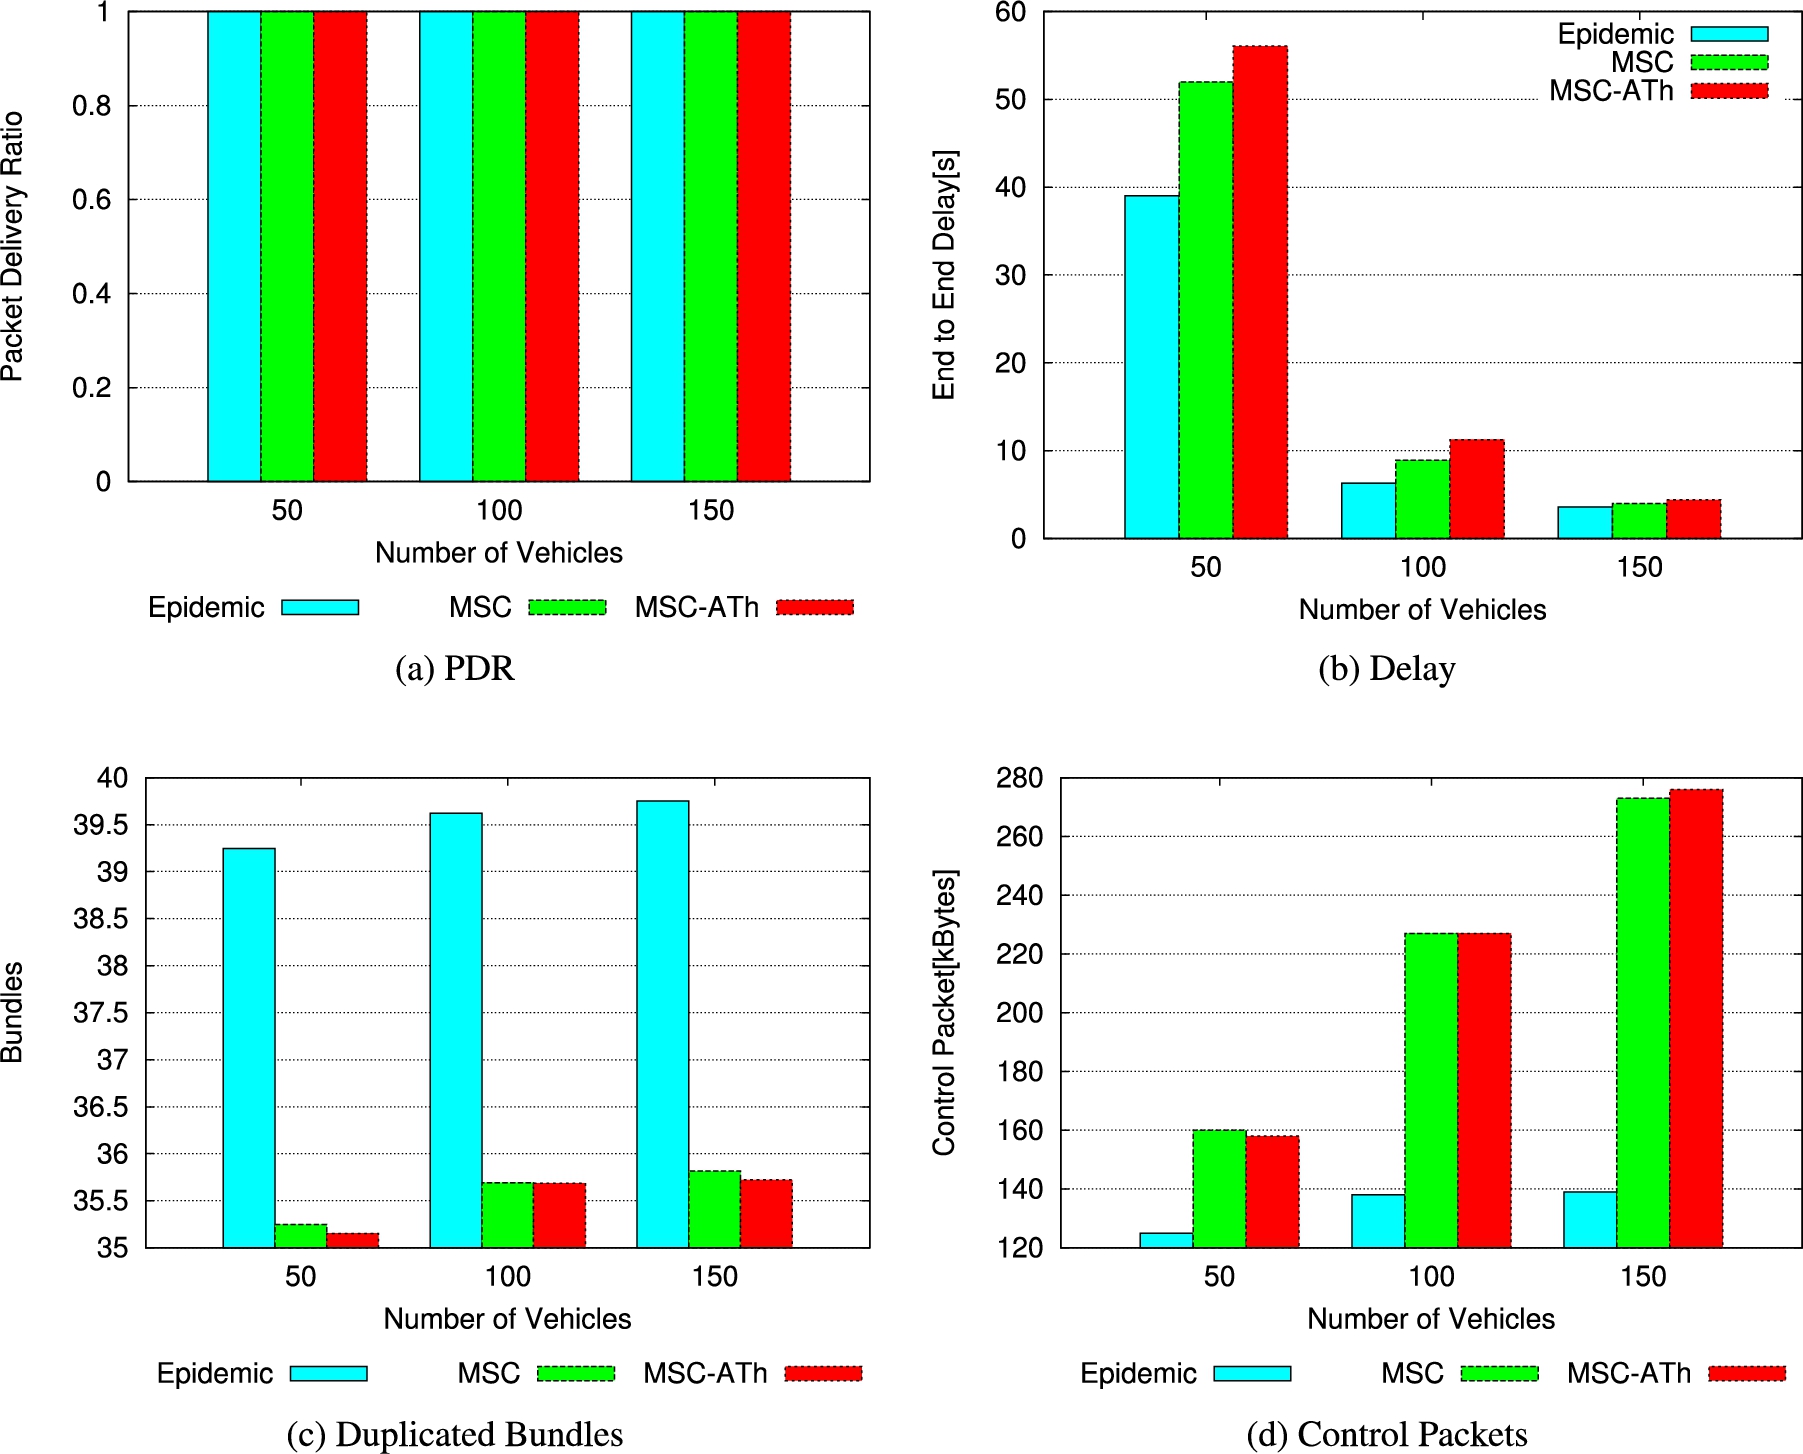
We evaluate the proposed MSC and MSC-ATh and compare with conventional Epidemic. For evaluation, we did not consider ant-packet recovery scheme. For evaluation, we consider three different SCs and following parameters: PDR, delay, duplicated bundles, control packets and storage usage for different number of vehicles.
Performance comparison by protocol for each evaluation metric.
We evaluate the network performance for different protocols as shown in Fig. 10 and Fig. 11. The value of SC is set to 2.
In Fig. 10(a), we present the simulation results of PDR for different protocols. For different vehicles, we observe that all bundle messages reach the end-point by the end of the simulation time. In Fig. 10(b), in case of the sparse network, there is a large difference in delay time due to message suppression. We found that Epidemic, which does not process suppression requests and recovery, sends messages to their target in a timely manner. The difference in the delay performance is decreased after hundred vehicles in this scenario. Delay increases with increasing of number of vehicles. In Fig. 10(c), we show the simulation results of duplicated bundles for different protocols. We observe that both MSC and MSC-ATh perform well and they have better performance than Epidemic. In Fig. 10(d), we show the simulation results of generated control packets in the network for different protocols. With the new MS-HELLO, MS-ACK, and MS-REQUEST messages added to the proposed MSC and MSC-ATh methods, the number of control packets in the network is increased. However, the size of each control packet is small and had no effect on PDR performance.
In Fig. 11, we show the simulation results of storage usage for different protocols. The variability of storage usage improves with the increasing number of vehicles. The MSC-ATh has better performance compared with other protocols.

Storage usage for different protocols.
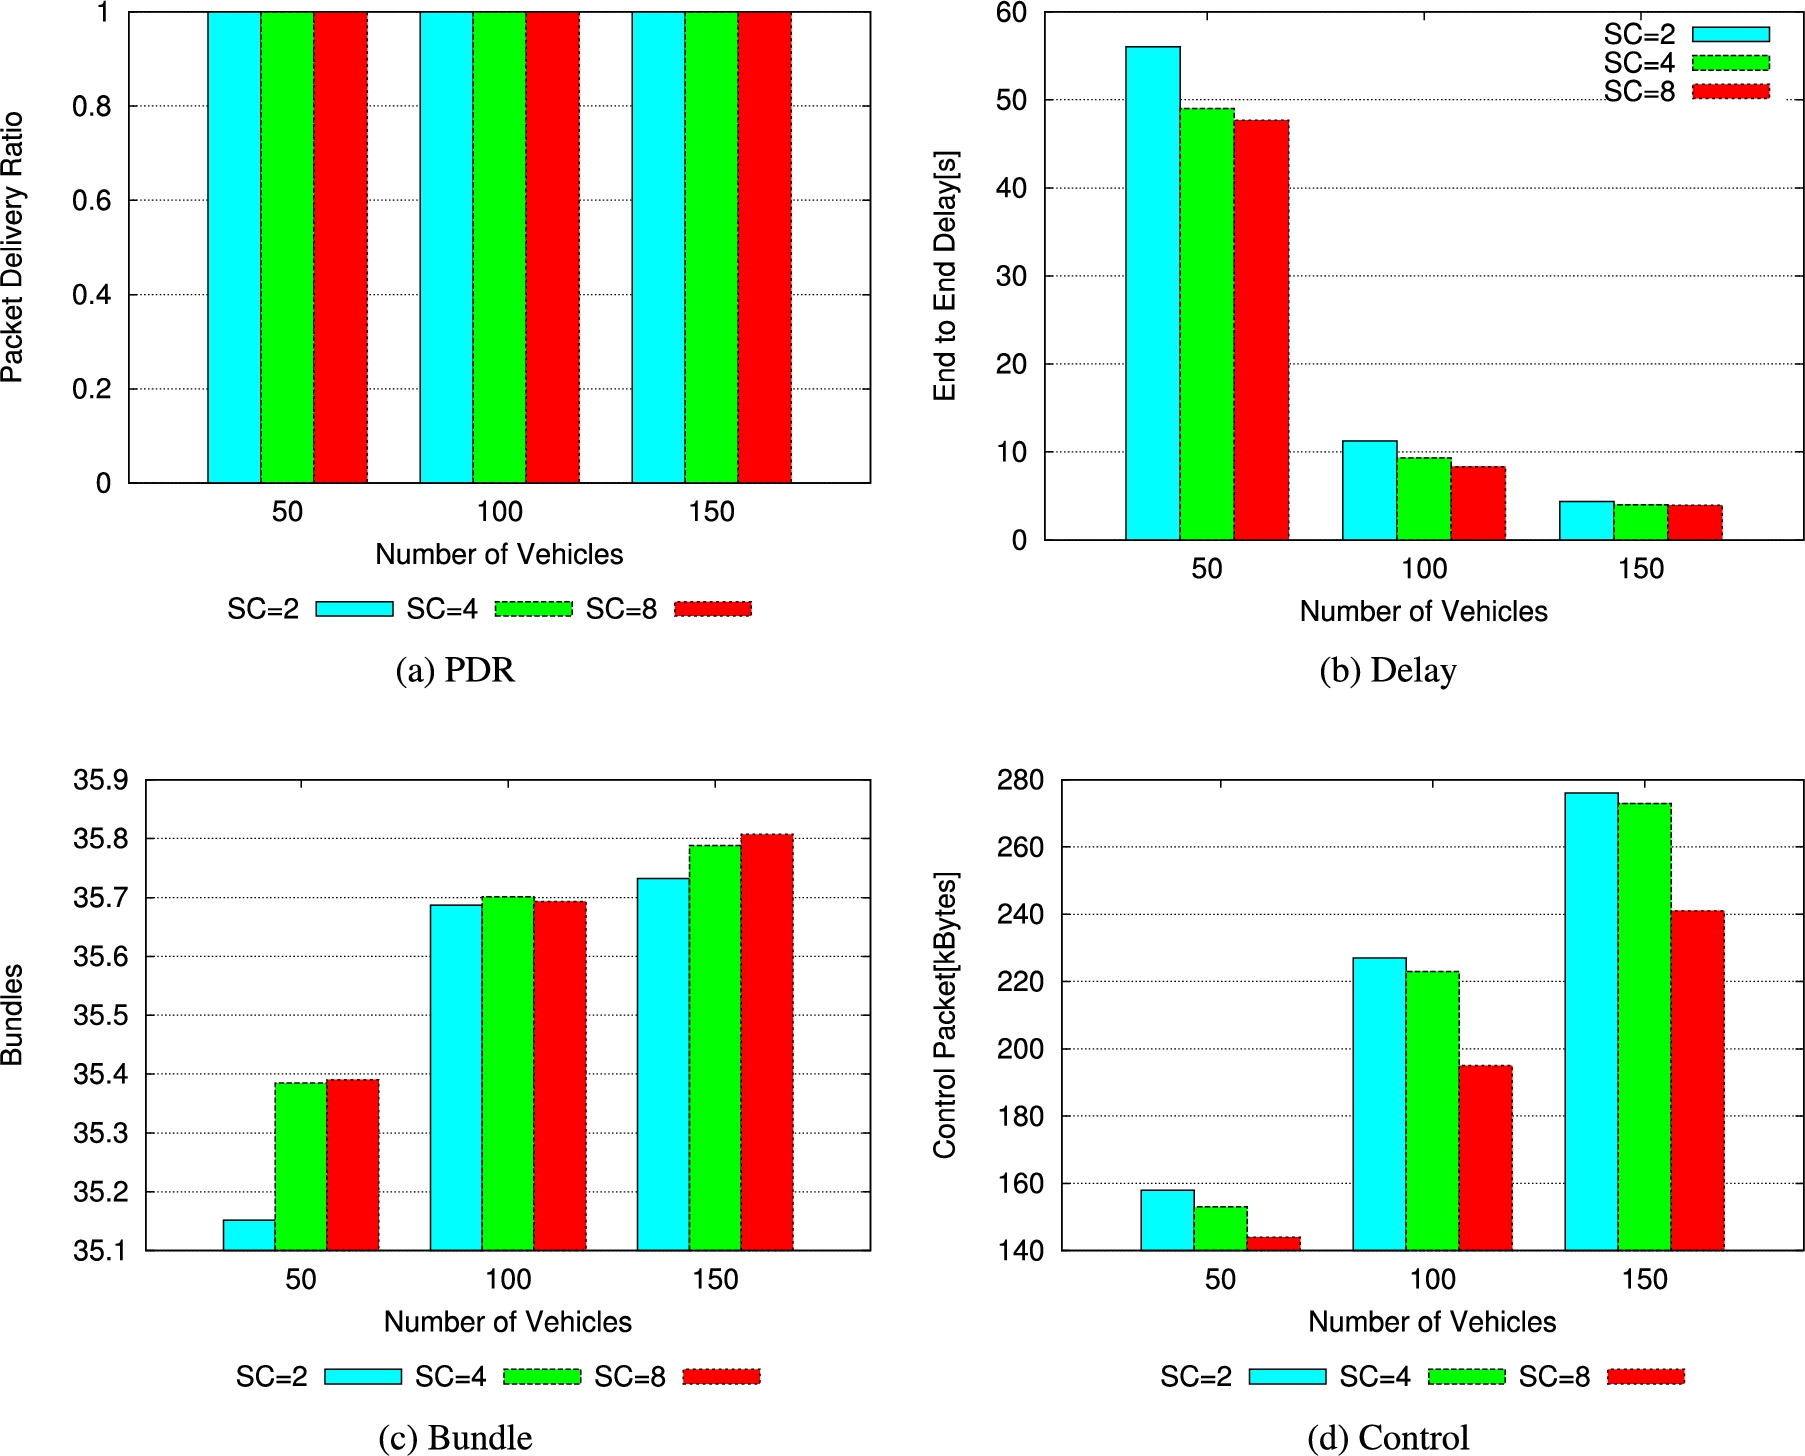
We evaluate the network performance of MSC-ATh for different SCs (2, 4 and 8) as shown in Fig. 12 and Fig. 13. We use SC for the MSC-ATh as shown in Eq. (3).
In Fig. 12(a), we present the simulation results of PDR for different SCs. The PDR reaches hundred percent by the end of the simulation. In Fig. 12(b), we show the simulation results of delay for different SCs. The delay performance improves with increasing the SCs and number of vehicles. When SC increases above 4, we can see an improvement in delay performance compared to MSC (see Fig. 10(b) and Fig. 12(b)). In Fig. 12(c), we show the simulation results of duplicated bundles for different SCs. The duplicated bundles increase with the increasing the number of vehicles. Also, for 50 and 150 vehicles, the duplicated bundles increase with increasing the SCs. In Fig. 12(d), we show the simulation results of generated control packets in the network for different SCs. The control packets decreases with increasing SCs. The results show that by increasing SC the number of control packets and delay can be decreased, but the number of duplicated messages is increased, even in the case of sparse network.
In Fig. 13, we show the simulation results of storage usage for different SCs. When SC is increased, there is a slight increase in storage utilization. However, this increase is small compared with other protocols, which can contribute to storage reduction.
Comparison of the MSC-ATh performance for each metric based on the different SCs.

Storage usage of MSC-ATh performance for different SCs.
In this paper, we presented CT-based and AT-based MS methods for Vehicular DTN. For CT-based MS method, we used Direct Delivery, SpW and Epidemic protocols and different vehicles and RSUs. For AT-based MSC and MSC-ATh, we used conventional Epidemic and our Epidemic-based methods for different vehicles without RSUs. Then, we evaluated the MSC-ATh for different SCs. We compared MS method, MSC and MSC-ATh. From the evaluation results, we conclude as follows.
The conventional method has a longer mean E2E delay than our proposed MS method, unless the number of RSUs is twenty. This is due to the proximity between the starting point and the RSUs. When many vehicles switch to MS, they do not transmit the bundle messages to other vehicles. For Epidemic, when the number of RSUs is more than 8, the PDR is higher than Direct Delivery and SpW protocols, because RSUs send frequently MS-Request to vehicles. The difference of PDR is smaller than SpW when the number of RSUs increases. In addition, when the number of RSUs is 16, the results of PDR is the best compared with other cases. The variability of storage usage improves with the increasing number of vehicles. The MSC-ATh has better performance compared with other protocols. The delay performance of MSC-ATh improves with increasing the SCs and number of vehicles. By increasing SC, the number of control packets and delay can be decreased, but the number of duplicated messages is increased, even in the case of sparse network.
In future work, we would like to evaluate other MS methods and consider other parameters. We also would like to consider the anti-packet recovery method to manage the bundle messages in VANETs.
Conflict of interest
The authors have no conflict of interest to report.