
Abstract
Image recognition is a hot topic in the field of computer vision and pattern recognition, it is widely used in identification, automatic control, human-computer interaction systems. With the development of civil aviation, image recognition has become an important tool to ensure civil aviation security. In this article, firstly, tensor is used to represent the image, which can preserve more structure information of image than traditional vector representation. Then, combining a new tensor distance (NTD) and multilinear discriminant subspace analysis (MLDSA), a novel dimensionality reduction approach named NTD-MLDSA is proposed, and the transformation matrices can be obtained by employing an iterative strategy. Different from the Euclidean distance (ED), which bases on orthogonal assumption, NTD takes into account the spatial relationships of elements and can reflect the real distance between tensors. Experimental results show that the propose approach is more appropriate for dimensionality reduction of image objects than other classical dimension reduction methods, based on benchmark recognition databases Yale, ORL and USPS, the low dimensional data obtained by NTD-MLDSA improves the classification accuracy.
Keywords
Introduction
With the rapid development of civil aviation, civil aviation security also is facing many challenges, such as the increased passenger traffic, the huge airport security workload and the sharp increase in the number of flights. Owing to the traditional manual identification already unable to meet the current needs, how to recognize automatically has become the main issue for many researchers [27], and image recognition is an important part of it. The development of civil aviation is closely related to the progress of image recognition technology.
Image recognition is essentially a classification problem [19]. To improve the recognition accuracy of the image, it needs to solve the following two problems: Which data form can be used to represent the image reasonably [8, 11]. Image exists in a high-dimensional space. Classification methods operating directly on this space suffer from the so-called curse of dimensionality [6]. Handling high dimensional samples is computationally expensive and need large storage requirement, it easily leads to high dimensionality small-sample-size (S3) problems, and many classifiers have poor performance in high dimensionality S3 problems.
In computer vision research, the natural representation of image is tensor, for example, as shown in Fig. 1: a gray image can be represented by a second order tensor (matrix).
However, the traditional image recognition methods always represented image by vector form, or scanned tensor into vector [5, 22], they will increase the computational costs enormously and seriously destroy the structure information of the tensor data [7, 17], as shown in Fig. 2, (a) is the row-based vectorization result, and obviously, the spatial relationship between pixels x(2) and x(3) is not well preserved. The similar result of x(1) and x(2) also appears in (b), which is after column-based vectorization.

A gray image can be represented by a second order tensor (matrix).
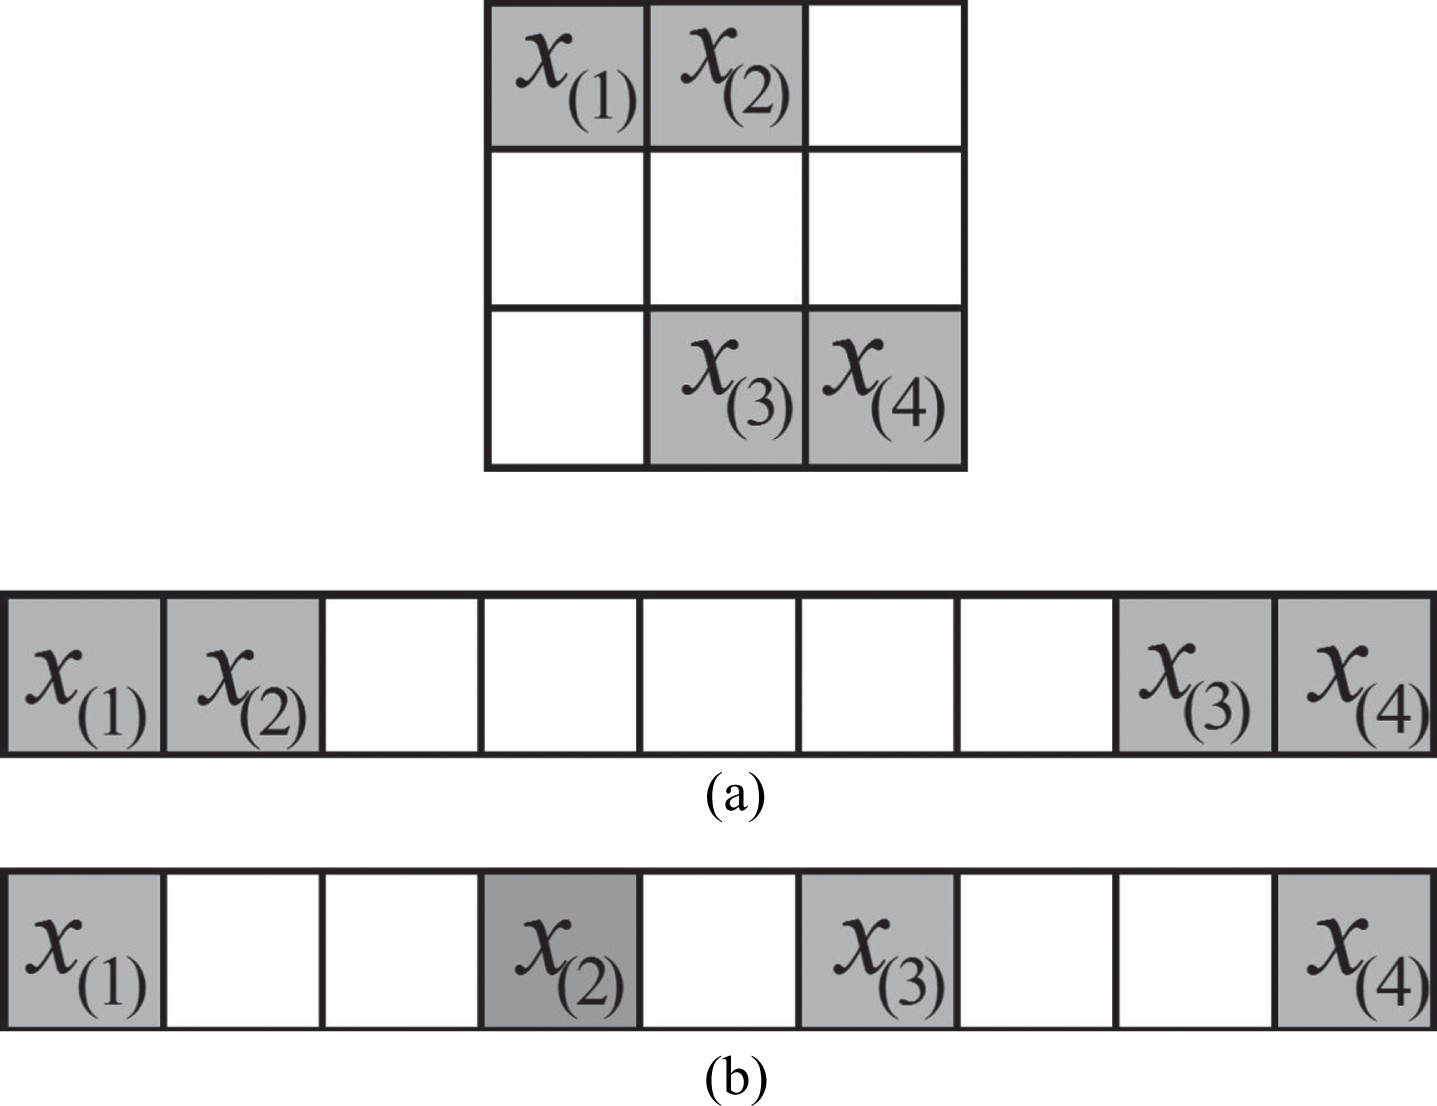
Vectorization of a matrix: (a) Row-based vectorization of an image; (b) Column-based vectorization of an image.
In order to avoiding the curse of high dimensionality, before image recognition, it needs to reduce the dimensionality of image adequately [1].
With the development of tensor theory and machine learning, making multilinear algebra theory into dimensionality reduction for tensor has been introduced [13]. Since then, many methods to reduce the dimensionality of tensor have been proposed. Several classical approaches are as follows: tensor principal component analysis (Tensor PCA) and tensor linear discriminant analysis (Tensor LDA) [2], both of them reduce the high-dimensional matrix to a low-dimensional matrix. As the extension from the second order to high order, Lu and Yan proposed multilinear principal component analysis (MPCA) [7] and multilinear discriminant analysis (MLDA) [17], respectively. Using different preserving embedding strategy, different methods are presented, such as, tensor-based locality preserving projections (TLPP) [4], tensor based neighborhood preserving embedding (TNPE) [2], tensor based graph embedding framework [26] and so on [15, 25].
Otherwise, the performance of dimensionality reduction for tensor data does not only depend on the strategies but also closely relate to the distance metric [24]. Currently, there are many methods to define the distance between tensors, such as tangent distance [14] and the generalized Hausdorff distance [3]. Up to now among different tensor distance metrics, due to the simplicity of Euclidean distance (ED), all the dimensionality reduction methods mentioned above are based on ED which is constrained by the orthogonality assumption. Unfortunately, this orthogonality assumption ignores the correlations among the elements in the tensor data, such as the spatial relationships of pixels in images, thus affects the performance of the dimensionality reduction algorithm for tensor. In order to modify the deficiency of tensor distance (TD) for measuring the distance between tensors, in this paper, a new tensor distance (NTD) is proposed which can be regarded as a generalization of ED. Different from ED, NTD considers the relationships among different coordinates of the tensor. Based on NTD, it further presents a novel dimensionality reduction method for tensor called NTD based Multilinear Discriminant Subspace Analysis (NTD-MLDSA). NTD-MLDSA tries to find the most discriminative tensor subspace. By projecting the data points into the tensor subspace, the data points of different classes are farther from each other while data points of the same class are closer to each other. The proposed framework is shown in Fig. 3.
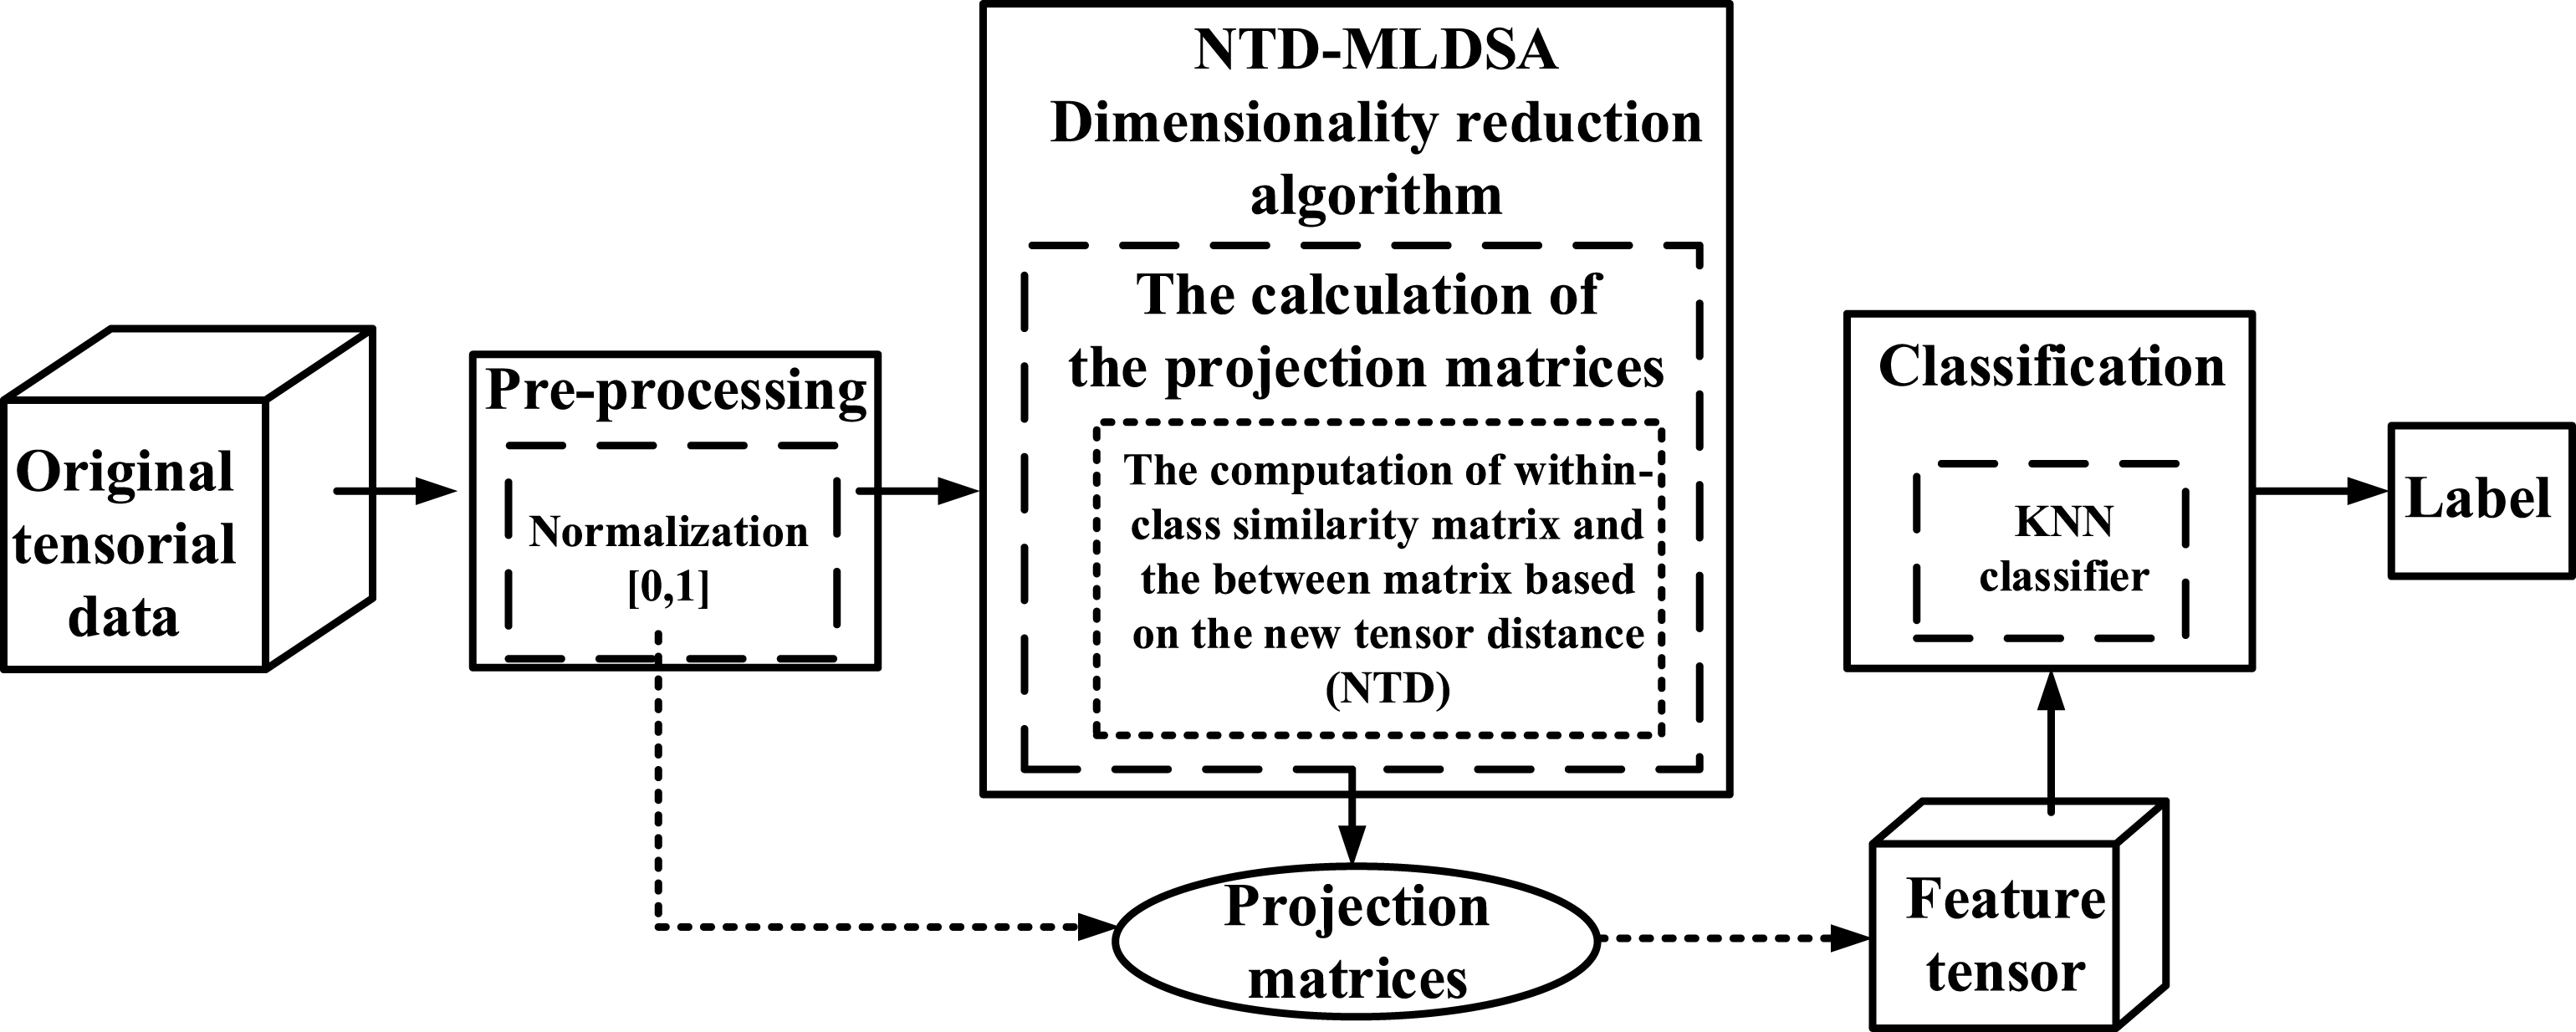
Block diagram of NTD-MLDSA system for image recognition.
The rest of this paper is organized as follows. Section 2 proposes the NTD metric and compares it with ED. The model and algorithm of NTD-MLDSA are presented in Section 3. The results of experiments are reported in Section 4. Finally, Section 5 gives conclusions and feature work.
In this section, it begins with a brief review of the Euclidean Dstance (ED) and analyzes its defect for defining the distance for gray images. Then, a new tensor distance (NTD) metric is introduced and an analysis of it is given.
Euclidean distance
The matrices X and Y represent two I1 by I2 gray images, respectively, x(kl) and y(kl) are the gray levels at location (k, l). Then ED between X and Y is as follows which is the same as the vectors x and y.
From the Definition of (1), it is obviously that the weight of (x(kl) - y(k′l′)) 2 is one if the location (k, l) is the same as (k′, l′), otherwise, the weight is zero. From another point of view of (1), the vector x is represented by the elements x(1), ⋯ , x(I1×I2) under the corresponding bases e1, ⋯ , eI1×I2, where
In the Euclidean space, (2) indicates that any two different bases e k and e l are assumed to be mutually perpendicular, so that the elements x(k) and x(l) are independent of each other. Unfortunately, this orthogonality assumption ignores the correlation among different coordinates for data point, such as the spatial relationships of pixels in gray images. According to the follows example, it indicates that ED cannot reflect the real distance between tensor data.
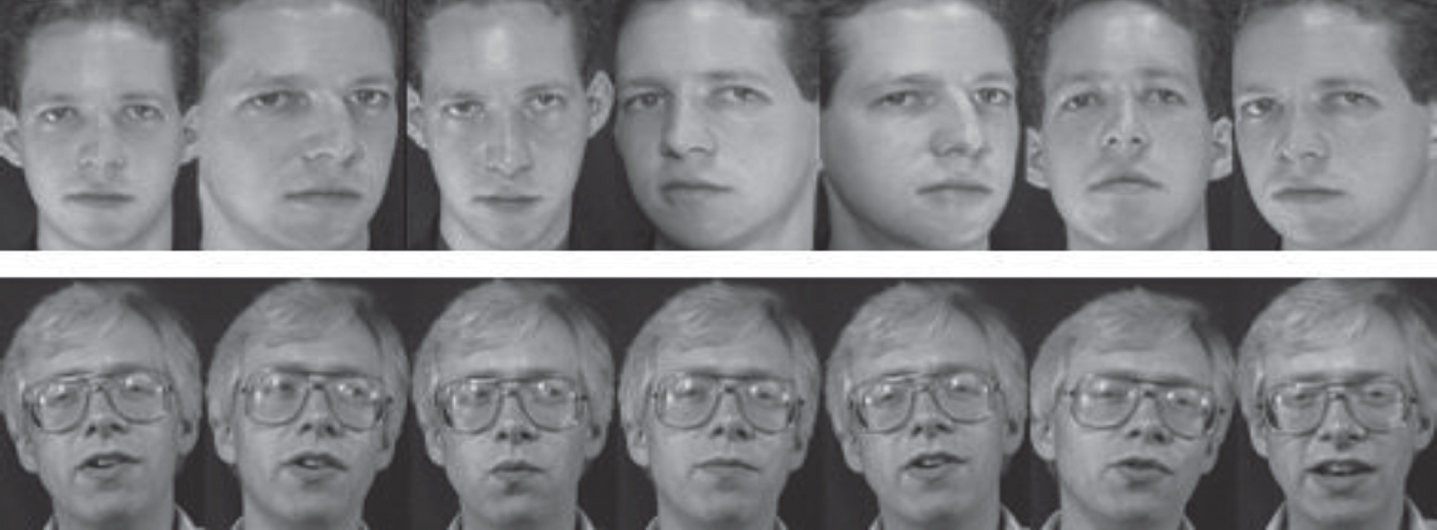
Figure 4 shows three gray images which are normalized to a resolution of 32 × 32 pixels, and uses matrices A, B and C to represent them, where A and B are in the same class and C is in the other class. Based on the idea that the data points of the same class should be close to each other while the data points of different classes should be far from each other, a reasonable tensor distance should present smaller distance between A and B than that of A and C, but ED gives a counter result. Through the formula (1), it yields that dE (A, B) =7.9804 and dE (A, C) =7.6414. This phenomenon indicates that A and B in the same class have a larger distance. This result is unreasonable and caused by the orthogonal assumption of ED. In other words, for images, ED only considers the value of the pixels but not the spatial relationships between pixels.
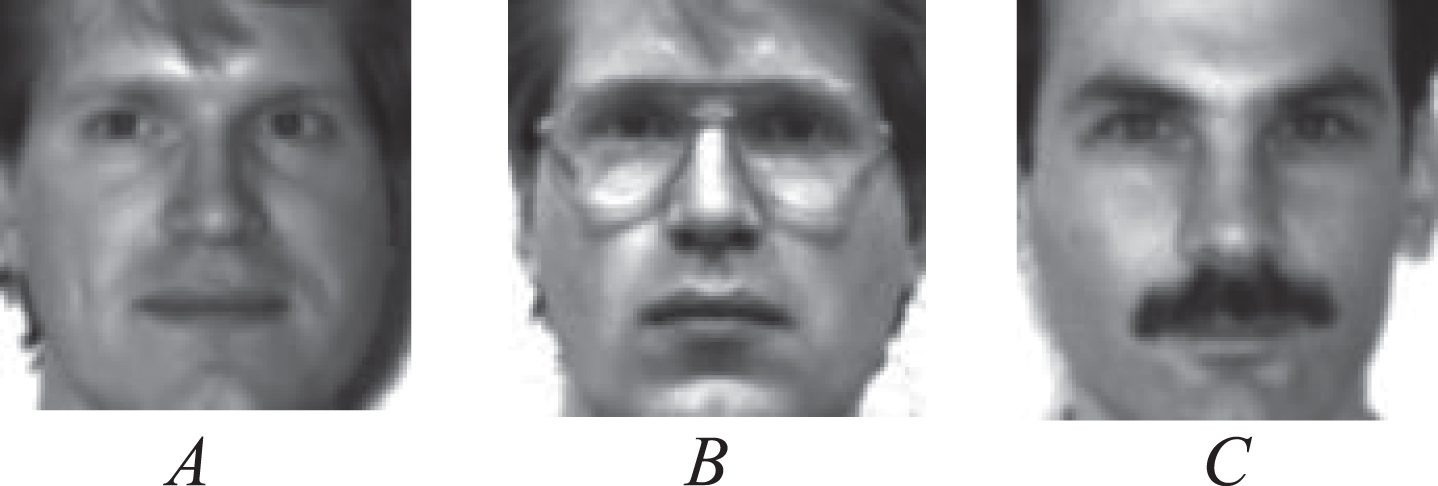
Three grays images of two individuals in the Yale face dataset.
In [12], Wang proposed a new Euclidean distance for images—IMED, which uses the vector to represent the image and considers the spatial relationships of pixels. Inspired by this work, a distance metric called New Tensor Distance (NTD) is proposed, which not only considers the value of the pixels but the spatial relationships between them.
Let p
i
(i = 1, ⋯ , I1 × I2) represent the pixels of the image, if p
i
is at location (k, l) (corresponding to the element x(kl) of the matrix) and p
j
is at location (k′, l′) (corresponding to the element x(k′l′) of the matrix), then
In the following, it will introduce the metric coefficients. According to [12], the metric coefficients g(ij) and |p
i
- p
j
| should satisfy the following relationship:
Then the NTD between X and Y is given by
Actually, NTD can be seen as a generalized case of ED which not only contains the value of the elements but the location distance, in other words, when the metric matrix G is an identity matrix, NTD is reduced to ED. In order to save the computational cost for large database, based on the positive definite property of the matrix G, it can be easily decomposed as follows:
Using NTD (7), the new tensor distance in Fig. 4 yield dNTD (A, B) =4.3198 and dNTD (A, C) =6.1824, which indicates that the similar images have the smaller distance, in contrast, the dissimilar images have the larger distance. Therefore, the new metric—NTD provides intuitively reasonable results.
In this section, based on the new tensor distance, it presents a novel supervised dimensionality reduction method NTD-MLDSA. To preserve the structure information of tensor, it works directly on tensor point and iteratively learns the transformation matrices. In order to maintain the manifold structure, NTD-MLDSA considers both the similarity and dissimilarity between the whole data points.
Given a set
Base on the idea that the data points of different classes should be far from each other while data points of the same class should be close to each other. If the two points
where
The optimization problem of NTD-MLDSA can be deduced from the above:
According to
Similarly, using the same technique, the objective function of (13) can be rewritten as
Therefore, the optimization problem (14) can be converted into the following problem
For a given U1, it is easy to see that the optimal U2 can be obtained by the following generalized eigenvalues problem:
In the same way, for a given U2, the optimal U1 can be obtained by
where
From the above analysis, it is easy to see that the optimizations of U1 and U2 depend on each other. Therefore, an alternating iterative algorithm can be utilized to get the optimal U1 and U2. Table 1 describes the procedure of the algorithm for NTD-MLDSA.
The procedure of the alternating iterative algorithm for NTD-MLDSA
In this section, it evaluates NTD-MLDSA using the gray image binary pattern classification tasks on the following three benchmarking databases: Yale face database, Olivetti and Research Laboratory (ORL) face database, and the United State Postal Service (USPS) digit database. In order to verify the effectiveness of our proposed method, in some experiment, it compares the performance with other classic dimensionality reduction methods, such as tensor PCA, tensor LDA, PCA, LDA and so on, the best test accuracy are highlighted in bold type.
The experimental process is composed of two main steps: First, the sample points are embedded into
NT c and NF c represent the number of sample points in the cth class which are correctly and falsely classified, respectively.
All the experiments are carried out on a computer with Inter Core (TM) 2 1.8 GHz processor and 2 GB main memory running Microsoft Windows 7. All the programs are written in MATLAB language and compiled using the MATLAB 2010a.
The Yale gray face database contains 15 different individuals and each individual has 11 images with different illumination conditions, facial expressions and whether wearing glasses. All images are grayscale and normalized to a resolution of 32 × 32 pixels in our experiments. The sample images of two individuals from the database are shown in Fig. 5.
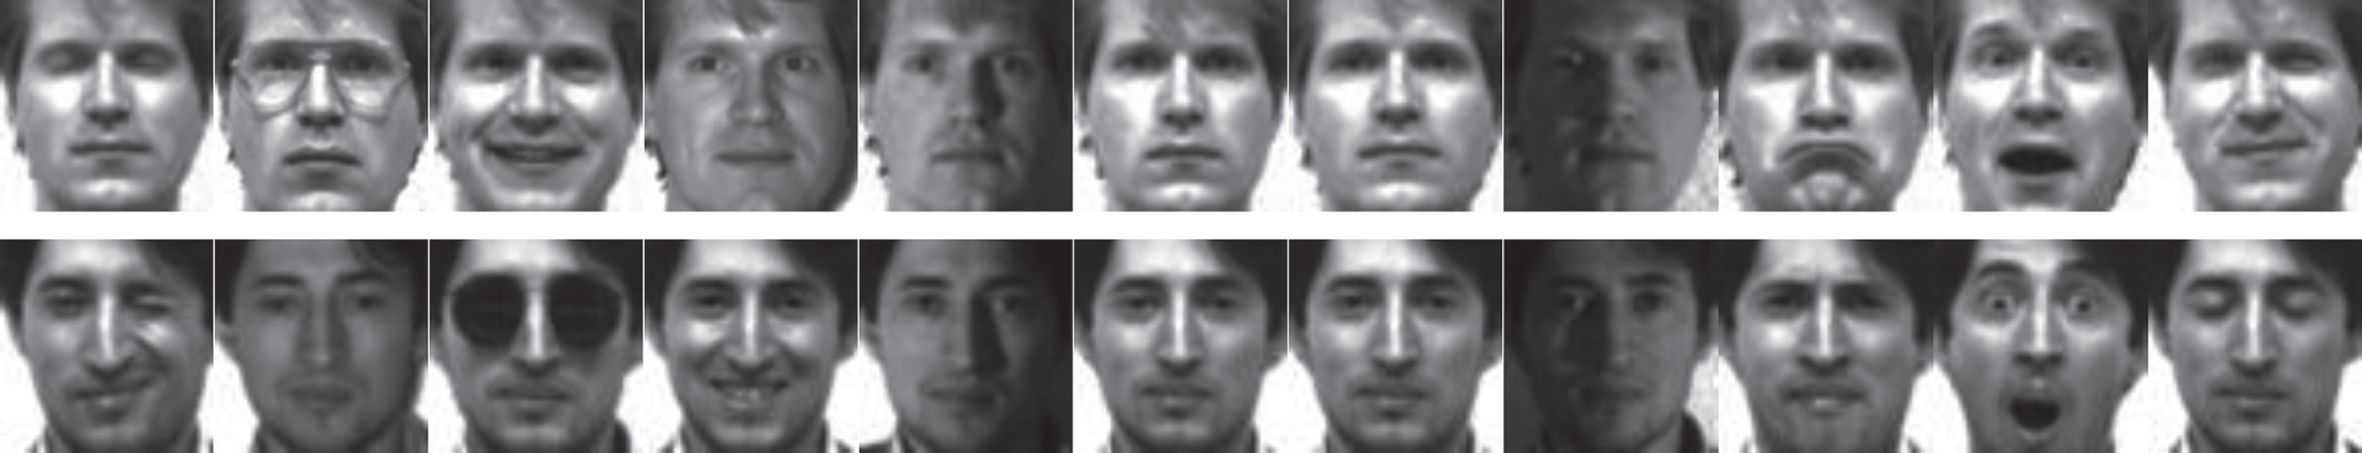
Sample images from the Yale database.
It conducts three experiments in this database. In the first two experiments, for each individual, p = 2 images with labels (hence, 30 images in total) are randomly selected to form the training set, the rest of the data are considered to be the testing set, and the neighborhood size k = 1.
In the first experiment, it compares NTD-MLDSA and MLDSA with other five representative dimensionality reduction algorithms: LDSA, PCA, PCA+LDA, tensor PCA (t-PCA) and tensor LDA (t-LDA). Table 2 lists the best recognition results and the corresponding optimal reduced dimensions of all algorithms.
Comparison recognition accuracy (%) as well as optimal reduced dimensions on Yale database
Obviously, NTD-MLDSA performs better than the other algorithms, and this demonstrates that the improvement in recognition accuracy is indeed due to the combination of the NTD and MLDSA, rather than NTD or MLDSA alone.
In the second experiment, in order to show the effectiveness of both the NTD and the tensor representation, it compares the classification accuracy of NTD-MLDSA, MLDSA, LDSA with different reduced dimensions. Figure 6 shows the comparing results.

Recognition accuracy of NTD-MLDSA, MLDSA, LDSA on the Yale database.
In Fig. 6, the horizontal ordinate represents the value of L, the reduced dimensions of the tenor-based methods NTD-MLDSA and MLDSA are from 1 × 1 to 31 × 31, otherwise, the reduced dimensions of the vector-based method LDSA is from 12 to 312, namely,
By Fig. 6, it can obtain the following conclusions in Fig. 7:
The conclusion of experiments between NTD-MLDSA, MLDSA and LDSA on the Yale database.
The main difference of NTD-MLDSA and MLDSA is the distance measure. To highlight the superiority of the NTD, with the corresponding optimal reduced dimension 4 × 4, the precision comparison between NTD-MLDSA and MLDSA is shown in Fig. 8 with various values of p. It is easy to see that NTD-MLDSA achieves the higher recognition accuracy than that of MLDSA, the maximum increment of the accuracies are 7.33%, and the greatest contribution lies in that NTD is more suitable than ED to measure the distance between the tensor data.

The precision comparison between NTD-MLDSA and MLDSA on the Yale database.
In the third experiment, for each individual, p = 5 images are randomly selected for training (hence, 75 images in total), and the remaining 90 images are used for testing. From Fig. 9, it can see that NTD-MLDSA achieve better results than both MLDSA and LDSA for different reduced dimensionality under various value of k.
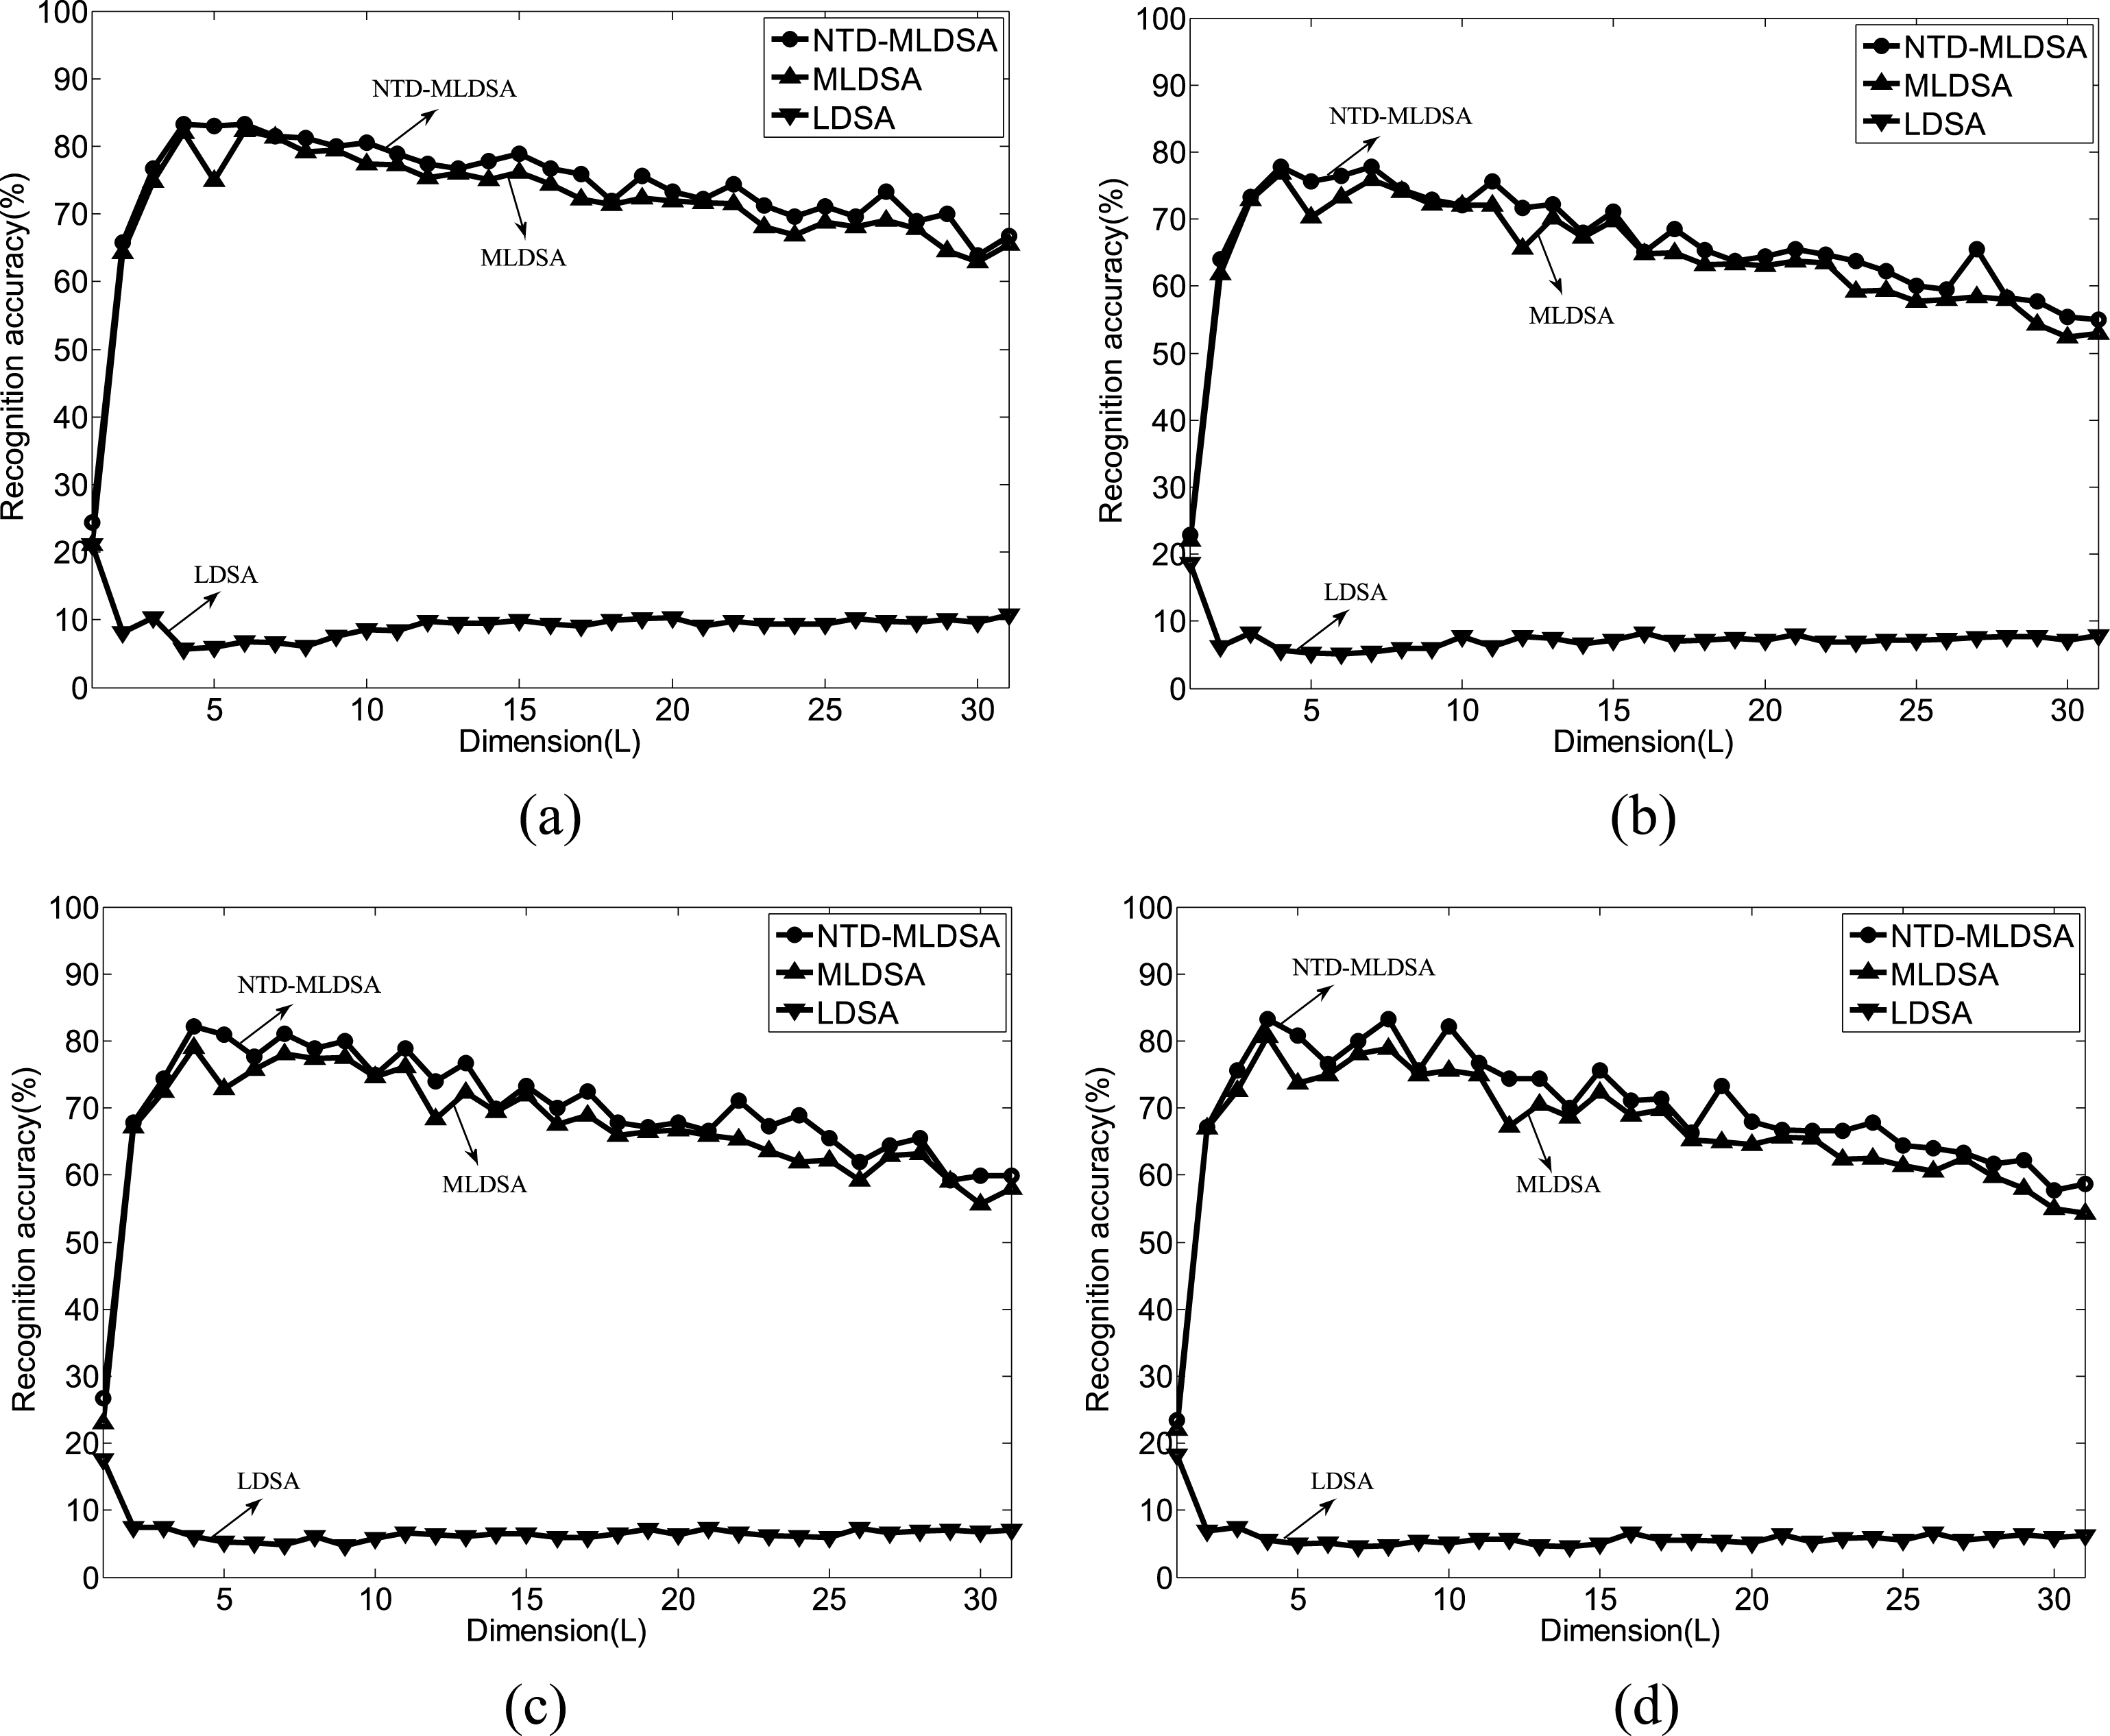
Recognition accuracy of NTD-MLDSA, MLDSA and LDSA on the Yale database with various values of k (a) k = 1. (b) k = 2. (c) k = 3. (d) k = 4.
In Fig. 9, the reduced dimensionality of NTD-MLDSA, MLDSA and LDSA are L × L, L × L and
The results can be shown as follows: The Image recognition accuracy of NTD-MLDSA and MLDSA has significant advantages that LDSA. The main reason for this phenomenon is that vector representation destroys the image structure information. Based on the superior of NTD to measure the distance of tensor, the low dimensional data obtained by NTD-MLDSA can get better classification results that MLDSA. The results 1 and 2 hardly affect by the neighborhood size k.
The ORL database contains 400 images of 40 different individuals (10 images for each). Some images have different variations including expression (open or closed eyes, smiling or non-smiling) and facial details (glasses or no glasses) and were captured at different times. All images are grayscale and normalized to a resolution of 64 × 64 pixels in our experiments. The sample images of two individuals from the database are shown in Fig. 10.
Sample images of two individuals from the ORL database.
There are two experiments in this database, with the neighborhood size k = 1, p = 2 images per individual (hence, 80 images in total) are randomly selected for training and the rest are used for test.
In the first experiment, it compares the recognize accuracy of NTD-MLDSA, MLDSA, LDSA, PCA, PCA+LDA, tensor PCA (t-PCA) and tensor LDA (t-LDA) with the corresponding optimal reduced dimensions. The results are shown in Table 3.
Performance comparisons on the ORL database
It is obvious that NTD-MLDSA significantly outperforms the other six representative methods. For the vector-based methods LDSA, PCA and PCA+LDA, the deviations between them and NTD-MLDSA are 36.43%, 29.13% and 25.47%, respectively. It indicates that the tensor representation of the image is more reasonable than vector. Since NTD is more suitable than ED to measure the distance of the tensor data, the deviations between NTD-MLDSA and other three tensor-based methods MLDSA, t-PCA and t-LDA are 3.13%, 26.41% and 19.04%, respectively.
In the second experiment, it mainly analyzes the recognition accuracy of NTD-MLDSA and MLDSA under different reduced dimensionality L × L. In Fig. 11(a), the performance of NTD-MLDSA and MLDSA is similar with various L, they achieve maximum precision 95.63% and 90.34% in L = 13, respectively. In order to reflect the differences between these two approaches, Fig. 11(b) shows the comparing results with the recognition accuracy above 80%, and it also illustrates that NTD is more superior that ED for tensor data.
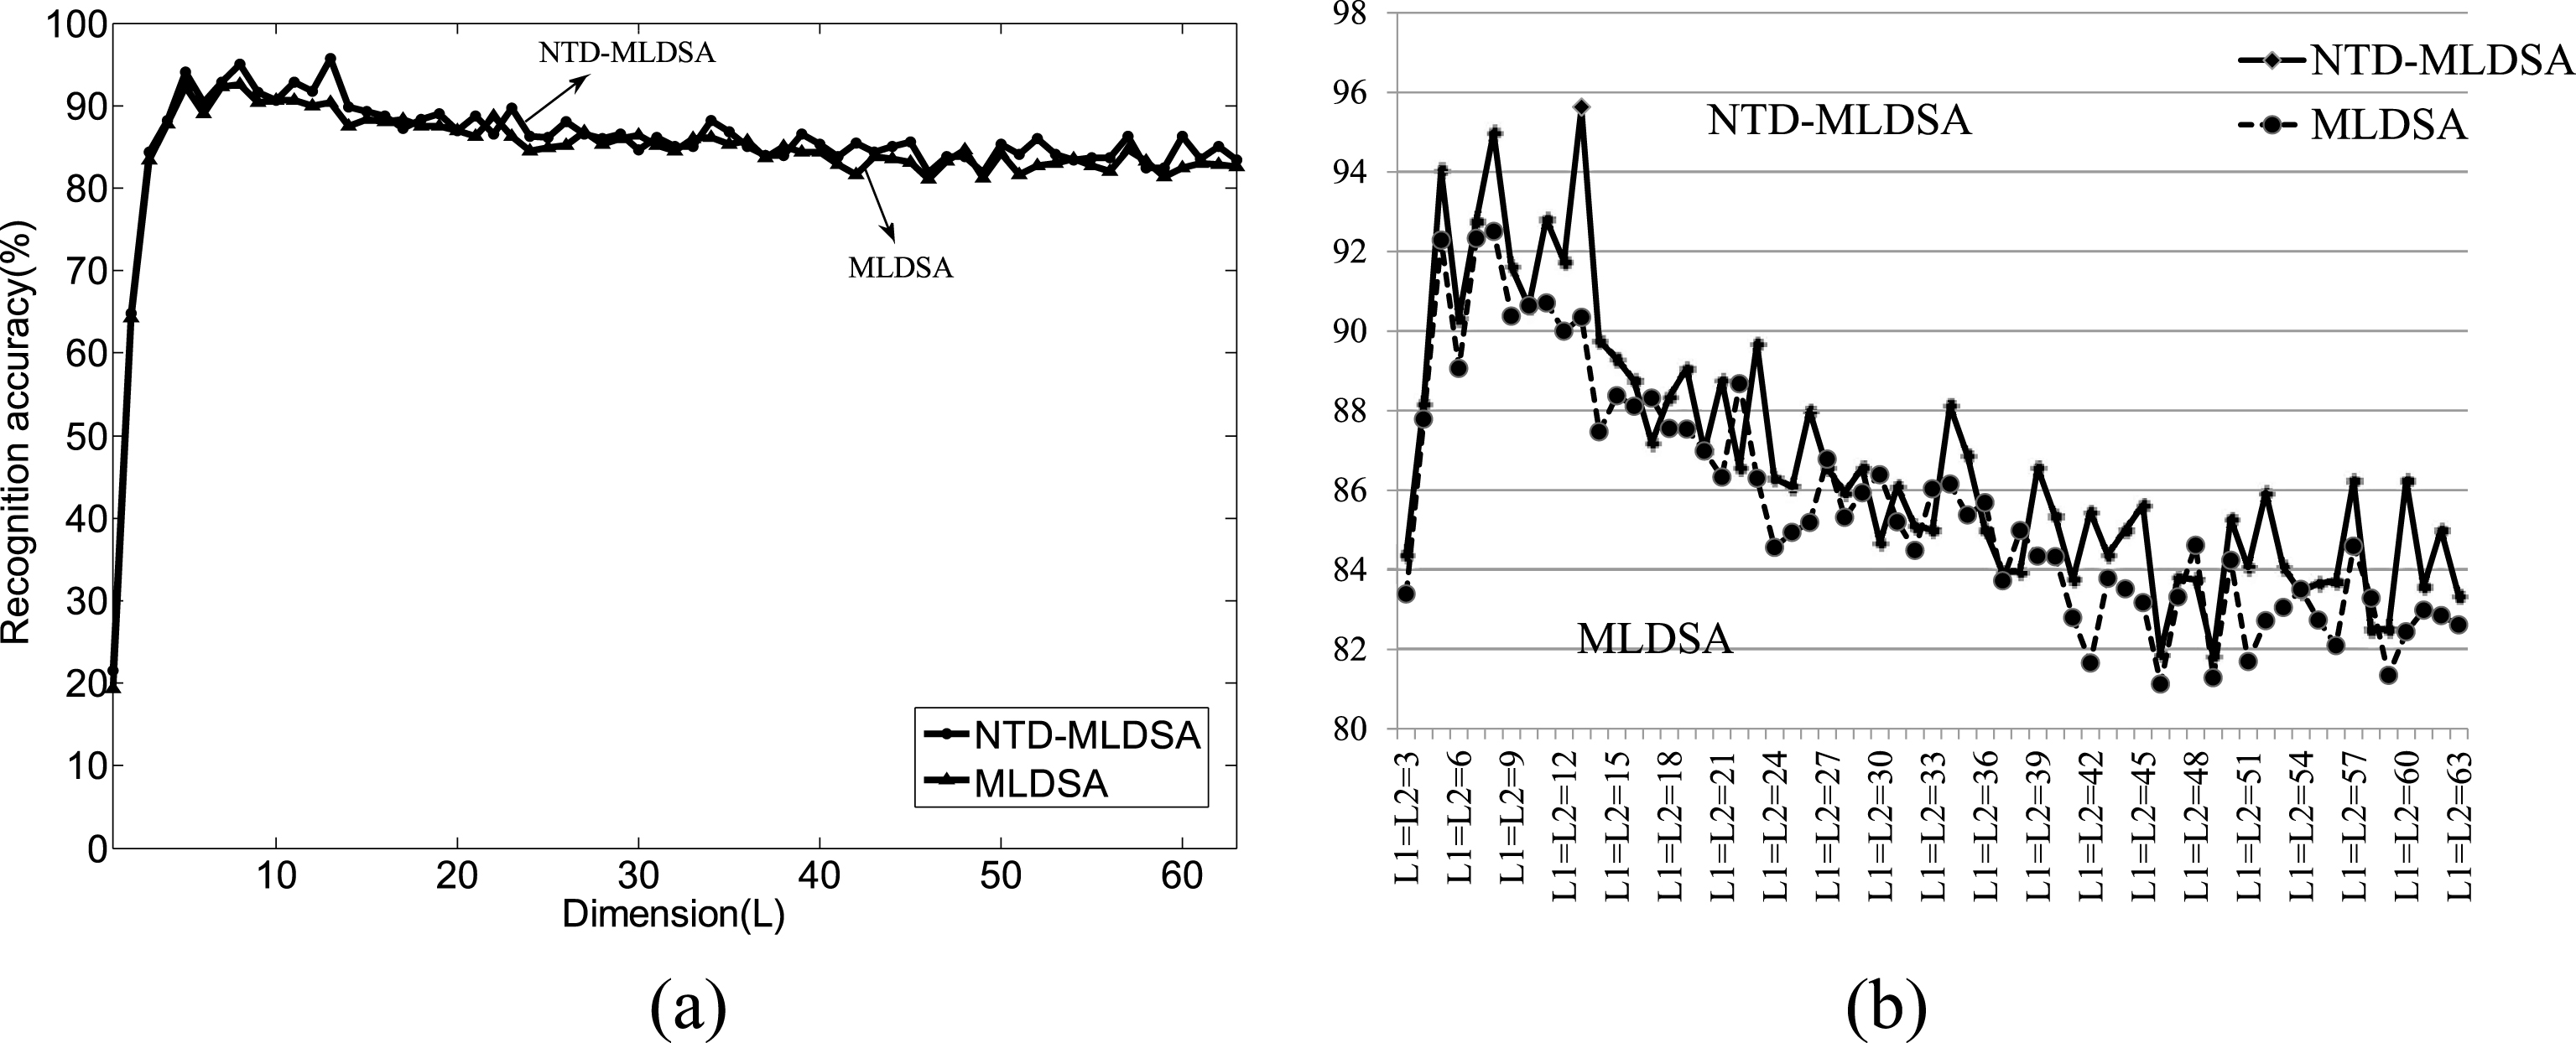
Precision rate vs. dimensionality reduction of NTD-MLDSA and MLDSA on ORL database.
The aircraft registered number is made up of letter and number. Arabic numbers are the major part of it, and from different angles, numbers show different shapes, then, in this section, it uses USPS database to carry out the experiment.
The USPS database of handwritten digital characters (0–9) contains 10 classes and 11000 normalized grayscale images of size 16 × 16, each class has 1100 images. To better understand the matrix structures of USPS, the grayscale images are shown in Fig. 12:

Illustration of the images of USPS recognition database.
It conducts two experiments in this database. For the following two experiments, the whole dataset are randomly split into 11 subgroups, and each subgroup includes 1000 images (100 images for each class). it carries out the experiments on randomly selecting one subgroup, a random subset with 50 images per handwritten digital (hence, 500 images in total) is taken with labels to form the training set, the rest of this group are considered to be the testing set.
In the first experiment, there are seven kinds of algorithms compare in recognition accuracy with the neighborhood size k = 1.
As shown in Fig. 13, NTD-MLDSA, MLDSA, t-LDA and t-PCA have similar recognition accuracy distribution, and NTD-MLDSA reflects a certain advantage. When the value of L is relatively small (L = 1, 2, ⋯ , 6), LDA outperforms NTD-MLDSA, but in the recognition accuracy stability, as show in Fig. 14, LDA is worst and NTD-MLDSA is best, in other word, NTD-MLDSA is most robust than the other six methods for tensor dimensionality reduction.
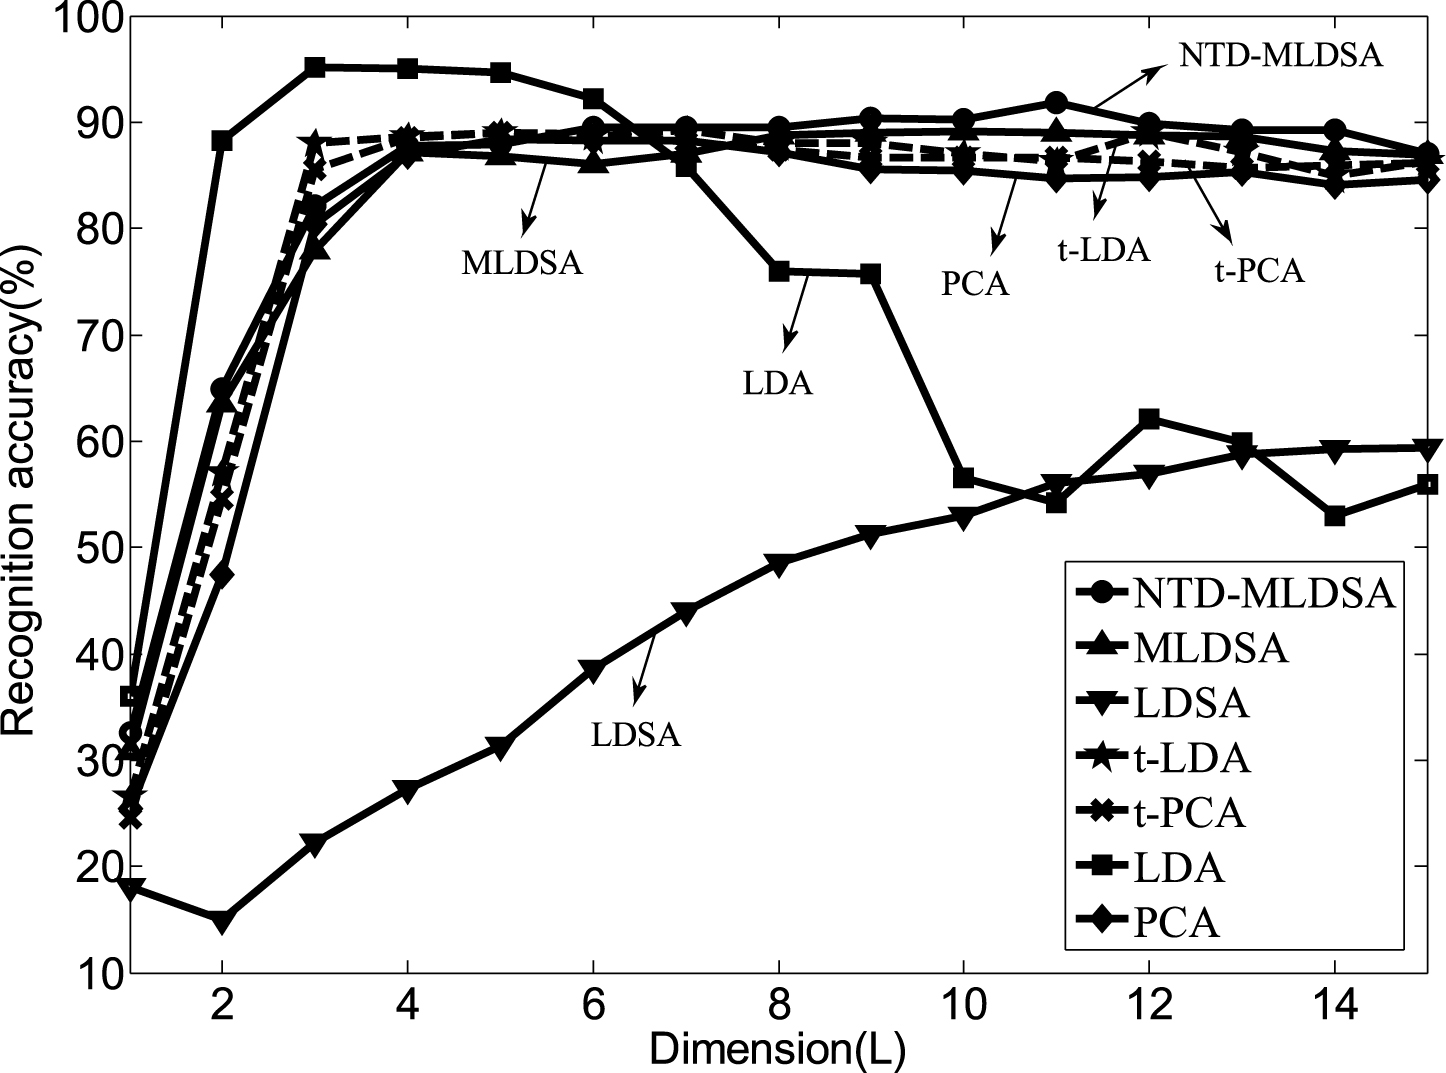
Recognition accuracy of the seven dimensionality reduction methods on the USPS database.
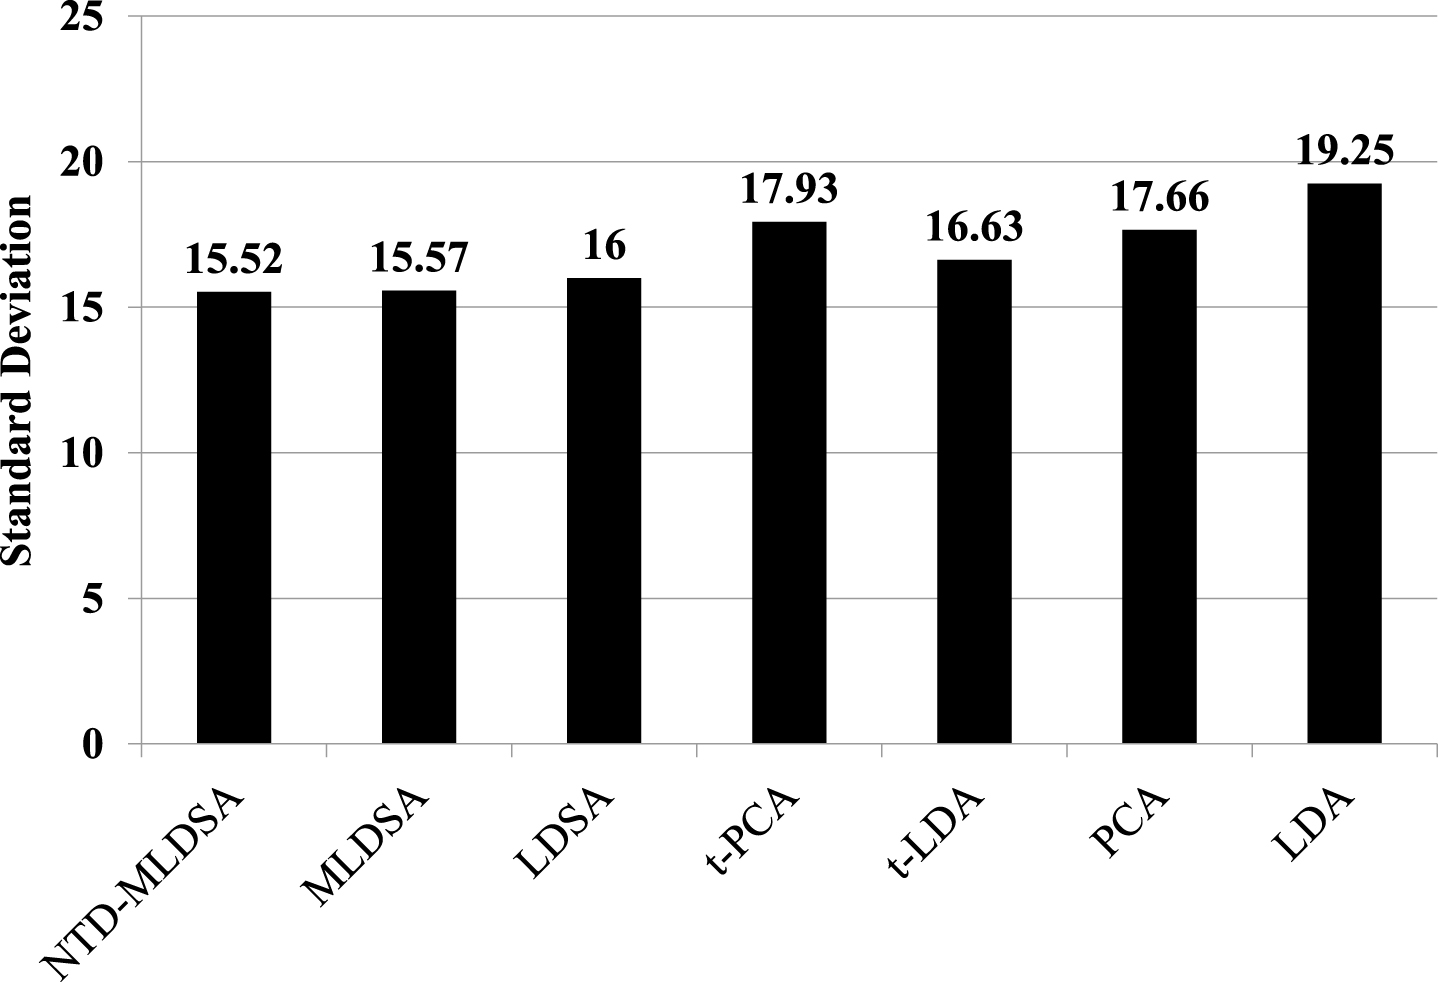
The standard deviation (SD) of the accuracies.
The quality of an algorithm is not only in the recognition accuracy, but also in the calculating time or the number of iterations. Table 4 formulates the total calculating time (training time and texting time), the size of the matrix of the generalized singular value problems in the algorithm process, and the maximum number of iterations Tmax, with L = 1 and k = 1. For vector-based methods LDSA, PCA and LDA, although the size of the generalized singular value matrices is larger, the total calculating times are less than tensor-based methods NTD-MLDSA, MLDSA, t-PCA and t-LDA, the reason for this phenomenon is that LDSA, PCA and LDA is without iteration. Compared with the other three tensor-based methods, neither the total calculating time nor the iterative speed, NTD-MLDSA also has certain advantages. Since NTD-MLDSA needs to compute the transformation matrix G1/-2, then it costs more total calculating time than MLDSA. For t-LDA, as proposed in [2], since it needs the calculations for inverse matrix in the process of solving the eigenvectors. then, any eigenvector sufficient reaching zero will greatly affect the convergence rate of t-LDA. For this reason, the maximum number of iterations Tmax of t-LDA is large than other methods, and the total calculating time is longest.
Comparison of the algorithm process
In the second experiment, as shown in Fig. 15, for different sizes of dimension reduction subspaces under various values of the neighborhood size k, NTD-MLDSA achieves better recognition accuracy than MLDSA. These results once again indicate that NTD is more reasonable than ED to measure the distance of images.
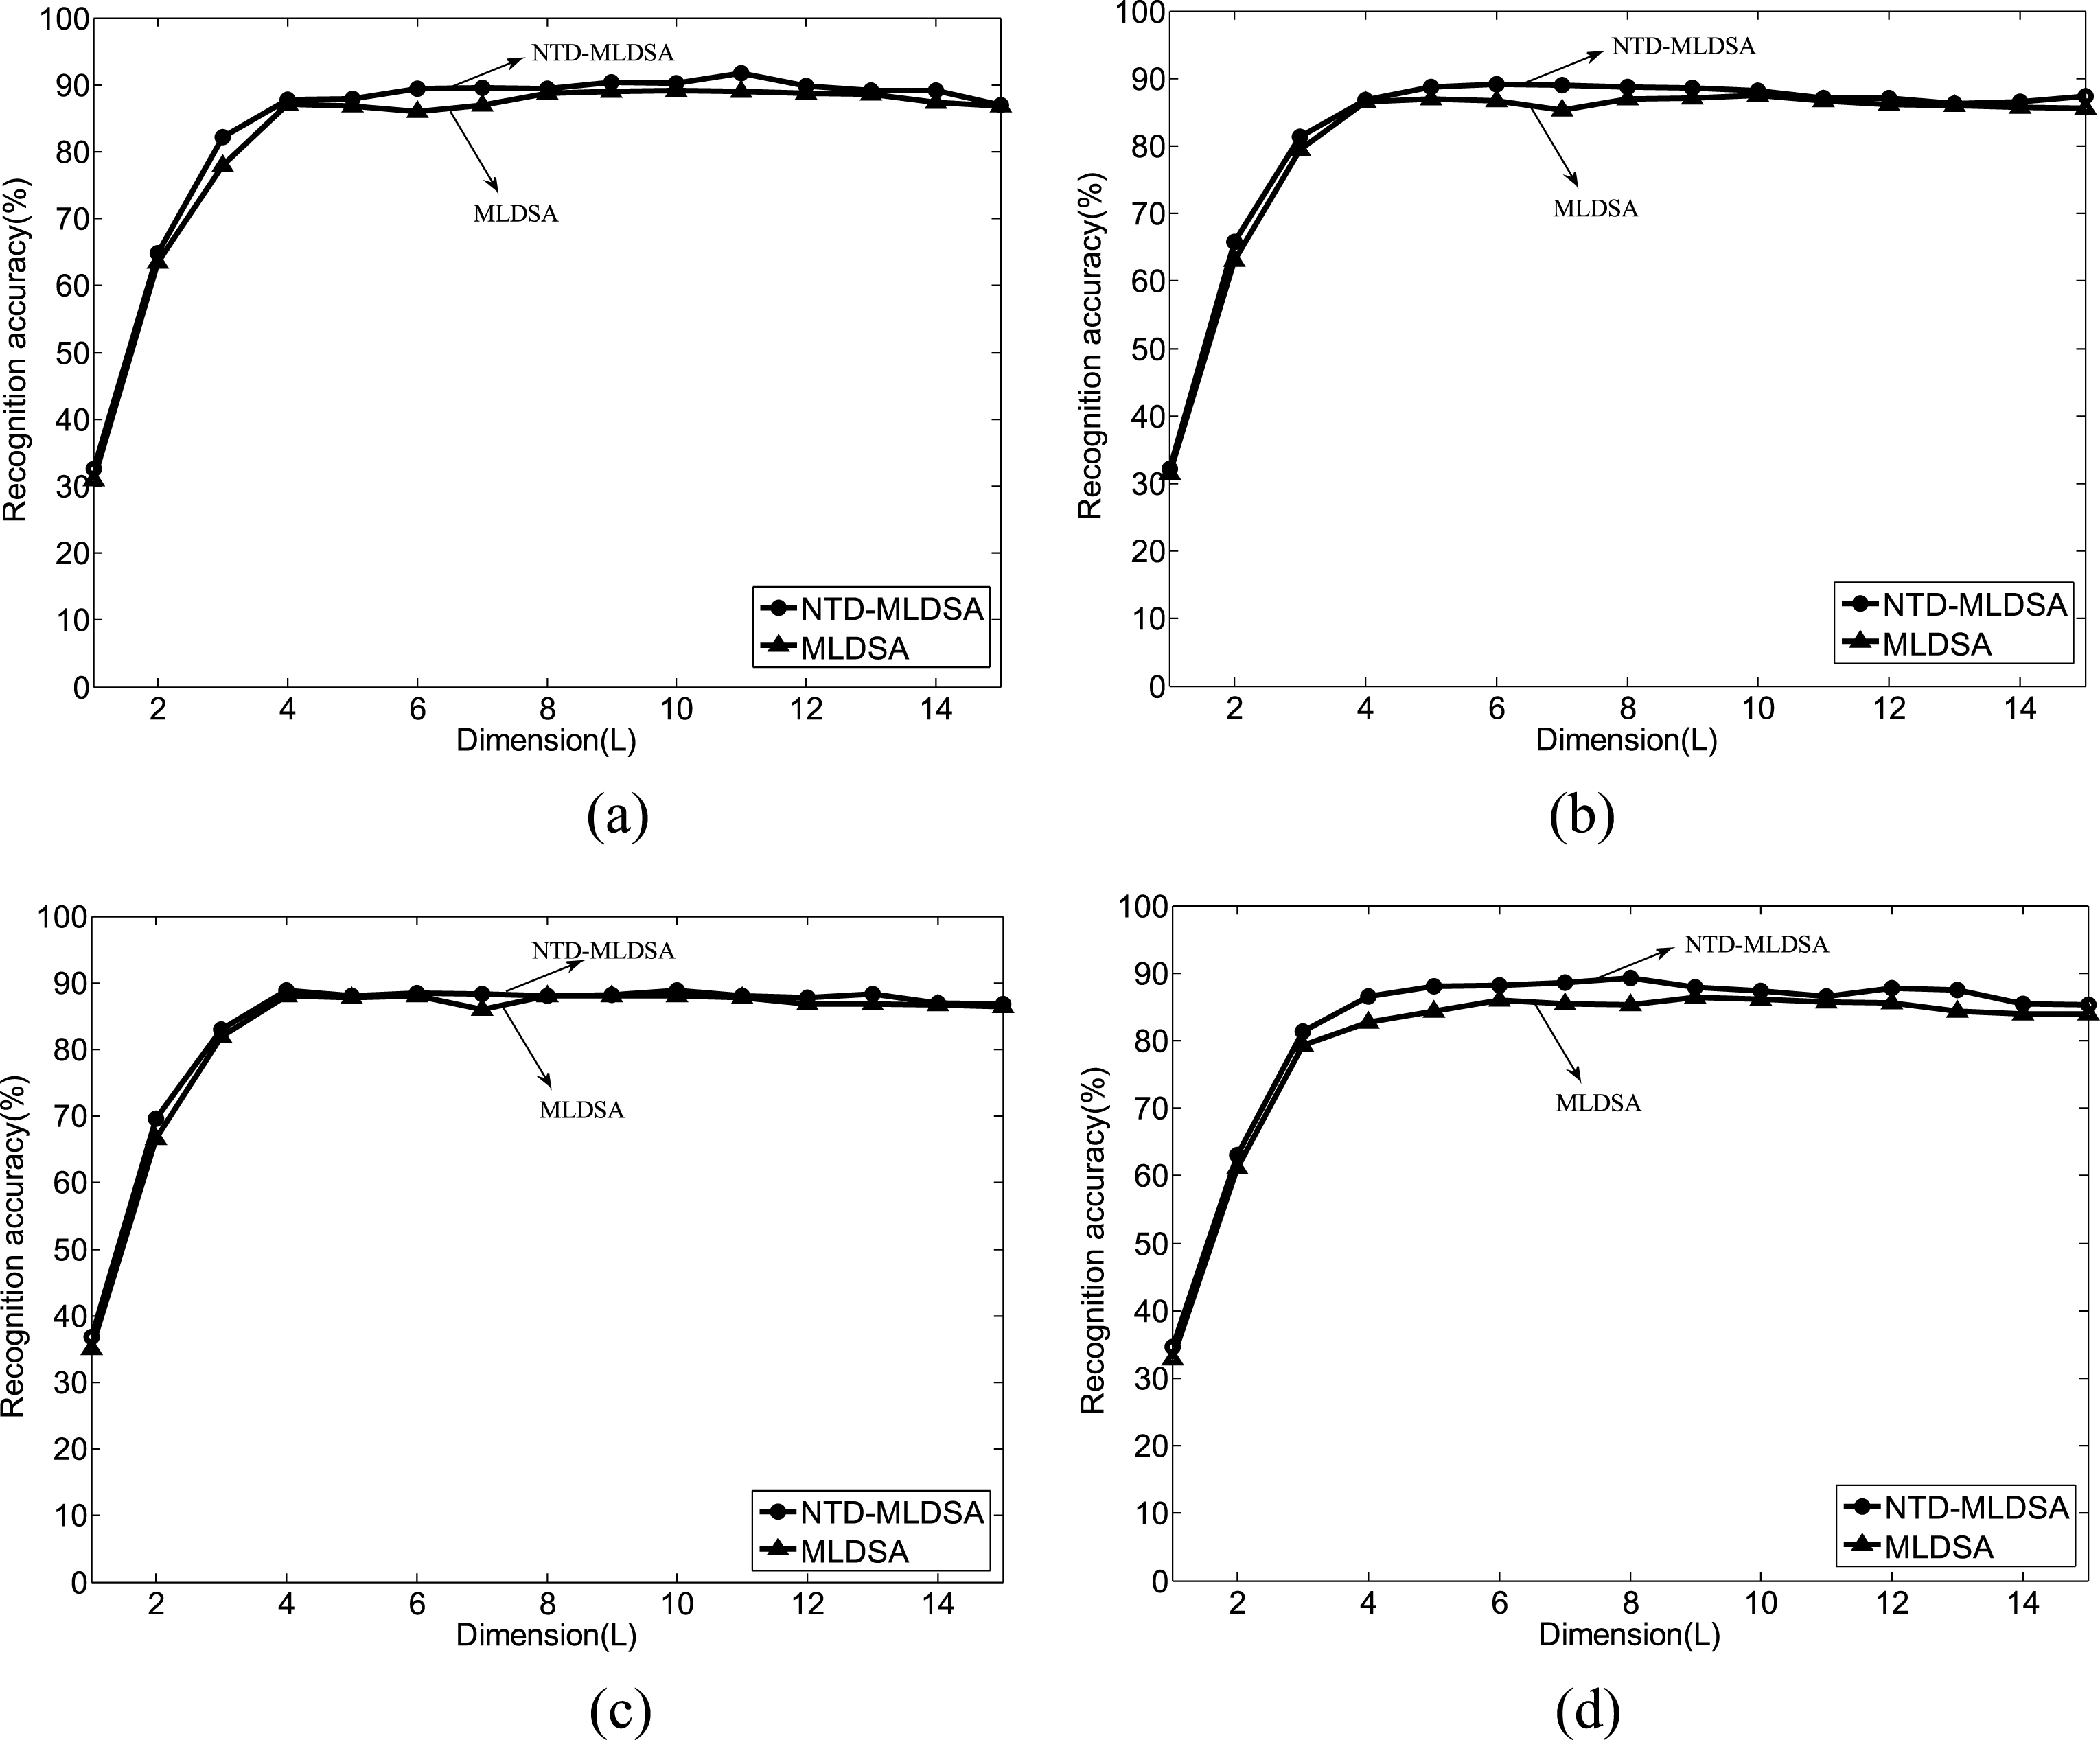
Recognition accuracy of NTD-MLDSA and MLDSA on the USPS database with various values of k. (a) k = 1. (b) k = 2. (c) k = 3. (d) k = 4.
In the field of civil aviation security, the status of image recognition is becoming increasingly important, it is widely used in the recognition of passenger and aircraft registered number. This paper proposes a novel method NTD-MLDSA for tensor-based dimensionality reduction, which using tensors to represent the images. The research contributions of this article can be expressed as follows: The objects of NTD-MLDSA are tensor-based data, it can maintain intrinsic structure information of the image. In order to reflect the accurate distribution and structure of the data, both similarity measure and dis-similarity measure are used in NTD-MLDSA, it not only keep the local information of the datasets, but also the global information. The new tensor distance is introduced, which can maintain intrinsic structure information and reflect the reasonable distance relationships of images. Through a series of numerical experiments, the results show that NTD-MLDSA has the better effect of dimension reduction, faster computing and convergence speed.
In this field, there are some works need to explore. Two significative directions are as follows: Reducing the time cost of NTD-based dimensionality reduction algorithms. Applying the NTD to other image processing problems.
Footnotes
Acknowledgments
This work was supported by China National Natural Science Foundation of Civil Aviation Joint Fund Project (No. U1533120), and the National Natural Science Foundation of China (Nos. 11371365, 11301535).