
Abstract
In continuation of the previous work, we now introduced a new algorithm for text embedding based on scan pattern with XOR and texture synthesis. In this work we have considered natural images and the scan pattern and XOR function in three standalone steps have been used to embed text into patching regions from a sample natural image/video transformed and copied to the output and then stitched together along optimal seams to generate a new output. The size of the patch is not chosen before, but instead a graph cut technique is used to determine the optimal patch region for any given offset between the input and the output texture. The graph cut technique for seam optimization is applicable in two and three dimensions. This graph cut technique of patching into original picture is very much applicable in image processing. We present a new idea to embed text into patching seam using scan pattern with XOR and then placed in the original image. Although this technique is expensive in terms of image area usage but it is a new idea for text embedding and has to be optimized in the sense of original picture usages. We show results for regular, random and the natural images. We also demonstrate how this method can be used interactively.
Introduction
In our recent published work [1], we have developed an algorithm where the text embedded into patch regions using graph cut technique. In that work the text embedding procedure was conventional. In the present work we used a technique of scan pattern with XOR function [2] for text embedding into patching region. This is made our previous algorithm more secure and strong confusion process. Our main focused is the patching region where we are interested to embed text using scan pattern with XOR. Here we explained first the usual graph cut technique and then the idea of scan pattern with XOR.
The sample based image texture synthesis method was needed to generate large realistic texture for rendering of complex graphic scenes. The concept of texture was defined as an infinite pattern that can be modeled by stationary stochastic processes. In the paper [1], we have presented algorithm which generated an infinite pattern from a small amount of trainee data using a small example patch embedded with text of the texture. We generated a large pattern with embedded text stochastically. The algorithm first searched for an appropriate location for the placement of the patch. It was then used a graph cut technique to find the optimal region of patch embedded with text to transfer to the output. These approaches were not limited to spatial (image) texture, and included spatio-temporal (video) texture.
A generated texture was perceptually similar to the example texture. This concept of perceptual similarity has been formulized as a Markov Random Field (MRF). The output texture was represented as grids of nodes depended on the similarity of their neighboring pixels in the input textures. This input texture was used for text embedding. The goal of texture synthesis restated as the solution for the nodes of the network. This formulation is known as machine learning. The primary contribution of our previous paper was an algorithm for texture synthesis with text embedded into it which after finding a good patch offset, computed the best patch seam. The algorithm worked by reformulating as a minimum cost graph cut problem. Finally we have extended our previous text embedded into encrypted images based on graph cut algorithm. This graph cut technique was fairly used in image processing as a whole and synthesis specifically; First time we have introduced our text embedded into patterns which after synthesized placed in an output image. In the present paper we extended our work by exploiting scan pattern with XOR function for the text embedding into patching regions. In the following section we explain this idea in detail.
Scan language and proposed method
SCAN language is an Image preprocessing language, devoted to generate a family of 2D scanning patterns (or fractals). The scanning path of the image is a random code form, and by specifying the pixels sequence along the scanning path. Note that scanning path of an image is simply an order in which each pixel of the image is accessed exactly once. Such encryption also involves the specification of set of secret scanning paths. Therefore, the encryption needs a methodology to specify and generate a larger number of wide varieties of scanning paths effectively. A scanning of a two dimensional array is a bijective function from to the set. In other word, a scanning of a two dimensional array is an order in which each element of the array is accessed exactly once. Note that an array has scanning function Pm×n = {p (i, j) 1 < i < m, 1 < j < n} is a bijective function from Pm×n to the set {1, 2, …, mn - 1, mn}. The details of this technique can be found in [2]. Now the proposed algorithm is described as follows. Take a target matrix in terms of adjacency matrix of size 256×256. This is called target matrix to be restructured. Identify a cluster of pixels which is needed to be re-patched to get the target matrix repair. Consider another objective matrix of the same size from where a patch is extracted using graph cut technique. This patch of objective matrix is being used to embed text in it. The embedded text patch is placed in the target matrix to recover the original picture. This original picture is now embedded with text. To recover text the patched portions remove from the original picture and text to be recovered. Embedding of text into patch is done with scan language technique described in [2]. The algorithm is implemented into a sample picture (Fig. 8), where Fig. 8(a) is a target picture to be synthesized, Fig. 8(b) is the mask of input image. The text is to be embedded in the mask. Figure 8(c) is obtained after placing the mask into target image through graph cut technique and Fig. 8(d) is spread after the use of graph cut technique.
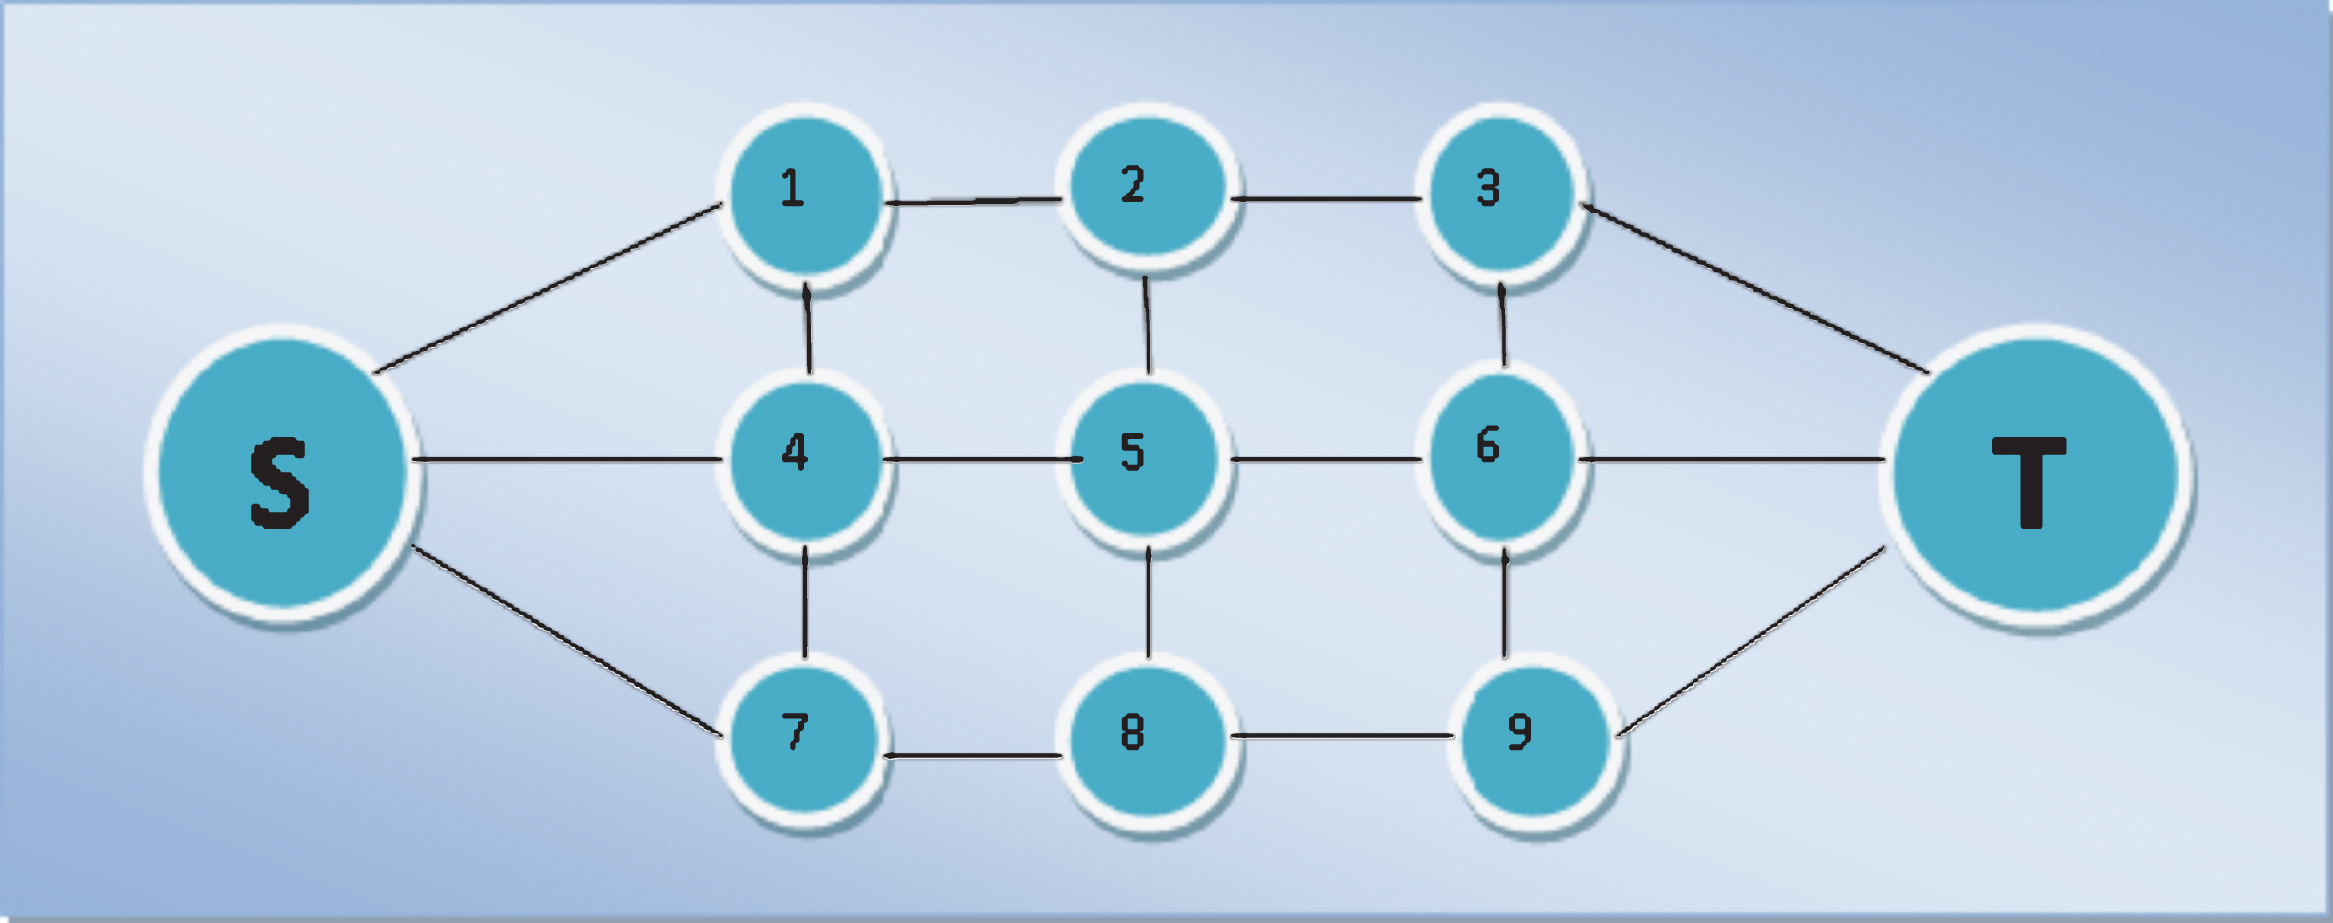
Example of graph with source and sink.
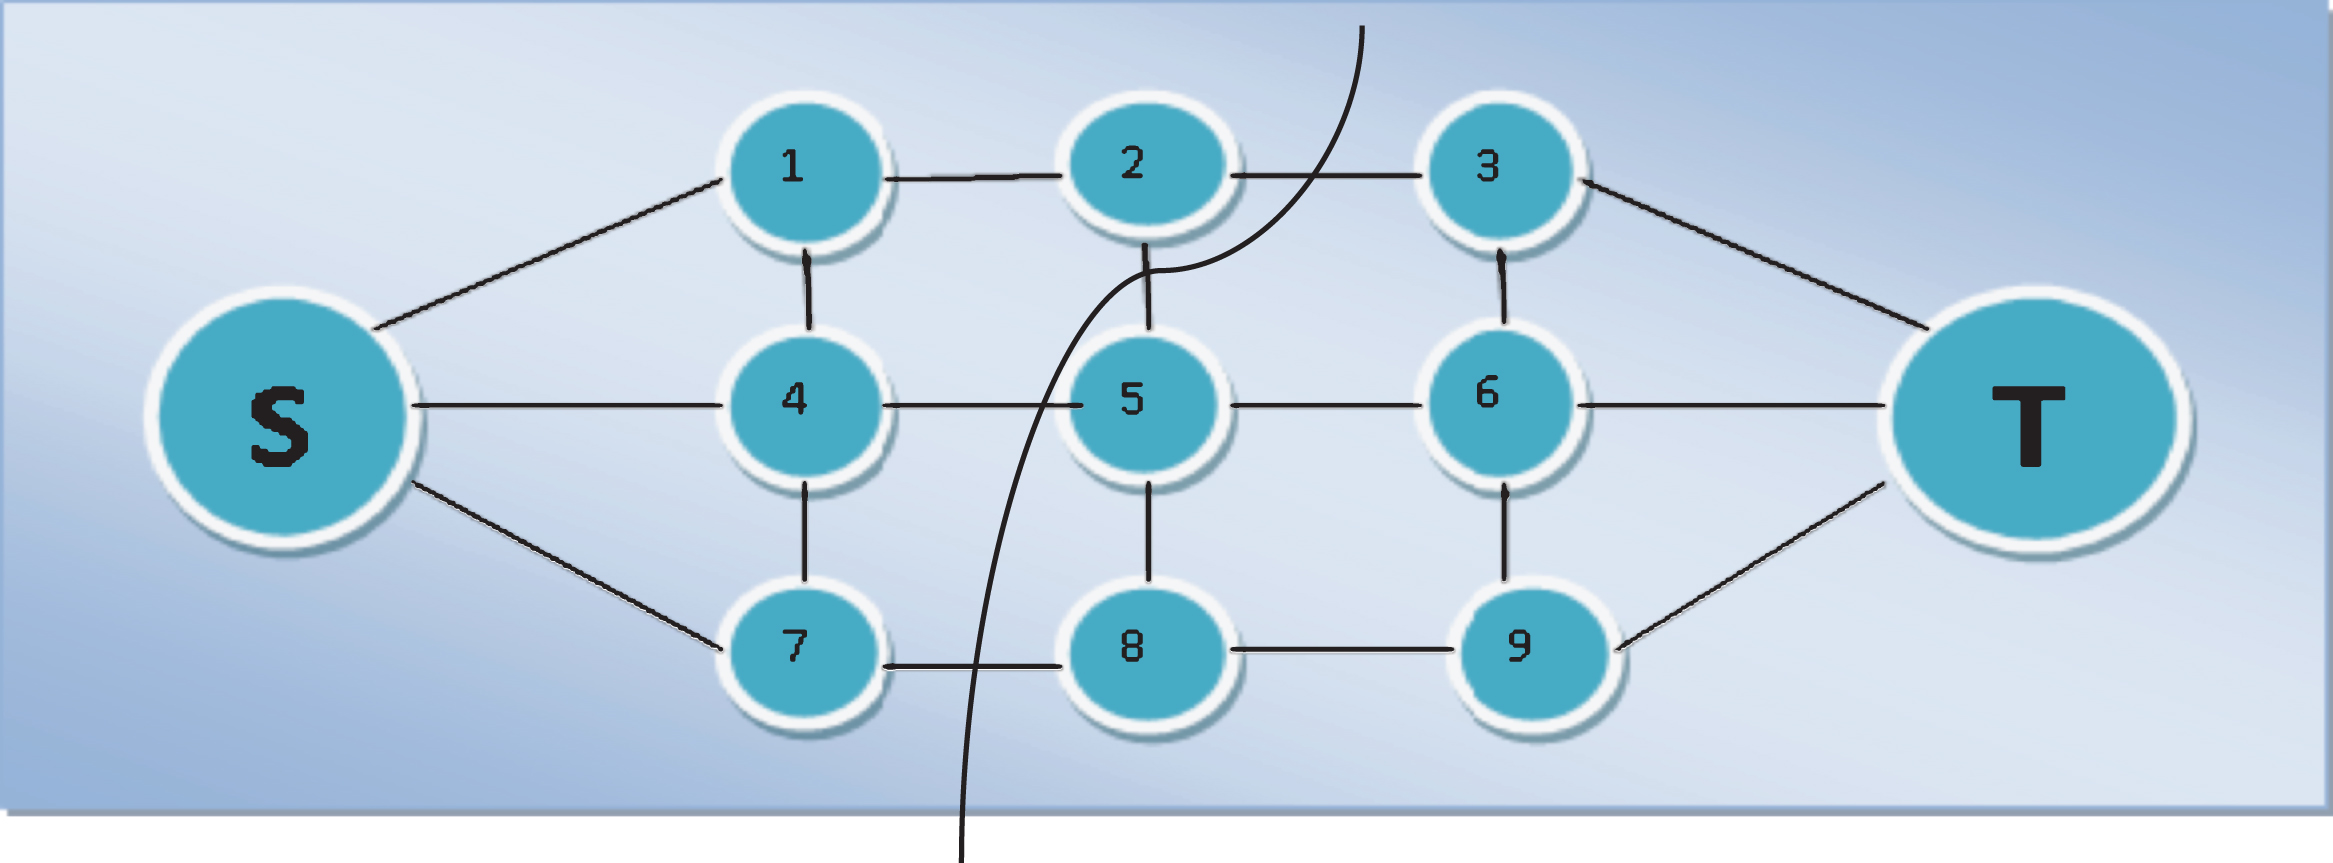
Example of cut on a graph.
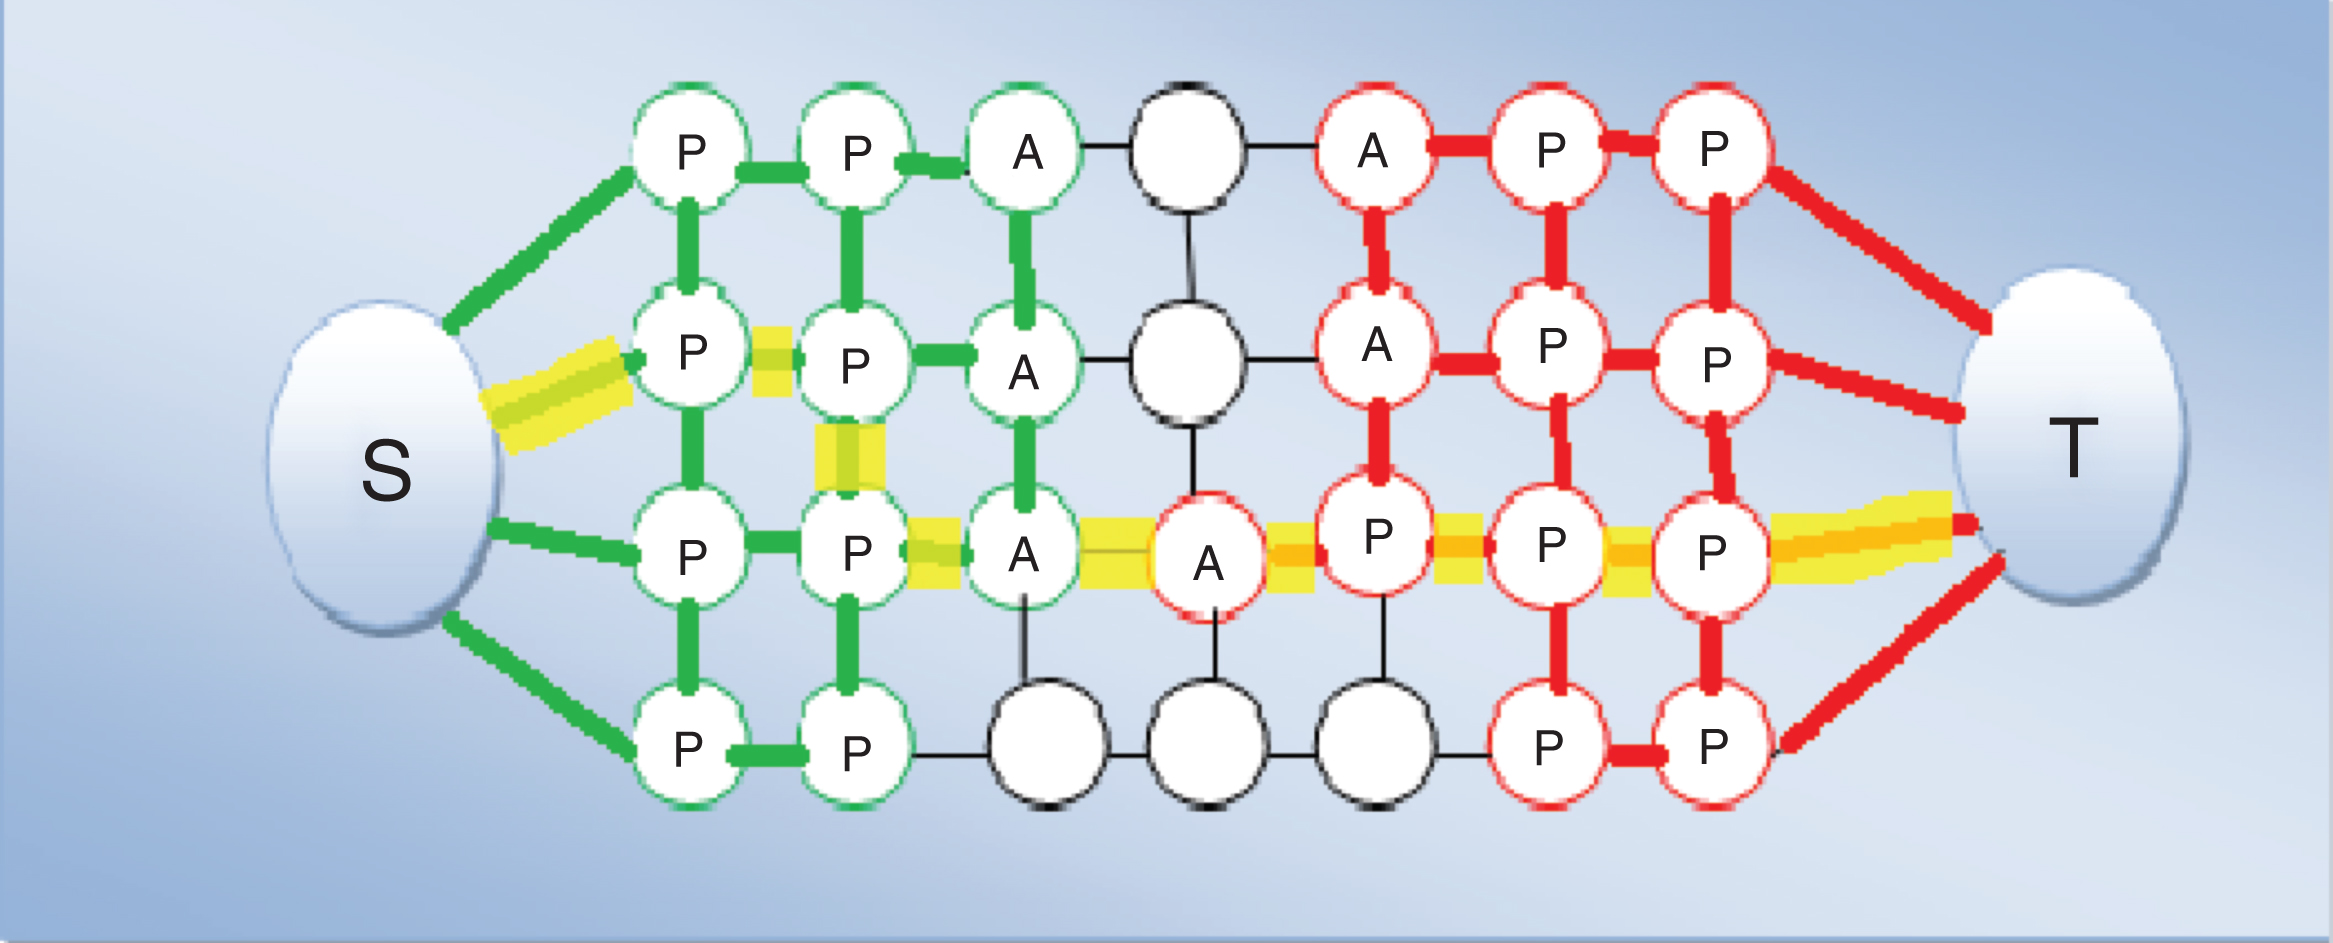
Example of search Tree S1 (Green nodes) and S2 (red nodes) after growth Stage when path is found from S to T. Free nodes are represented by black nodes. Active and passive nodes are labeled by A and P respectively.
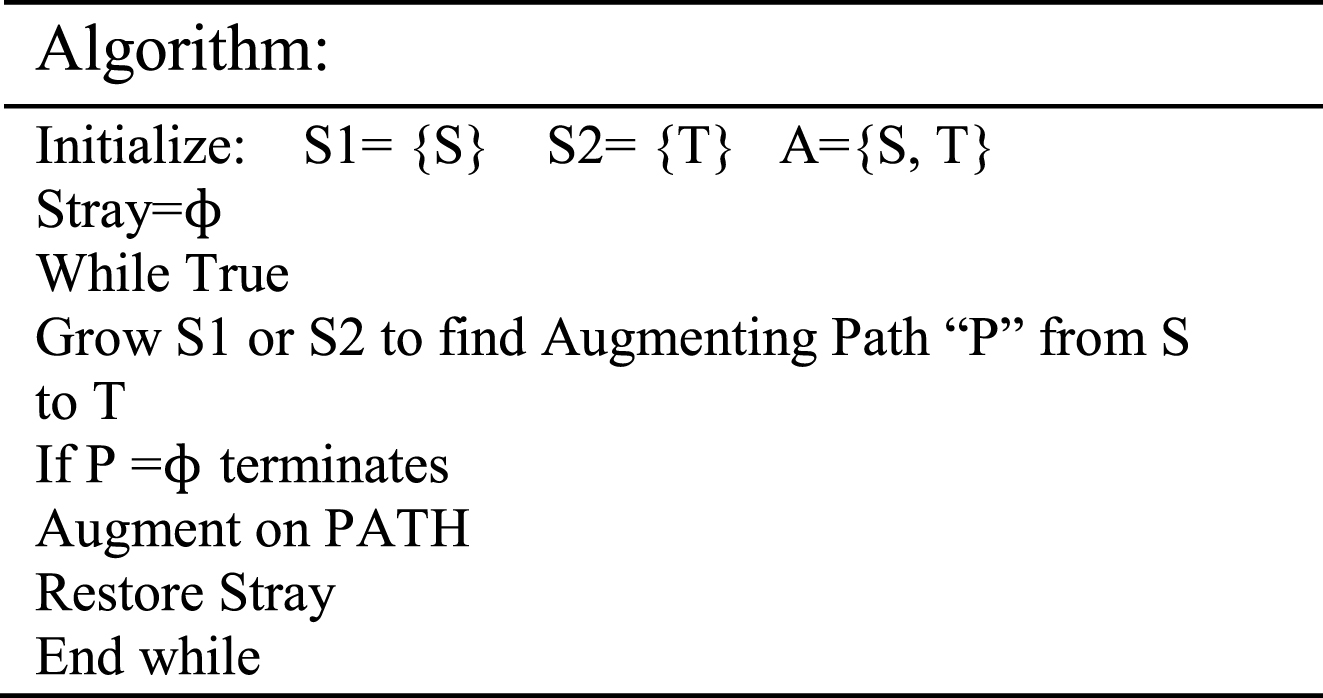
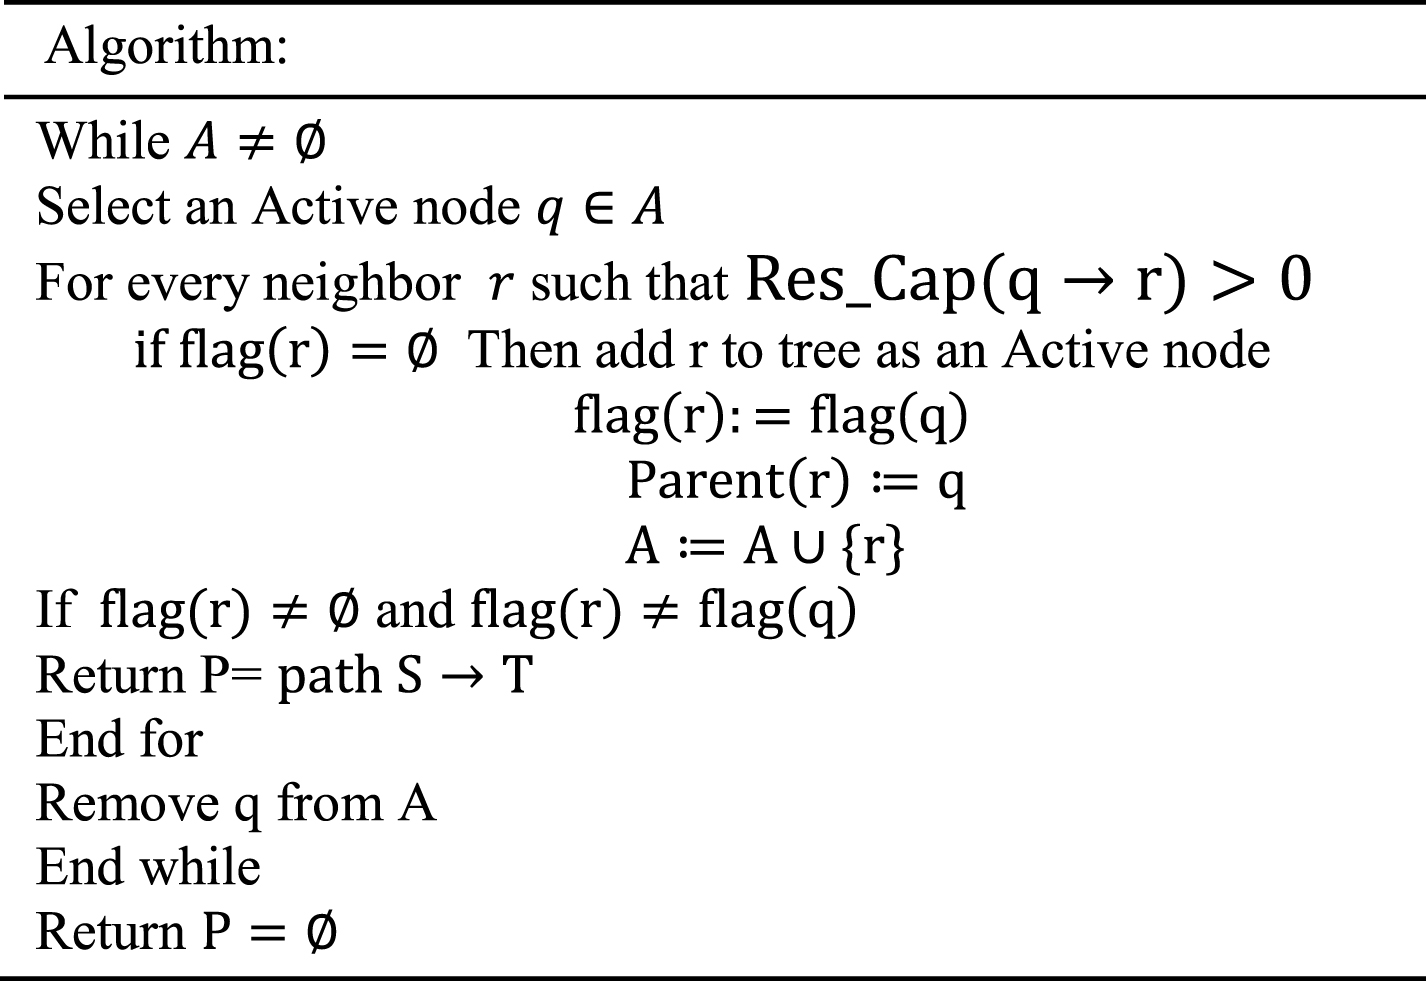
Structure of algorithm.
Growth stage.
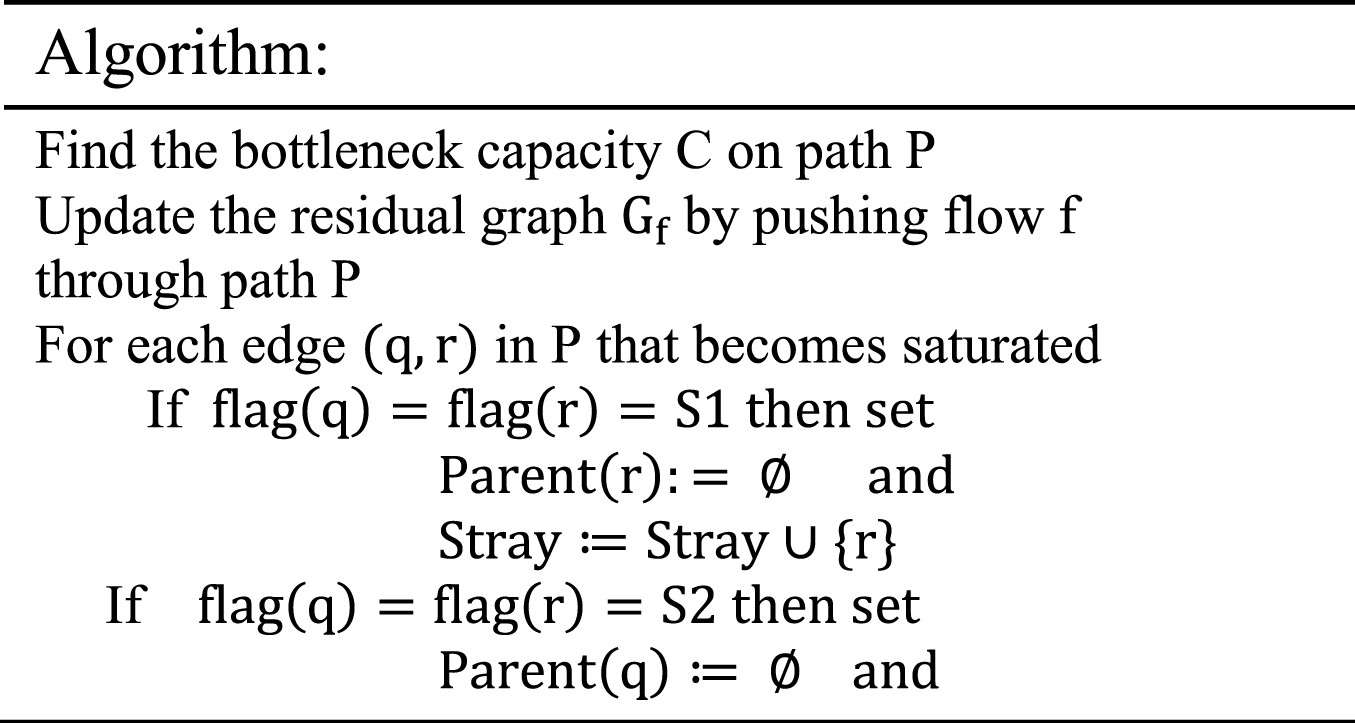
Augmentation stage.
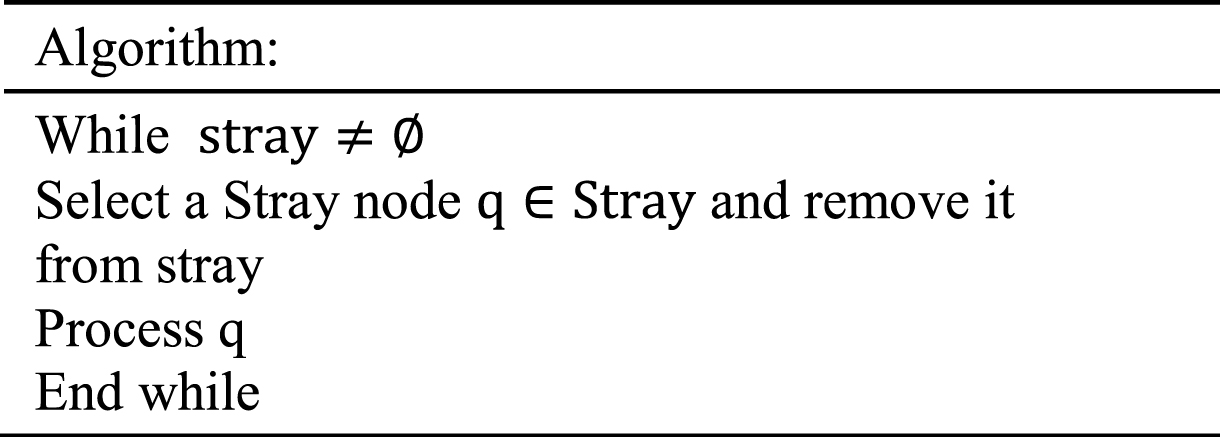
Adoption stage.
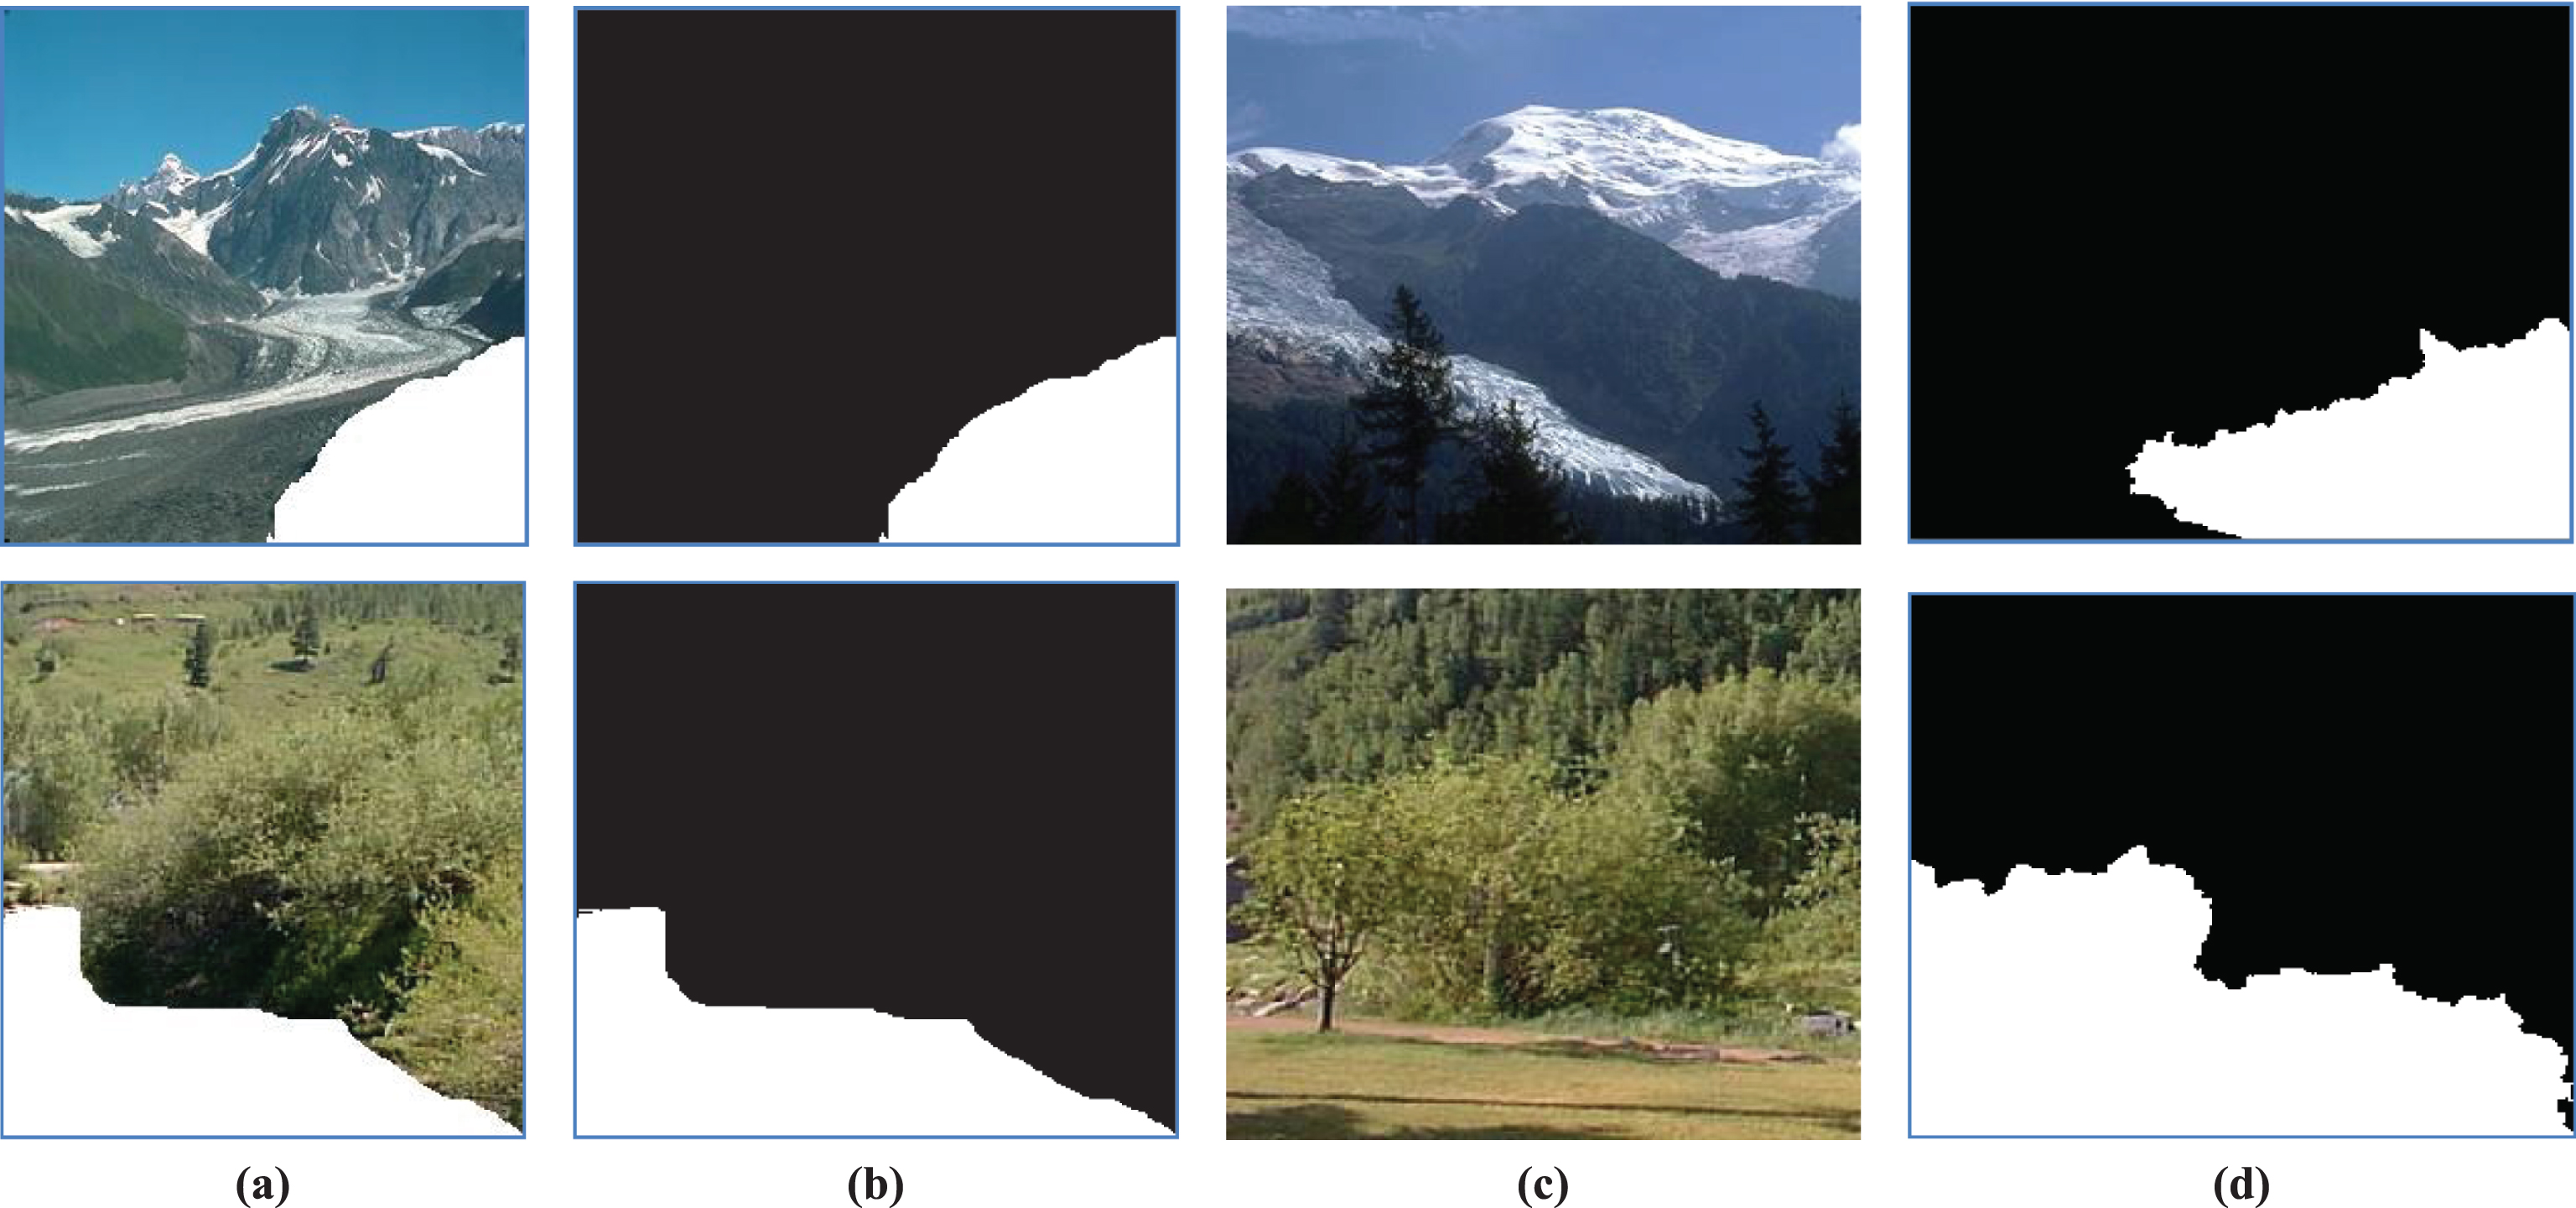
Real Scene 1 and 2 (a) Input Image (b) Mask Image (c) Matching Image (d) Graph-Cut Mask Image.
The jest of the algorithm is the composition of the matching scene when place back to the target image. It has to recover the target image completely without superimposing pixels. The process of image composition is described in the following section.
Image composition using graph cut
Once the best patch was found, we place composite matching scene into incomplete image. The input mask covers the area of incomplete image that the user specified but edges of mask might not be best for stitching two images when gradient of both images are very different to each other. This can be reduced by refining the input mask, we allow mask to leave from its original path and find its best place so that subsequent blending looks more persuasive. Instead of copying and pasting matched patch into hole, stitch it together with original image so that seem between matching patch and original image is less noticeable. This can be done by finding maximum flow/minimum cut via graph cut, it has played very important role in solving certain problem in vision. Growing number of publications in vision use graph-base energy minimization techniques for application like image segmentation [15], image restoration stereo, object recognition, Texture synthesis, shape reconstruction and others.
Graph we are building consider one node for each pixel that will be in final image. Each pixel is connected to its four neighbors. For solving graph cut problem, we need some quality measure for pixel from the original image and matched image. We assigned weights to all edges of pixel that is being considered the simplest measure is color difference between pair of pixels where s and t be two adjacent pixels in the overlap region. These weights actually decide where the best cut will be. In order to create flow inside graph we need two terminal source and sink as shown Fig. 1, all pixels under mask are connected to sink while all pixel at the maximum border of local context are connected to source terminal so flow must go through the border of input mask. For calculating maximum flow/minimum cut, we have used library implementing Max-Flow Algorithm [11].
Background on graph
A graph G = {V, E} consist of set of nodes V and set of edges E. Each node represents to a single pixel. In order to solve problems in vision using graph cut, we need two additional nodes source and sink are called terminals as shown in Fig. 1. In the context of vision, terminals correspond to set of labels that can be assigned to each pixel that is being considered. George et al. [13] were first to proposed the max-flow/min-cut algorithms from the combinatorial optimization can be used to minimize the energy function. The energy function proposed by George et al and other graph-based methods can be represented as Equation 1.
Where L = {L p |p ∈ P} is a labeling of image P. D p (.) is data penalty function that indicates label preference for pixel based on intensities. Vp′q is an interaction potential that instigate spatial coherence by penalizing discontinuities between pixels. Normally there are two types of edges N-links and T-links. N-links connects pairs of pixel. Cost of n-links refers to a penalty for discontinuity between pixels and this cost can be derived from the Vp′q term from Equation 1. T-links basically are used to connect pixel with terminal nodes called source and sink, cost of t-links refers to a penalty for assigning a specific label to the pixel. In the next section we will describe Min-cut/Max-flow problem briefly.
An s/t cut CT with two terminals is partition of graph into subset S1 and S2 in such a way s belong to S1 and t belongs to S2. Figure 2 shows example of simple graph cut which show all nodes say Node1, Node2, Node4 and Node7 should belongs to subset S1 while Node3, Node5, Node6, Node8 and Node9 should belongs to subset S2. The cost of cut CT can be defined as “Sum of cost of all boundary edges say {p, q} where p ∈ S1 and q ∈ S2. The basic purpose of minimum cut is to find a cut which has minimum cut among the all cuts. This problem can be solved by finding maximum flow from source S to sink T. In other words we say that, maximum flow is like “maximum amount of water” that can be pass from source to sink by using edges refers to as “Pipes”. This can be done using most commonly used algorithm Ford and Fulkerson [12] states that maximum flow from source to sink actually saturates the edges that divide the graph into two subset S1 and S2 corresponding to minimum-cut [14]. Hence maximum-Flow and minimum-Cut are equivalent. In simple words cut CT divides the graph into disjoint subset S1 and S2 and each subset containing only one terminal. Therefore, any cut corresponds to assigning a label to a pixel (node).
Algorithm overview
Figure 3 shows basic terminology, there are two non-overlapping search trees S1 and S2 connected with parent/root at source S and sink T respectively. In tree S1 and S2 all edges from its parent to children are non-saturated. The nodes that are not connected to any terminal node are called free nodes.
The nodes in tree S1 and S2 can be passive and active labeled as A and respectively, as shown in Fig. 3. The basic idea is active nodes allow to grow tree by getting new children from the free nodes. Active nodes are those which are on the border while passive nodes are internal nodes that cannot grow the tree because these nodes are completing blocked by other nodes. This algorithm is augmented – based, augmented path is found when an active node in one of the tree S1 or S2 finds a node that belongs to other tree. There are three stages that this algorithm iteratively repeats.
Detail implementation of algorithm
For augmenting path algorithm, Flow f and residual graph G f (Residual graph have same topology as original graph, it only reflects residual capacity of edge given the amount of flow in that edge) should maintain. Lets we have a graph G = {V, E}. The structure of algorithm as shown in Fig. 4. The detail of algorithm’s stages Growth, Augmentation and Restore is described below.
It is very helpful to store content of search tree S1 and S2 using a flag that actually describe the relationship of each node q. so that
If node q belongs to any tree then its content would be stored as Parent (q). It is very important to mention it roots of search trees say source and sink, Stray and all free nodes don’t have any parent. All augmenting path algorithm must maintain residual graph so Res Cap (q → r) shows the residual capacity of edge (q, r) if flag (q) = S1 or edge (r, q) if flag (q) = S2. The point that is very important all these edges should be non-saturated for node q to be a valid parent for its child r.
Growth stage implementation
At this stage Active node gets new children from free nodes.
Augmentation stage implementation
During growth stage a path S → T has been found. The augmentation stage takes this path as an input and augments that path by pushing maximum flow from S to T so that some edges in path may become saturated. Initially, “Stray” is empty but at the end of this stage there may be some “stray “nodes because at least one edge become saturated in the given path.
Adoption stage implementation
In this stage all stray nodes are processed. Each node q being processed finds a new parent within same tree. If node q finds valid parent that node will remain in the same tree but with different parent and if it does not find a valid parent then this node will remove from Stray and becomes a free node. All its children nodes becomes Stray.
The operation “Process q” contains following steps. First, find new valid parent of process q from all its neighbors. A parent r is valid parent if flag (q) = flag (r) , Res
Cap
(r → q) >0 and origin of r should be source or sink because during adoption stage some node may come from Stray in the search tree S1 and S2. If node q catches the legal parent then we assign Parent (q) = r and status of node q remains the same but if it does not find valid parent then node q is treated as free node and some more operations are needed to perform Scan all neighbor of node q such that flag (r) = flag (q) If Res Cap > 0 add r to the active set If Parent (r) = q add r to the set of Stray and set Parent (r) : =0 Flag (q) : = null, A : = A - q
Statistical analysis
The comparison was carried out in vertical, horizontal and diagonal directions using the given formulas:
Experimental results
After the experiment, outcomes have shown the strength of this algorithm as compare to the others [3]. We embedded and hide the text in actual or targeted image and got steganographed image. The peak signal to noise ratio (PSNR) of steganographed image is analyzed, the PSNR increased in this algorithm and visually, one cannot differentiate between original image or wrap image and steganographed image. Having implemented the Graph cut technique on known test plain images, we obtained SNR value listed below for testing algorithm.
In Fig. 8, we have considered two real images, real image-1 and real image-2. Having done the analysis, the PSNR of the real image-1 is obtained 0.3721 and the real image-2 is 0.4120 so it is concluded that the image reconstruction in the case of image-2 is much better than image-1. This could be seen through open eye that the reconstruction of image-2 is completed in all respect and found no visible errors, although the embedding of text has already been done in the patch of image-2 as compared to imag-1 where some visible errors in the reconstruction of image-1 is found. It is further concluded that if the real images are regular and smooth, the reconstruction of such images are also smooth and regular by giving higher PSNR value. where x and y are values of two-adjacent pixels in the image and γxy is the correlation coefficient of two adjacent pixels. The test result is given in Table 2. The calculated SNR values using the proposed algorithm are given inTable 1.
The SNR value of different pictures
The SNR value of different pictures
Correlation of two adjacent pixels
This paper is an extended version of our previous work [1] in which we have introduced the graph cut technique to encrypt text into images. The patch for the purpose of text hiding has been used differently. The proven technique of SCAN language has been implemented for hiding text into patch portion and the rest of image construction was done similar to the graph cut techniques. An example of using such algorithm has been demonstrated and analyses have also been carried out for a variety of known images and SNR were obtained.
Hiding text in such a manner is the first time presented for a high quality security with double achievements. Further experiments would be done for saving space and cost effectiveness. Due to random security approach, it has ability to resist any kind of attacks. The scheme can be used on network communications.