
Abstract
The adoption of automobile safety assistance and driving alert systems is an effective way to ensure traffic safety because such applications can accurately predict vehicle aggregation situations. Improving the drivers’ lane selection process is not only the most fundamental reason for transforming vehicle aggregating but also the basic component of traffic flow research. However, the effects of factors such as the characteristics of individual vehicles and drivers, the types of manipulators used in complex vehicle aggregation situations, and the influence of vehicle conflict on lane selection have not been addressed in previous studies. This paper assesses the characteristics of various traffic manipulators, vehicles, and drivers to develop a lane selection model of basic urban expressway segments based on mixed fuzzy many-person, multi-objective, non-cooperative games. By analyzing drivers’ profits under different combinations of lane selection behavior, Nash equilibrium was confirmed in a single game process and optimal lane selection behavior was obtained in a dynamic game. The results show that the model’s prediction accuracy of lane changing is 85.2%.
Keywords
Introduction
The rapid evolution of transportation has caused car ownership to increase significantly, a factor that, unmitigated, should lead to increasingly serious human-vehicle-environment contradictions in road traffic systems and a higher frequency of traffic accidents. Automobile safety assistant driving systems (such as driving safety alerting systems) can play a role in avoiding and mitigating accidents. The accurate prediction of vehicle aggregation situations is the reason that automobile safety assistant driving systems are implemented. In addition to being basic components of traffic flow research, improving the lane selection and changing processes are fundamental reasons for transforming vehicle aggregation management. In early lane change models [4–6] the lane selection process was seen as a process by which drivers could determine their driving lane based on a specific order and priority of rules. However, such models did not consider the interactions between different drivers. Lane changing behaviors were classified as mandatory and discretionary lane changing (MLC and DLC, respectively) for the first time by Yang Q. and Koutsopoulos H.N. [18], who also classified the Gipps model of mandatory lane changing. The key enhancement offered by these models was the introduction of a random utility framework for lane selection, which helped capture tradeoffs between and influences of various factors on lane selection at any given instant. Ahmed K.I. [2] modeled lane changing as a three-level decision process as follows: decide whether to change lanes; if so, select the target lane; select gaps in the target lane to execute the lane change. One drawback of these models was that they handled MLC and- DLC situations separately and assumed that the type of situation (MLC or - DLC) was given at every instant of a driver’s trajectory. Toledo T. [13] introduced an integrated driving behavior model that combined MLC and DLC considerations and incorporated them at the level of the driver’s lane selection process. Driving on a road is a dynamic game process, and many scholars have studied drivers’ lane changing behavior from the perspective of game theory. Hideyuki Kita [7] developed a game theoretical model to describe the interactions of cars in merging or weaving sections and explained these interactions as two-person, non-zero-sum, non-cooperative games. Using case studies involving data analysis of videotaped observations, the proposed model could be used to calculate and reproduce the traffic behavior at on-ramp merging sections. Alireza Talebpour et al. [3] proposed a lane change model based on game theory. Based on the cooperative data information of the driver, the two person cooperation and noncooperation game under the complete information and the two person cooperation and no cooperative game are analyzed, and the different lane changing models are established. Wang Meng et al. [11] proposes a new method that can control both the lane changing and the car-following that is based on the optimal control of horizon control and the dynamic game theory. The search for the equilibrium solution is sought by the prediction of the discrete expected lane sequence and the continuous acceleration of the vehicle. The results show that the proposed method can obtain effective lane changing strategies at the same time to meet the requirements of safety and comfort. Peng Jinshuan [12] discussed a non-cooperative mixed strategy game between object and following vehicles in a target lane in terms of game theory-related knowledge. It was determined that the Nash equilibrium solution of a non-cooperative mixed strategy game is codetermined by driving safety, traveling time, and the respective degrees of importance of the outcomes. Most of these previous studies only considered game behavior between two drivers. Unfortunately, the behavior of vehicle aggregations cannot simply be split into a series of two-driver games. In addition, the previous studies did not look at characteristics of individual drivers and vehicles and their respective manipulator types under complex vehicle aggregation situations and were not able to take into account the influence of vehicle conflict on lane selection under multiple-lane situations. To better understand vehicle aggregation s on basic urban freeway sections, therefore, the object of this paper is to analyze vehicle aggregation situations composed of multiple game players and build up a description method using fuzzy logic. By calculating drivers’ profits under different combinations of lane selection behavior, Nash equilibrium can be confirmed in a single game process and the drivers’ optimal lane selection behavior in a dynamic game can be obtained.
Vehicle aggregation situation and lane selection
Vehicle aggregation situation
The traffic situation refers to all states and situations of traffic entity deployment and behavior in a driver’s interest-sensitive area (the interest-sensitive area is the area that has the greatest impact on vehicle safety; increased driver distraction increases this area) in state transport entity to deploy conduct constituted, and it contains all the information of traffic entity [15–17]. The traffic situation includes the characteristics of all traffic entities and vehicle group relationships needed by drivers to obtain complete scene interpretation information and accomplish their driving tasks. The characteristics of a traffic entity include vehicle type, velocity, acceleration, and driver type. The vehicle group relationship describes the changing positional relationship that self-organizes and evolves through aggregating behavior. The scene interpretation information is a description of the natural, artificial, and social environments inhabited by a car. In this article, we assume a vehicle aggregation situation (encompassing the characteristics of the traffic entities and the vehicle group relationship) in which drivers can perceive their interest-sensitive areas.
Definition of vehicle aggregation situation
To a better analyze drivers’ game-playing behavior under vehicle aggregation situations; the research scenario is defined in a three-lane scenario as an example. Figure 1 show that, the most typical case is when the target car located in n1. With target vehicle n1, the interest-sensitive area is divided into the left-front, left-rear, front, rear, right-front, and right-rear sub-regions according to the position of target vehicle’s front bumper, and other conditions can be calculated in the same way.

Vehicle aggregation situation when target vehicle is located in the middle line.
To a better analyze drivers’ game-playing behavior under vehicle aggregation situations; the research scenario is defined in a three-lane scenario as an example. Figure 1 shows that, the most typical case is when the target car located in n1. With target vehicle n1, the interest-sensitive area is divided into the left-front, left-rear, front, rear, right-front, and right-rear sub-regions according to the position of target vehicle’s front bumper, and other conditions can be calculated in the same way.
In Fig. 1, the speeds of target vehicle n1, left-front vehicle n5, and right-front vehicle n6 are denoted v n i (i = 1, 2, 3, 4, 5, 6, 7), respectively. The relative distances between these vehicles and the target vehicle are denoted Δd2, Δd3, Δd4, Δd5, Δd6, and Δd7, and the relative velocities are Δv2 ≜ vn2 - vn1, Δv3 ≜ vn1 - vn3, Δv4 ≜ vn4 - vn1, Δv5 ≜ vn1 - vn5, Δv6 ≜ vn6 - vn1, and Δv7 ≜ vn1 - vn7. The vehicle types of the target vehicle and of the other vehicles are given as F1, F2, F3, F4, F5, F6, and F7, respectively, where F i ∈ {small, middle, l arg e}. The respective driver propensities are Q1, Q2, Q3, Q4, Q5, Q6, and Q7, where Q i ∈ {radical, common, conservative}, i = 1, 2, 3, 4, 5, 6, 7.
Mathematical description of vehicle aggregation situation
The vehicle aggregation situation exists over the entire traffic environment and changes with the dynamic variations of the transport elements. To facilitate research, the concept of “force” was borrowed from physics to describe the effects of the vehicles in each sub-region within the interest-sensitive area on the target vehicle’s lane-changing behavior. If a vehicle in a sub-region has a positive impact on the target vehicle in terms of choosing the lane in which the sub-region is located, that vehicle is considered to have applied attraction to the target vehicle; the converse effect is labeled repulsion.
The types of target and surrounding vehicles and the relative distances and speeds in the interest-sensitive area are comprehensively examined. The forces of vehicles in the left-front, left-rear, front, rear, right–front, and right-rear sub-regions of the target vehicle can be obtained using fuzzy logic (because of limitations in scope, the concept of fuzzy logic is not described further here). Effect size is used to describe the magnitude of force; the greatest repulsion effect size is represented by –1, whereas the greatest attraction effect size is represented by 1.
Therefore, for a vehicle in the middle lane such as n1, the force set
Analysis of lane selection game behavior
Drivers have two options—remain in lane or change lane—when driving on multi-lane roads. Considering the impact of the surrounding vehicle aggregation situation on his or her interest and security, a driver determines the vehicle’s optimal running lane based on the current state and other vehicles’ actions. The driver’s lane selection process is an interest (including safety, efficiency, time and space, comfort, etc.) pursuing process.
In a three-lane scenario in which a target vehicle, left-front vehicle, left-rear vehicle, front vehicle, rear vehicle, right-front vehicle, and right-rear vehicle are players (see Fig. 1), there are three pure strategies for the middle lane vehicle: No Change (NC), Change Left (CL), and Change Right (CR). There are two pure strategies for a left lane vehicle: No Change (NC), and Change Right (CR). There are two pure strategies for a right lane vehicle: No Change (NC), and Change Left (CL). Thus, vehicles involved in the game will have a pure strategy that is an element of Λ i = {NC, CL, CR}. In the process of selecting a driving strategy, each driver must not only choose their own policy decision variable space (keep lane or change lane) but also consider other drivers’ strategy selections; the strategy selections for the driver are therefore interdependent and mutuallyrestrained.
A driver’s benefits are related not only to the vehicle aggregation situation before and after the driver perform actions but also to the conflicts among vehicles. The driving revenue function of the driver can reflect traffic safety, travel time, and driving conflict benefits.
1) Calculation of traffic safety benefit
The traffic safety benefit (ΔP
i
) refers to the change in a target vehicle’s experienced integrated force P
i
(the weighted sum of forces from all of the vehicle’s sub-regions) before and after the driver performs an action. The vehicle aggregation situation of the target vehicle (the set of forces from sub-region vehicles applied to the target vehicle) when the target vehicle changes lanes can be obtained using the method in Section 2.1.2. The contributions of each sub-region force to the overall target vehicle integrated force differ; for example, when the target vehicle is in the left lane, the force contribution to the integrated force of the separated lane right-front vehicle is smaller than that of the adjacent lane right-front vehicle. For a target vehicle in the middle lane, the integrated force is
2) Calculation of travel time benefit
Contribution rates from different driver types within sub-region to the target vehicle integrated force
Contribution rates from different driver types within sub-region to the target vehicle integrated force
The travel time benefit (D
i
) can be enhanced by improving the front road traffic situation before and after each driver performs actions. This benefit can be represented by the difference in the values of cumulative force with two vehicles in front on a target vehicle before and after each driver performs actions. For the target vehicle n1, the cumulative force with two vehicle in front of before each driver performs actions is
3) Calculation of driving conflict benefit
The driving conflict benefit (C i ) is the conflict strength among vehicles during the drivers’ implementation of their strategy processes. Drivers have two strategies when they determine a travel lane: maintain or change lane (Fig. 2). When a driver takes a given strategy, vehicle conflicts will be increased or decreased. The more serious the conflict between vehicles, the more driving conflict benefit is lost; the more obvious the benefits of reducing conflict between vehicles, the more driving conflict benefit will be obtained.

Analysis of lane selection game behavior for three-lane game.

Schematic of vehicle conflict types.
By calculating the relative velocity, relative distance and the combined forces of the target vehicle and the surrounding vehicles, the severity of each type of conflict is judged. In Fig. 2, if vehicles n3 and n5, which are in different lanes, choose to change lanes (seize change lanes, as shown in Fig. 3(1)), the conflict between the two vehicles will be very serious and the driving conflict benefit will be reduced. If vehicle n3 changes lane and vehicle n5 maintains its lane (pressing change lane, as shown in Fig. 3(2)), the conflict between the two vehicles will be serious and the driving conflict benefit will be even lower; if the two vehicles choose to maintain their lanes (no conflict, as shown in Fig. 3(3), (6)), there will be no conflict between the two vehicles and the driving conflict benefit will be high. By contrast, if vehicle n3 changes lane and vehicle n1 maintains lane (keep escaping conflict, as shown in Fig. 3(4)), they can avoid conflict and the driving conflict benefit will improve; if two vehicles both choose to change lanes (change lane to avoid conflict, as shown in Fig. 3(5)), the driving conflict benefit will be even higher. If both n1 and n5, in the same lane, choose to change lanes (change lane conflict, as shown in Fig. 3(7)), the conflict between the two will be serious and driving conflict benefit will be low. If n1 changes lane and n5 maintains lane (change lane to avoid conflict, as shown in Fig. 3(8)), the two vehicles will avoid conflict and the driving conflict benefit will be high; if the two vehicles choose to maintain (keep conflict, as shown in Fig. 3(9)), the conflict between the two vehicles will be more serious, and driving conflict benefit will be moderate. The conflict benefit is assumed to fall in the range [0, 1], with increasing value equating to improve benefit. Different types of conflict that show the correspondence between semantic driving conflict benefit and triangular fuzzy numbers are listed in Table 2.
Correspondence between semantic driving conflict items and triangular fuzzy numbers
In the vehicle game, each vehicle has some conflict with others. Depending on the conflict types that may arise between two vehicles, a combination of various conflicts may arise in the vehicle game process, the respective driving conflict benefits of which can be calculated.
4) Driving benefit calculations
To facilitate a unified balance, the traffic safety benefit ΔP
i
, travel time benefit D
i
, and driving conflict benefit C
i
were converted to driving benefit W
i
as follows:
In Equation (1),
Different types drivers’ fuzzy weight of each benefit
A driver’s lane selection process is a multi-objective game process that takes into consideration many factors. The driving benefits for the multiple vehicles participating in a game need to be considered from the point of view of the three types of benefit listed above. The vehicle aggregation situation and strategy information elements are both associated with a certain degree of ambiguity and subjectivity that are difficult to describe by precise mathematical modeling. In addition, differences exist in terms of drivers’ propensities [15], leading to an interests and preferences structure with obvious conflicts. To address these issues, a mixed fuzzy many-person, multi-objective non-cooperative game based on drivers’ preference information is used to describe the behavior of the drivers’ lane selection game.
Model description
This article focuses on a mixed fuzzy many-person, multi-objective, non-cooperative game based on drivers’ preference information encoded as fuzzy objective weight vectors and fuzzy objective payoffs vectors [19]. The game can be represented by the mathematical model
Usually I represents a set of players; if there are N players, I = {n1, n2, ⋯ , n i , ⋯ , n N }. Each player(players are drivers of interest-sensitive area) n i (n i ∈ I) has its own set of strategies S i , S i = {s j i |j i ∈ Λ i } (Λ i is the index set of pure strategies). In each game, the set of strategies comprising all players’ strategies is called a situation; if s j i is the strategy of player i, then the set of strategies s = (s j 1 , s j 2 , ⋯ , s j N ) for N players is the situation. The overall set of situation S is represented by the Cartesian product of each player’s strategy set, i.e., S = s j 1 × s j 2 × ⋯ × s j N .
X i = {x i = (x j i |j i ∈ Λ i ) T |∑j i ∈Λ i x j i = 1, x j i ≥ 0} is a mixed strategy set of player n i (n i ∈ I), where x j i is the probability that the player selects the pure strategy s j i from the strategy set S i = {s j i |j i ∈ Λ i } and x i = (x j i |j i ∈ Λ i ) T is the mixed strategy of the player. Note that X = X1 × X2 × ⋯ × X i × ⋯ × X N ; when the mixed strategy x i ∈ X i is selected by player n i (n i ∈ I), the mixed strategy situation is x = (x1, x2, ⋯ , x N ) ∈ X.
As the driver does not know the objective weights of other players, she will assume that her own objective weight vector reflects the others’ to analyze the problem. In this case, each player n
i
(n
i
∈ I) uses synthetic weights for players ni′ (ni′ ∈ I) ‘s fuzzy payoffs based on her objective weight vector. Note the weighted game of player n
i
(n
i
∈ I) is
Where
are the fuzzy weighted payoffs of player ni′ (ni′ ∈ I) based on the representation of player n
i
(n
i
∈ I) in strategy situation x ∈ X.
The player n
i
(n
i
∈ I) can select a fuzzy ranking function f to clear game
The steps of the game solution are solved [1] as follows: Taking Solve for the maximum point
Using the above steps, player n
i
(n
i
∈ I) can get her desired solution, which is denoted as
However, each player selects a strategy and synthetic weighted game based on their own objective weight vector; therefore, the actual strategy situation should be
Owing to limitations in the experimental conditions, movement characteristic data could not be obtained in real-time; therefore, traffic data processed by the Next Generation Simulation (NGSIM) [1, 9] were used for model parameter calibration and verify cation. NGSIM is a research program conducted by the US Federal Highway Administration (FHWA), commercial microsimulation software developers, and the traffic microsimulation community that provides standard microscopic traffic packets collected by video detection for research use.
Identification of the driver’s propensity
Using the method in reference [14, 15], drivers’ real-time propensities were distinguished for online identification.
Data processing
Each record in NGSIM contains only a single vehicle data with one-time status information, so the information on surrounding vehicles and time-evolved status information must be obtained through a related query that follows the vehicle number and time information, after which the accumulated records must be combined. Vehicle type, relative distance, and relative speed between the target and surrounding vehicles can be obtained from video and document data, from which micro data to calculate the vehicle aggregation situation can also be obtained. The NGSIM preprocessing data are shown inTable 4.
Collected experimental data
Collected experimental data
Based on the reference values, parameters calibration and model verification of a lane selection model that correctly reflects the traffic flow characteristics can be completed through scientific analysis and processing of NGSIM data. Some calibration parameters are shown in Table 5.
Lane selection model parameter calibration
Lane selection model parameter calibration
v1, v2, v3, v4 and d1, d2, d3, d4 were the relative velocity and the relative distance between the target vehicle and the left-front, left-rear, front, rear vehicle.
To ensure the reliability of the simulation model, we needed to further validate the model with practical measured data. Comparative analysis between field survey data and simulation program results were carried out to determine whether the model could objectively reflect an actual road traffic situation.
Verification of lane selection model based on vehicle road test
Typical road sections of Zibo city were selected and road, traffic, and environmental condition data were collected to carry out a vehicle road test (test equipment is shown in Fig. 4). Different types of drivers and vehicle types were selected for experiments over different time periods and speeds. Using video monitoring, all experimental data were stored. Based on video monitoring, the drivers’ real-time lane changing behavior was predicted by the model and compared with the actual recorded behavior after the experiment. In this way, the validity and reliability of the model could be determined and the model parameters could be calibrated to develop a finalized drivers’ lane selection model. The results of vehicle road test as shown in Table 6.
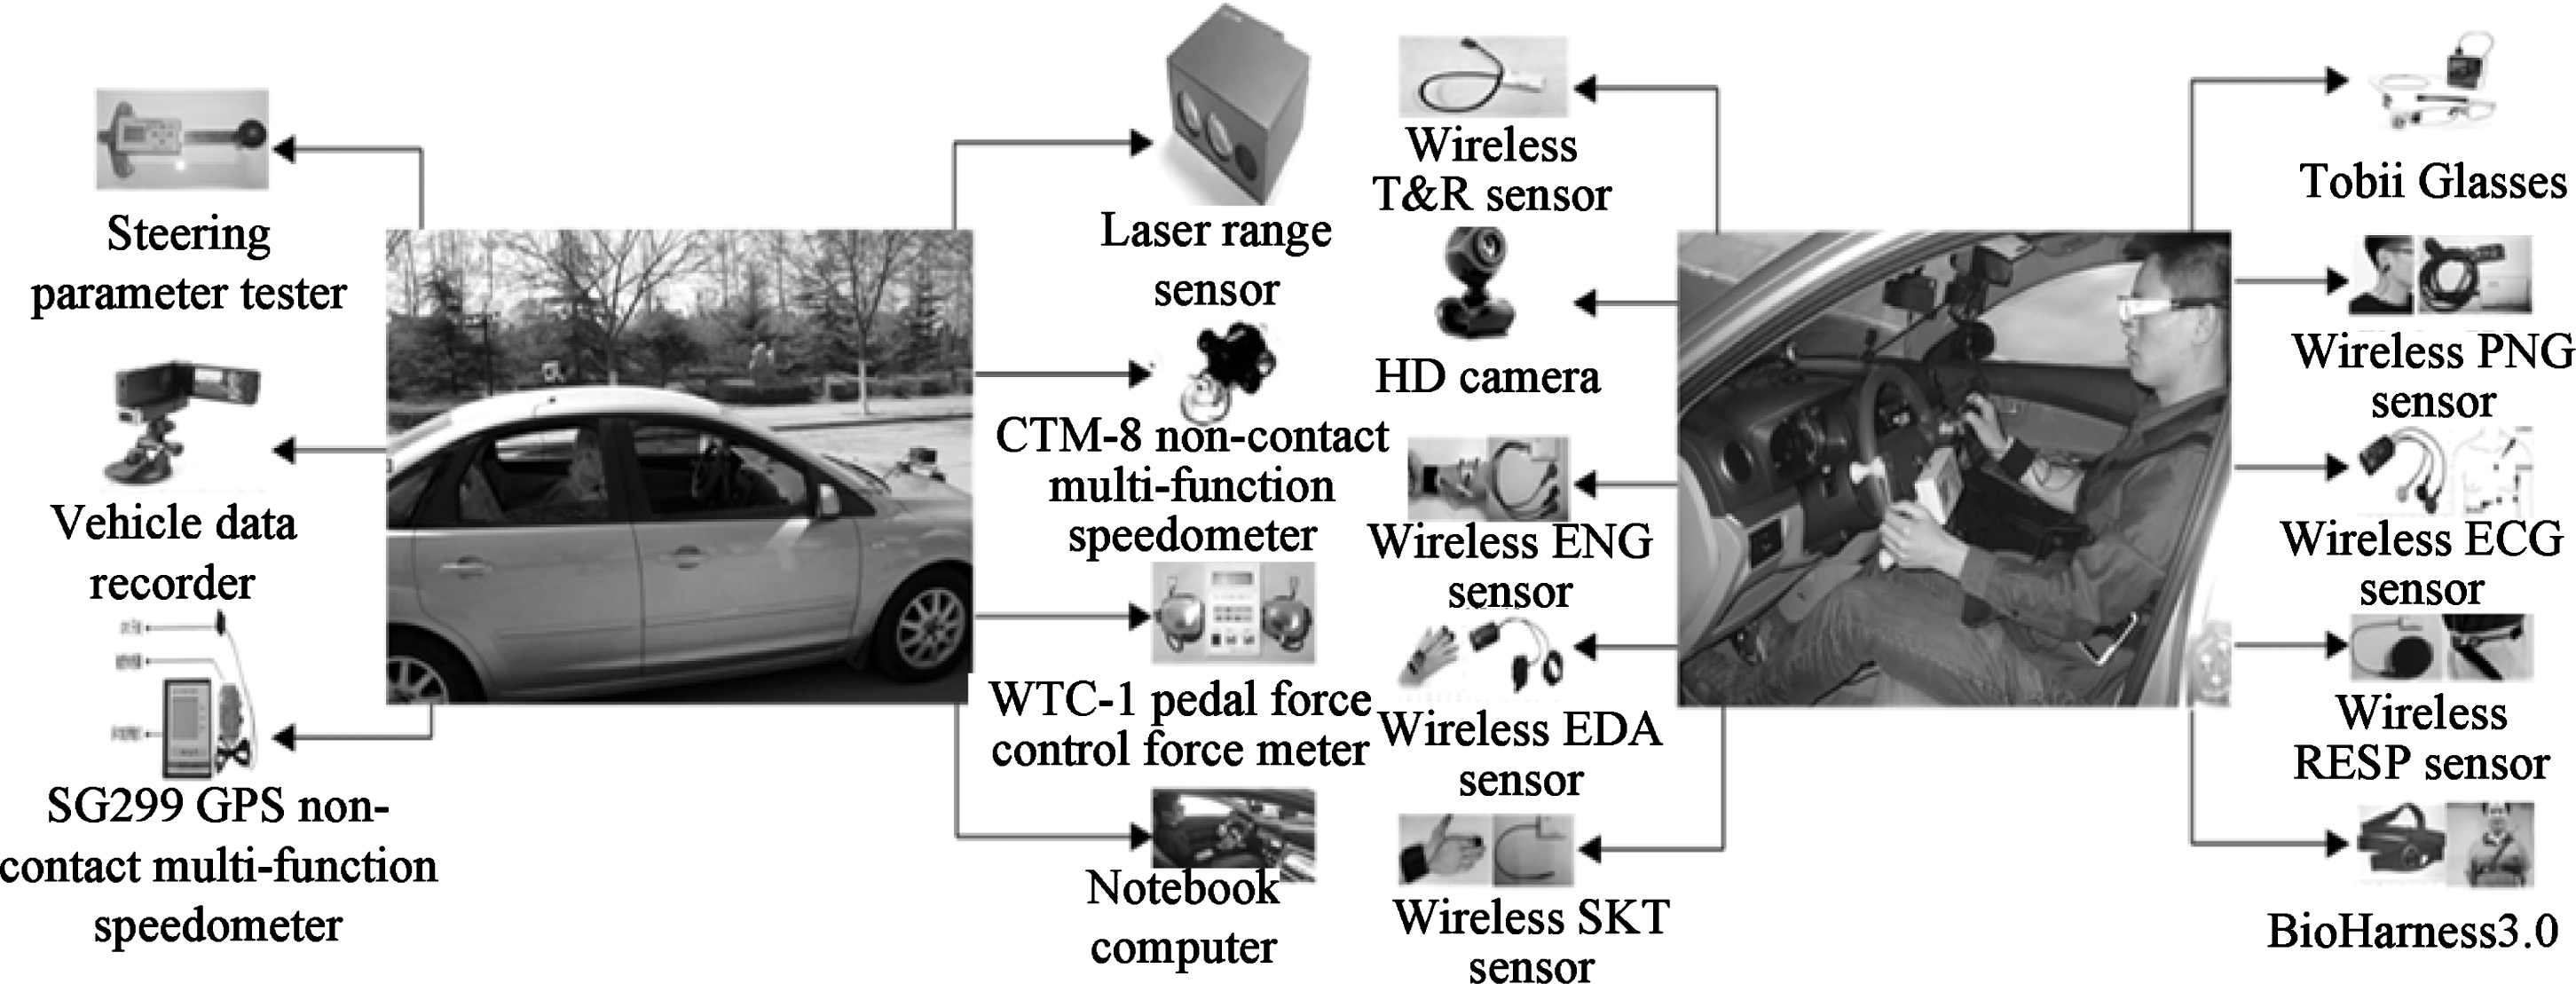
Dynamic human-vehicle-environment information acquisition systems.
Imitation results
We designed a variety of typical traffic scenes in a driving simulator using different types of driver to perform a driving simulation test in particular environments. The simulation experiments were carried out using a simulator made by the Japanese FORUM8 enterprise and employing the driving simulator software UC-Win road (shown in Fig. 5). Simulated three-lane driving scenarios were built up through experiments with urban roads simulated according to actual vehicle road tests in identical environments (in terms of road facilities, signals, traffic, etc.). Drivers were trained to use the simulator before the experiments were conducted and interference with them was avoided during the experimental process. Experimental data from video surveillance were stored. The resulting interactive parallel driving simulated experiments data were input to the lane selection model to obtain optimal game results for real-time computing. The simulation results are compared with actual lane selection results in Table 7.
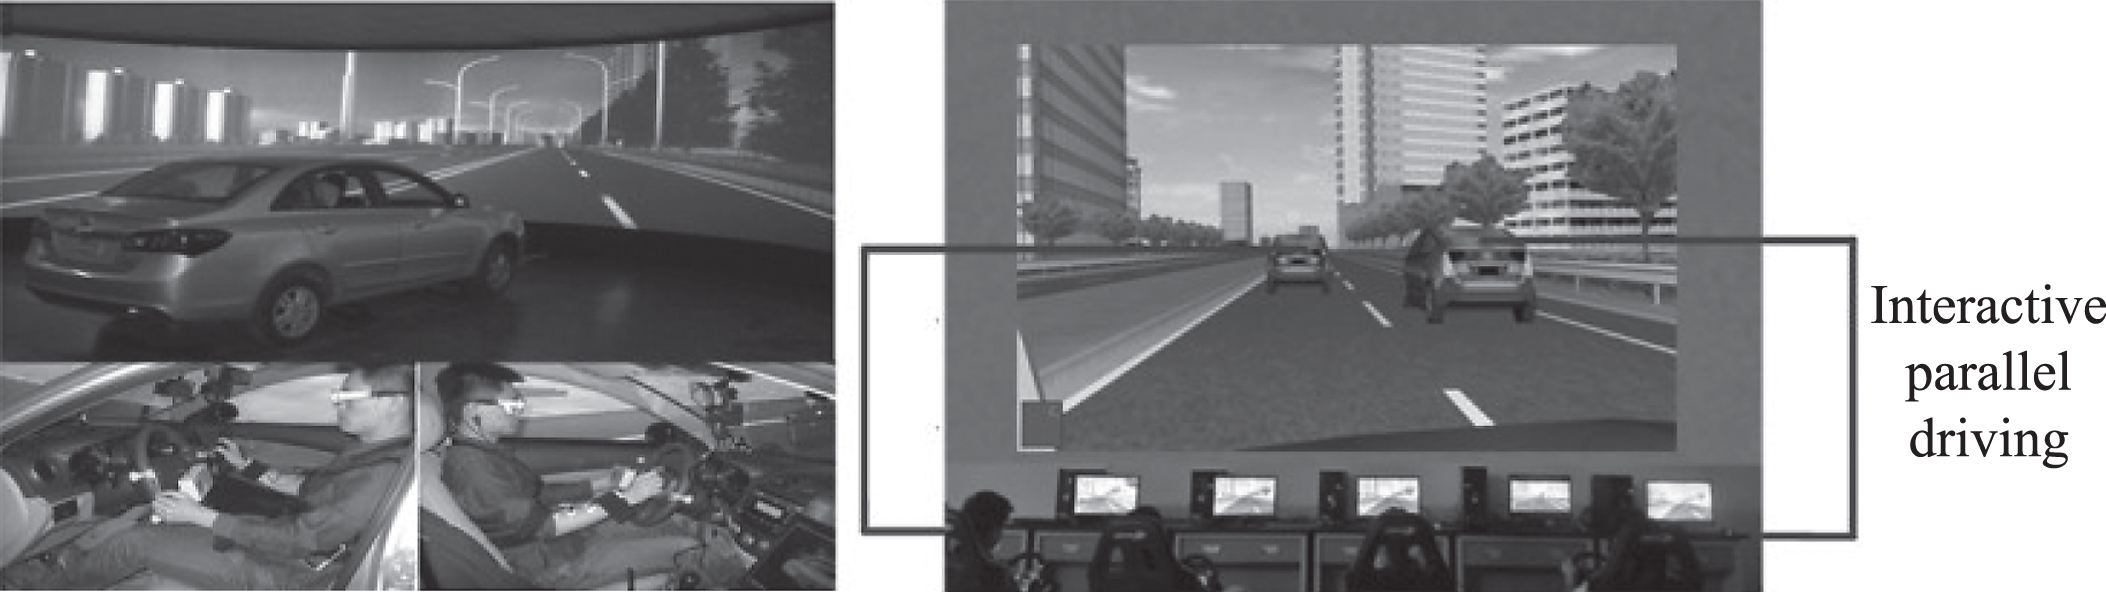
Interactive parallel driving simulated experiments.
Simulation results
According to above table, the prediction model established in this paper produces results that are highly compatible with recognition results.
Using the above road experiments, car-following and lane change decision models were built based on optimal control and fuzzy multi-objective decision theory, respectively. The drivers’ experimental data obtained in the experiments were input to micro-simulation models that used (simulation 1) and did not use (simulation 2) the lane selection game, and the macro- (such as flow rate, lane changing frequency, lane changing time, etc.) and micro-laws (such as speed, acceleration, displacement, etc.) of traffic flow in each simulation were compared with road test cases to understand the functioning of the lane selection model.
The lane change frequency, lane changing time, and lane utilization ratio were obtained for verification, the results of which are shown in Figs. 6 to 8. Figure 6 shows the lane changing frequency at various vehicle densities for various driver types. As mentioned, simulation 1 is the case that uses the driver’s lane selection game for real-time simulation, while simulation 2 does not.

Lane changing frequency simulation results for conservative, common, and radical driver types.
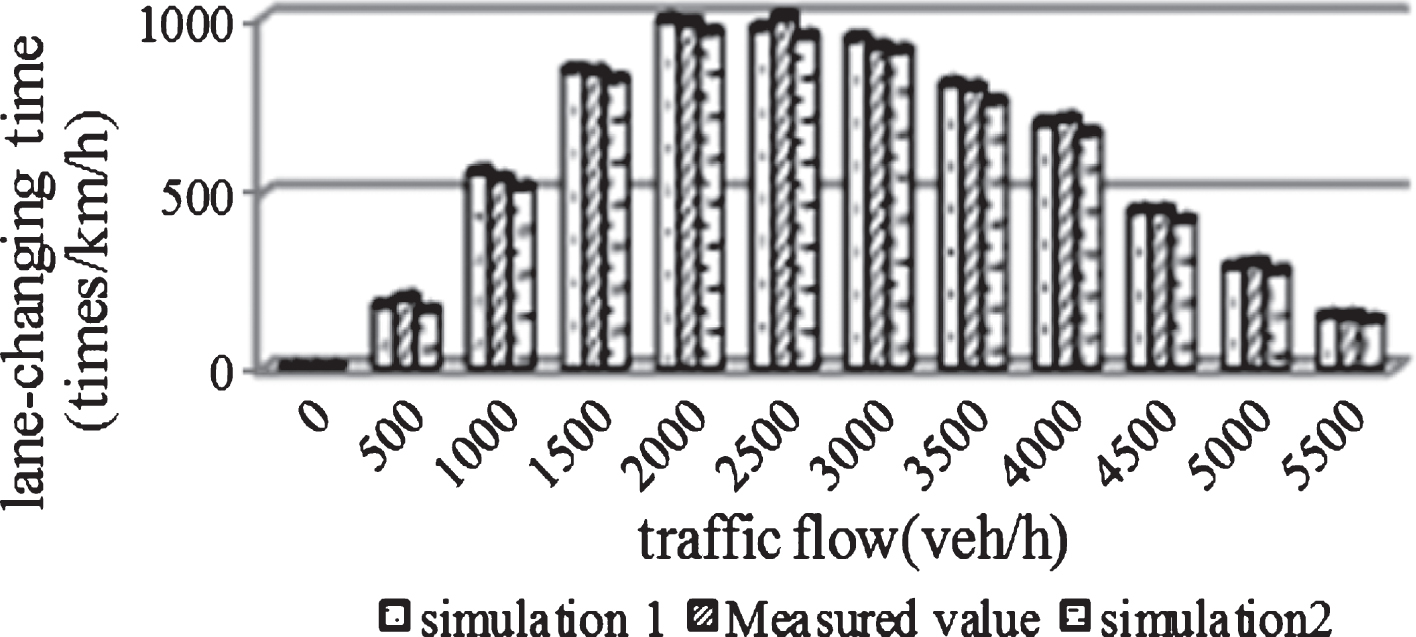
Lane-changing time comparison of simulation and actual measured values.

Lane utilization ratio comparison of simulation and actual measured values in left, middle, and right lanes.
The simulation results show that a driver’s (simulated) lane changing frequency can be enhanced by a certain degree using the dynamics of the driver lane selection game (simulation 1), and that, at a given density of vehicles, an aggressive driver’s lane changing frequency is higher than that of a conventional, which in turn is higher than that of a conservative driver.
The model was then used to conduct comparisons between simulated and actual measured lane-changing times and lane utilization ratios. Figure 7 shows the lane-changing times for different traffic flows under a three-lane scenario. Figure 8 shows the lane utilization ratio of each lane in a three-lane scenario. Again in this case, simulation 1 used the lane selection game for real-time simulation while simulation 2 did not.
The average speed, density, and delay were obtained as evaluation indicators for macro verification against experimentally measured data from Zibo city’s Beijing Road; a comparative analysis of simulation and measured values shows that the error is within an acceptable range (Table 8).
Comparative analysis of microscopic simulation results and experimental data
In this paper, the game playing behavior of drivers on basic urban expressway segments was analyzed through an integrated consideration of driver propensity and vehicle aggregation situations that impact driver decision-making behavior. By assessing drivers’ profits under different combinations of lane selection behavior, a drivers’ lane selection model based on a mixed fuzzy many-person, multi-objective, non-cooperative game was established. Analyzing the decision-making behavior of a driver by calculating the driver’s profits under different combinations of lane selection behavior, a Nash equilibrium was confirmed in a single game process and the drivers’ optimal lane selection behavior in a dynamic game was obtained. A reasonable simulation of drivers’ lane selection decision-making behavior on basic urban expressway segments was established. However, driver behavior simulation was limited to a three-lane scenario in the modeling process and related factors influencing the model were correspondingly simplified. To adapt to more complex traffic environments, the model needs to be extended to four or more lane scenarios and the game behavior of drivers in different road segments, such as intersections or ramps, needs to be considered. In addition, building a more rational model multiplayer game to ensure more secure and efficient parallel traffic will require the modeling of time-varying driving propensities, dynamic driver games, driver moods, and infectious driving behavior (such as dragracing).
Conflict of interests
The authors declare that there is no conflict of interest regarding the publication of this paper.
Footnotes
Acknowledgments
This study was supported by the State Key Laboratory of Automotive Safety and Energy under Project No. KF16232, the National Natural Science Foundation of China (Grant Nos. 61074140, 61573009, 51508315), Natural Science Foundation of Shandong Province (Grant No. ZR2014FM027), Social Science Planning Project of Shandong Province (Grant No. 14CGLJ27), and Project of Shandong Province Higher Educational Science and Technology Program (Grant No. J15LB07).