
Abstract
Plug-in hybrid electric vehicles (PHEVs) provide the flexibility to be used as pure electric vehicles in daily commuting, as well as common hybrid vehicles (HEVs) on longer trips. To appropriately distribute power between the engine and the energy buffer (normally battery) without sacrificing fuel economy, optimal control strategies of varies kinds have been proposed in recent years. Some strategies, however, cannot be applied in real time environment for the tightly independent on the future driving information. Some others could identify the different road condition but the identification accuracy is questionable, making their real-world effectiveness could suffer significantly. Moreover, the proposed energy management method seldom consider the effect from the driver behavior, which is an essential factor that can determine the vehicle energy consumption. For such reasons, this paper proposes a novel energy management strategy, the instantaneous optimization method—Equivalent Consumption Minimization Strategy (ECMS) is chosen as the foundation solution to the PHEV energy management problem. Then the paper studies the effect from different driver behavior and uses fuzzy logic method to identify different drive behavior. Combined with the pre-knowledge provide by Intelligent Transport System (ITS), the equivalent factor, which is the core of ECMS, is adjusted, making the real instantaneous application of ECMS. Then the simulation is performed to prove its viability and effectiveness.
Keywords
Introduction
In cities, plug-in hybrid electric vehicles (PHEVs) can be an emerging new mean of transportation, which combines the merits of pure electric vehicles (EVs) and hybrid electric vehicles (HEVs). PHEVs typically have long pure electric and combined driving mileage, good equivalent fuel economy, and most importantly, the ability to be used as pure electric vehicle (PEV) in daily commuting, and as HEV on occasional longer trips [1–4].
In the research of PHEVs, there are a number of challenging issues. Among them, energy management is one of the key problems [5–32]. The control strategy problem can be summarized as follows:
How to fulfill tractive power demand with the best possible fuel economy.
How to keep the battery state of charge (SOC) in a certain range during the charge sustaining (CS) stage, while at the same time ensuring that the PHEV has the ability to follow driving power requirements under different driving conditions.
To tackle these issues, great amounts of work has been done in the past 20 years by researchers from all over the world. Among the mass of research, three types of control method are favored: the control strategy based on heuristic knowledge, i.e. rule based control and fuzzy logic control; the control strategy based on numerical optimization, i.e. dynamic programming (DP); the control strategy based on analytical optimization, i.e. the Pontryagin’s minimum principle (PMP) [5–20]. Regarding control strategies based on heuristic knowledge, some rule based control strategies have been proposed in [5–7], and several fuzzy-logic control strategies are adopted in [8–10]. The control strategies based on heuristic knowledge are relatively simple and typically feature fast real-time calculation. However, they mainly base on expert experience, which means they are not robust against diverse and changing driving conditions. Regarding control strategies based on numerical optimization, some optimal control methods like DP have seen application in [11–14]. Although optimal control theories like DP provide global optimization, they require information in advance about the driving cycle, which means they are also less adapted to diverse and changing driving conditions. Regarding control strategies based on analytical optimization, some researchers chose PMP theory to perform the control with acceptable amounts of calculation and hypothesis [15–20]. The PMP, nevertheless, is a global optimal solution as well, which is why its effectiveness is also largely affected by the actual driving conditions. To eliminate the limit by the requirement of driving condition, some researchers bring the Equivalent Consumption Minimization Strategy (ECMS) into application [21–23]. The ECMS make the global optimization problem into instantaneous calculation. The ECMS, however, cannot fully break away from the dependence on the pre-knowledge about the future road condition for the equivalent factor in ECMS relies on the future driving behavior [24, 25]. Based on former research about the PHEV control strategies, some researchers try to eliminate unfavorable influence of actual road condition by taking the characteristic features of typical drive cycles into account when designing the control strategy for PHEV. In [26–34], the road condition is appropriately considered by investigating the characteristic features of different driving cycles using statistic method. Then the vehicle control unit (VCU) identifies the actual road condition using the characteristic features of different driving cycle, and performs the corresponding optimal control with regards to that specific road condition. This method, in certain degree, can solve the influence on the energy management of PHEV from the changing future road condition. However, this method fully depends on the studying into the typical drive cycles which cannot reveal the actual road condition.
The driver behavior that can influence the vehicle driving safety and fuel consumption has been studied in recent years [35–38]. The drivers with different behavior tend to drive the vehicle in different ways, causing the fuel consumption be various. To be specific, drivers who prefer to drive the vehicle in sport style may require the vehicle can response the driving requirement fast, leading to more fuel be consumed. The drivers in moderate driving, on the contrary, prefer to drive the vehicle in mild method do not require the vehicle fast response the driving requirement, saving the fuel in some degree. To the PHEVs that is driven by two power sources, the driver behavior can also be a vital factor that determines the fuel consumption. Hence, it is suggested that study different driver behavior and distribute the power between the engine and the battery in PHEV accordingly.
Together with the evolution of Global Position System (GPS), Geographic Information System (GIS), the Intelligent Transport System (ITS) becomes mature, making the future driving information can be provided in detail, and previous limit on the energy management by solved with novel methods. In this paper, the ECMS is applied as the solution to the PHEV energy management problem. According to the different future driving information acquisition level and different driving behavior, a multi-level equivalent factor adjustment method is proposed, contributing to the accurate ECMS implantation.
The remainder of the paper is organized as follows. The next section deals with the model of the PHEV. In Section 3, different driver behaviors are identified by fuzzy logic with the aid from multivariate statistical analysis method. In Section 4, the ECMS and multi-level adjustment method for equivalent factor is discussed. In Section 5, the effectiveness of the proposed adjustable ECMS is analyzed and evaluated through Matlab/Simulink simulations.
PHEV model
The PHEV studied in this paper is the parallel type. Schematic diagram of a typical parallel PHEV is shown in Fig. 1.
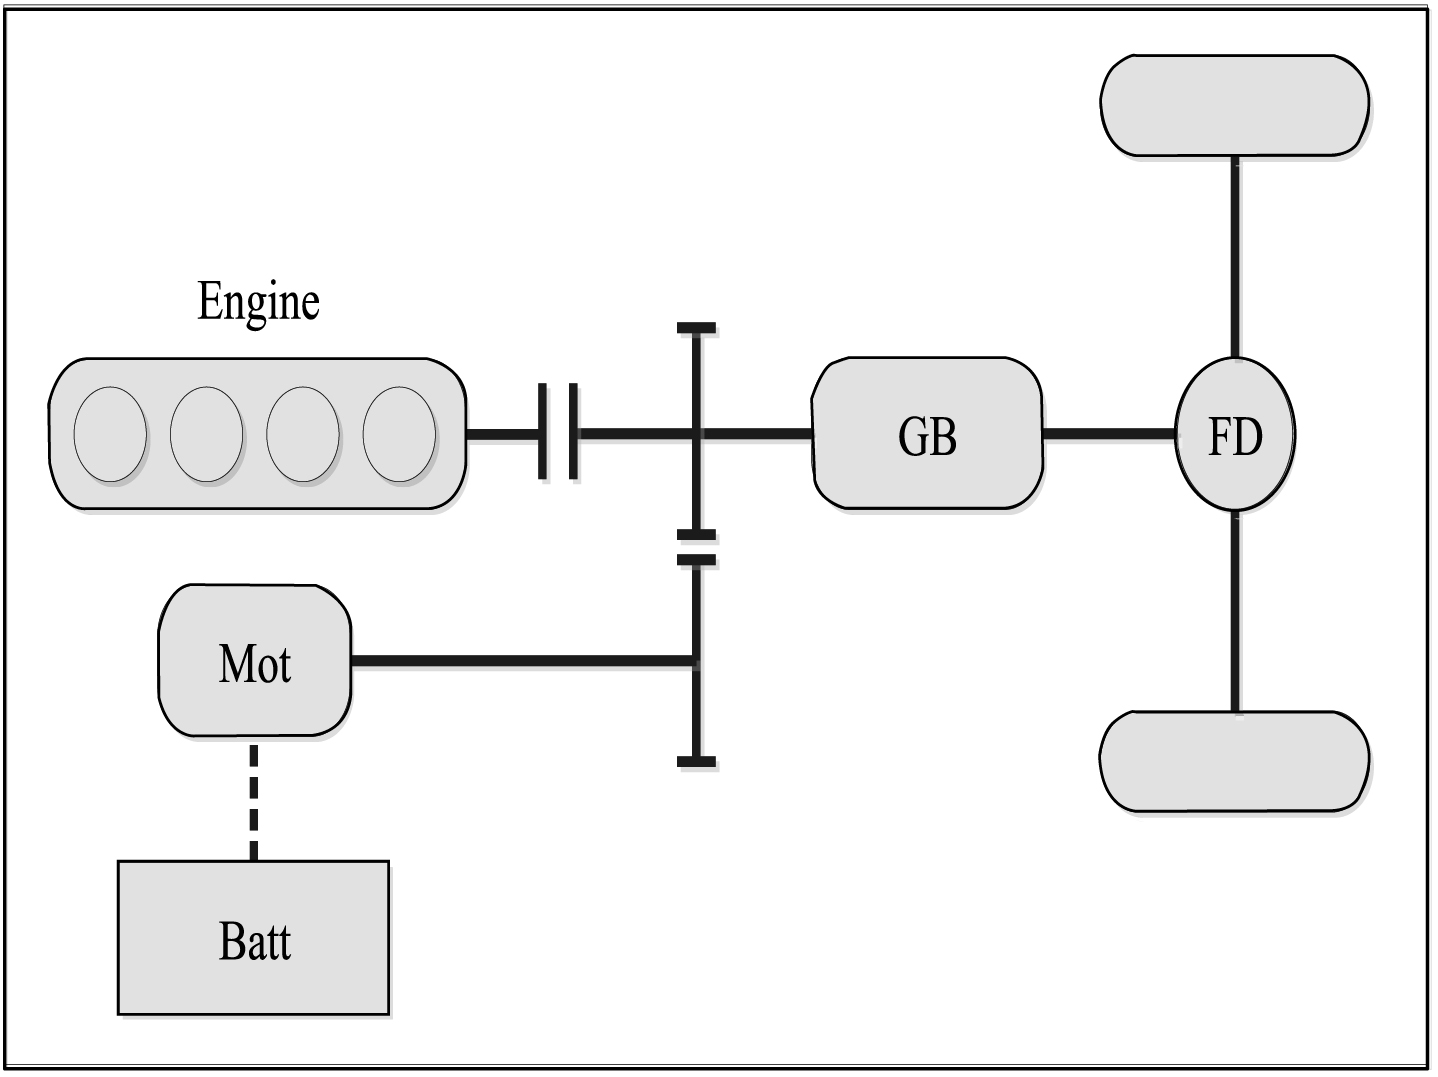
Schematic diagram of a typical PHEV.
In the parallel PHEV, both engine and motor can drive the vehicle alone. Meanwhile, the engine can drive the motor in generating mode to charge the battery. The engine is model by the Willans line approach:
The motor power P
mot
can be expressed by the battery power P
batt
and the electric machine efficiency η
em
, which is shown in Equation 3.
The battery is modeled as an open circuit voltage source. The battery power can be written as:
The battery state of charge (SOC) is an important parameter to reveal the battery state, which is expressed as:
In previous research about the driver behavior, the self-reported questionnaire is an ideal tool to investigate driver’s behavior [35–38]. In this paper, we also design a self-reported questionnaire to comprehend the different driving style, which is shown in Table 1. In this self-reported questionnaire, the maximum value and minimum value of each item is 5 and 1, respectively.
The self-reported questionnaire
The self-reported questionnaire
30 different drivers finish the self-reported questionnaire, and then we made the factor analysis and cluster analysis. According to the analysis result, the driving style can be divided into three kind: Sport, normal and gentle. Drivers with sport driving style tend to drive the vehicle as fast as possible, drivers with normal sport driving style tend to drive the vehicle with most common way without initiatively driving fast but easy to be affected by the environment, drivers with gentle method tend to drive the vehicle in most mild method. The gentle drivers do not volunteer to drive fast and is not easily be affected by the environment. After finishing the driving style analysis, we design the driving style recognizer by using the fuzzy logic method. The input of the fuzzy logic recognizer are the ratio that accelerating pedal larger than 50% in the sampling period (that is 10 seconds) and the ratio that decelerating pedal larger than 50% in sampling period (that is also 10 seconds). The output of the fuzzy logic recognizer are the three different driving styles. The fuzzy logic rule table is shown in Table 2.
The fuzzy logic rules
In Table 2, A1 and A2 represents the two inputs, respectively; SPORT, NORMAL, GENTLE are three driving styles. PS, PM, PB means the positive small, positive medium, positive big, respectively. The membership function of the fuzzy logic can be witten as:
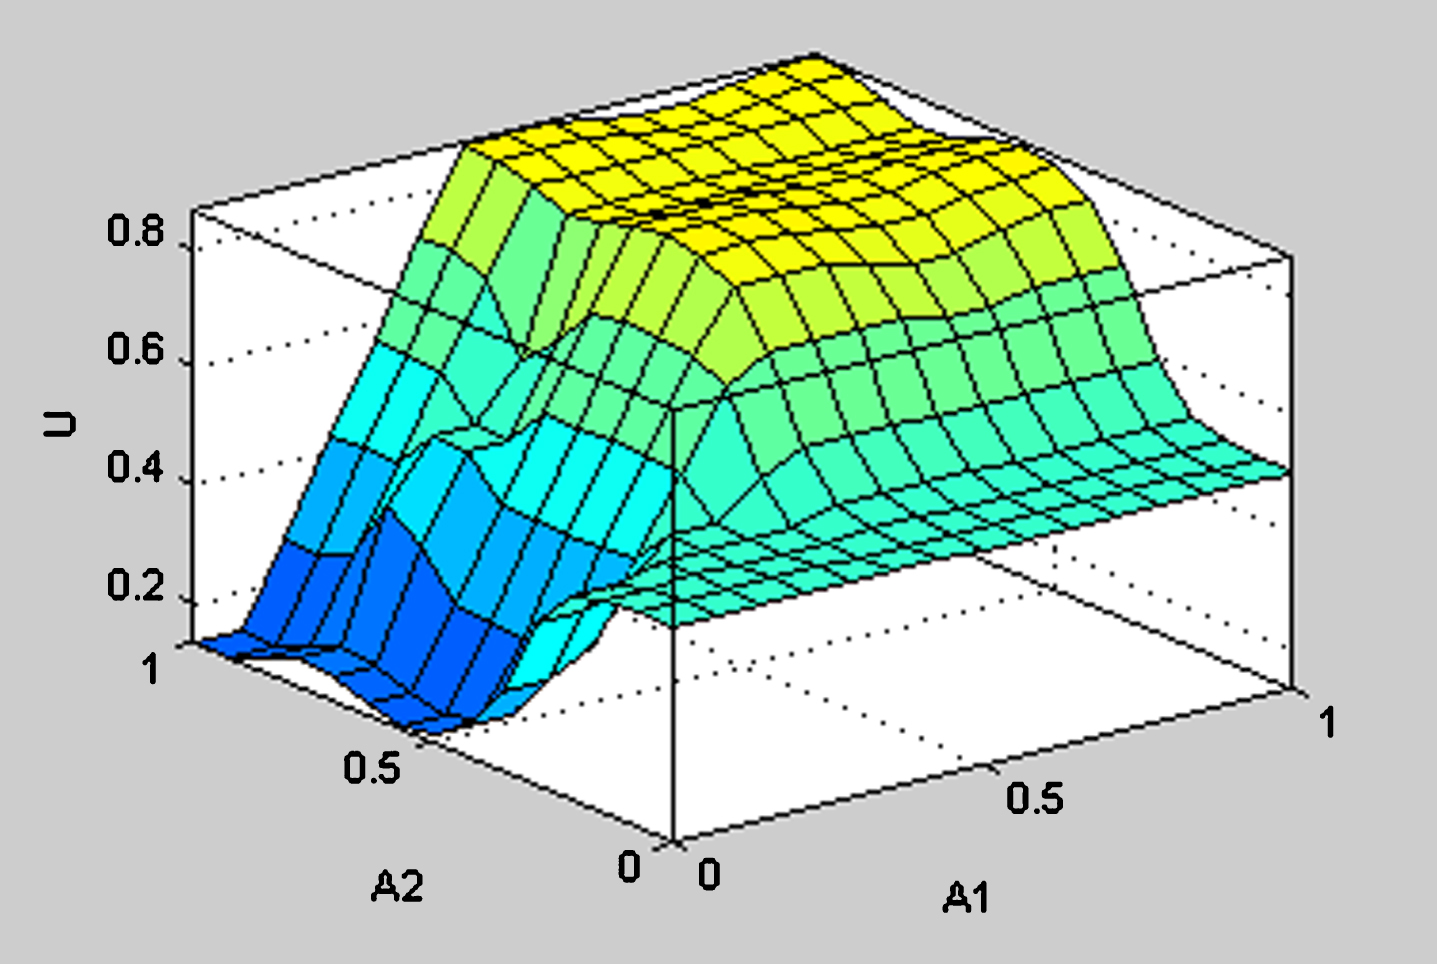
Fuzzy logic deduction results.
How to distribute power between engine and battery is the main control problem for PHEV. There are many optimized objectives: fuel consumption, emission, drivability, etc. Mathematically, the problem can be formulated as follows with the fuel consumption taken as the optimized goal:
Where J is the performance index, L (x
k
, u
k
) is the cost function, x
k
is the state variable, u
k
is the control variable. The objective is global, in the sense that the quantity to be minimized is the integral over the whole trip. To ensure the integrity of the control process, some integral constrains should be taken into consideration:
The Equivalent Consumption Minimization Strategy (ECMS) is seen as an ideal method which successfully bring the global optimization problem into the real-time application. In this section, the promising ECMS approach is presented. Factor that determines the ECMS application in large degree is discussed, proposing a multi-level ECMS solution to govern the energy flow with reducing the fuel consumption as much as possible. The basic ECMS
In the ECMS, the performance index J can be expressed as:
Generally speaking, the principle underlying the ECMS is to assign a cost to electric energy, making the consumed electric energy equivalent to certain quantity of fuel by introducing the equivalent factor. The EMCS denotes that any consumption of electric energy should be charged in the future by the fuel. In real application, the future consuming fuel for charging is assumed to be current equivalent fuel consumption by using the equivalent factor to evaluate the power distribution. Meanwhile, when ECMS is applied in HEV the equivalent factor is set as constant value for the battery SOC change in HEV is quite small. In PHEV, however, the battery SOC can fluctuate significantly with more electric energy can be consumed, leading the equivalent cannot be constant value any longer. Therefore, the equivalent factor is the variable which is related to future energy consumption. To make accurate ECMS application in PHEV energy management, the equivalent factor value should be carefully adjusted. The adjustment of equivalent factor
With the development of Global Position System (GPS), Geographic Information System (GIS) and sensor technology, Intelligent Transport System (ITS) plays more and more important role in traffic administration. As a result, vehicle’s future driving information can be known in advance, providing the possibility to guide the energy management to be more efficient. According to the different developing stage and the application limit of the upper technology, there are three different levels of acquisition the future information: Level 1: No future information is available. This level information acquisition commonly happens when vehicle driving in faraway rural road, where map information and other future driving information cannot be access to. Level 2: Parts future information is available. This level information acquisition commonly happens when vehicle driving in the road where travel distance, future terrain profile can be provided while the future driving velocity cannot by gained due to lack of traffic sensor and blocked communication. Level 3: Full trip information is available. Thanks to the combined performance of the GPS, GIS, traffic sensor, and the wireless communication, the travel distance, knowledge of future terrain profile and the future velocity can be predicted.
Based on different future driving information acquisition level, the equivalent factor related to future energy consumption can be adjusted, respectively. No future information
The chosen driving cycle
Without future information, the equivalent factor cannot be adjusted quite accurately. In this condition, the road condition identification method is applied. Vehicle’s future energy consumption is considered to be connected with different road condition (for example, urban versus highway). Accordingly, it is can be reasonable that assigning a certain equivalent factor value for ECMS application when vehicle in urban driving while valuing another equivalent factor value when vehicle is driving on the highway. The core of this method is the road condition identification. In this paper, the Learning Vector Quantization (LVQ) network is applied to identify different road condition. Normally, an LVQ network consists of the input layer, the hidden layer (also is called the competitive layer), and the output layer (also is called the linear layer). The schematic of the LVQ network can be seen in Fig. 3. The successful road condition identification by LVQ is based on the training LVQ network with reasonable training matrix. To training the LVQ, the standard driving cycle data is used.
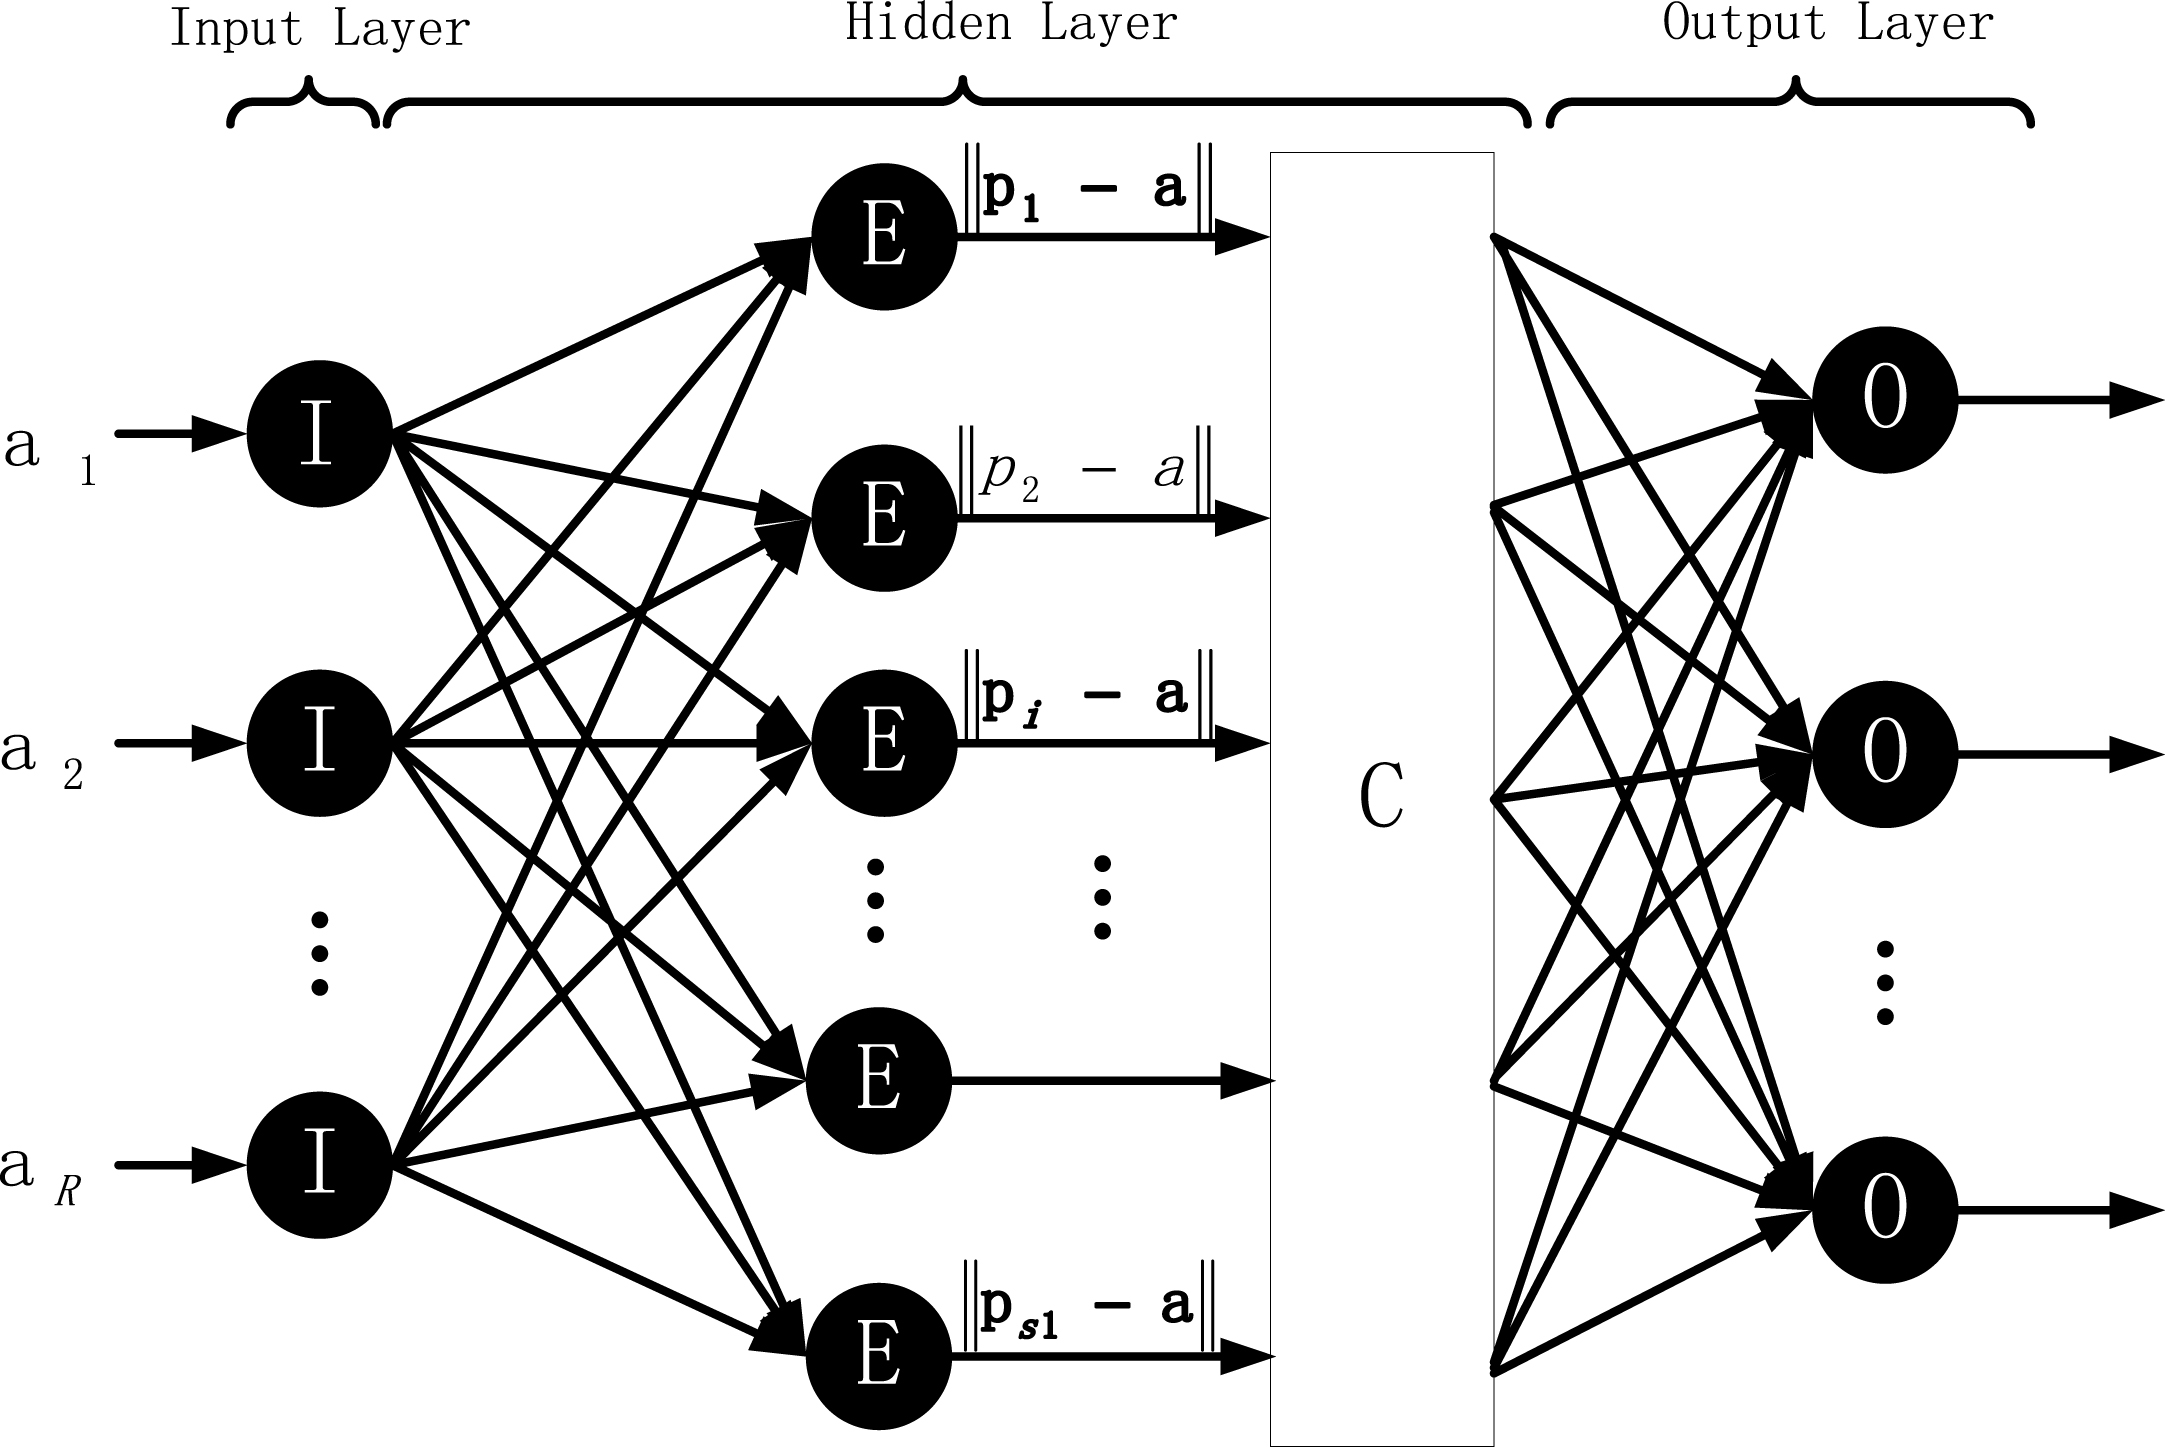
Schematic of LVQ.
Road conditions can be classified into three types: traffic jam, urban drive, highway drive. The traffic jam type mainly represents vehicles driving in downtown areas where the traffic situation is poor and requires vehicles to start and stop frequently. The vehicle speed in traffic jam is very low. The urban drive type mainly represents vehicles driving in the city arterial road. In this type, the vehicle speed is normal although there are some crossroads. The highway drive type mainly reflect vehicle driving in highways with a relatively high speed. To form the training matrix, standard driving cycles who can represent the upper three driving conditions are picked up, the characteristic parameters of the driving standard cycle are extracted. After some study, the following driving cycles in Table 1 are chosen to extract the characteristic parameters.
The speed curve of chosen driving cycles are shown in Fig. 4. In this study, 24 characteristic parameters are chosen. When calculating the characteristic parameter values, previous researches divided the driving cycles into segments based on equal time interval or distance interval. These methods may be easy to implement, but the data matrix can be small which can result in the driving condition identifier being less accurate. In this study, the driving cycles are divided into small segments combined with time interval method and distance interval method, which is illustrated in Fig. 5. Considering former researches [28–34], the time interval is chosen to be one-eighths of total operating time (the red sections in Fig. 5), while the distance interval is chosen to be one-sixth of the total distance (the green sections in Fig. 5). When training the LVQ network, the training data acquired form a [24*6] matrix. In this way, the data used to train LVQ network can be relatively large which is favored in training.
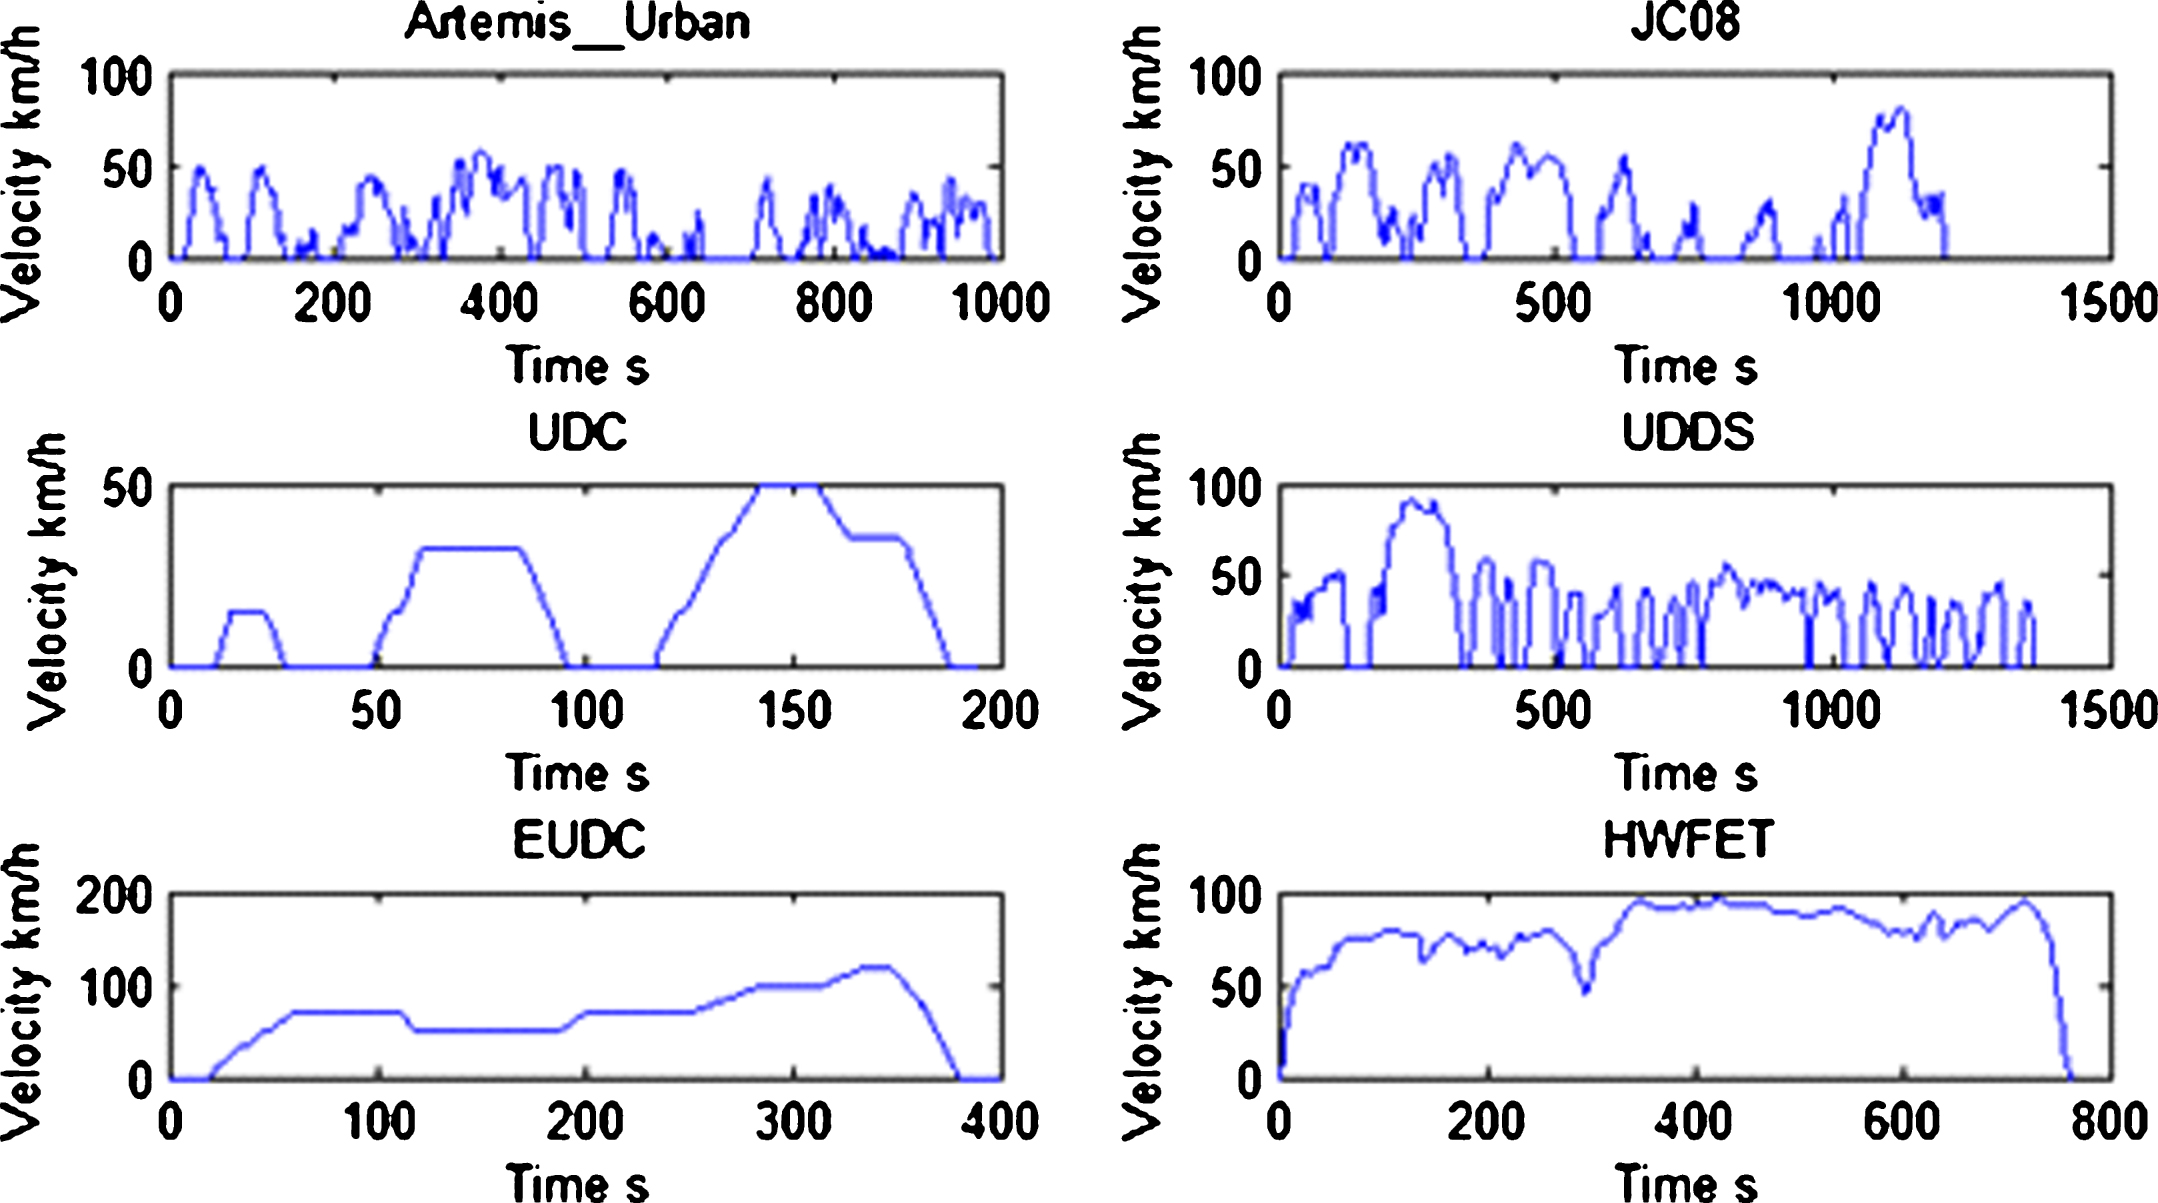
Speed curve of chosen driving cycles.
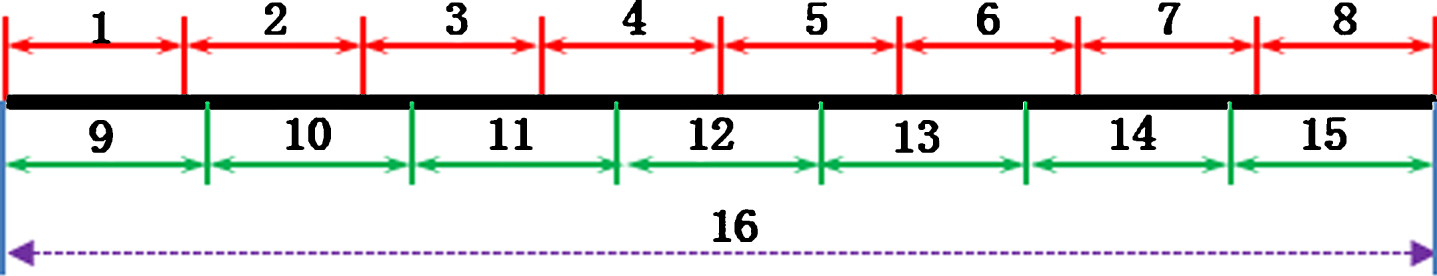
Illustration of driving cycle dividing method.
The classification process inside the LVQ network mainly includes two stages. First, a certain number of vectors are put in and the hidden layer identifies the input vectors. Secondly, the output layer output the target classes. The identification process in the hidden layer can be described as follows: Neurons (represented by E in Fig. 3) in the hidden layer evaluate the Euclidean distance between the input vector a, and the possible subclass vector p, and finally the closest subclass to the input vector is valued 1, other subclasses 0.
After identifying different road condition, the equivalent factor can be assigned. In different road condition, the equivalent factor values are listed in Table 4.
Equivalent factor in different road condition
In Table 4, s
dis
and s
cha
is the equivalent factor for discharge and charge, respectively. Parts future information available
This level of future information acquisition lacks of the instantaneous future velocity. To solve the problem, local history traffic data is employed to estimate the future velocity and travel time. Once the future velocity, travel time, the future required energy can be acquired by the following equations:
In the level 2, the reasonable adjustment of equivalent factor is determined by the estimation future velocity. In city public traffic system like WisTransPortal [39], the history data like traffic density, traffic flow, average speed of each main roads in one day’s different time is all stored. When we using the history data to obtain the future travel velocity profile, the procedure can be: Defining the departure time and travel path by the help of GPS and GIS. Obtaining the average travel speed for each road segment of the whole travel path. Obtaining travel time in for each road segment based on the acquired average speed and road segment length provided by the GPS and GIS. Full future information available
In this level, both the history data and instantaneous information can be provided, making it possible to predict the future velocity profile. To predict the travel velocity, the most mature macroscopic traffic flow model—Light-Whitham model is applied. The macroscopic model tries to describe the traffic flow by the macroscopic values like average density, average velocity. The macroscopic model reveals the overall characteristics of the traffic flow which sees the traffic flow as the continuum compressible fluid.
In the Light-Whitham model, the traffic density and traffic average velocity satisfy the continuum fluid mechanics equation:
where ρ is the traffic density, v is the traffic average velocity, x is the sampling location. To the average traffic velocity, it is assumed that:
Therefore, the Equation 18 can be rewritten as:
The Equation 20 reflects the spread of traffic wave. To make the distribution of traffic wave be continuum, the Equation 20 can be expressed as:
where D is constant value. Based on the Equation 21, the free flow velocity v
e
of the traffic flow can be expressed as:
After obtained the instantaneous future velocity prediction, the future required energy can be calculated by using the Equation 13. Similarly, the equivalent factor can be adjusted by Equations 14∼17.
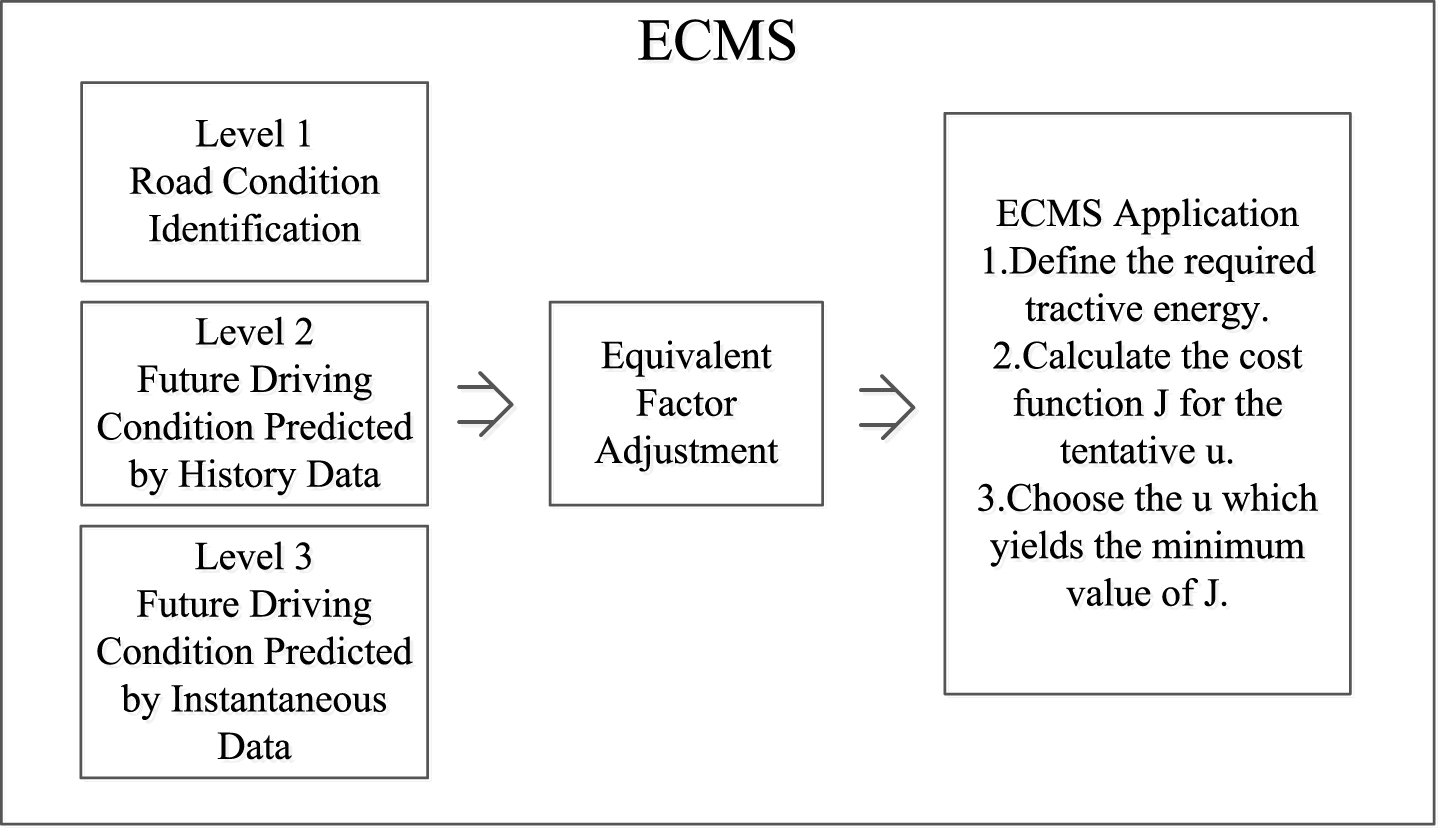
Process of multi-level ECMS application.
Based on the multi-level ECMS, the energy management problem aims at saving fuel in PHEV can be solved more rational, the process of multi-level ECMS application can be illustrated in Fig. 6. In this paper, the control variable u is the power split ration between engine and battery.
To prove the effectiveness of the proposed control strategy, Matlab/Simulink simulation is performed. The simulation study can be divided into two parts, one is the simulation analysis about ECMS application with the level 1 equivalent factor adjustment, the other part is about the ECMS application with the level 2 and level 3 equivalent factor adjustment. The parameters of the vehicle is shown in Table 5. In the simulation part 1, the simulation is operated in a specific driving cycle formed by combining UDDS and HWFET cycle. In simulation part 2, the simulation is operated in the driving cycle provided by ITS. As the level 2 and level 3 equivalent factor adjustment method is the same in origin, so the effect of the level 2 equivalent factor adjustment method is simulated in this paper.
Parameters of the PHEV
Parameters of the PHEV
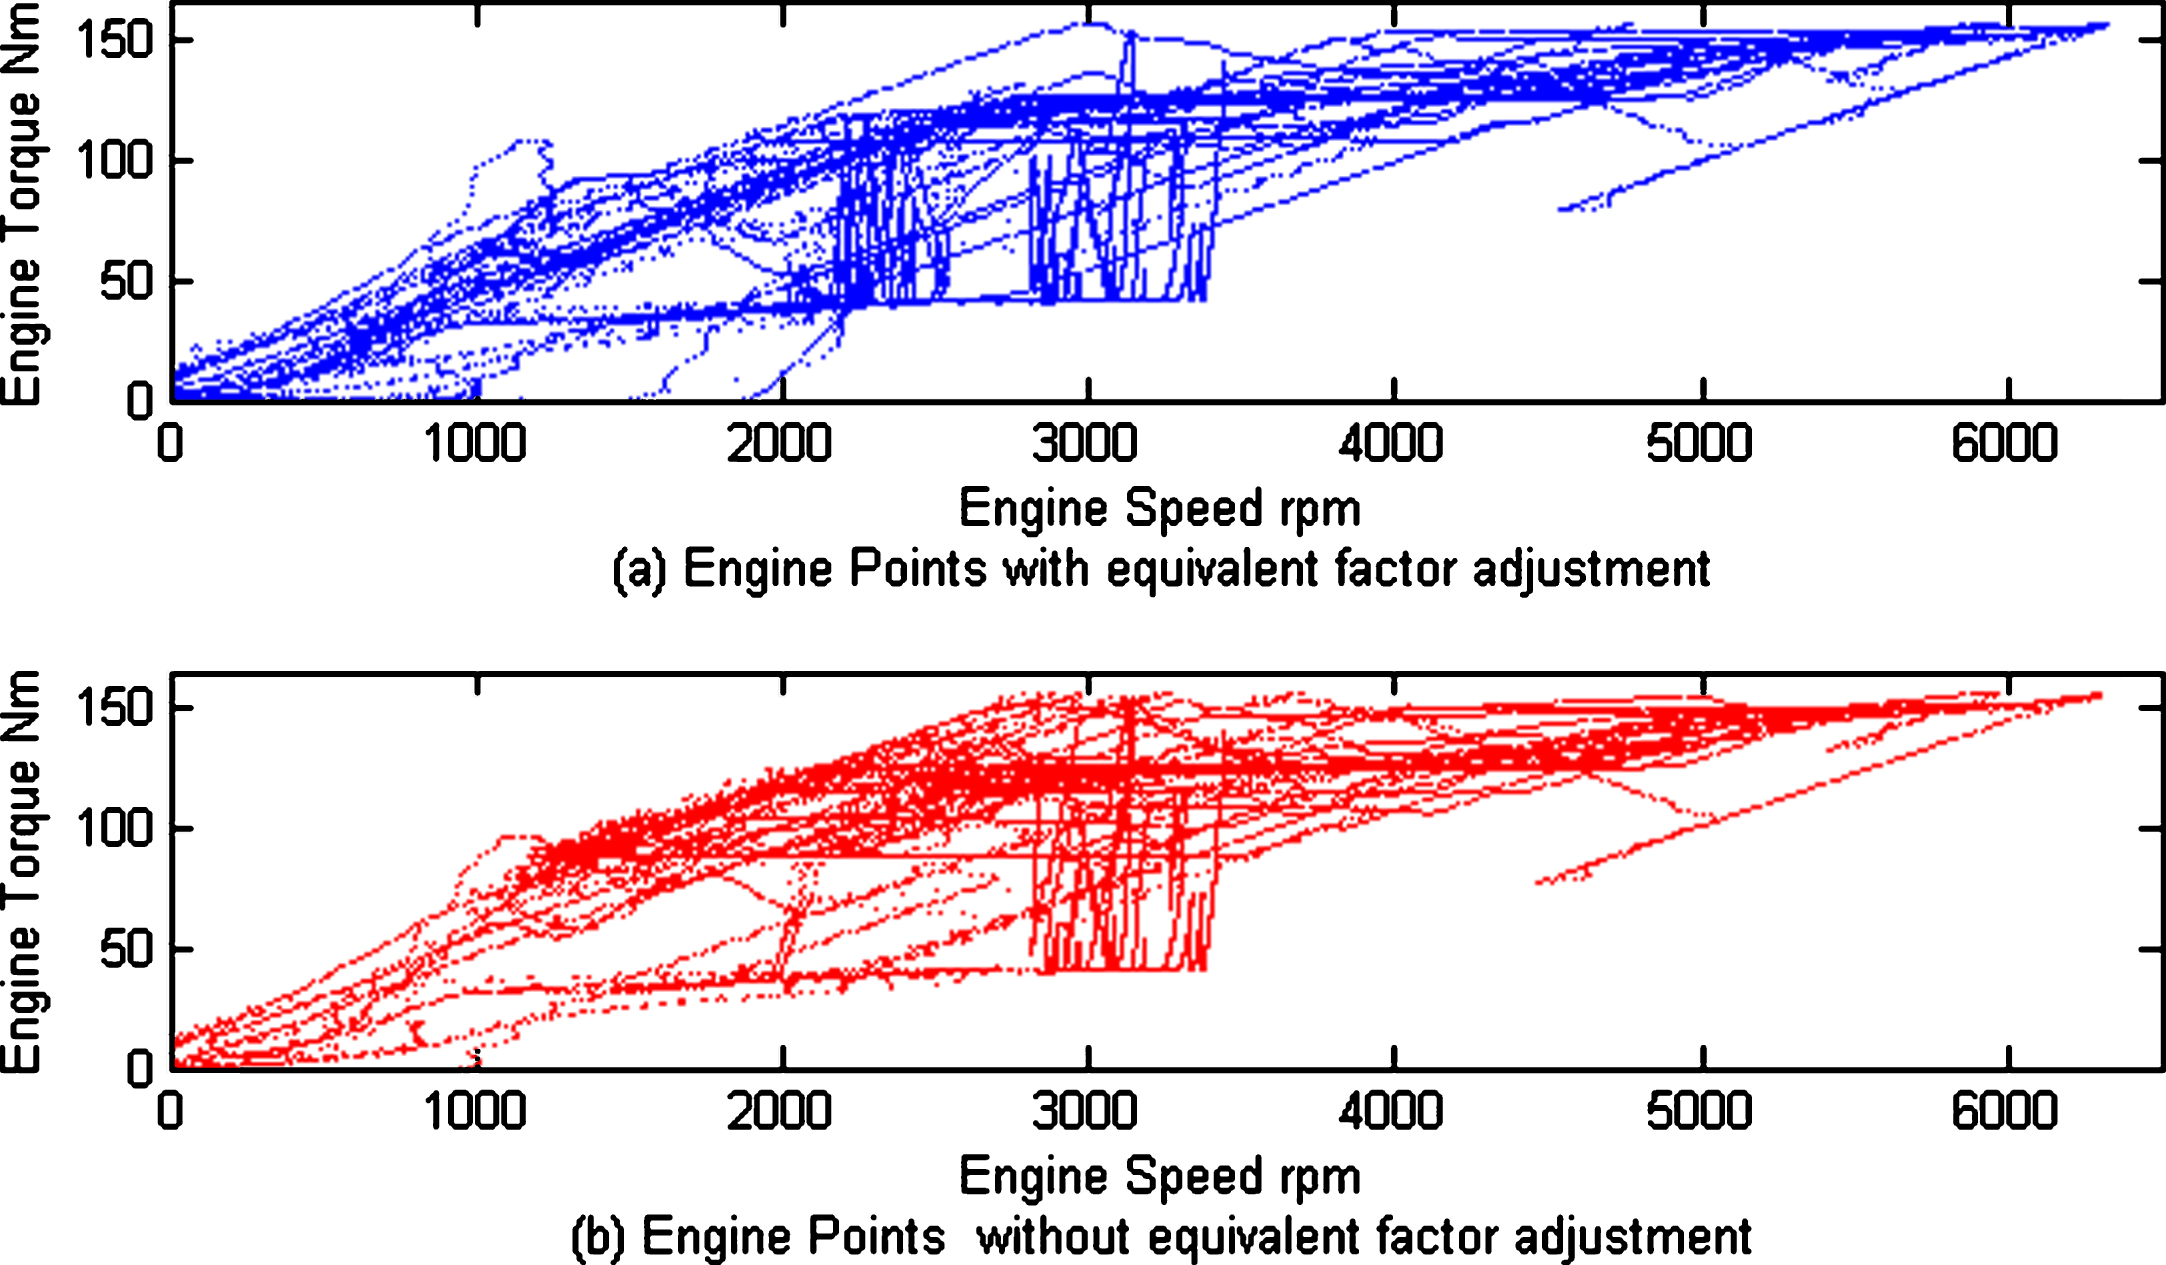
Figure 7 shows the speed curve of combined driving cycle, in which 0∼1369 s simulates the urban road condition and 1370 s∼2135 s simulates the highway driving. According to the SOC curve in Fig. 8, the battery SOC changes in CS stage by the ECMS with equivalent factor adjustment would be keep in more stable range than that by the ECMS without equivalent factor adjustment. Figure 9, the engine operating points by the ECMS with equivalent factor adjustment would be more concentrated around the BSFC line than that by the ECMS without equivalent factor adjustment, meaning that the ECMS with equivalent factor can make the engine operate in high efficiency fields as much as possible which is good for saving fuel. Figure 10 illustrates the predicted speed curve which is acquired by the history date stored in the local ITS. Figure 11 illustrates the SOC change by the ECMS with and without equivalent factor adjustment. The SOC with equivalent factor adjustment is kept stable in urban drive while decrease in highway justifying that the battery has to output energy to drive the vehicle together with the engine in CS stage when the requited tractive power is quite high and normally be kept in sustaining stage in CS stage. Figure 12 reveals the engine operating points by the ECMS with and without equivalent factor adjustment. It is clearly that engine operating points are also more concentrated around the BSFC curve, making the engine operate in the high efficiency fields more than that by ECMS without equivalent factor adjustment. Table 6 provides the fuel consumption by ECMS with and without equivalent factor adjustment. According to the simulation results, PHEV with adjustable ECMS would possessed lower fuel consumption than that with un-adjustable ECMS. Moreover, the equivalent factor adjustment effect by the future driving behavior prediction is better than that by road condition identifying. From these results, we can tell that the ECMS with equivalent factor adjustment would bring more reasonable management effect, saving more fuel.

The specific driving cycle in simulation part 1.
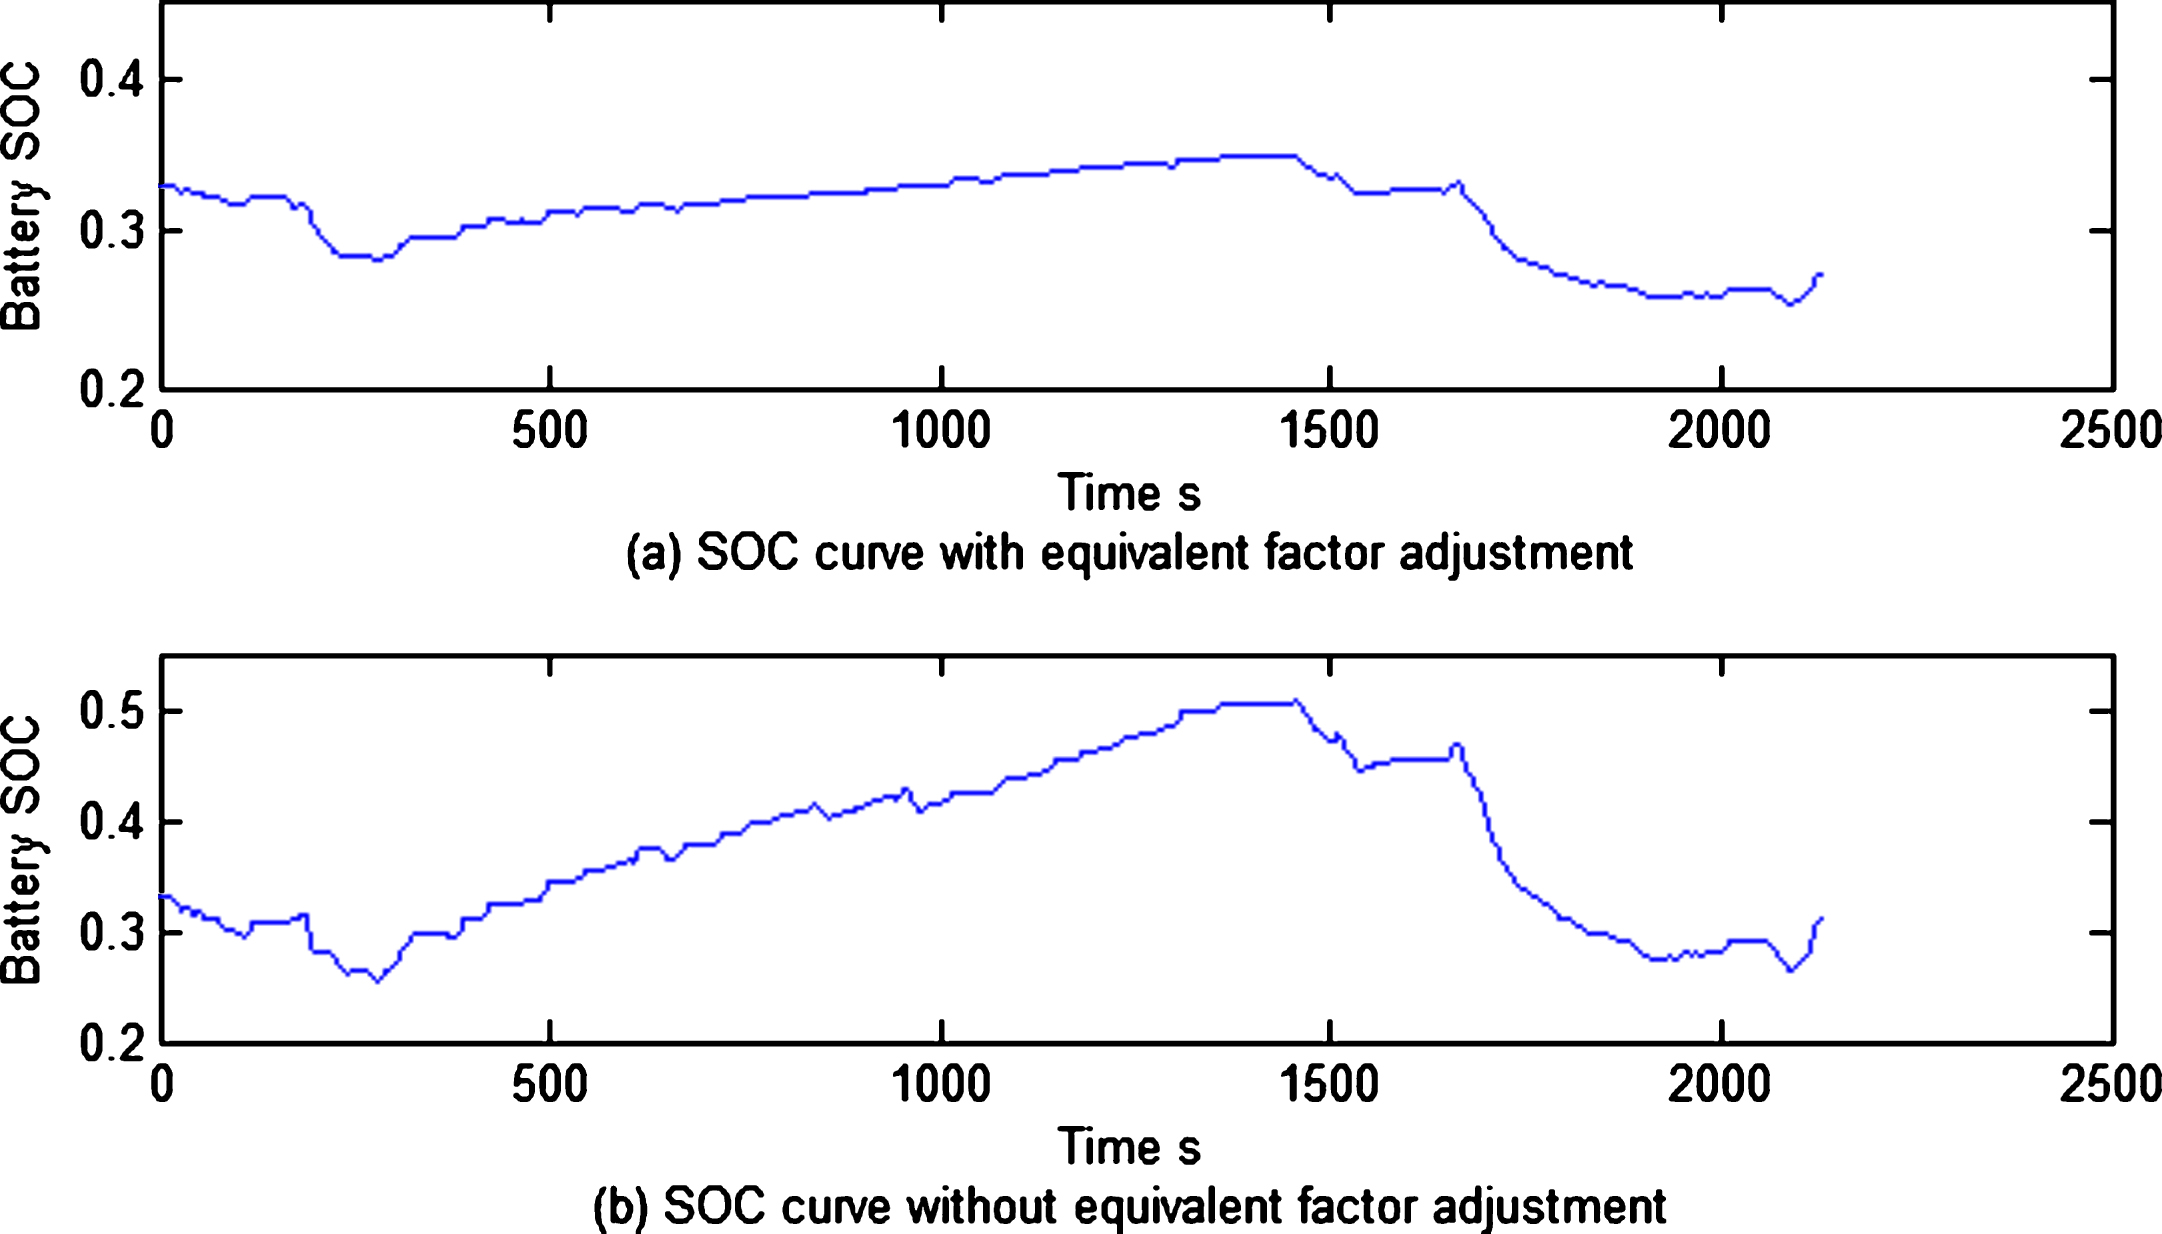
The SOC curve in simulation part 1.

The engine operating points in simulation part 1.

The speed curve provide by ITS in simulation part 2.
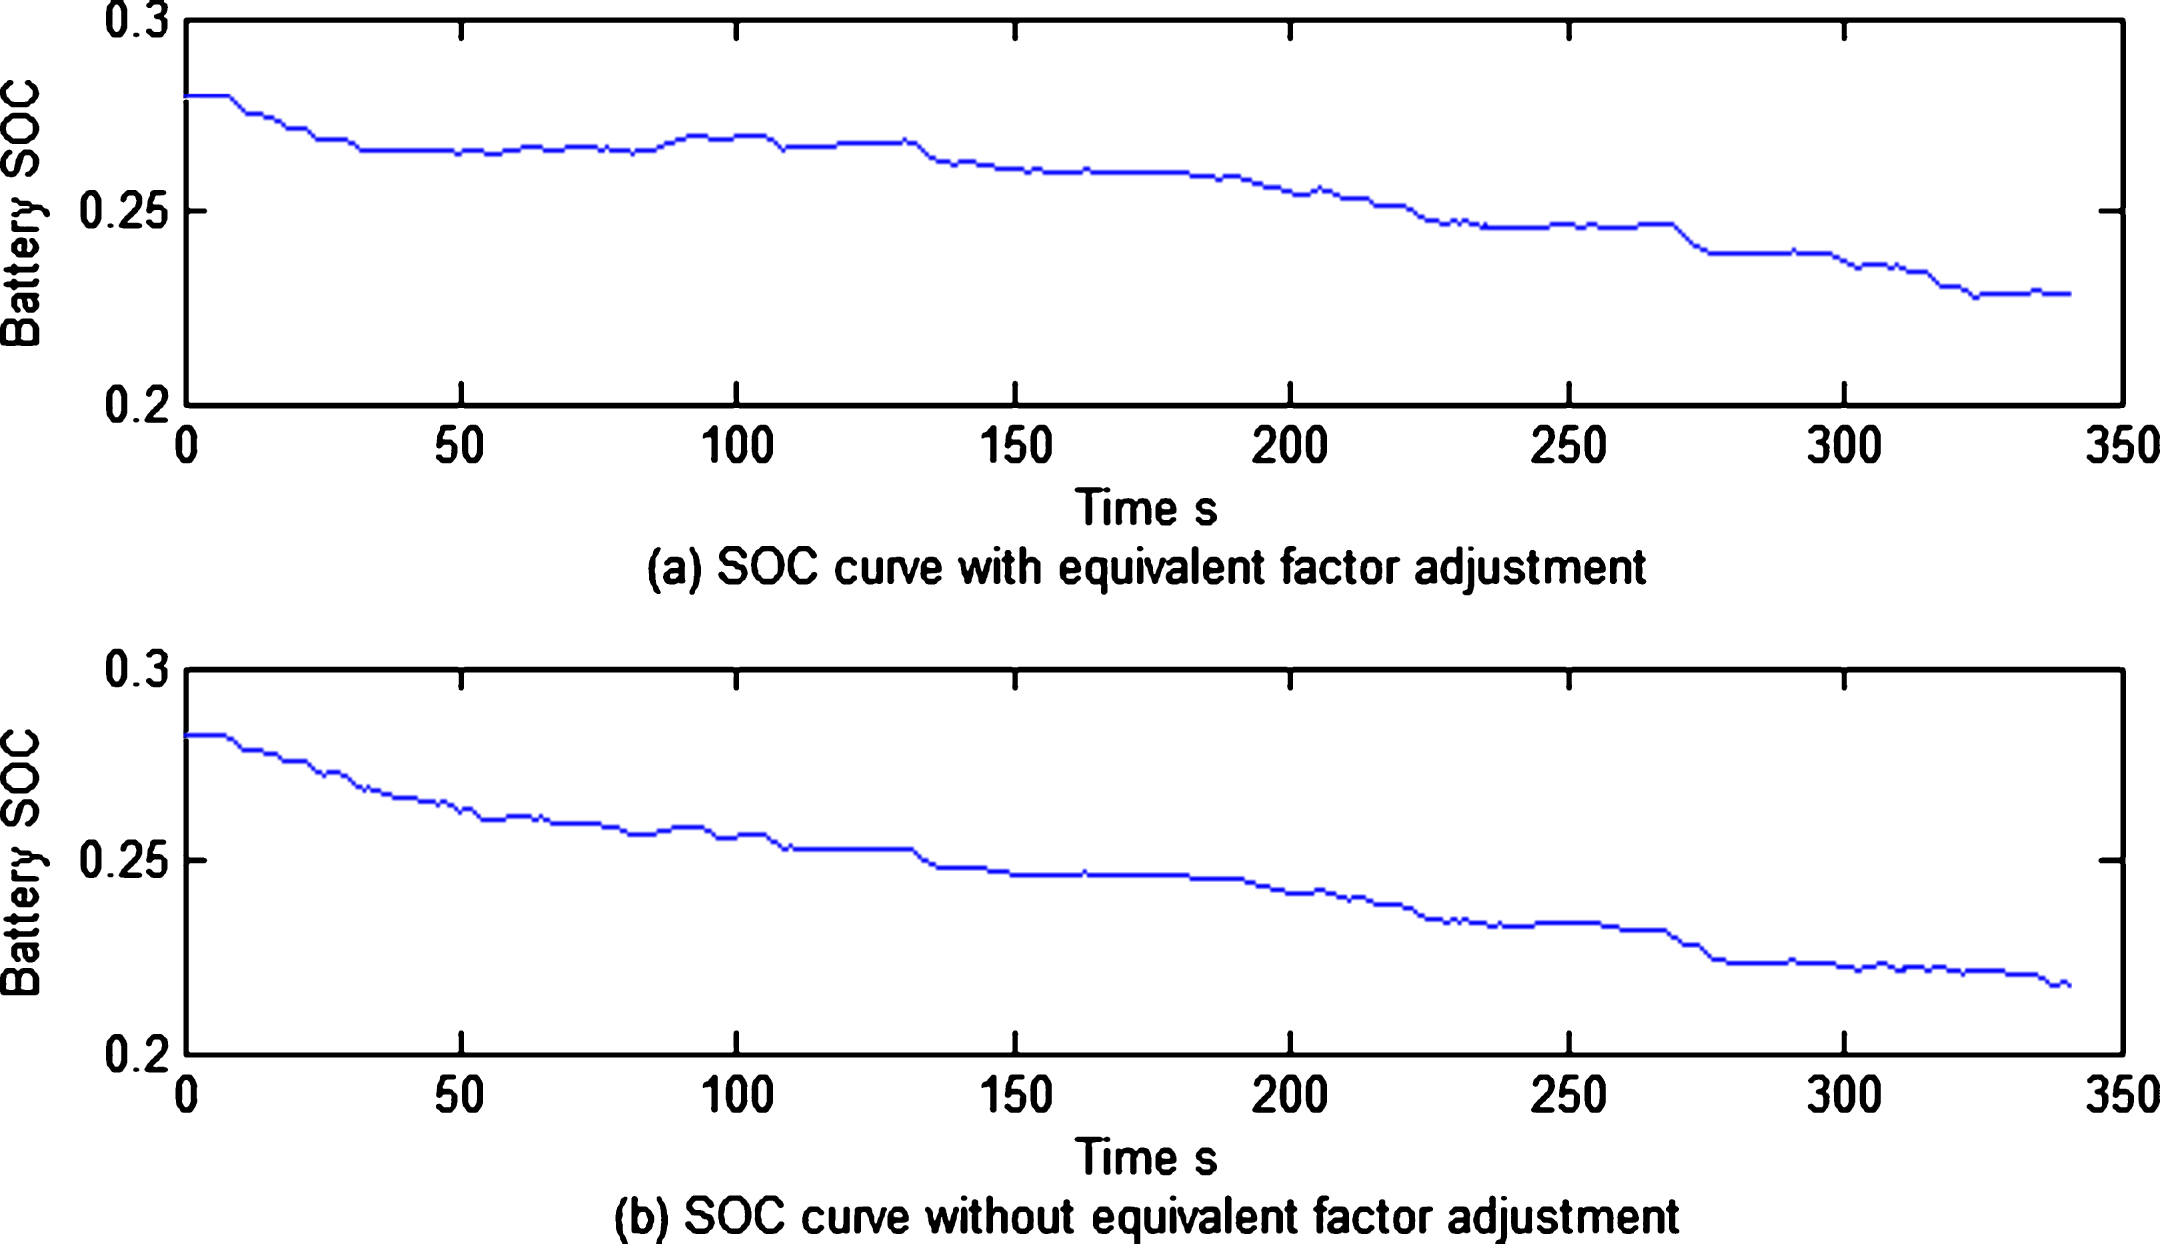
The SOC curve in simulation part 2.
The engine operating point in simulation part 2.
The comparison of fuel consumption
This paper proposes using the ECMS to be the solution of the PHEV energy management problem. And according to different level of information acquisition, the equivalent factor in ECMS can be adjusted accordingly.
The ECMS is seen as an ideal method to deal with the PHEV energy management problem for its instantaneous application feature. In ECMS, the equivalent factor is the core whose value can change frequently. Based on the analysis, the equivalent factor value is related to the future vehicle behavior. Therefore, the equivalent factor should be adjusted accordingly. Thanks to the development of ITS, the acquisition difficulty of the future travel information is decreasing. According to the different level of information, the equivalent factor is adjusted.
The simulation results show that the vehicle with adjustable ECMS holds more ideal performance than that without adjustable equivalent factor.
As an indication for future work, the future information acquisition would be researched deeply, the elements that can influence the equivalent factor value would also be studied.