
Abstract
With the progress in science and technology, many types of electrical equipment have been invented, making the use of electricity more extensive, and living environment more comfortable. However, in modern times, every country stresses the need to promote green energy in order to reduce environmental damage, while the Taiwanese government made an attempt to adjust electricity price as a means to make Taiwan people to reduce carbon emissions and pollution on the planet. Therefore, the paper takes electricity price on the power consumption of Taiwan people as the research object, observes tariff adjustment trends of relevant government departments, and builds Taiwan’s average electricity consumption and the average price forecast model to provide references to government and researchers. Firstly, we gather data of electricity consumption and price from Taiwan Power Company’s website, and draw a trend chart to explore the relationship between the two; and respectively work out technical indicators of average electric quantity and electricity prices by referring to stock technical indicators; finally, we compare Neural Network parameters optimized by Grey Fruit Fly Optimization Algorithm (GFOA) to build average power consumption and average electricity price forecasting models, and compare the best prediction model with other three algorithms. The study results demonstrate that the electricity consumption and electricity price trends have different characteristics; it is found out that the prediction model of smoothing parameter σ of General Regression Neural Network optimized by GFOA has better predictive ability compared to prediction models constructed by other three algorithms.
Keywords
Introduction
Taiwan now has three nuclear power plants that are running, including nuclear power plant No. 1, No. 2 and No. 3. Besides, another plant is under construction. However, since the rise of environmental awareness in Taiwan, the public pay close attention to the nuclear waste and safety of nuclear power plants, and the anti-nuclear forces also grow, resulting in tremendous pressure on Taiwan Power Company. As nuclear energy is the raw material with the lowest cost for electricity production of, if it is changed to other power generation methods, the generating cost of Taiwan’s power company will be affected and power shortage will be caused to affect people’s life, thus causing a lot of issues. Therefore, this paper draws a tendency chart of average annual electricity consumption and the average price announced from the Taiwan Power Company website to show the electricity consumption and price trend for the reference of government departments. In addition, the paper refer to Zhu (2017), Li (2016) and Gao (2016) using algorithm, we introduces a new Swarm Intelligence, using Grey Fruit Fly Optimization Algorithm optimized General Regression Neural Network to construct prediction models of average electricity consumption and price, and provide future possible electricity consumption and price to relevant government so as to make the government take preventive measures.
Firstly, we collected and analyzed the data of average annual electricity consumption and the average price from the Taiwan Power Company website, a total of 70 data were collected from 1945 to 2015, and through grey prediction four-point modeling, the number of data expands to 140. A tendency chart was drawn to explore the relationship between the two and the future possible average power consumption and price trend. The paper refers to stock technical indicator formula (including 5-day MA, BIAS, K VAULE and D VAULE) to calculate the technical indicators for average electricity consumption and price; we take the stock technical indicator as an independent variable (X), and the every-six-month average electricity consumption and the average price as a dependent variable (Y) to construct the prediction models of average power consumption and electricity price. Of these prediction models, the Grey Fruit Fly Optimization Algorithm (GFOA) is presented to optimize General Regression Neural Network (GRNN), Support Vector Regression (SVR) and Gray Neural Network (GMNN) respectively to construct the forecasting models and compare their predictive ability. The model with the best predictive ability is reserved and compared to the predictive ability of Particle Swarm Optimization (PSO) proposed by Eberhart (1995), Artificial Fish Swarm Algorithm (AFSA) proposed by professor Li (2002) and Artificial Bee Colony (ABC) proposed by professor Basturk (2006). The results will be provided to relevant government departments for future reference on possible average electricity consumption and price.
The structure of this article is as follows. Section 1 introduces the purpose of this article. In Section 2 the Fruit Fly Optimization Algorithm, Grey Fruit Fly Optimization Algorithm and relevant literature are presented. In Section 3 the sample data and empirical analysis are presented. In Section 4, we give conclusions and suggestions.
Modified Fruit Fly Optimization Algorithm
Since the General Regression Neural Network, Support Vector Regression, Gray Neural Network, Particle Swarm Optimization, Artificial Fish Swarm Algorithm and Artificial Bee Colony have been widely applied, the reader can refer to relevant literature. Therefore, this article only introduces new Fruit Fly Optimization Algorithm and Grey Fruit Fly Optimization Algorithm of Swarm Intelligence algorithms.
Fruit Fly Optimization Algorithm
Fruit Fly Optimization Algorithm was invented by Taiwan scholar Pan (2012). Many scholars use this algorithm [2, 10] to vary out researches in various areas. It is a new method looking for global optimization based on the foraging behavior of fruit flies. Fruit flies have better sense of sensory and perception than other species, especially the smell and visual sense. The fruit flies’ olfactory organ can capture smell floating in the air, and even can smell food sources 40 kilometers away. Then, after they fly near the food, they can fly toward their companions with their visual flair.
Based on the characteristics of food searching of fruit flies, we reduce it to several necessary steps and examples: Initial location of fruit flies at random Init X_axis; Init Y_axis Random directions and distance of fruit flies searching for food relying on good sense of smell Xi = X_axis + Random Value Yi = Y_axis + Random Value As the location of food cannot be obtained, estimate the distance (Dist) to origin first, and then calculate the decision-value of Smelli (S), this value is the reciprocal of Dist. Disti Plug decision-value of Smelli (S) into decision function to get the Smelli of location of fruit flies. Smelli = Function (Si) Locate the fruit fly with the highest Smelli from fruit flies (min) [bestSmell bestIndex] = min(Smell) Smell best and x axis and y axis, the fruit flies will fly to this position. Smellbest = bestSmell X_axis = X (bestIndex) Y_axis = Y (bestIndex) Enter into iterative optimization, repeat step 2–5, and judge whether the Smelli is superior to the Smelli of the previous iteration, if yes, execute step 6.
Grey Fruit Fly Optimization Algorithm
Since the original fruit fly optimization algorithm has advantages of fast running speed, simple algorithm principle and accurate solution, but it cannot escape local extremum problem. Therefore, in order to solve this problem, other scholars have proposed efficient modified fruit fly optimization algorithm, including adaptive fruit fly optimization algorithm, chaos fruit fly algorithm, and bacterial chemotaxis fruit fly algorithm, etc. This paper presents an original fruit fly algorithm, which is Grey Fruit Fly Optimization Algorithm combining the grey sequence generating calculation with fruit fly algorithm. The correction of algorithm includes the following four aspects: Accumulated Generating Operation of initial position of fruit flies, the formula is:
Calculate Averaged Generating Operation to increase diversity. the formula is:
Where, z (1) (k) =1/2 (x (1) (k) + x (1) (k - 1)) Smell concentration value (S) takes the inverse of distance from fruit flies to the origin (1/D) and plus grey correlation value (Γ) to increase variability. The formula is: After a couple of iterations, the corresponding S of optimal fruit fly remains unchanged, and the location of fruit fly is updated based on lesser probability (the given probability value is 0.2).
Empirical study
Sample data and variable
This paper downloaded and analyzed the average annual electricity consumption and the average price from the Taiwan Power Company website. A total of 70 data were collected from 1945 to 2015 drawn into a tendency chart as shown in Fig. 1. It can be seen from the chart that the severe hyperinflation occurred in Taiwan from 1948 to 1949, making the tariff become more and more expensive. Until June 15, 1949, the Government issued New Taiwan Currency, which made the electric charge of per kilowatt hour fell back, and the electricity price per kilowatt hour has maintained unchanged until now under the government macro-control, so the Taiwanese government has not played a positive role in the regulation of electricity prices. Due to cheap electricity price in Taiwan, the electricity consumption continues to rise year after year; thanks to the sustained economic development and continuous increasing of household appliances, industrial and household demand for electricity is growing year by year, under such circumstances, Taiwan Power Company will feel the pressure, not to mention anti-nuclear groups continue to pressure the government to shut down nuclear power plants. Therefore, the relevant government departments should actively understand the current situation and put forward countermeasures.
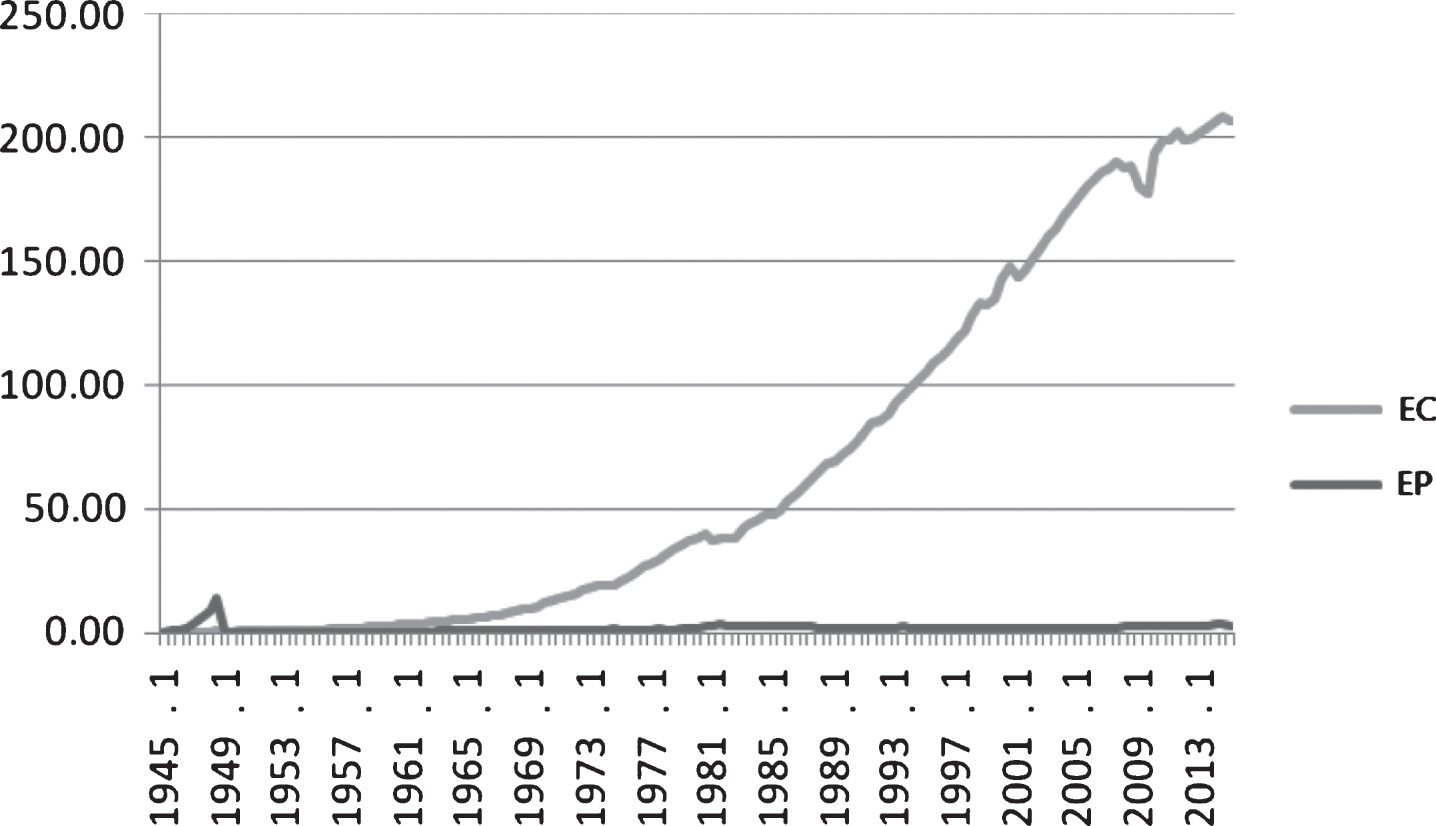
Tendency Chart of Average Electricity Consumption (EC) and Average Electricity Price (EP).
Since this paper will build average electricity consumption and average price forecast model, more sample data will be needed. Therefore, the paper uses an innovative manner, i.e. using grey prediction four-point modeling approach to predict six-month data. To do that, the data of 1945 and 1946 may be summed and averaged and taken as the data of June 1945, the data of 1946 and 1947 may be summed and averaged and taken as the data of June 1946, and then using grey prediction four-point modeling proposed by professor Deng (1982) to input data of June 1945, 1946, June 1946 and 1947 into the grey prediction system in Fig. 2. Through grey prediction modeling, the June 1947 data can be predicted and the rest may be deducted by analogy, and finally predict data of each year in June, thus the number of data increases from the original 70 to 140.
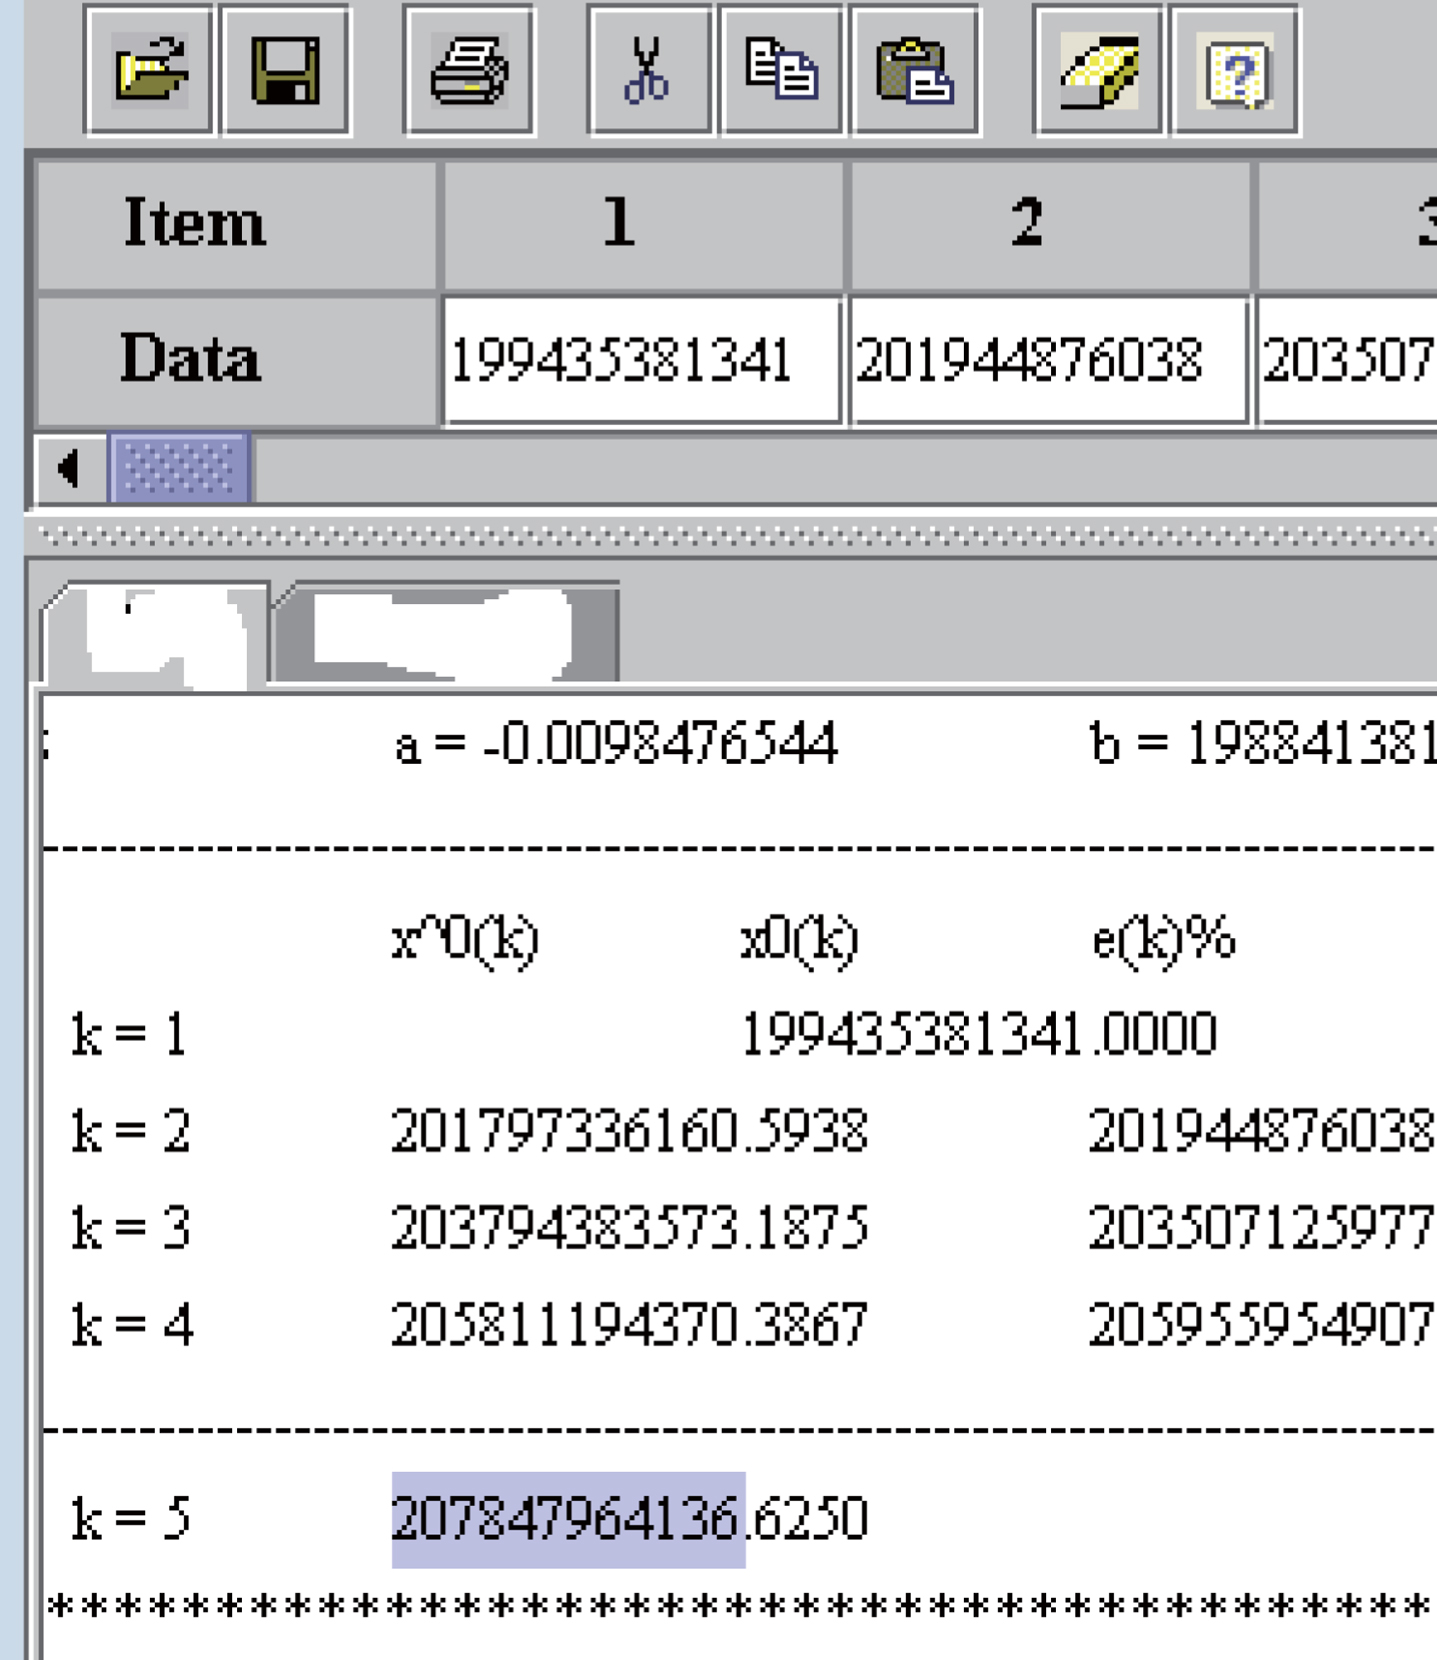
Sketch map of grey prediction system.
Referring to works of professors (Baker, 1985; Abdullah; 2010), we use innovative practices by using the average electricity consumption and price data to calculate the average stock technical indicators as an independent variable (X), and the next day the average electricity consumption and the average price as a dependent variable (Y), and the combination of the two is sample data of this paper. It contains semi-annual average electricity consumption data (first group data), and semi-annual average price data (second group data). Therefore, this paper redefines the formula of five stock technical indicators as follows:
5-day MA(X1) = sum of 5-period average electricity consumption and price/5 periods
5-day BIAS(X2) = (average electricity consumption and price of current period - 5-period average electricity consumption and price)/5-period average electricity consumption and price × 100
Current K value (X3) = 2/3 previous K value + 1/3 RSV
Current D value (X4) = 2/3 previous D value + 1/3 current K value
Where, 5-day RSV = (average electricity consumption and price of current period - 5-period lowest average electricity consumption and price)/ (5-period highest average electricity consumption and price - 5-period lowest average electricity consumption and price) × 100.
Table 1 is the descriptive statistics of these sample data. After calculation of the average power consumption and the average price of two groups’ technical indicators, the paper uses 120 sample data to construct the prediction model for average power consumption and average electricity price. Table 1 shows the technical indicators of average electricity consumption and average tariff. To construct the prediction model, it will be divided into 4 groups, and each group has 30 data. Data of first three groups will be Training Data, and data of last one group will be Testing Data to verify the stability of test models. Therefore, a total of 120 data provide predictive ability analysis for models.
Descriptive statistics of technical indicators of average electricity consumption and price
Firstly, the paper uses GRNN, SVR and GMNN Neural Networks to construct the average electricity consumption and price forecasting model. As the parameter values of GRNN, SVR and GMNN Neural Networks will affect their predictive ability, they must be adjusted. We use the new Grey Fruit Fly Optimization Algorithm (GFOA) to optimize Neural Network parameters so as to compare the predictive ability of the three models. The iterations of Grey Fruit Fly Optimization Algorithm parameters are set to 100, and the population size is 50. After several iterations, the corresponding S of the optimal individual fruit fly remains unchanged, the given probability value is 0.2, the location of fruit fly will be updated. GFOA optimizes GRNN parameter σ, SVR parameters C and e and GMNN parameters a, b1, b2, b3, b4 separately, and build prediction models of average power consumption and average electricity price. We take the data of first three groups as Training Data, and last group data as Testing Data respectively to observe the predictive capability and operational execution efficiency of models. The test results are shown in Fig. 3. In Fig. 3, the left is the convergent tendency of RMSE, the right picture shows the flight path of fruit fly populations. We observed the predictive ability of the models, the test found after optimizing parameters σ of GRNN by GFOA, RMSE is 53.5963; after optimizing parameters a, b1, b2, b3, b4 of GMNN, RMSE is 62.1675; after GFOA optimizing parameters C and e of SVR, RMSE is 91.2204, so GRNN optimized by GFOA has the best predictive ability. On the model operational execution efficiency, test results showed that after optimizing GRNN parameter σ, the model running time is 148.93 seconds; after optimizing GMNN parameters a, b1, b2, b3 and b4, the model running time is 158.12 seconds; after optimizing SVR parameters C and e, the model running time is 193.04 seconds, thus GRNN optimized by GFOA still has the best predictive ability.
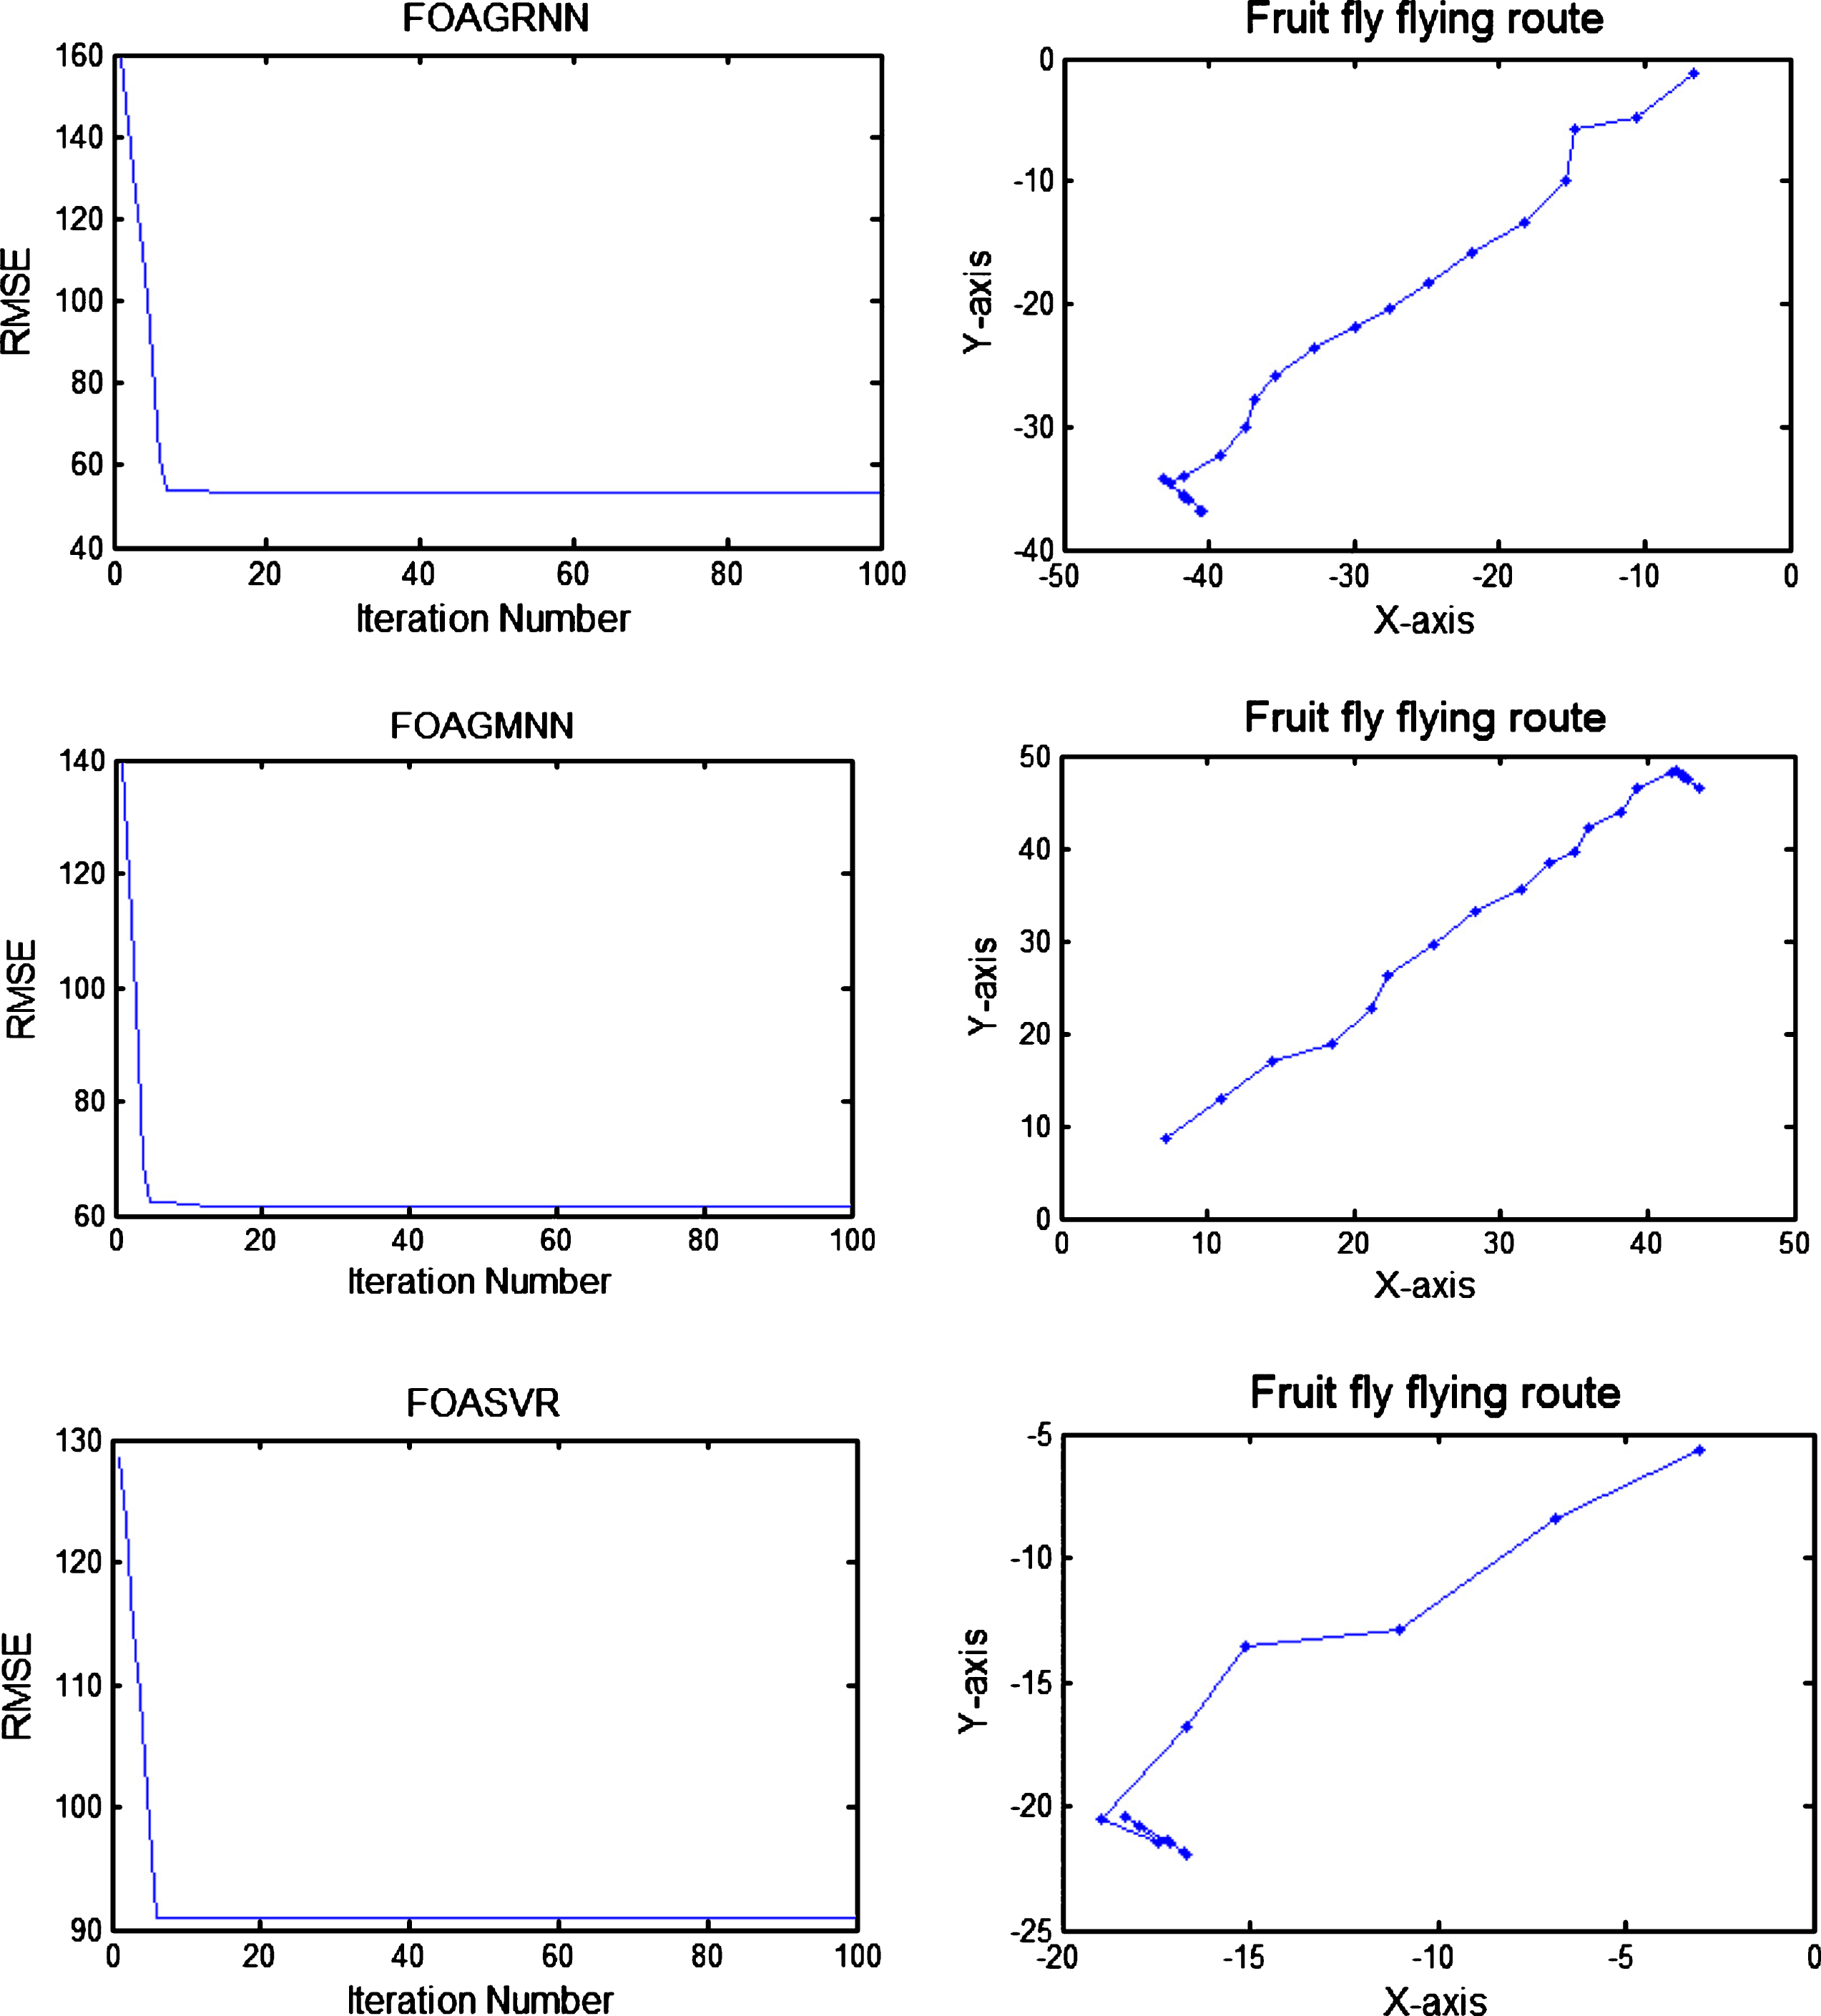
RMSE’s convergent tendency and flying route of fruit fly taking average electricity consumption as test data.
We take the data of the second group (average electricity price) as Training Data, and last group data as Testing Data respectively to observe the predictive capability and operational execution efficiency of models. The test results are shown in Fig. 4. In Fig. 4, the left is the convergent tendency of RMSE, the right picture shows the flight path of fruit fly populations. We observed the predictive ability of the models, the test found after optimizing parameters σ of GRNN by GFOA, RMSE is 0.0852; after optimizing parameters a, b1, b2, b3, b4 of GMNN, RMSE is 0.2079; after GFOA optimizing parameters C and e of SVR, RMSE is 0.2361, so GRNN optimized by GFOA has the best predictive ability. On the model operational execution efficiency, test results showed that after optimizing GRNN parameter σ, the model running time is 146.46 seconds; after optimizing GMNN parameters a, b1, b2, b3 and b4, the model running time is 151.50 seconds; after optimizing SVR parameters C and e, the model running time is 165.99 seconds, thus GRNN optimized by GFOA still has the best predictive ability.
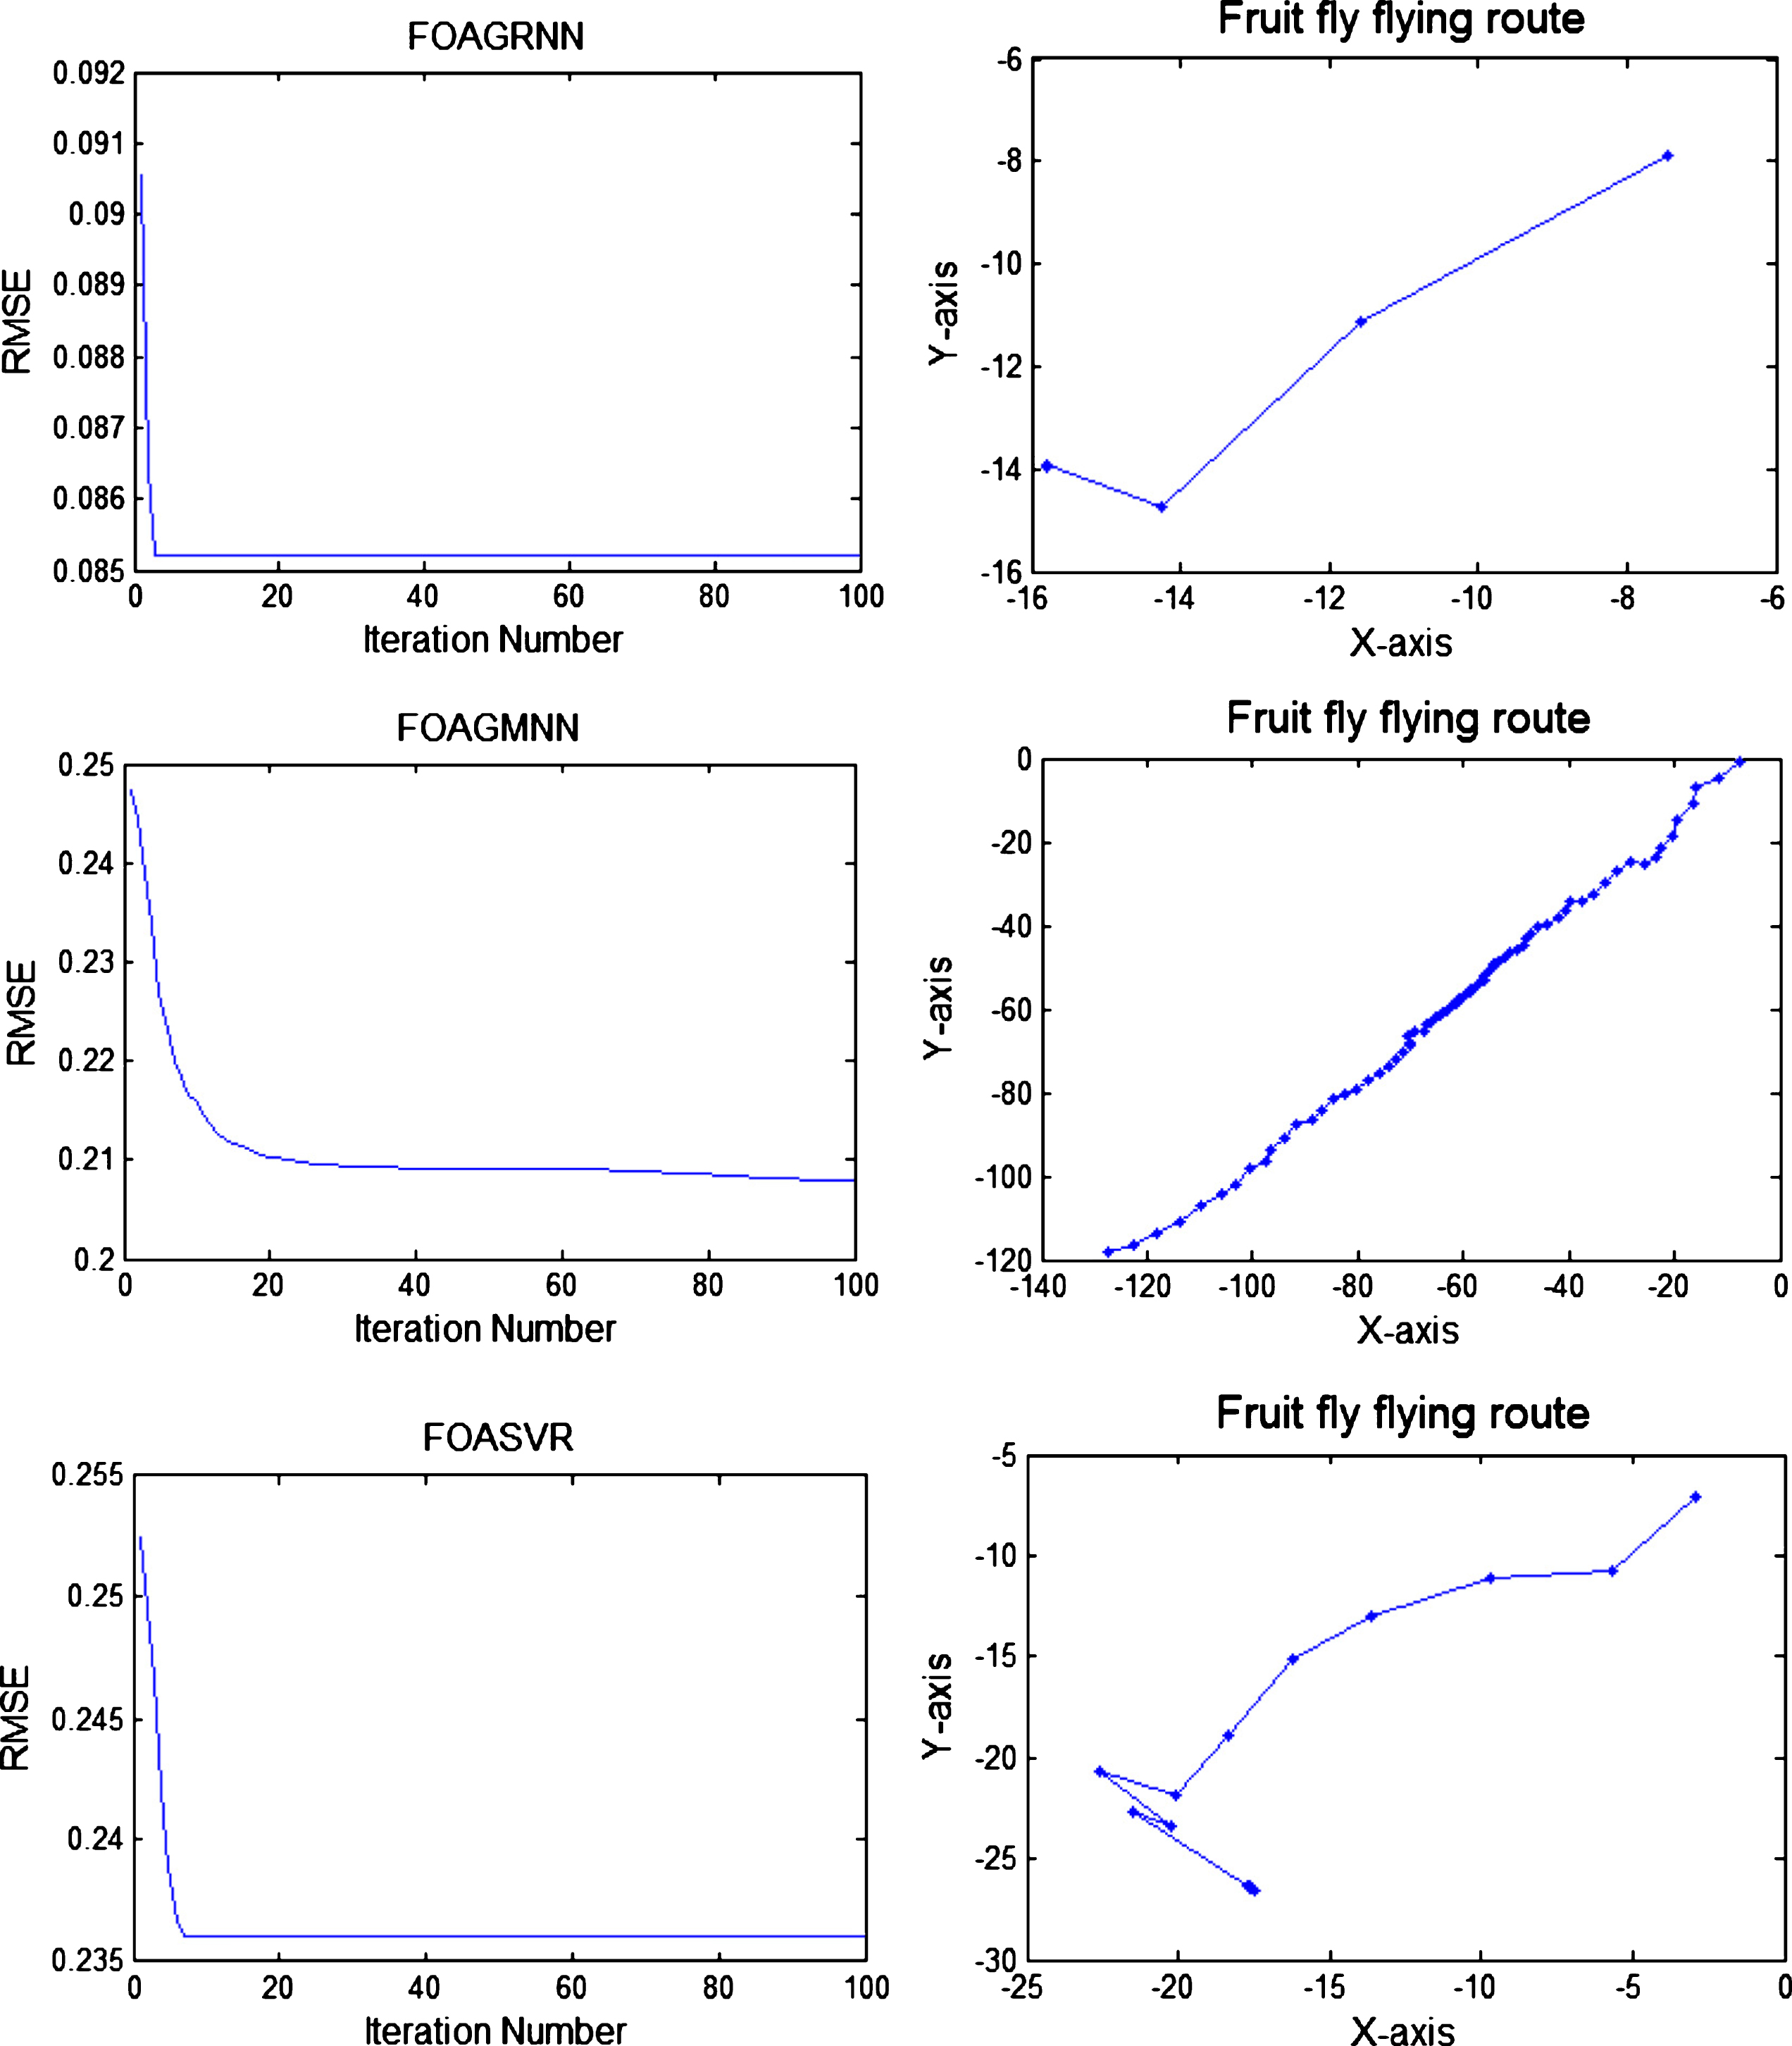
RMSE’s convergent tendency and flying route of fruit fly taking average electricity price as test data.
As GRNN optimized by GFOA has better predictive ability, this article compares optimization ability of PSO, ABC, AFSA and GFOA. To conform to the parameter of GFOA, we will set the quantity of parameters PSO, ABC and AFSA as 50 and iterations as 100. We take the data of the first group (average electricity consumption) as Training Data, and last group data as Testing Data respectively to observe the predictive capability and operational execution efficiency of models. The test results are shown in Fig. 5. After 100 iterations, after optimizing parameter σ of GRNN by GFOA, PSO, ABC and AFSA, the convergent tendency of RMSE is predicted. The GFOA’s RMSE is 53.5963, PSO’s RMSE is 54.3263, ABC’s RMSE is 55.5365 and AFSA (FISHGRNN)’s RMSE is 71.3813. Therefore, GRNN optimized by GFOA has the best predictive ability, followed by PSO, and AFSA has the worst predictive ability. On the model operational execution efficiency, test results showed that after optimizing GRNN parameter σ by GFOA, the model running time is 147.321070 seconds; after optimizing GRNN parameter σ by PSO, the model running time is 178.457194 seconds; after optimizing GRNN parameter σ by ABC, the model running time is 209.162364 seconds; after optimizing GRNN parameter σ by AFSA (FISHGRNN), the model running time is 171.119837 seconds, thus GRNN optimized by GFOA has the shortest running time, followed by AFSA, and ABC has the longest running time. Observing the tendency chart of GRNN optimized by GFOA, it has been convergent after 6 iterations, thus the optimizing capacity of GFOA is very strong.
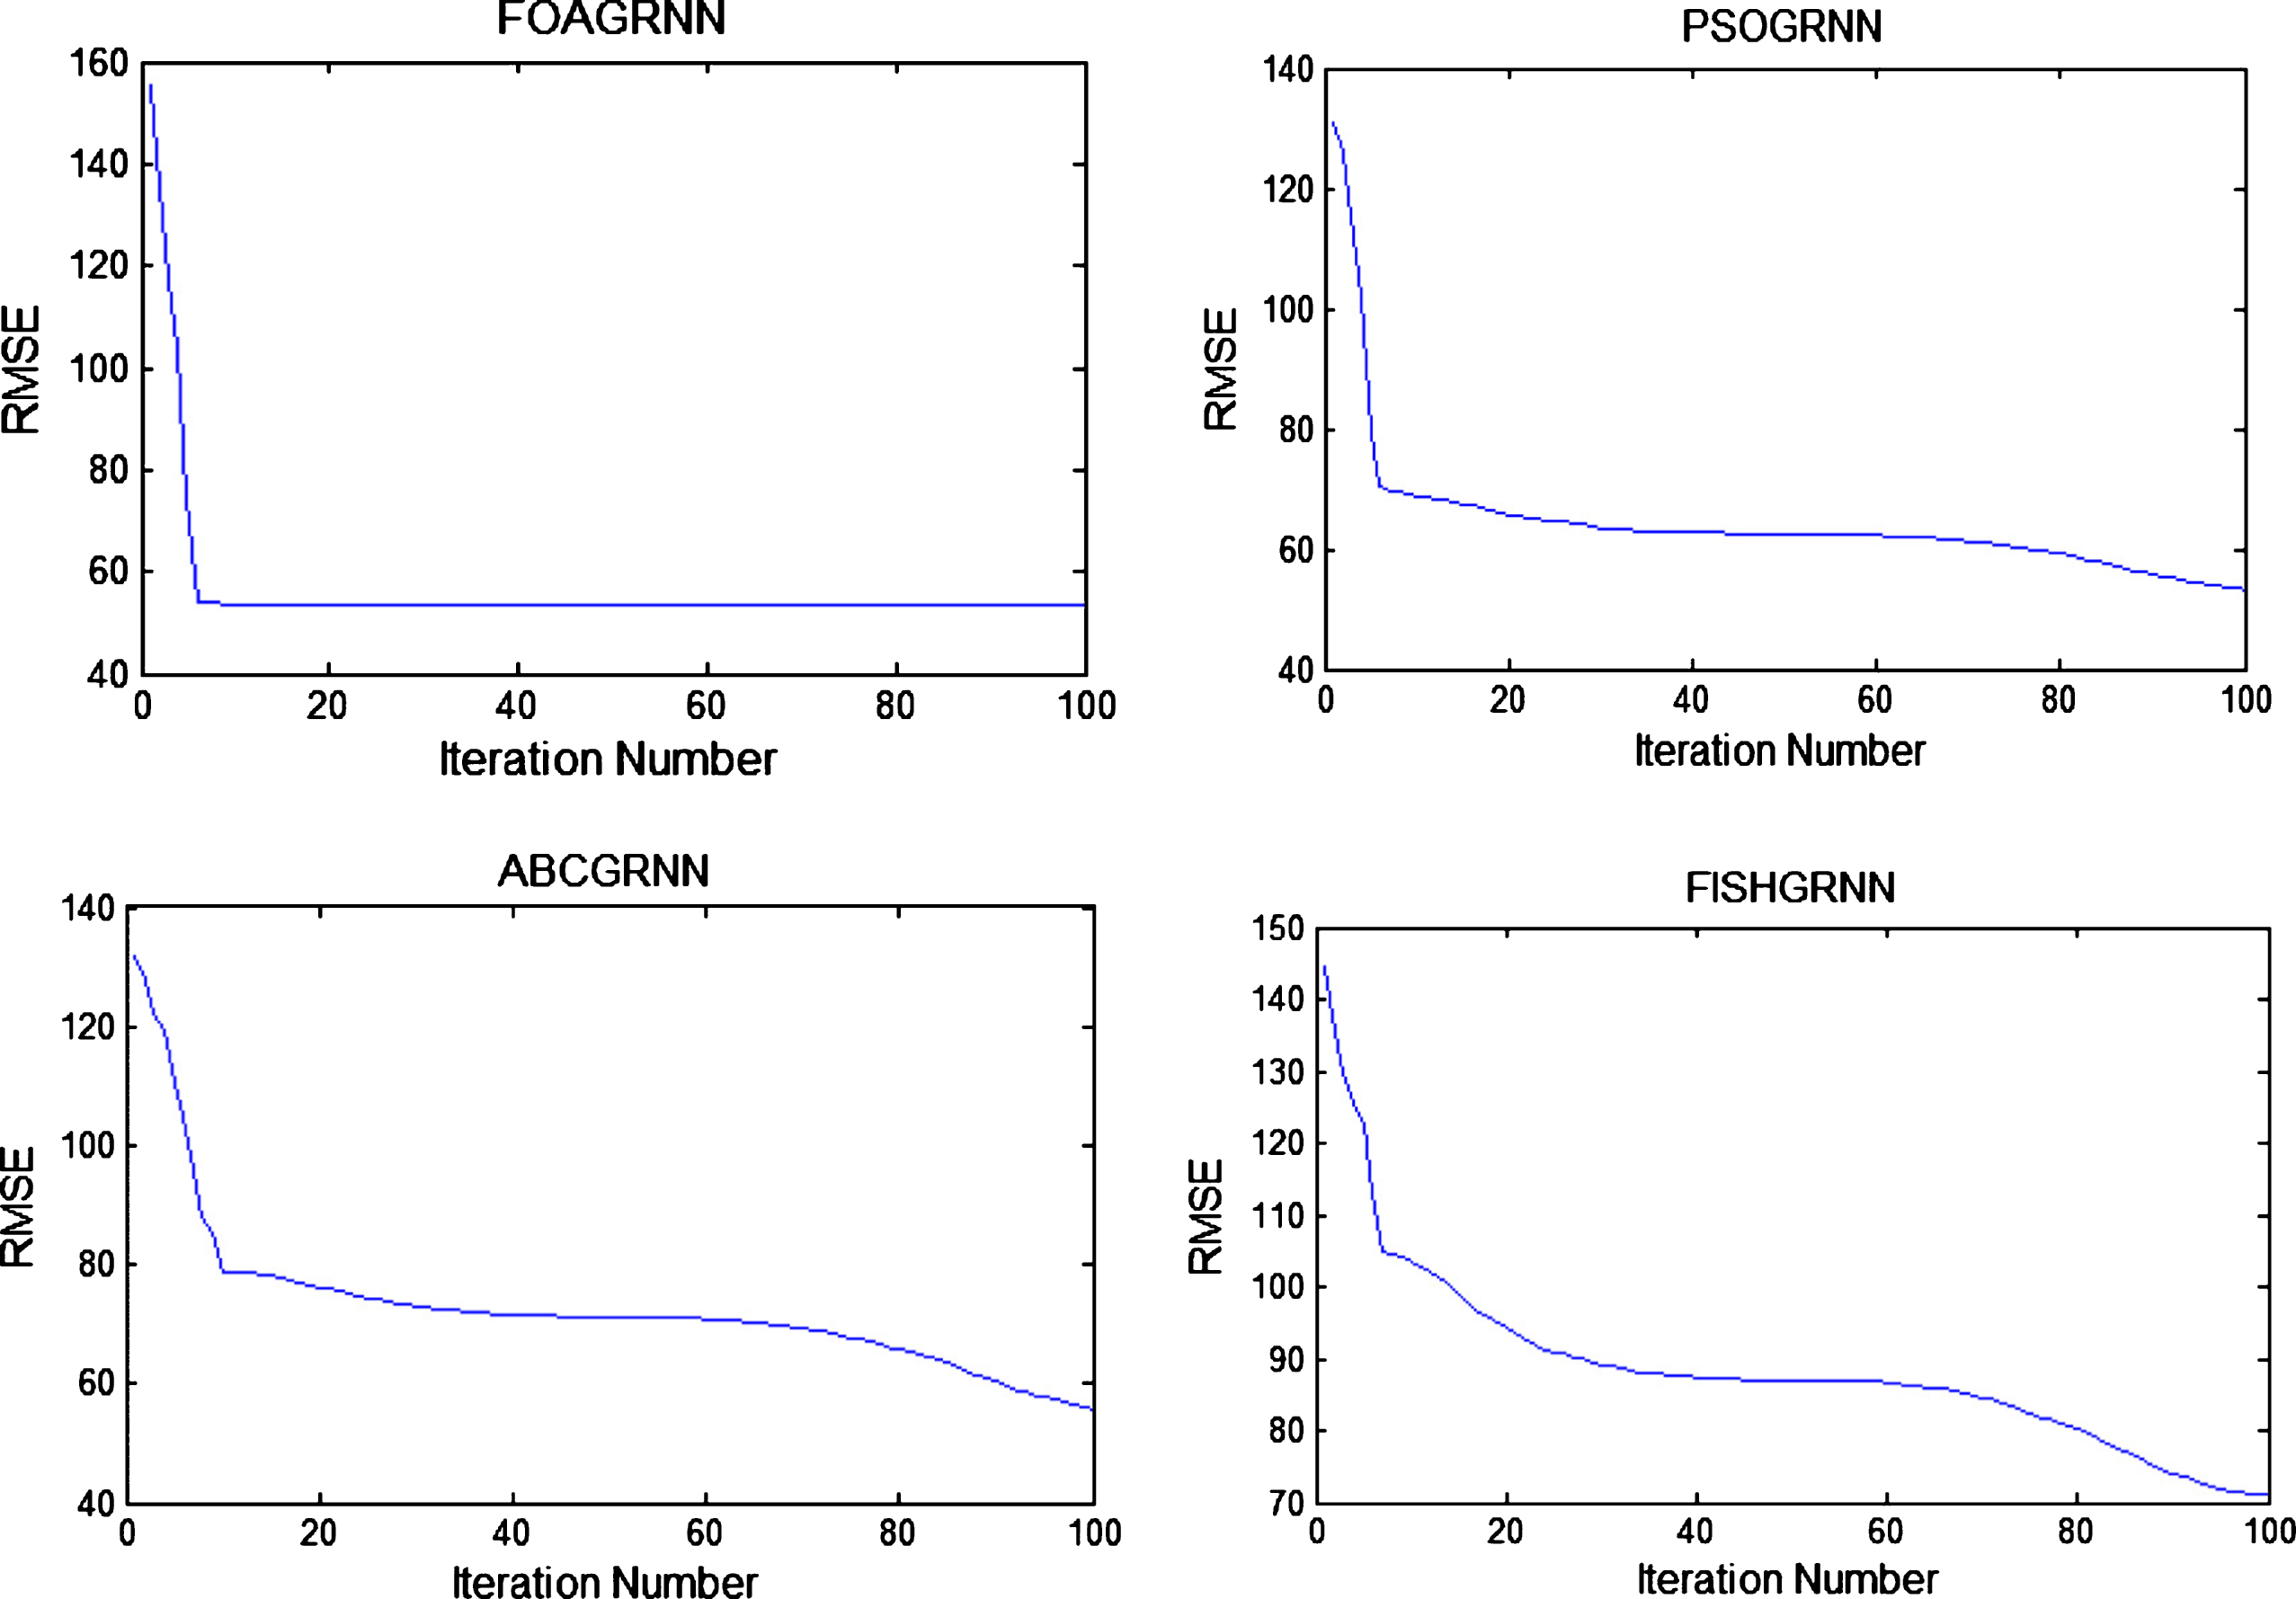
RMSE’s convergent tendency taking average electricity consumption as test data.
We take the data of the second group (average electricity price) as Training Data, and last group data as Testing Data respectively to observe the predictive capability and operational execution efficiency of models. The test results are shown in Fig. 6. After 100 iterations, after optimizing parameter σ of GRNN by GFOA, PSO, ABC and AFSA, the convergent tendency of RMSE is predicted. The GFOA’s RMSE is 0.0850, PSO’s RMSE is 0.2024, ABC’s RMSE is 0.2110 and AFSA (FISHGRNN)’s RMSE is 0.2211. Therefore, GRNN optimized by GFOA has the best predictive ability, followed by PSO, and AFSA has the worst predictive ability. This feature is worthy of further analysis. On the model operational execution efficiency, test results showed that after optimizing GRNN parameter σ by GFOA, the model running time is 171.218837 seconds; after optimizing GRNN parameter σ by PSO, the model running time is 181.914542 seconds; after optimizing GRNN parameter σ by ABC, the model running time is 193.178363 seconds; after optimizing GRNN parameter σ by AFSA (FISHGRNN), the model running time is 180.346255 seconds, thus GRNN optimized by GFOA has the shortest running time, followed by AFSA, and ABC has the longest running time. Observing the tendency chart of GRNN optimized by GFOA, it has been convergent after 5 iterations, which verify that the optimizing capacity of GFOA is very strong.
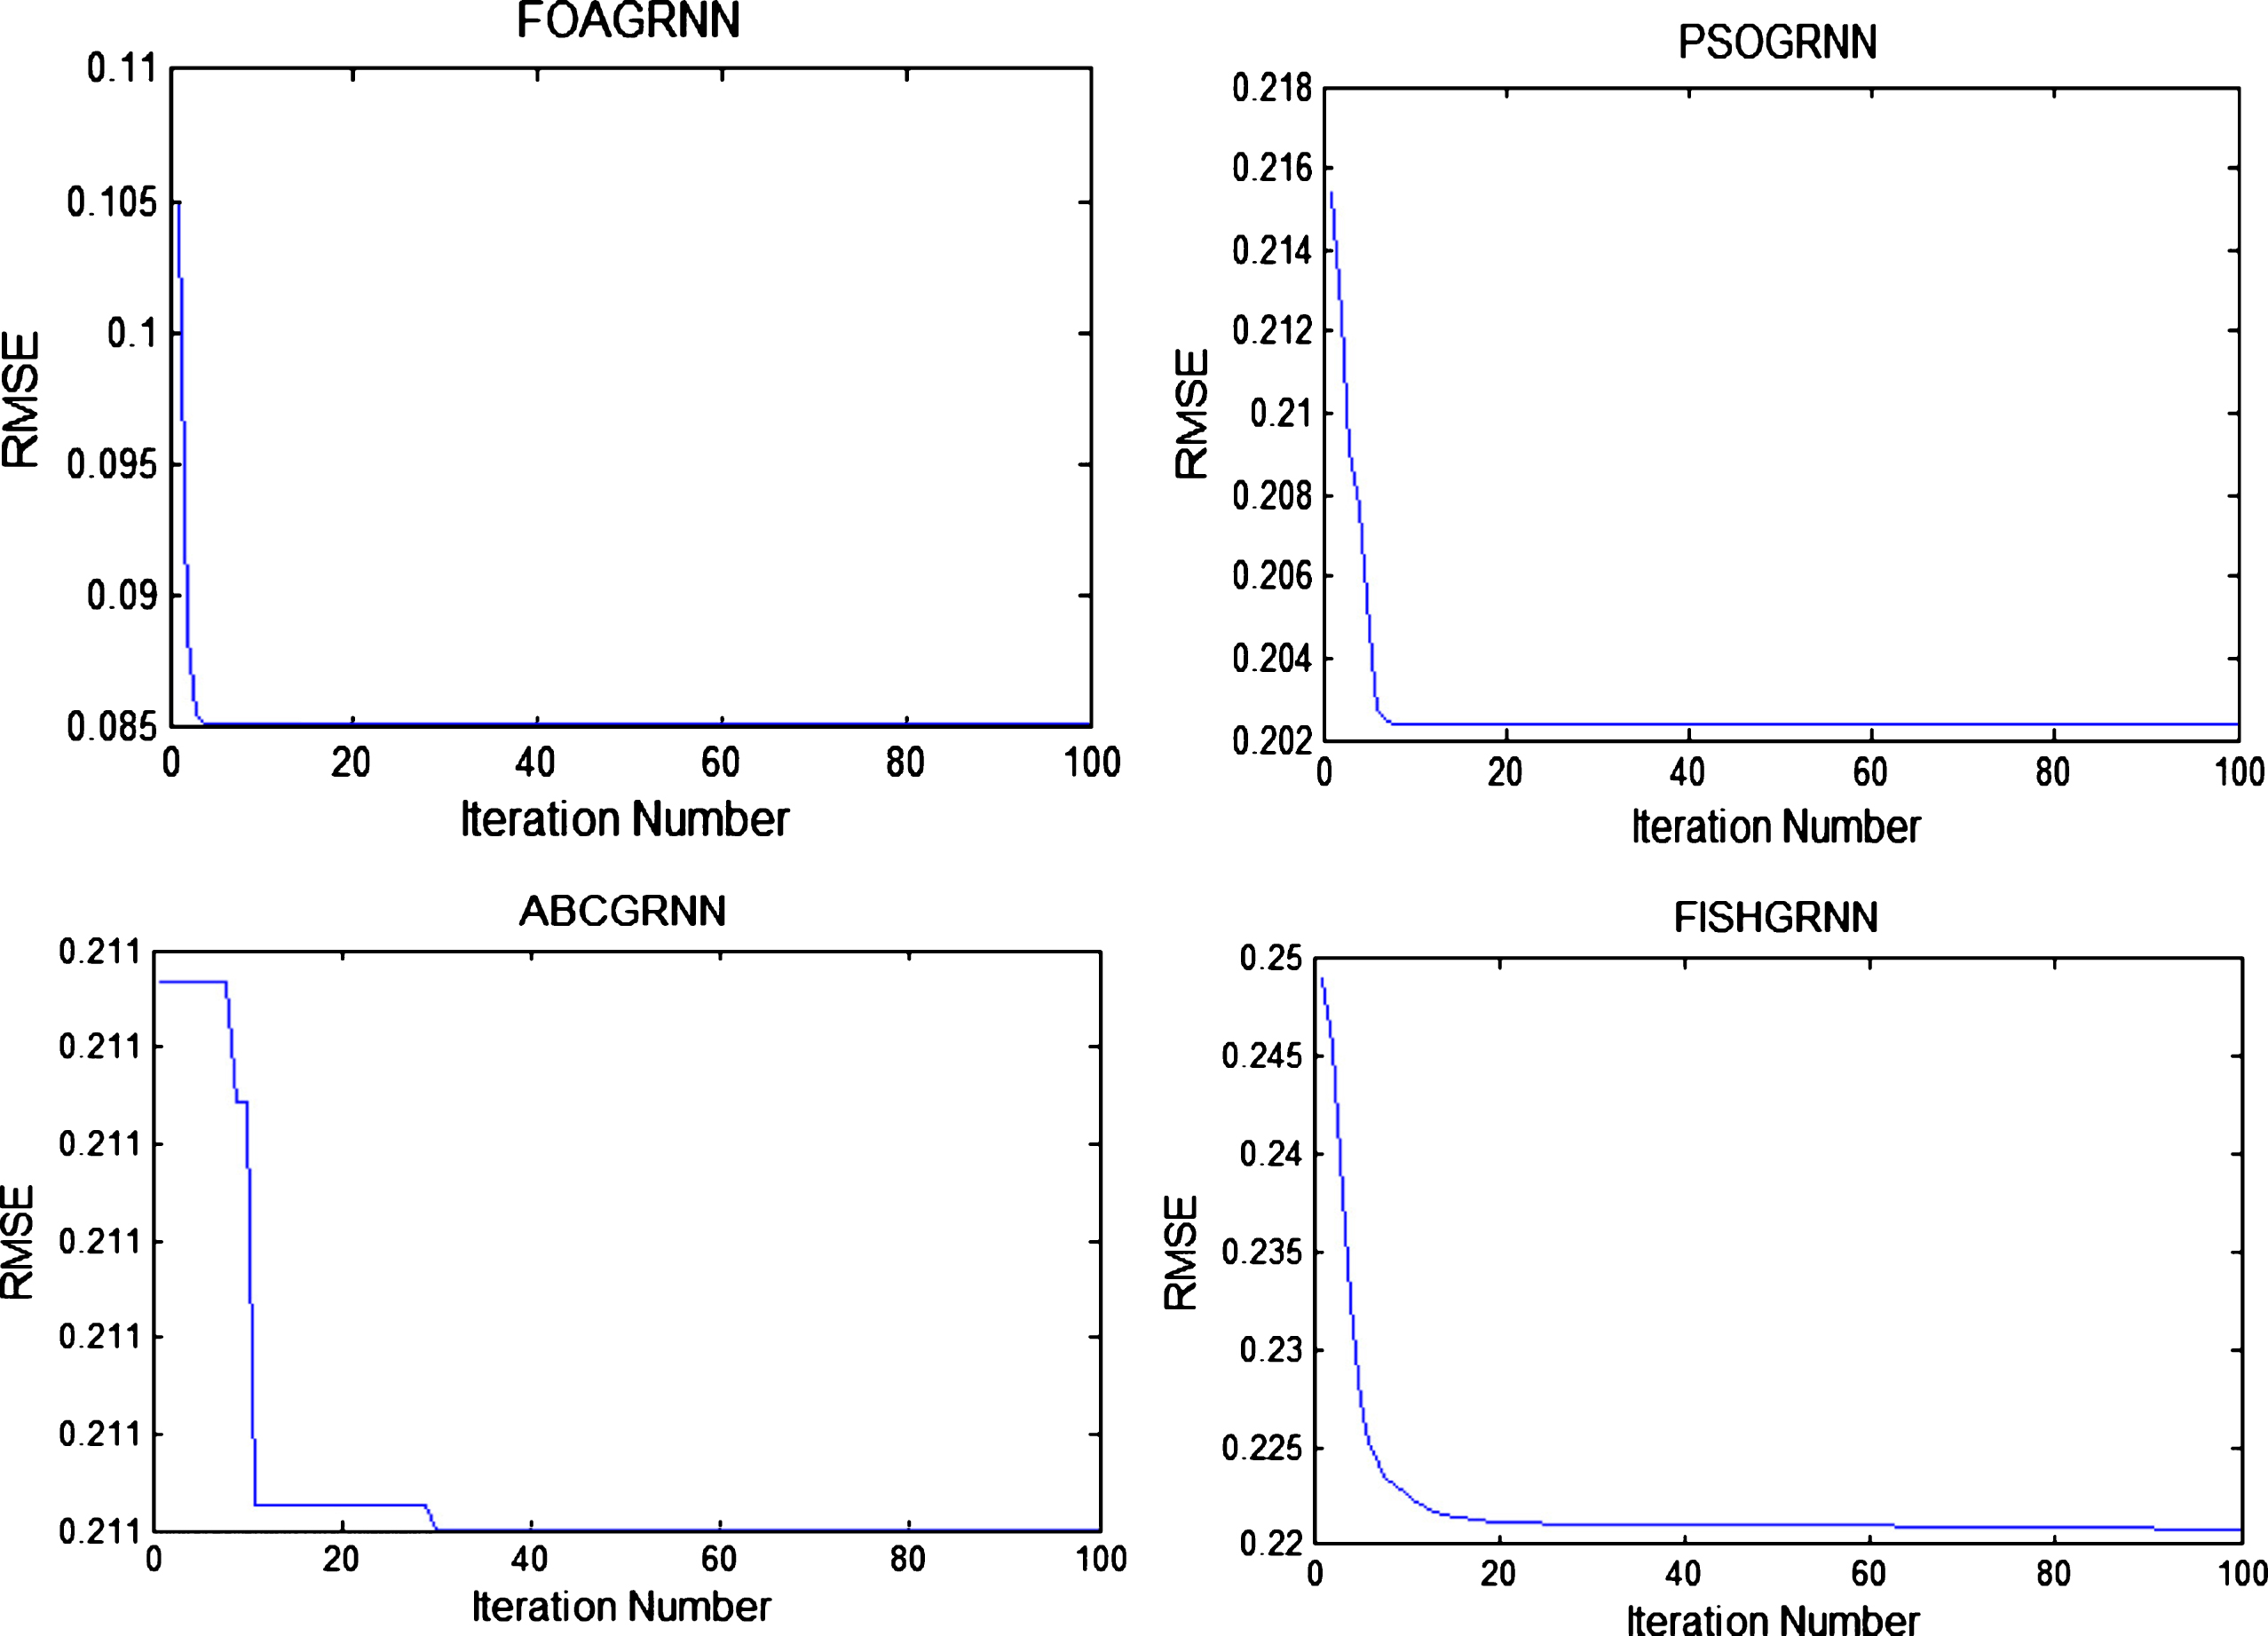
RMSE’s convergent tendency taking average electricity price as test data.
Finally, the paper uses four groups’ data of the average electricity consumption and average price to repeat the test of four kinds of average electricity consumption and average electricity price forecasting model for 100 times. The test results use four kinds of evaluation indicators to compare predictive ability of four models, where the formulas of four indicators are as follows:
Mean Forecasting Error (MFE)
Mean Absolute Error (MAE), formula is:
Mean Absolute Percentage Error (MAPE), the formula is:
Revision Theil Inequality Coefficient (RTIC), the formula is:
Where, N refers to predictive value, X
t
is the observed value,
Result of four evaluation indicators
Result of four evaluation indicators
It can be seen from Table 2 that FOAGRNN model in four evaluation indicators using the first group data, MFE is 0.236, MAE is 0.996, MAPE is 0.058 and RTIC is 0.074, which are lower than PSOGRNN, ABCGRNN and FISHGRNN models. FOAGRNN model in four evaluation indicators using the second group data, MFE is 0.079, MAE is 0.365, MAPE is 0.025 and RTIC is 0.037, which are lower than PSOGRNN, ABCGRNN and FISHGRNN models. Therefore, we use new GFOA to optimize GRNN parameter to build the predictive model of average electricity consumption and price, which has accurate predictive ability. This feature shall be valuable for researchers and government relevant electric power departments of Taiwan.
The main contribution of this article is to explore the average electricity consumption and the average electricity price trends as well as the characteristics of both in Taiwan. The results of the analysis found that no significant changes in the average price, and Taiwan’s relevant government departments did not actively adjust tariff to promote energy saving, while the average electricity consumption has been rising significantly year by year. This issue deserves to be stressed and addressed by government agencies and countermeasures should be proposed as soon as possible. In addition, this paper uses the original method, the grey prediction 4-point modeling to predict the data of each year in June, so that the original sample data (12 months) is changed to the data of six months. However, the paper further tests the efficiency of GFOA which optimizes three types of neural networks, i.e. GRNN, SVR and GMNN. It is found that the forecasting model GRNN combined with GFOA has the best predictive ability. Therefore, we use PSO, ABC and AFSA to optimize GRNN prediction model, and compare them with GFOA-optimized GRNN, it is found that whether in the accuracy of the predicted results or the running time, FOAGRNN is superior to the other three models. The Artificial Bee Colony algorithm is slower than others in the process of optimization. Artificial Fish Swarm Algorithm consumes longer time, this feature is worthy of further analysis by researchers.
In addition, this paper presents a new type of Grey Fruit Fly Optimization Algorithm to optimize the prediction model, and compares it with Particle Swarm Optimization, Artificial Fish Swarm Algorithm and Artificial Bee Colony. Other new algorithms are recommended in the future, for example, comparisons should be made between Krill Hherd Algorithm proposed by Wang et al. (2014) and Monarch Butterfly Optimization proposed by Wang et al. (2015).
Footnotes
Acknowledgments
The research is supported by the National Natural Science Foundation of China (71673064), Humanities and Social Sciences Planning Project of the Ministry of Education (13YJC630240), Soft Science Project of the Science and Technology Program of Guangdong Province (2013B070206058, 2015A070704054), Outstanding Youth Fund Project of Education Department of Guangdong Province (2014WTSCX040), Soft Science Project of the Science and Technology Program of Guangzhou (2014Y430009).