
Abstract
With the continuous development of modern network, because of the increasing prominent and correlation of the huge network system, the original source independent network system has been difficult to meet the needs of the development of modern network. Therefore, we need to add the correlation between each ON/OFF source in the classical ON/OFF model based on the time series. On the basis of theoretical analysis and simulation experiment, the new C-ON/OFF model was formed after the improvement of ON/OFF model. Through quantitative analysis, the two parameters of and with the physical meaning in the model were discussed, and the relationship between the normalized self-covariance of the generated traffic. In order to verify the validity and practicability of the proposed model, the experiments of different parameters of the two groups were comparatively analyzed. The experimental results show that the model has good advantages in the physical meaning and complexity under longer correlation, and the C-ON/OFF network traffic model can be applied to the design of the network traffic monitoring system.
Introduction
After entering the new century, the use of Internet as the representative of the computer communication network for shopping, travel, social communication has been becoming more and more common. Network not only has gradually become an indispensable too in people’s daily life, but also gradually become the foundation of China’s modern social information exchange and the important pillar of social development [1]. As of 2015, China’s Internet users has reached 670 million and China became the world’s largest Internet users of the country, and Chinese Internet also realized the 64 Kbps and the Internet connection function of the world [2]. According to “The development report of China Internet for 20 years”, China’s Internet users rose to 670 million from less than 1 million in 1997 in 20 years, and the total number of sites was also more than 4 million. With the growing number of Internet users in China and more and more high Internet penetration rate in China, the network scale has gradually evolved into a huge network system, which has strong heterogeneity and complexity [3]. This kind of network has changed the way of life of human being. The application of electronic commerce, instant messaging and so on into the specific life has shortened the distance between each other, and enhanced people’s interaction [4]. However, as the system becomes more and more large, the network system formed in the last century has become more and more difficult to adapt to the new development of modern society and the needs of society, and the research and development of a new generation of network system has become the consensus of the world. Only clearly understand the existing problems in the operation of the network system can prevent detours of the new generation of network system research design, otherwise it will restrict the development of a new generation of network systems. Therefore, how to operate the network system, equipment maintenance and security becomes more and more urgent [5].
To carry out the behavior supervision of the modern network, the first is to optimize the network structure. Only the design of the high performance of the protocol can achieve a higher quality of service improvement, which is also an important way of network measurement. That is to say, the hardware and software are used to test, verify, and study a series of activities of the network operation through a certain way and technology. In the network measurement system, network traffic monitoring is one of the key links, and it is also an important indicator of the evaluation of the network operation. Therefore, it is necessary to carry out further research and analysis of network traffic [6]. The construction of network traffic model is one of the methods of research and analysis of network traffic. If an accurate and effective network traffic model can be built, it can be more accurate to describe the characteristics of network traffic, and design a more efficient and safe network monitoring system, so as to make the modern network more efficient with safe operation [7]. At present, the ON/OFF model of network traffic analysis is one of the numerous network traffic models. It is a long-range dependent model constructed using the self-similarity of the network traffic in the random process with statistical significance. But it only explores the nature of the network traffic from the micro level and network level with a certain one-sided, which needs to be further improved [8]. The construction of network traffic model based on time series can reflect the overall trend of flow dynamic changes with the change of time series, grasp the all kinds of irregular phenomenon of the flow, and control the stability of flow. Its application in the flow model of ON/0FF can make full use of the self-similarity principle of network traffic. The flow process is imitated in real time by time series, and the monitoring and control of network traffic is more accurate. C-ON/OFF network traffic model based on time series has a certain reference value for the design of network traffic monitoring system, which can contribute to the maintenance of network security and stability, and promote the long-term sustainable development of network.
Related theory of time series and network traffic
Time series
Time series is a sequence of numbers that are arranged in chronological order. As one of the key links of network measurement system, network traffic is also a kind of time series [9]. The time series covers all the historical behaviors of the whole system. Therefore, the analysis of the dynamic change law can be carried out through the information. After finding the relationship between the past and the current value, the establishment of the model can reflect the interdependence of the model, so as to predict the future value of the sequence [10]. An effective analysis method for time series is the self-correlation analysis method, which is to analyze using the theoretical knowledge of autocorrelation function and partial autocorrelation function. In order to facilitate the introduction of autocorrelation function and partial autocorrelation function, the basic definition is as follows.
The time series are set to be {y
t
}, which is expected to be:
The correlation functions of variance and covariance are formula (2) and (3):
γ
k
is the self-covariance of {y
t
} lagged k term. Two random variables y
t
and yt+k are separated by k phase. The total error of the two variables is measured by the covariance, and the total error of the k phase is expressed by γ
k
. The self-covariance function of {y
t
} is expressed by the self-covariance sequence γ
k
(k = 1, 2, 3, ⋯). When k = 0,
Autocorrelation function is used to indicate the correlation degree between the two values separated by the k phase. It is defined as:
When the time series is stationary, then σ
y
t
= σ
y
t+k
= σ
y
, and the autocorrelation function is written:
Lag phase k (k = 1, 2, 3, ⋯) is the independent variable of the autocorrelation function. For time series {y t }, when Cov (y t , yt+k) = Cov (y t , yt-k), there is ρ k = ρ - k, which shows that the autocorrelation function is zero symmetric, and it only needs to study the positive part.
Assuming that the sample data of time series {y
t
} is y1, y2, ⋯, y
n
, and n is the sample size, and the sample autocorrelation function is:
In the above formula,
The partial autocorrelation function is another way to describe the degree of correlation between the two values of adjacent k phase [11]. When describing the correlation between y
t
and yt+k, the autocorrelation function contains the influence of the intermediate k - 1 term yt+1, yt+2, ⋯, yt+k-1. After excluding this effect, the partial autocorrelation function is simple to describe the correlation between y
t
and yt+k, and the mathematical expression is:
φ
kk
is actually the value of the k regression coefficient in the k order autoregressive model. The recursion formula of the partial autocorrelation function is derived from the Yule-Walker equation, and the Yule-Walker equation is:
The recurrence formula of partial autocorrelation function is:
In the above formula:
Assuming that the sample data of time series {y
t
} is y1, y2, ⋯, y
n
, and n is the sample size, and the sample partial autocorrelation function is:
In the above formula:
The modeling with time series commonly uses in the Pandit-Wu method, which is based on the Box-Jenkins for further development, and using ARMA (n, n - 1) to express the stationary time series [12]. The steps include the order of the model, the estimation of model parameters, the model checking and the model prediction. For non-stationary time series, it is firstly transformed into a stationary time series for modeling.
The characteristics of network traffic determine the complexity of the mathematical model. Only clear its characteristics can formulate and describe the mathematical model [13]. In general, network traffic has self-similarity, long range correlation and suddenness.
Self-similarity is a description of the shape features which are independent of the scale. As the triangle shown in Fig. 1, it is gradually divided from A into B, C, and D by a certain rule. For the time series of network traffic, it is shown as the self-similarity in the time dimension. From the point of view of distribution, the time is t, the random process is {Z (t) }, a > 0, there is:
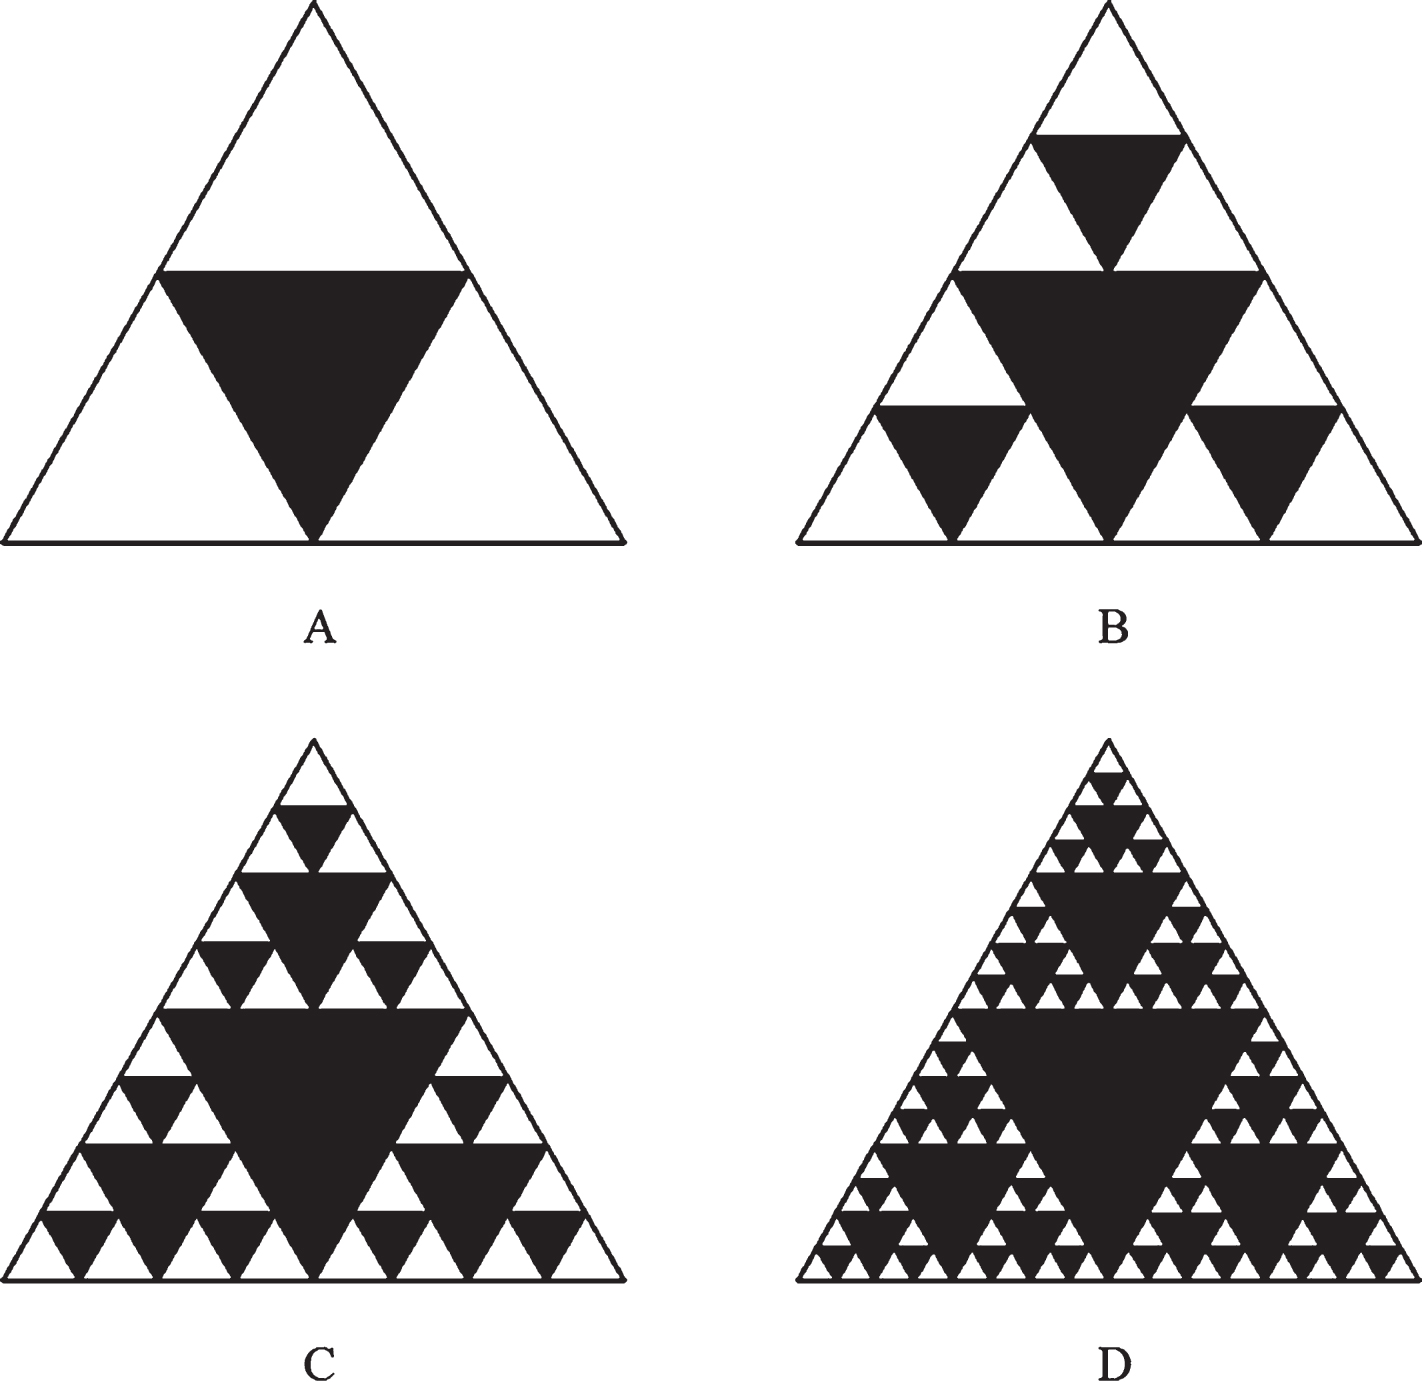
Self similar graph example of network traffic.
However, due to the limited conditions in the formula (14) are too harsh, it is necessary to re define their self-similarity. The stationary random process and autocorrelation function are respectively provided with {X (t)} and r (k):
Network traffic also has a long range correlation, that is, the significant correlation is presented at different time scales in a large time scale, and its autocorrelation function is satisfied:
There are some connections and differences between the long-range correlation and the self-similarity of the network power. The statistical properties of the long-range correlation are progressive, which can describe the variation law under the large time delay in the stochastic process [14]. For the stationary discrete time series, if r (k) changes to infinity and decreases with time delay, the discrete time series have the long-range correlation, and the attenuation of the hyperbolic function is shown in Fig. 2.
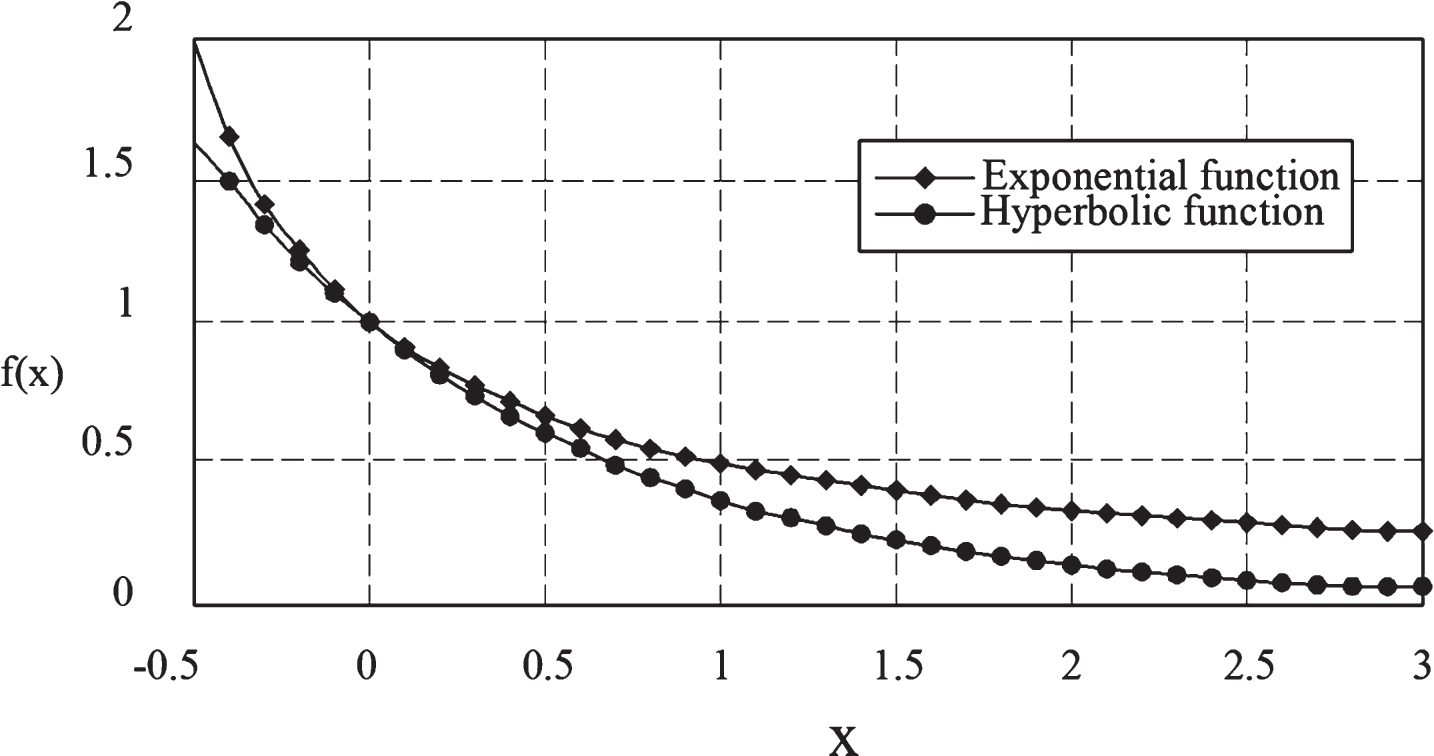
The appearance of network traffic (hyperbolic function and exponential function).
Another obvious characteristic of the self-similarity of the network traffic is the suddenness, which is to describe the fluctuation value of network traffic on the scale of all levels [15]. And for the evaluation of the severity of the sudden, there are often two indicators. First is the standard deviation and the mean ratio of the flow rate, and the ratio directly shows the intensity of the flow rate change. For scenarios in which the variance cannot be solved, the suddenness level can be characterized by the instantaneous discharge heavy tailed distribution parameters [16].
ON/OFF model
The ON/OFF model is the typical structure modeling method for simulating network traffic aggregation process proposed by B.Mandelbrot and J.M. Berger in 1960s, which was a representative network flow model with a clear physical meaning [17]. It can accurately explain the principle of self-similar nature of network traffic. The model constructed by this typical model is called the physical model (Fig. 3).
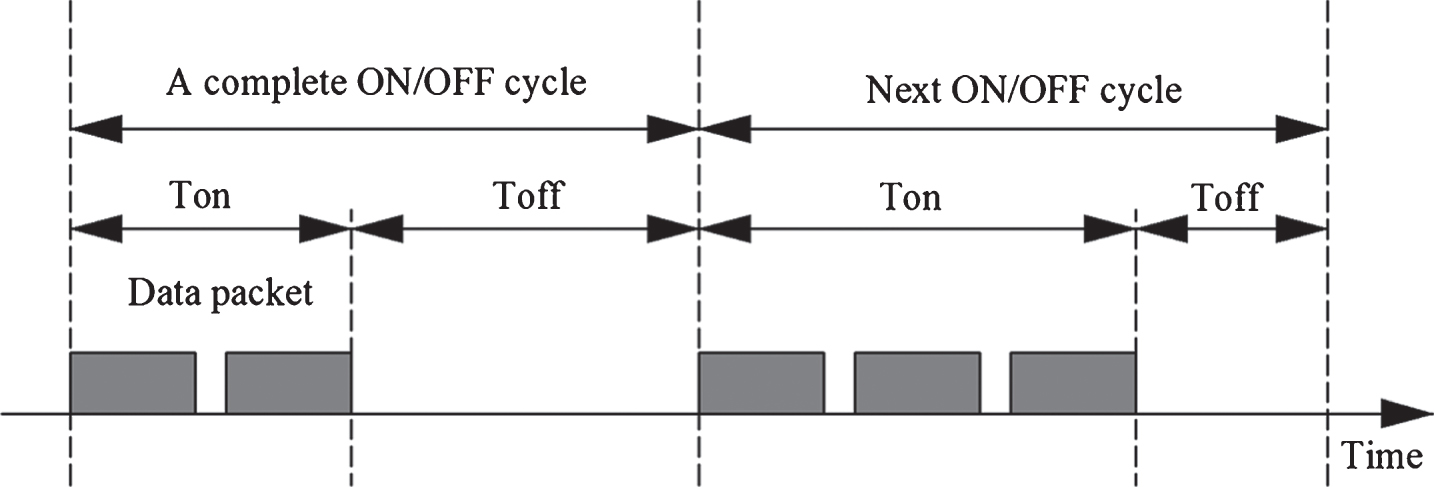
ON/OFF cycle of model.
As the data transmission rate of the model is constant, the duration of the two states ON and OFF in each period is a very important model parameter in the model [18]. Multiple ON/OFF sources converge into the synthesis flow, through the simulation of the real network traffic generated at the end of the convergence, which is shown in Fig. 4.

ON/OFF model flow convergence.
According to the ON/OFF model in Fig. 4, we can know that the single ON/OFF source will converge to the stack module, and it will be transmitted in the form of synthesis in the network. Figure 5 is a schematic flow synthesis process: the data generated by the ON/OFF of N sources is accumulated a great expansion of the total flown the time span and the flow rate.
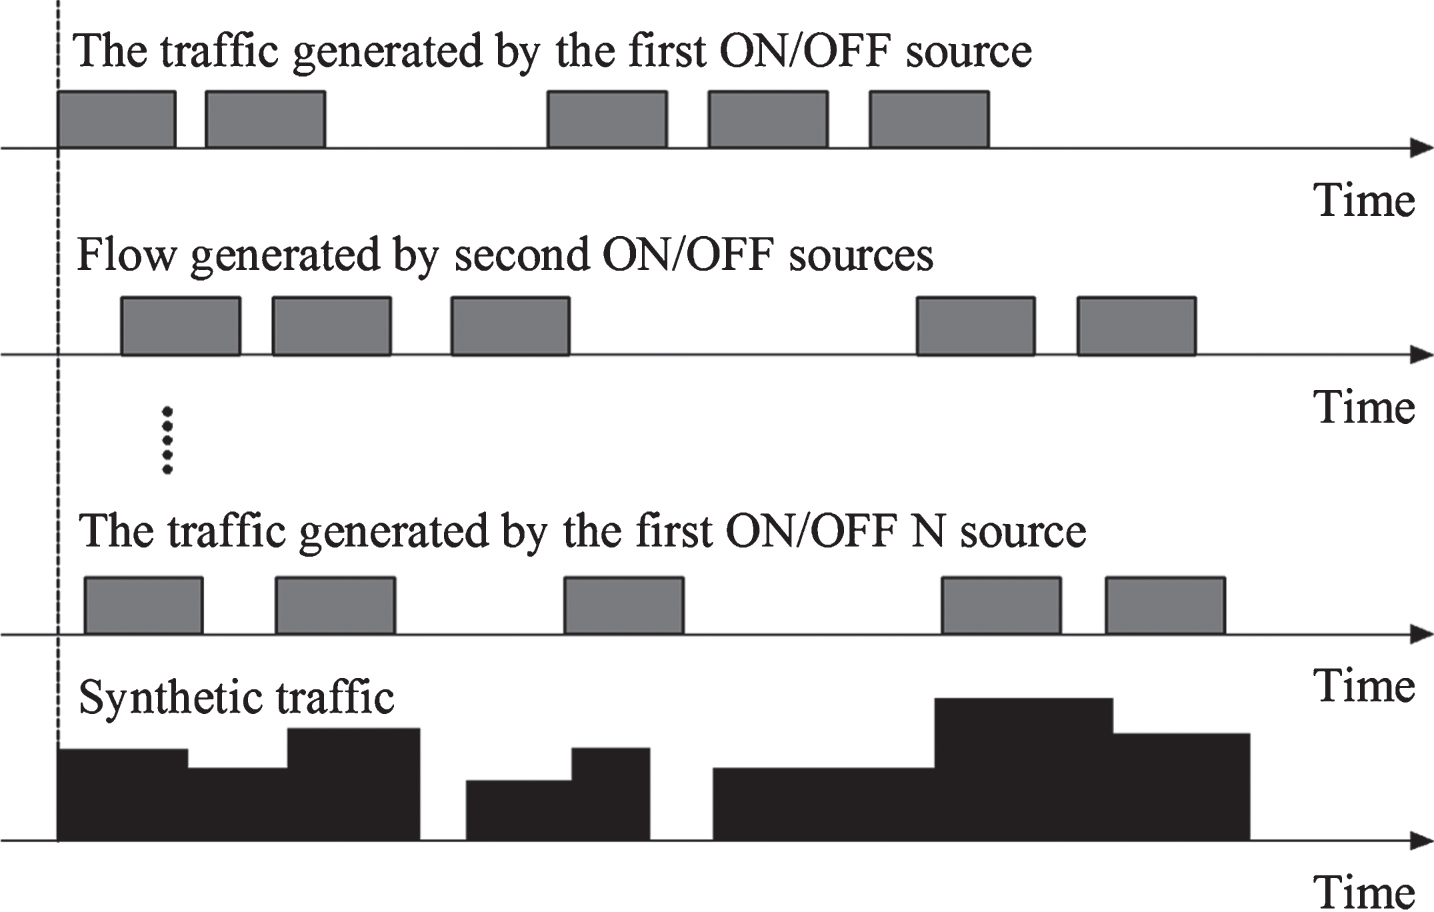
Flow and synthesis of ON/OFF N source.
In the ON/OFF model, the heavy tailed distribution is the key to generate self-similar traffic. It is assumed that the probability distribution of the random variable X satisfies (17) formula, and the X has the characteristic of heavy tailed distribution:
In the formula (17), c > 0 is used as a constant; the tail shape uses 0 < α < 2 as the parameter. In the distribution of random variables, the so-called “heavy tailed” refers to that compared to the exponential decay, when x→ + ∞, the attenuation of the tail of the distribution (refers to the “1 - F (x)”) is much slower. The main reason for the slow decay of the tail distribution of the random variable is the extreme variability of random variables, that is, small probability events cannot be ignored [19].
Pareto distribution is a relatively simple type of heavy tailed distribution. Assuming the parameter k > 0 and α > 0, then the probability density function f (x) and the probability distribution function F (x) of Pareto distribution are as follows:
Expectation of Pareto distribution:
In the formula (20), the condition which makes the existence of the expectation is that α > 1. When 1 < α < 2, the expectation for the Pareto distribution is:
To examine the variance of Pareto distribution, and according to the relationship between variance and expectation, there is:
In the formula (20), the condition for the existence of the expectation E (X) is guaranteed to be 1 < α < 2. But when this condition is brought into the formula (22), the variance of Pareto distribution becomes infinite, that is, the variance of Pareto distribution does not exist (Fig. 6).

Exponential distribution and probability density function.
In summary, for the distribution of Pareto, when the value of α is between 0 to 1, the expectation and variance are infinite. When the value of α is between 1 and 2, the expectation is finite, and the variance is still infinite. There is a close relationship between the self-similarity and the heavy tailed distribution of the generated traffic in the ON/OFF model. When the duration of the ON state and the OFF state is in compliance with the heavy tailed distribution, the multiple independent ON/OFF data sources have self-similarity.
In the field of network research, the similar phenomenon of people’s long time of hot events or the attention of news from the aspects of age, occupation, and interest is called the phenomenon of network convergence. And the same degree of network behavior of people in schools, companies, and residential quarters of the same local area network is higher, or even the same. This makes the phenomenon of network convergence more obvious, and many network users often suddenly make the same network behavior at the same time. The network traffic data generated by this situation is similar to the same, and the only difference is that there is a delay in time [20]. In the traditional ON/OFF model, the correlation and suddenness generated by a large number of heterogeneous network traffic caused that the traditional model of the source independent assumption was difficult to meet the demand of modern network structure, and more difficult to meet the long-range behavior of network traffic.
There are N ON/OFF sources in the ON/OFF model, and the traffic generated by each source is set to X1 (m), X2 (m), ⋯, X
N
(m), and the synthetic traffic for each source generation is:
Time interval is n (n ≥ 0), and the autocorrelation function of X (m) is:
The formula (24) is expanded, and there is:
It is important to note that each item of the
When {X i (m), m = 0, 1, 2, 3⋯ } satisfies the independent identically distributed condition (i = 1, 2, 3, ⋯, N), assuming that M i = α, and according to the relation between autocorrelation function and self-covariance function:
The following formula is established:
The second item α2 of above formula divided into EX i (m), the results are as follows:
Set c
i
(n) as the self-covariance function for each X
i
(m), then:
At this point, we obtain the relation between the self-covariance function of synthetic flow of N independent identically distributed sources and the self-covariance function of each source. The self-covariance function of the synthetic traffic c (n) is set that the light tailed distributions are additive in the duration of the OFF and ON cycles of the source.
When N is a finite value, there must be:
The above formula indicates that when the ON cycle or OFF cycle duration is light tailed distribution and the ON/OFF model satisfies the independent identically distribution, the flow rate of a single source is short.
Then study the other case: In the model, the duration of the ON cycle or the OFF cycle is not independent. The expectation of the ON cycle or the OFF cycle duration distribution for each source is set to α, and according to the formula (24–26), there are the following results:
The first item in the formula (33) is the self-covariance function of the source generated flow, and the second item is the cross covariance function of the source generated flow, that is, the:
Because of the correlation between the flow sources, the cross covariance function of the formula (34) will not be equal to 0. Compared to the previous conditions, only after changing the independence condition, the probability distribution function of the duration of the ON/OFF cycle is still not changed. This fully shows that the flow generated by a single source and the aggregate flow of the self-covariance function can be added, and the sum conditions also determine the strength of the correlation of each other. And the flow chart of the variance time method is shown in Fig. 7.
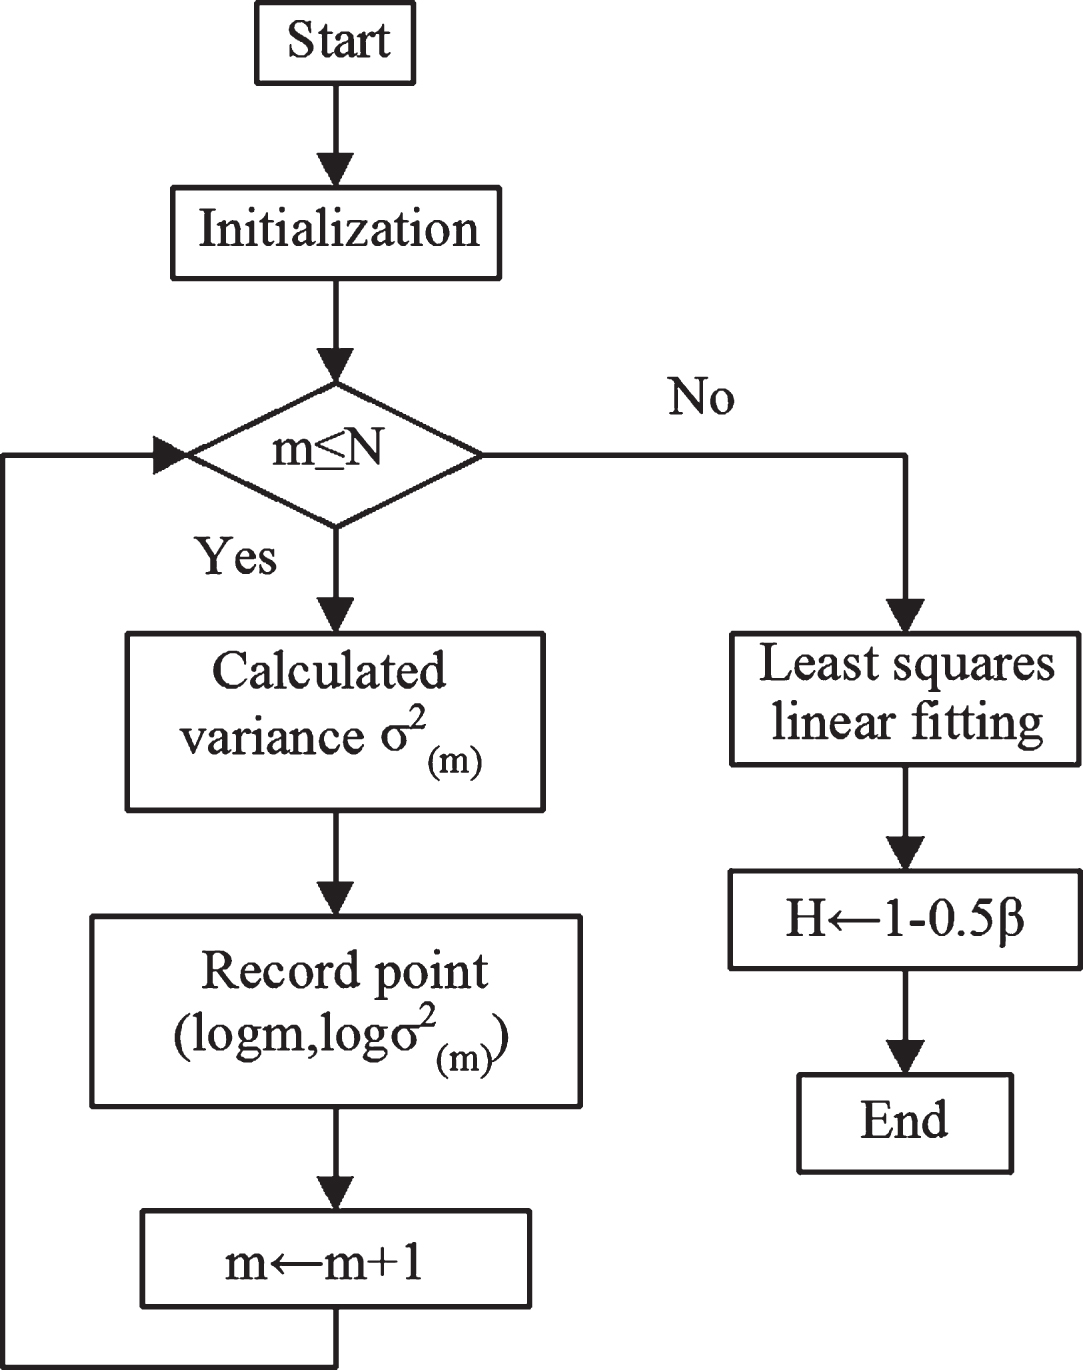
Flow chart of variance time method.
When the model of the source ON/OFF cycle duration is presented as the heavy tailed distribution, and the generated flow of the source is independent distribution, the synthetic flow will show a significant correlation. Then it is assumed that the ON/OFF model has only one source generated flow, the synthetic traffic is also a long-range flow. This shows that as long as neither the single flow nor the synthetic flow satisfies the independent heavy tailed distribution, the synthetic traffic must be a long correlation. According to the formula (21), the first item has not been added in the condition of heavy tailed distribution, and the second item can only make the non-additive property of the self-covariance function of the synthetic traffic more obvious, c (n) is must not be added. According to this conclusion, for the heavy tailed distribution, as long as the source is not independent and has certain relevance, the synthetic flow will be the long-range correlation.
According to the convergence of the network, assuming that the flow waveform generated by each terminal is approximately the same, there is only a delay in time. According to this hypothesis, in combination with the structure of ON/OFF model in Fig. 4, the delay unit of the flow rate of a ON/OFF source is 0, n, 2n, 3n,⋯, and Nn. After each delay, the flow rate is compared to a terminal generated flow, and the final convergence flow is superimposed by the original flow and delay flow. Because of the time delay of the delay flow and the original flow, there is a certain correlation between each other. According to this feature, the traditional ON/OFF can be improved, and the improved model is named as the C-ON/OFF model, in which C represents the convergence. The structure of C-ON/OFF model is shown in Fig. 8.
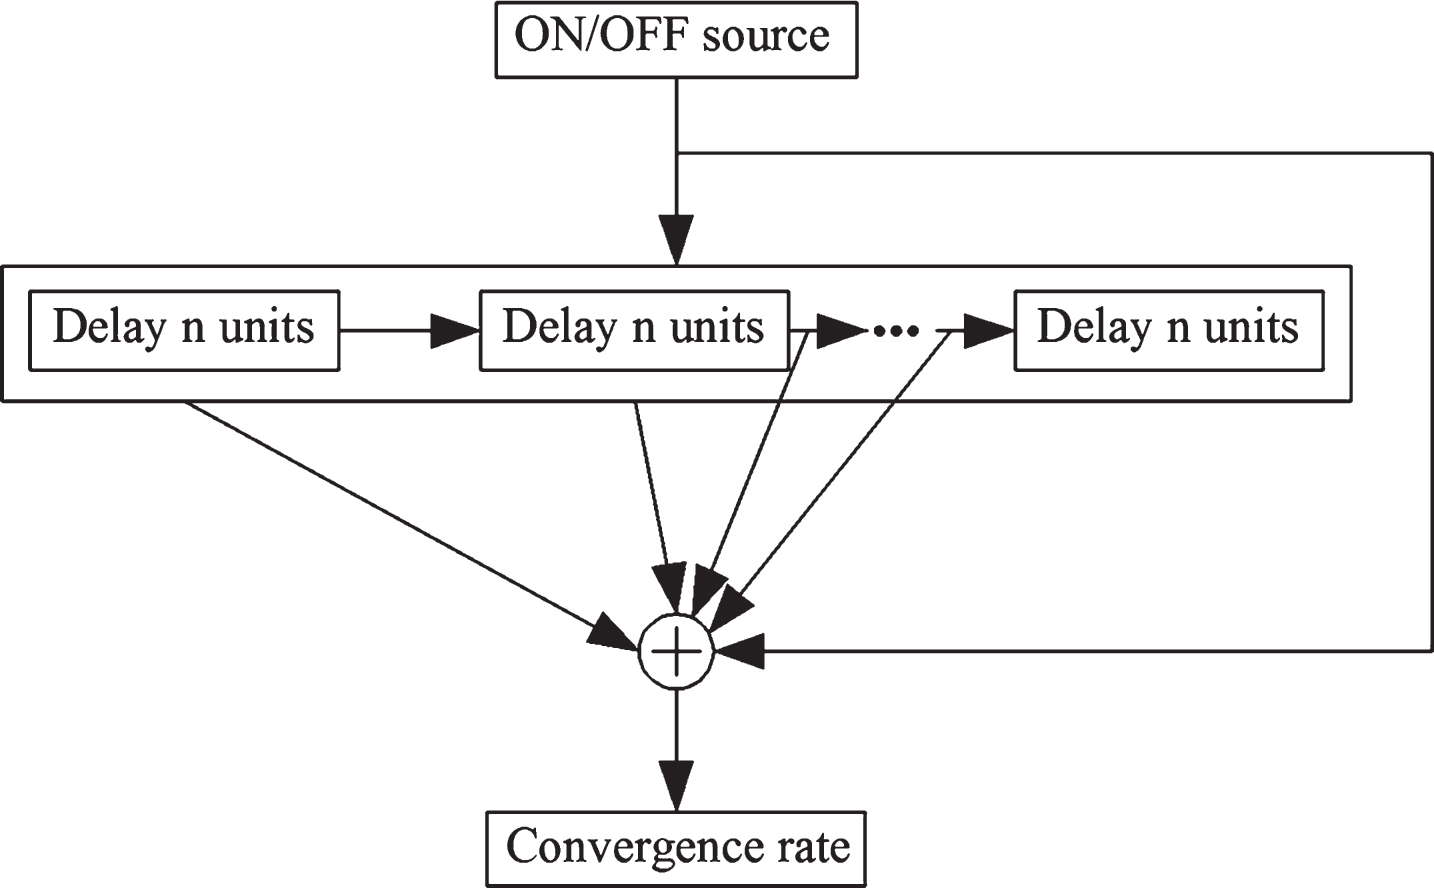
Structure of C-ON/OFF model.
In the structure of the C-ON/OFF model, the N delay unit is added after the ON/OFF source. The delay time of each delay unit is identical to the n time unit, then the number of traffic stack is N + 1, and the final flow rate is obtained. In the model structure, n and N are the parameters which have the actual meaning, n means the reaction time of the user network behavior in the process of the consistent process, and N means the number of users.
In order to study the properties of the generated flow of the C-ON/OFF model which is new constructed, the normalized self-covariance method is used to carry out the comparative experiment. Through the analysis of simulation results, the validity and practicability of the model are understood. The parameter n of the contrast experiment is set to n = 0 and n = 1, respectively. Its influence on the network popular properties is studied in the case of their parameter settings, that is, through the fixed parameters to observe the changes of the parameter N. By using the normalized self-covariance method, it is able to understand the change of the flow. The comparison of the experimental results and the ON/OFF flow and the difference before and after convergence of the delay unit, and the results are shown in Figs. 9 and 10.
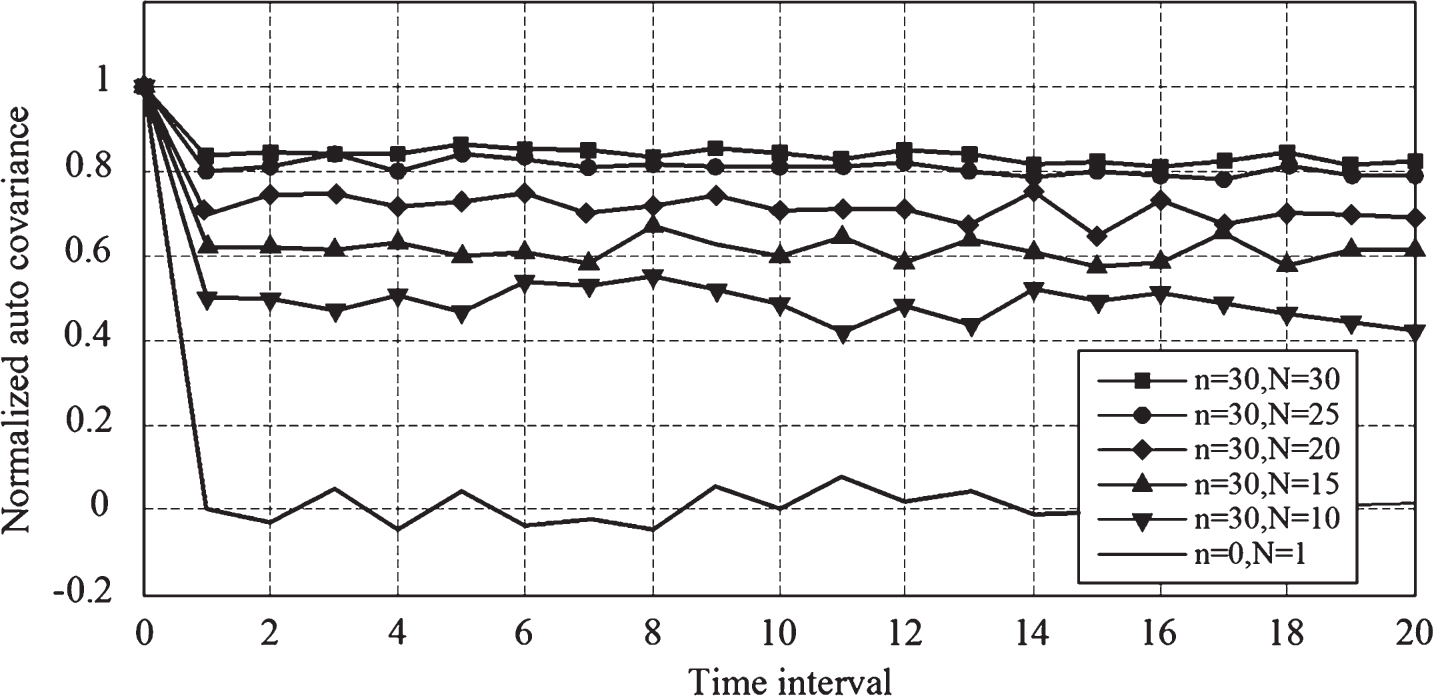
Normalized difference of C-ON/OFF model with N value.

Normalized difference of C-ON/OFF model with n value.
In the results of simulation experiments of two groups shown in Figs. 9 and 10, the curve with n = 0 and N = 1 is the normalized self-covariance of the single ON/OFF source traffic generated before the delay unit, and the remaining curves represent the normalized elf-covariance difference of the traffic generated by the C-ON/OFF model after the delay element. It can be seen from the curve of the graph, the decay rate of the curve is gradually slow down, but when the time interval is more than 2, the curve attenuation is almost nonexistent. Specifically, in Fig. 9, the attenuation rate of normalized elf-covariance difference of the generated flow in C-ON/OFF model gradually slows down with the increase of N. The decay rate is very obvious when the curve parameter N is less than 5, but when it is 25 or 30, the decay rate of the curve is not so obvious. It can be seen that there is an upper bound on the variation of the normalized elf-covariance difference based on the parameter N, which is not affected by the range of the parameters. Therefore, in the process of using the C-ON/OFF model, the N value is best to choose between 10 ∼ 25. The N value can be used as the coarse tuning parameter of the model, which can be used to select the approximate attenuation velocity of the normalized elf-covariance difference.
In Fig. 10, when the N value is fixed, except for a big case in some time intervals, the decay rate of the normalized self-covariance generally slows down with the increase of n. This also shows that the change of n is not obvious when N is fixed. When selecting parameters, the n can be used as the fine tuning parameter for the fine tuning of the network flow rate.
In order to further validate the parameters and the normalized self-covariance, the value of the Hurst parameter is used to calculate the normalized self-covariance of the flow generated by the experiment, the calculation results are shown in Tables 1 and 2. It can be seen that the flow rate decreases with the increase of mean value, which shows its obvious long-range characteristic. The data of the last column also show that the flow rate of a single ON/OFF source in exponential distribution also has a significant short correlation, and Hurst parameter values also prove this point. In Tables 1 and 2, the values of Hurst parameter decrease with the gradual decrease of n value (or N value), but the parameter value is always greater than 0.5, which shows that the model after the delay of the C-ON/OFF model is a long related flow. In addition, the average value of the normalized self-covariance is also shown to decrease with the decrease of n value (or N value) as well as the Hurst parameter.
Statistical results of flow generation and Hurst parameter values under different parameter conditions
The statistical results of the normalized self-covariance of the traffic flow under different parameters and the Hurst parameters
The ON cycle probability distribution of the ON/OFF source in the model is set to Pareto distribution (The parameter setting is in Table 3, “√” means the need to set the parameters, and “×” means no need to set the parameters). According to the distribution characteristics of the infinite variance, it can be seen that ON cycle shows high variability because of the lasting of its duration, and the data packets is further generated at a fixed rate, which also shows high variability. Flow waveform will show high variability, and C-ON/OFF model generated by the traffic also has high variability.
C-ON/OFF model parameters
Table 4 is a comparison of several very common network traffic models in the study of network traffic. It respectively conducts the comparative analysis from the three aspects of the appearance, physical significance and complexity of the flow. According to the comparison results, when the network traffic model has the characteristics of long-range relevance, the C-ON/OFF model has the advantage in the aspects of whether the appearance is close, the physical meaning of the model and the complexity of the model.
Comparison of several common models
The improvement of traditional network traffic model is made based on time series. The specific fusion of ON/OFF source correlation is conducted on the basis of the classical ON/OFF model, so as to realize the long correlation properties of ON and OFF under the condition of light tailed distribution, and construct a new traffic model of C-ON/OFF network. In order to study the properties of the generated flow of the C-ON/OFF model, the normalized covariance method is used for the comparative experiment, and the validity and practicability of the model are analyzed through the analysis of the simulation results. Through the comparison of value and value of different parameters, it can be seen that when the duration of the ON and OFF cycles is light tailed distribution, the synthetic flow has the long-range property; When the duration of the cycle is heavy tailed distribution, the self-similarity of flow will increase because of the correlation between the sources, and the Hurst parameter value is increased. And when further verifying the relation of parameters and the normalized self-covariance based on the Hurst parameter value, it can be seen that the flow attenuation rate decreases with the increase of the mean, which shows its obvious characteristics. From the comparative analysis of the results, it is concluded the C-ON/OFF model of network traffic based on time series has a greater advantage on the aspects of the LRD, physical meaning and complexity compared with the traditional model, which can be applied to the design of the specific network traffic monitoring system.
Footnotes
Acknowledgments
This work has been mainly supported by NSFC (No. 61272510), a cooperation project with scientific research project in Education Department of Shaanxi Province Government (No. 14JK1825) and Science and Technology Project of Yan’an Municipal Government (No. 2014KG-09).