
Abstract
Optic disc (OD) detection is an important step in a number of algorithms developed for automatic extraction of anatomical structures and retinal lesions. In this article, a novel system, eye gaze– based OD detection, is presented for detecting OD in fundus retinal image using the knowledge developed from the expert’s eye gaze data. The eye gaze data are collected from expert optometrists and non-experts group while viewing the fundus retinal images. The task given to them is to spot the OD in fundus retinal images. Eye gaze fixations were used to identify the target and distractor regions. The image-based features were extracted from the identified regions. The top-down (TD) knowledge is developed using feature ranking and fuzzy system. This TD knowledge is further used for building the TD map. The success rates for various standard datasets are: DRIVE dataset, 100%; DRIONS-DB, 98.2%; INSPIRE, 97.5%; High Resolution Fundus Images, 100%; DIRECTDB0, 96.9%; ONHSD, 91.9% and STARE, 81.4%.
Introduction
Optic disc (OD) has a bright yellowish colour with a whitish central cupping. From this cupping, the central retinal artery and vein pass, as shown in Fig. 1. Detection of OD is an important pre-processing element in a number of algorithms, thus dependable and effective OD localization is an important step in ophthalmic image processing. It is also an important step in classifying other fundus structures [1]. Location of OD can be used for vessel tracking and registering changes within the OD region. OD localizing is essential for identification of some diagnostic marks for hypertensive retinopathy and in diagnosis of glaucoma.

Digital fundus image of the human eye [2].
Optic disc detection is a fundamental step for the diagnosis of other general and pathological characteristics. For instance, in macula recognition, OD position plays an important role. The chances of diabetic maculopathy lesion detection can be improved by concealing the false-positive OD region. In glaucoma detection, the measurement of varying OD-to-cup diameter ratio is used. Vessel-tracking methods start from the OD. There are many OD localization techniques proposed in literature.
Wisaeng et al. [3] propounded a method to automatically locate OD. Colour normalization, contrast enhancement and noise removal are carried out as pre-processing steps. The OD detection algorithm is based on mathematical morphology and support vector machines. Godse & Bormane [4] has proposed an automated system to spot an OD and its centre in all kinds of retinal images. Thresholding is used to find out candidate regions. Density criterion is used to find out the OD region. Mendonc et al. [5] use blood vessel network and intensity data to locate OD. In this, entropy of vascular directions is used. Lu and Lim [6] proposed a technique that uses the exclusive circular brightness structure associated with the OD. A line operator is used to identify a circular brightness structure. The orientation of the line segment with the minimum/maximum variation has specific patterns, which can be used to accurately spot the OD. Kulkarni and Amudha [7] proposed a technique to study the relevance of the computational saliency model for OD detection in retinal images. In this method, saliency maps are computed using Itti– Koch model. Thereafter, mathematical morphology and Otsu’s algorithm are used on the saliency map. The resulted images convincingly show OD detection. Khalid et al. [8] propounded a method for OD and optic cup segmentation. In this method, region of interest (ROI) cropping and colour channel analysis are carried out. Then, fundus images are used to determine the minimum, mean, and maximum values for the colour channel analysis. The fundus images are filtered using the green channel because of its good contrast than other colour channel. Dilation and erosion morphological operations are used to remove the blood vessel inside the OD and smooth the intensity profiles around the centre of OD.
Muntasa et al. [9] propounded a hybrid approach for the OD detection in retinal images. Blood vessels are filtered from retinal images using homomorphic and median filtering. Canny detection algorithm is used for edge detection because it is an optimal edge detection algorithm. To find circular shape in a retinal image, the edges of the image are extracted. OD detection is carried out using Hough transform. Niluthpol et al. [10] suggested an algorithm to automatically detect OD and blood vessel of retinal image. The pre-processing is carried out by global thresholding method. A global threshold is ascertained by utilizing Otsu method. Morphological operations are used to obtain complete OD region. Dehghani et al. [11] proposed a technique that uses histogram matching for localizing the OD and its centre in the presence of pathological regions. Four retinal images from DRIVE dataset were used to create three histograms from the colour image components (red, blue and green) as a template. The next step included extracting the OD for every retinal image using a window with a typical size of the OD. Then a template was created by obtaining a histogram for each colour component for each OD and calculating the mean of the aforementioned histograms. Finally, thresholding was applied on the correlation function to localize the centre of the OD.
Fraga et al. [12] presented a methodology for the OD segmentation containing different stages. To decrease the contrast variability and increase the process reliability, the retinal image was normalized by the retinex algorithm. Finally, the histogram information was included to measure the accuracy of segmentation. Tjandrasa et al. [13] applied Hough transform as a primary level set for the active contours for OD segmentation. The blood vessels are removed in the next step to facilitate the segmentation process. The threshold is applied to detect the low pixel values in the image followed by applying the median filter to blur the blood vessels. The next step in OD segmentation is detecting a circle that matches the location of OD by performing a Hough transform. Subsequently, an active contour model is used to obtain the OD boundaries that are as close to the original OD boundaries as possible.
As given in the literature survey, the OD detection is mostly based on the image-processing techniques. This article proposes an eye gaze– based optic disc detection (EGODD) system. In the proposed system, aim is to detect the OD using eye-gaze tracking along with image-processing technique. The novelty of the proposed method lies in using top-down (TD) knowledge which developed from experts’ eye gaze for OD detection.
Proposed system
The graphical representation of the suggested system is represented in Fig. 2, which gives an overall system view. Figure 3 demonstrates the block diagram of the EGODD system. The system is organized into six units: the input unit, database, EGDPA (Eye Gaze Data Processing and Analysis), ALRIEGA (Automatic Labelling of Retinal Images using Eye Gaze Analysis), FETDKB (Feature Extraction and Top-Down Knowledge Building), and Test unit.

Graphical representation of the proposed EGODD system.

Block diagram of EGODD system.
The eye gaze data were collected from expert optometrists (4 participants) and non-expert group (10 participants) using the SMI iView X RED-m eye tracker [14]. The stimuli images used in the experiment are a subset of DRIVE [15] (15 images) and STARE [16] (10 images) datasets. The images were shown to the participants one by one on the monitor and their eye gaze data were gathered using the eye tracker. The task given to them was to locate the OD in fundus retinal image and look at them until next image will display.
Database
The eye gaze data collected from experts and non-experts group were stored separately in a database.
Eye gaze data processing and analysis
The eye gaze data processing includes removal of artefacts and blinks from eye gaze data and eye gaze feature extraction. The set of eye gaze features such as number of fixations, duration of fixations in the ROI, number of dwells in ROI, pupil diameter and dwell time in ROI were extracted from the collected eye gaze data, as given in Kulkarni and Amudha [17].
Automatic labelling of retinal images using eye gaze analysis
The ALRIEGA unit is used for automatic labelling of the target or attractor’s regions. The attractor’s and distractor’s regions were identified using the eye gaze fixations. The attractor’s regions were identified using expert’s eye fixation data and the distractor’s regions were identified using non-experts gaze fixations. The algorithm used for region identification using eye gaze data is given in Kulkarni and Amudha [18].
Feature extraction and top-down knowledge building
The FETDKB unit contains image feature extraction and fuzzy system to build TD knowledge. The choice of image features in EGODD system is based on the human visual perception. The computation models are biologically motivated models [19], which help to predict human perception. A number of computational attention systems aim at the study of mainly three features: intensity, orientation and colour [20–22]. Reasons behind this choice are that these characteristics belong to the basic ones suggested in psychological and biological works [23–25] and that they can be relatively easily computed. This evidence from psychological and biological works forms the basis for selection of features in this system.
The low-level characteristics like colour, intensity and orientation were extracted from the attractor’s and distractor’s regions. Along with the colour feature map for red, green, blue and yellow, other maps called colour opponency maps for red-green (RG), blue-yellow (BY), and their complements green-red (GR) and yellow-blue (YB) were extracted. The orientation maps were computed using oriented pyramids. Log Gabor filters were used for obtaining the different orientation maps [26]. The orientation pyramid consisted of four pyramids: one for each orientation 0°, 45°, 90° and 135°. A total of 13 features were extracted. The feature extraction follows the methods described in references [20, 27].
Top-down knowledge
Feature ranking was used for creating TD knowledge and fuzzy system was used for building TD map based on the TD knowledge. The feature ranking was used on the extracted image features from the attractor and distractor regions. The purpose behind ranking the features was to identify the sequence of features contributing to classification of the attractor’s regions and distractor’s regions. For ranking, 100 samples of the attractor’s regions and 250 samples of the distractor’s regions were used. This ranking would yield the most important features. The ranker search method with InfoGainAttributeEval in WEKA was used for ranking, as shown in Fig. 4.
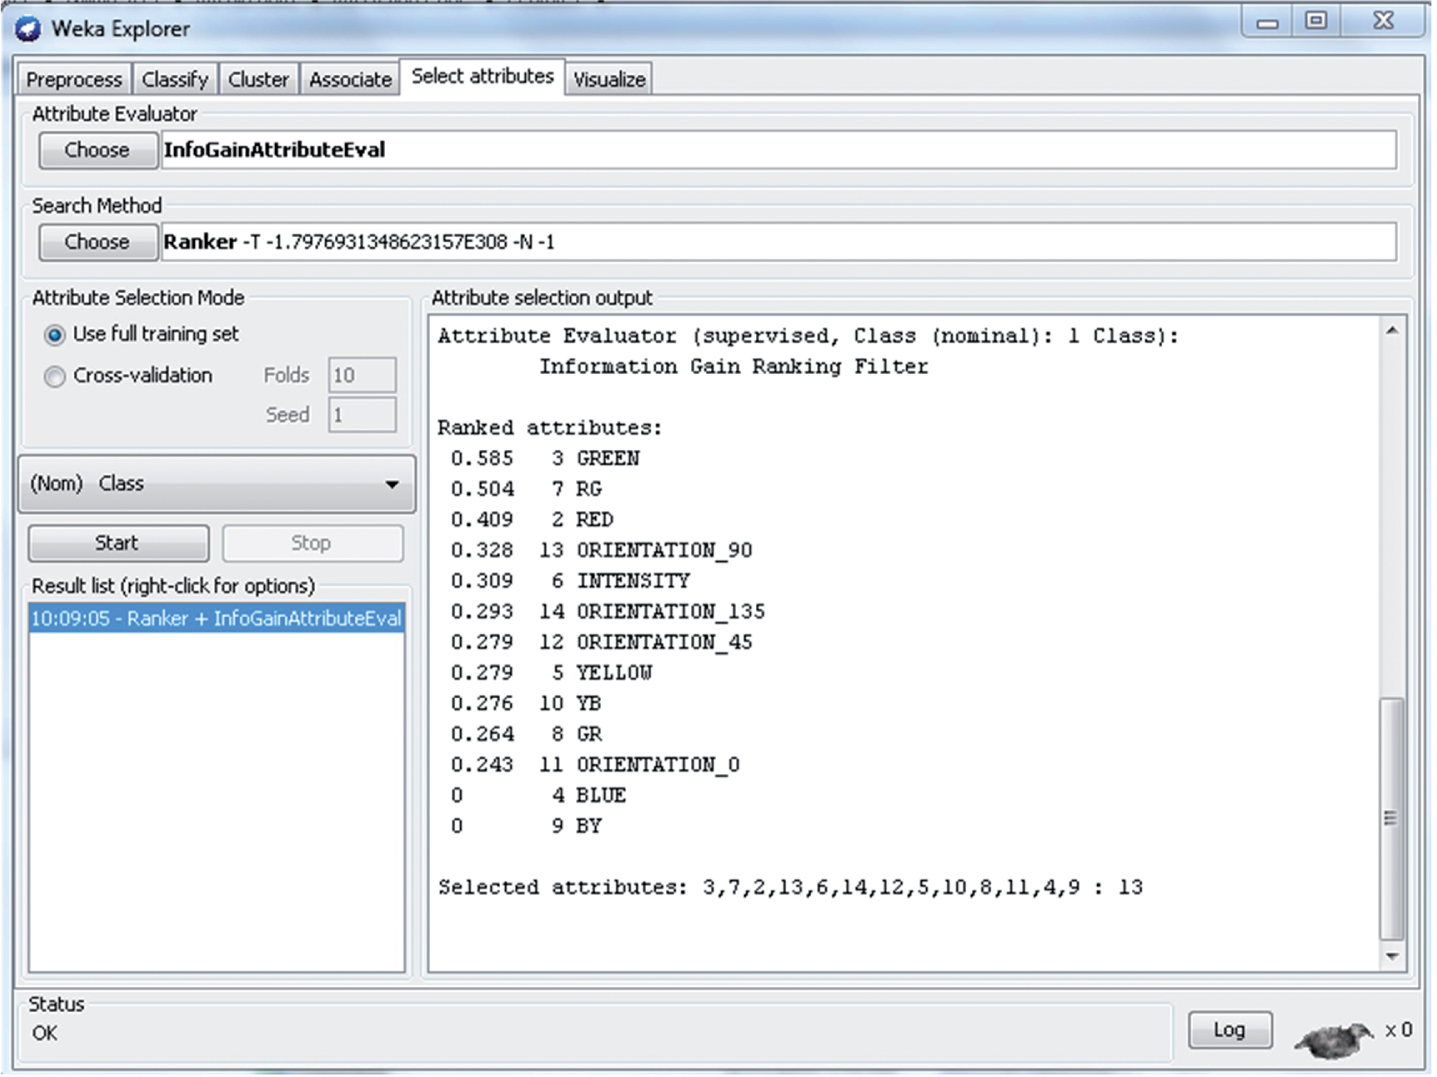
Result of InfogainAttributeEval with ranker search method using WEKA.
The fuzzy inference was used in this system to compute the values for feature maps for building the TD map. The fuzzy inference system has 13 input variables and 13 output variables representing a single pixel value, as shown in Fig. 5. All the input and output variables have three membership functions represented by small, medium and large linguistic variables. Triangular membership functions are used as they are suitable to represent pixel value. The range of the values of the pixels is 0–255. This range is divided into three for assigning to the three membership functions. The range 0–100 belongs to the membership function small, 50–200 to the membership function medium and 150–255 to the membership function large. The rules are written using if or then statements, as given in Fig. 5. The output of the system is 13 maps. These rules are written such that output features have values based on the feature ranking given in the previous step. The feature with high ranking will give higher weightage that is it has large membership value. For example, in Fig. 4, the green feature has a high ranking, so even if in given input image the green feature weightage is low, fuzzy inference system will assign large membership for the green feature. The feature maps are rearranged based on feature ranking and given to the fuzzy system. The fuzzy system will assign higher values to the features according to sequence. The first five features in the input are assigned with large values, the next four features are assigned with medium values and the last four features are assigned with low values. The TD knowledge is generated in the form of identifying the ranking of the features and assigning weightage (values) to the features according to ranks. The TD map is created by finding the difference between maps (Equation (1)).
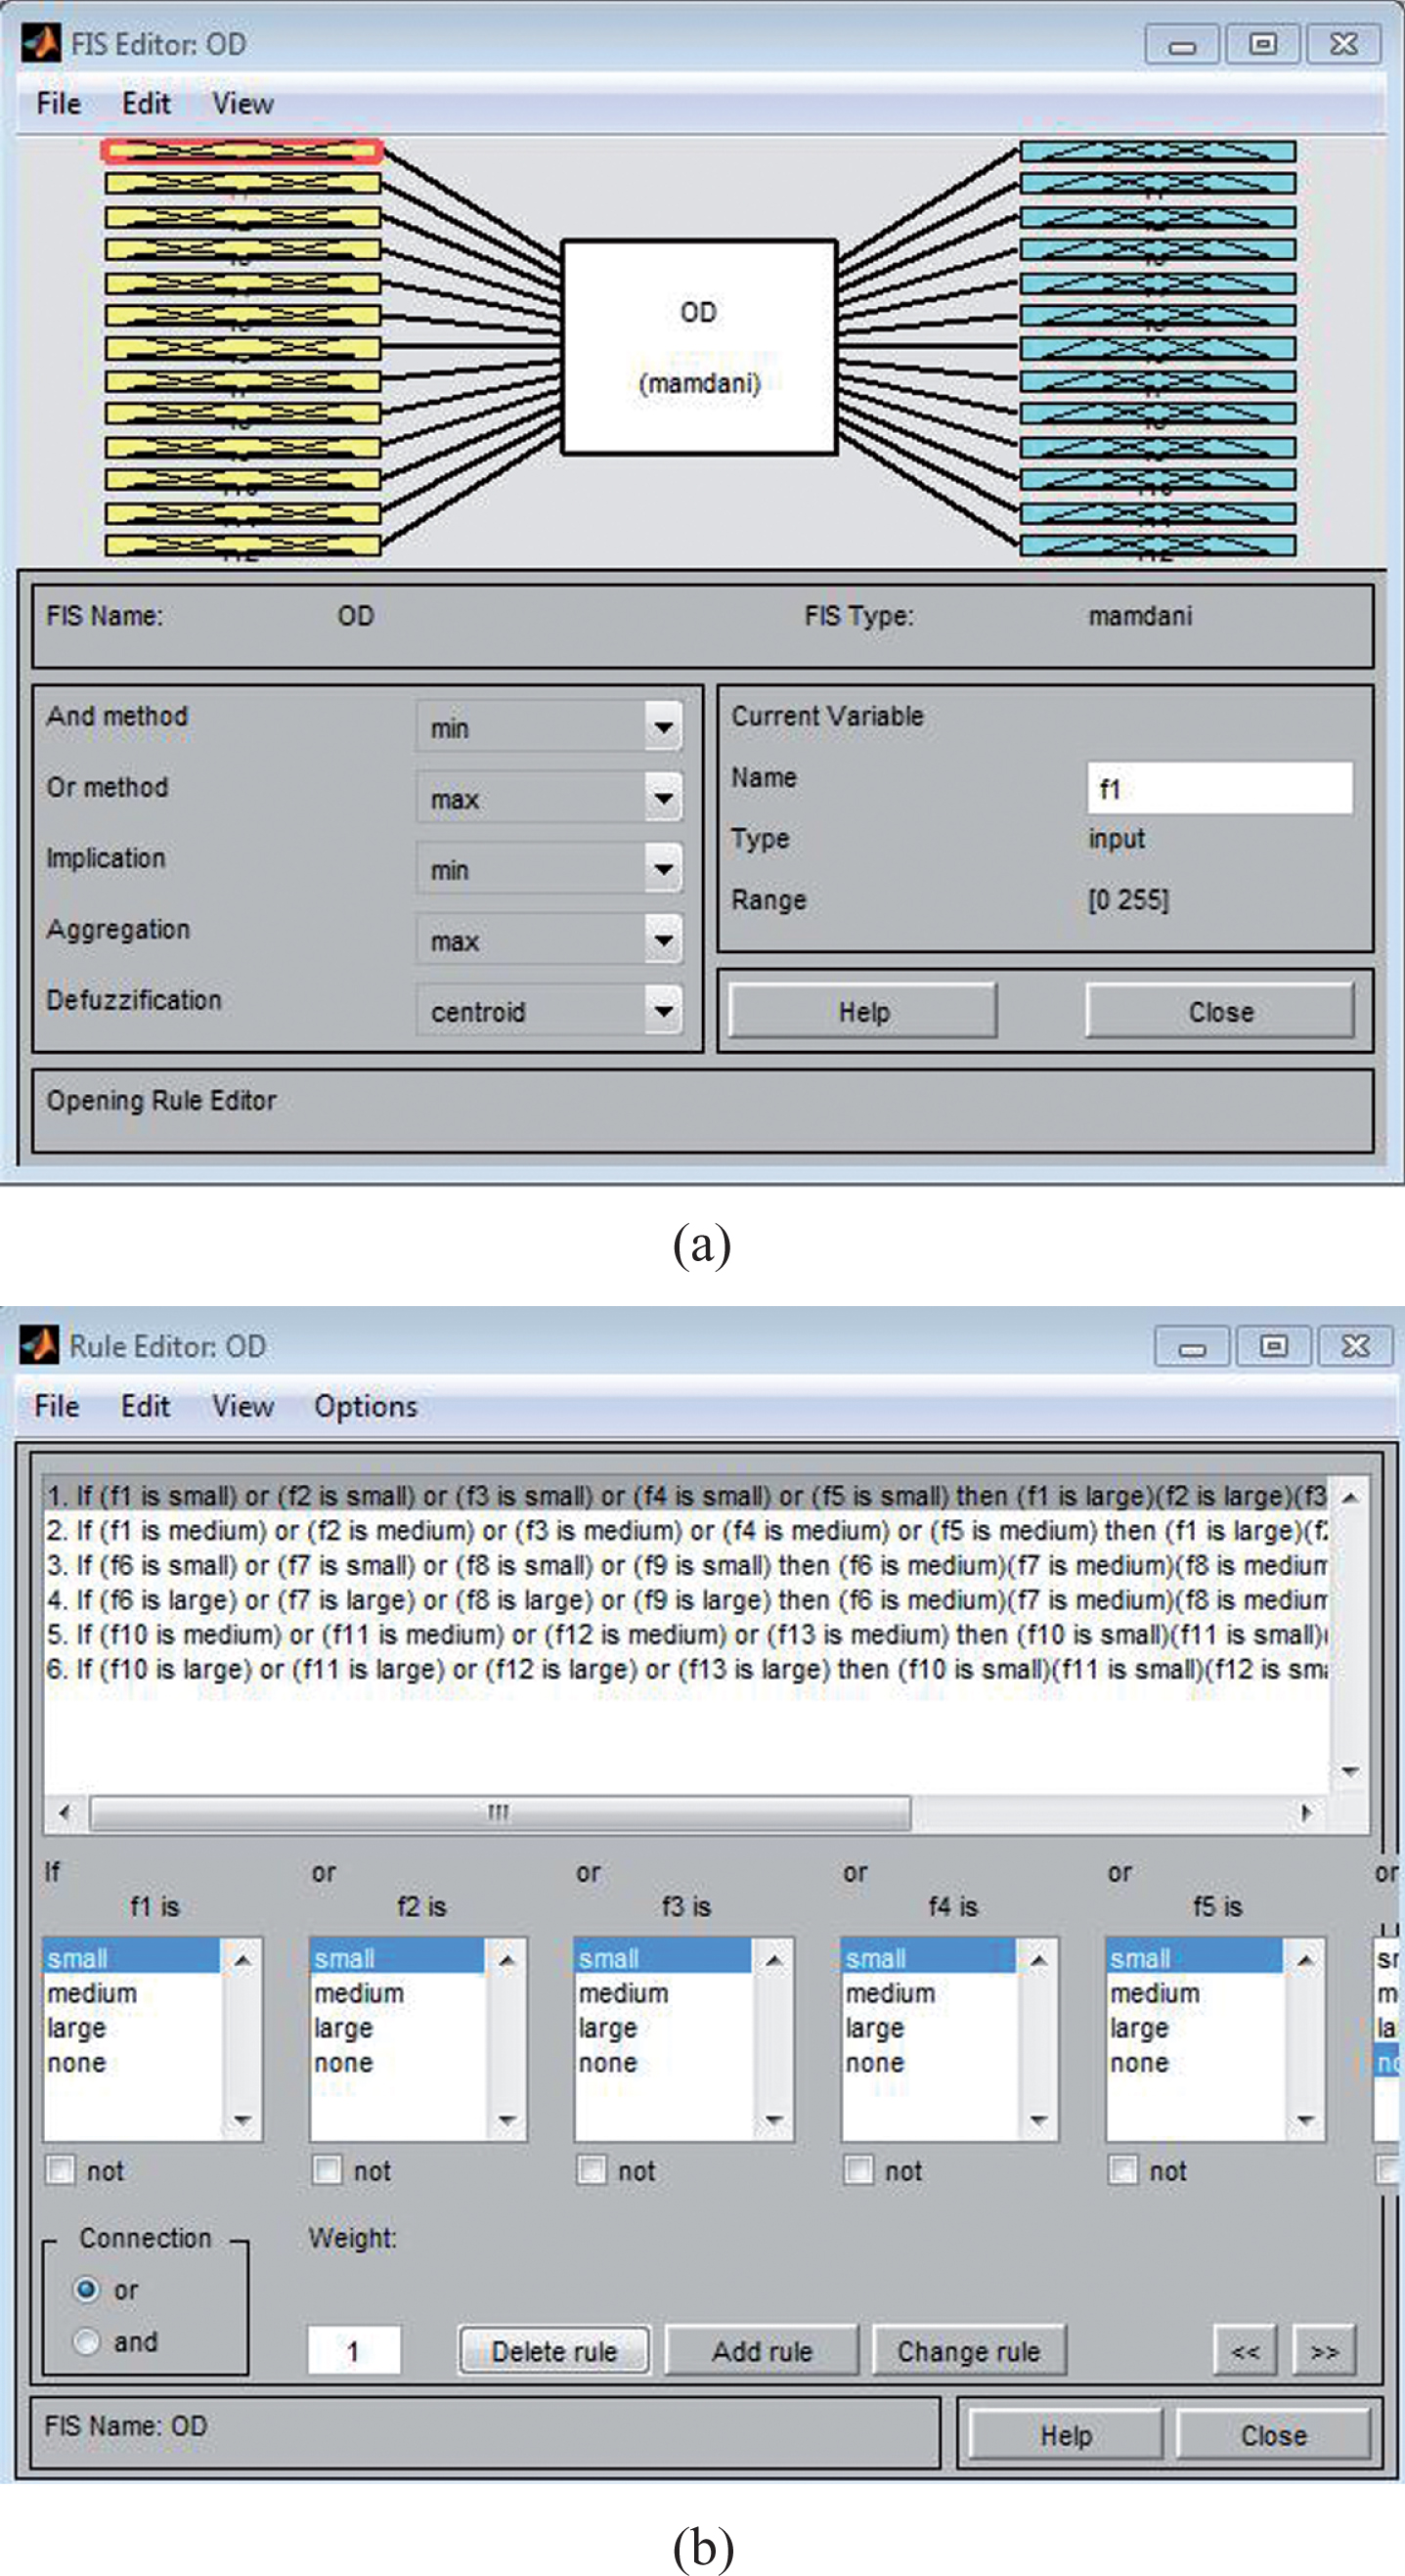
(a) Fuzzy inference system and (b) Fuzzy system rules for EGODD system.
The OMap1 is the output map 1, OMap 2 is the output map 2 and so on.
Initially, the bottom-up map (BU map) is computed from the input image. Conspicuity maps are computed by summing up the feature maps corresponding to each feature. The colour conspicuity map is the combination of RG, BY, GR and YB feature maps. The intensity conspicuity map is same as the intensity feature map. The orientation conspicuity map is obtained by adding the feature maps for all the four orientations. To get the BU map (Equation (2)), all the conspicuity maps are summed and normalized to the range of 0–255, as given in [20].
This unit takes the input as fundus retinal image and calculate two maps: BU map and TD map. The working of test unit is shown in Fig. 6. The BU map is built from BU features and the TD map is calculated from the output of the fuzzy system. The steps include:
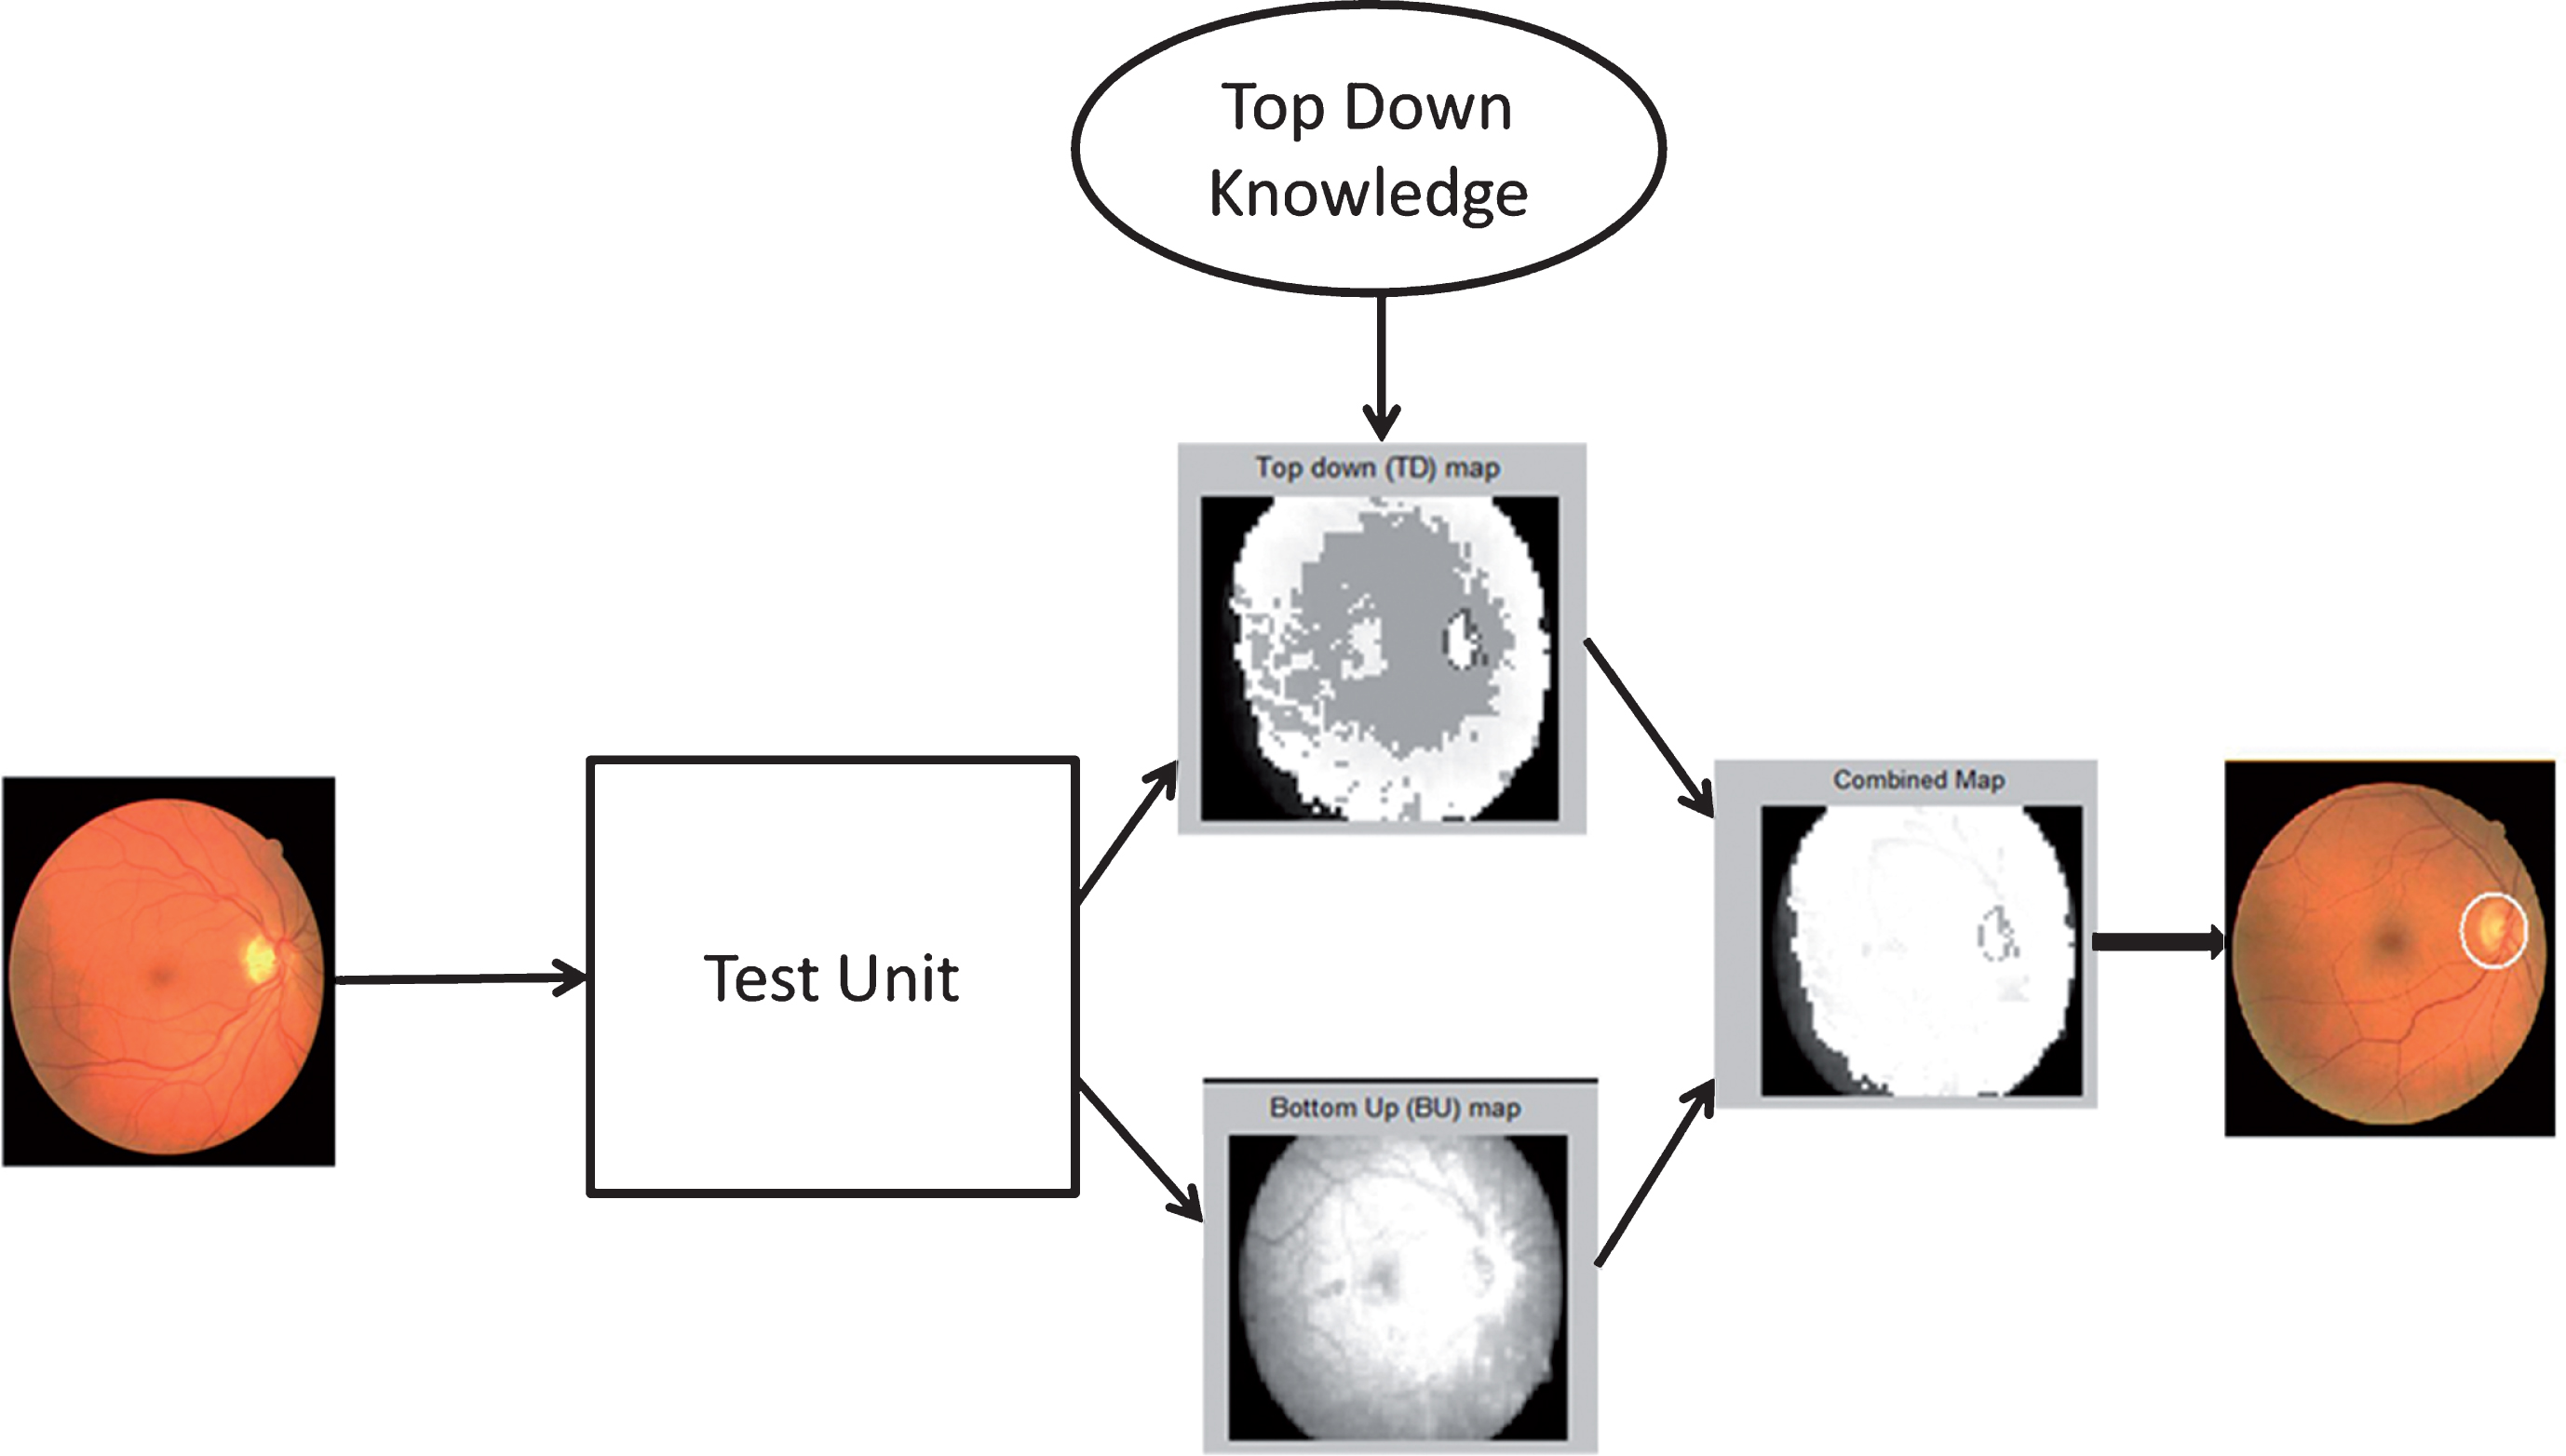
Working of test unit in EGODD system.
Read the input test image.
Calculate BU map based on colour, intensity and orientation features.
Calculate TD map. This map is built using TD knowledge.
Calculate the combined map using the following:
Identify the most salient region.
The TD map is created by using the fuzzy system explained above. The BU and TD maps were combined to get the combined map. Figure 7(a) shows the snapshot of a graphical user interface created for the system. Figure 7(b) shows the examples of BU, TD, and combined maps. The system is implemented using MATLAB. The fuzzy inference system is designed using the Fuzzy Toolbox in the MATLAB.

(a) Snapshot of graphical user interface created for the system. (b) (Leftmost) Bottom-up map, (centre) top-down map, and (rightmost) combined map.
The algorithm was tested on the many fundus retinal images datasets. Table 1 shows the results. The performance was measured in terms of success rate. The system proposed here has 95% and 97.5% success rates for DRIVE and INSPIRE datasets respectively. For High Resolution Fundus Images, STARE and Diaretdb0 datasets, the observed success rates were 91.48%, 72.83% and 88.46% respectively. Similarly, the performance was measured in terms of the number of average hit. The hit number shown in image I for target t is the rank of the focus that hits the target in the order of the saliency; for example, if the second focus is on the target, the hit number is 2. The lower the hit number, the better the performance. The average hit number for the dataset is the arithmetic mean of the hit numbers of all images. The average hit number is computed for each dataset separately, as shown in Table 1. The number of first hits for different datasets is computed. The number was converted into percentage so that comparison could become easy for different datasets with different number of images.
Results of EGODD system
Results of EGODD system
The EGODD system is evaluated using additional eye gaze data. The data is collected from expert optometrists and non-expert groups. A total of 95 fundus images were used as stimulus images for eye gaze data collection. Again, complete procedure for data collection was repeated. The data were collected using SMI iView X Red-n eye tracker device. The automatic labelling of the regions in fundus retinal images was carried out using the procedure given in [18].
The 369 attractor’s regions and 736 distractor’s regions were identified using experts and non-experts eye fixation data respectively. The Feature ranking was again carried out for 469 attractor’s region samples and 986 distractor’s regions in total. The TD knowledge was generated, in the form of rearranging the features according to a new ranking. The test unit procedure was repeated for all images in each dataset.
The performance of the proposed algorithm was tested using two measures: success rate and average overlap. The region-based segmentation accuracy was calculated using Equation (3). The performance was evaluated by measuring the overlapping degree between the true optic disc regions and the regions obtained by utilizing the proposed method using the technique propounded by Lalonde et al. [31]. The authors used an overlapping score S, which is defined to calculate the common area between a true OD region T and a detected region D as
Table 2 displays the success rate results obtained by EGODD system. Table 3 shows comparison of performance of the EGODD system with existing systems for OD detection. Results reveal that the proposed EGODD system performs comparatively better in most of the cases.
Results of EGODD system
Comparison of performance of the EGODD system with existing systems for optic disc detection
The result of STARE dataset is 81.48% which is comparatively less. The reason behind is, for some images in STARE dataset (Fig. 8) the OD region is not visible, for such images EGODD system fails to detect OD.
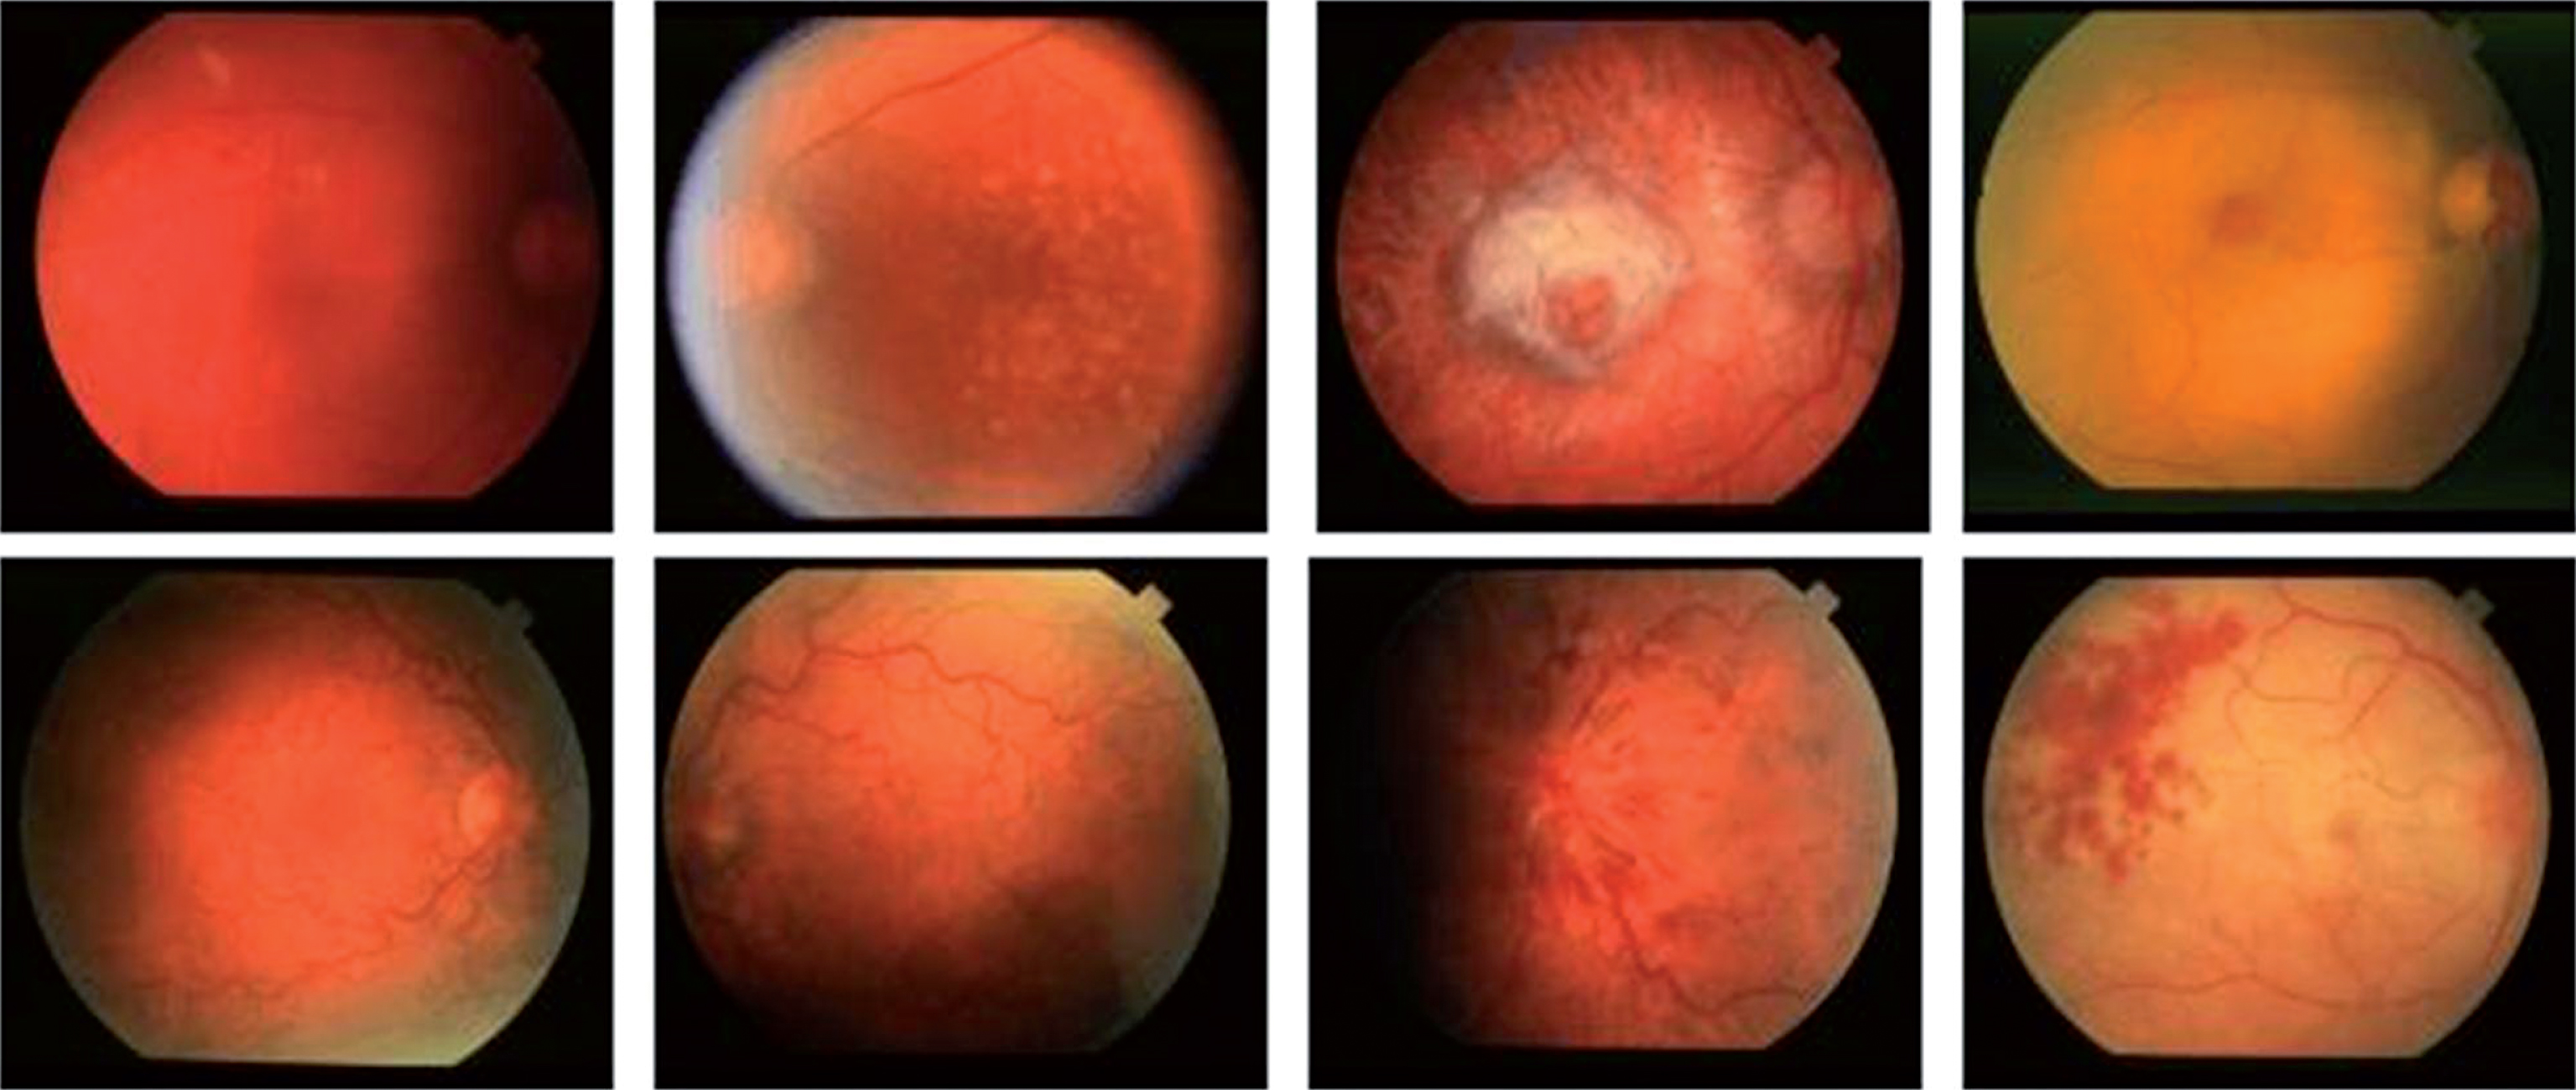
Example images from STARE datasets.
Table 4 shows comparison of average overlap of the EGODD system with existing systems. It can be observed that the suggested EGODD system achieves an excellent overlapping score. The average overlap for other system was taken from reference [37]. The ground truth for DRIVE, STARE and DIRECTDB 0 are taken from reference [32] and that for DRIONS-DB and ONHSD is taken from [33, 34].
Comparison of average overlap of the EGODD system with existing systems
In this article, a unique system for OD detection is proposed. The alternate path for OD detection based on eye-gaze tracking is investigated. Here, a coherent system is proposed that uses the knowledge developed from experts’ eye-gaze pattern along with the image-processing technique. Feature ranking is used to identify the features that play an important role for classification of the attractor’s (i.e. target) and distractor’s regions. The fuzzy system is used to give higher values for the features with higher ranks. The strength of the proposed algorithm lies in using knowledge developed from experts’ eye-gaze and non-experts’ eye-gaze patterns. This method works reasonably well for OD detection. The results can be improved by collecting eye-gaze data from both groups for higher number of fundus retinal images. The approach presented here for OD detection can be extended to any target detection algorithm.
Footnotes
Acknowledgments
The authors are grateful to all the participants. They are also grateful to SMI iView X for providing the eye tracker.