
Abstract
Online social networks like Instagram has more than 600 million users and creates over 300 million new posts every day. All those data can be used to detect real world events. Many works have been proposed in the literature to detect such events using different techniques, but this task is still hard. It involves many challenges including the processing of large volumes of data, the lack of a ground truth and the need for an adaptive approach. In this sense, our work attempts to tackle these problems with a semi-supervised learning approach to overcome those challenges using times series from Instagram posts. Experimental studies demonstrate that similar time series can be used to generalize the knowledge and predict the occurrence of an event. Also, we demonstrate that Support Vector Regression is a good alternative to Gaussian Process Regression as the first provides good results using much less computing resources than the second. Moreover, we made our labeled dataset public, hoping it can be useful to other researchers as well.
Introduction
The advancement of new technologies, the popularization of the internet, and the reduced prices of the mobile devices have helped the proliferation of applications in this new Web 2.0 era. These applications, especially in mobile platforms, has created a massive amount of data through user-friendly free tools for messages, photos, and videos, mainly within the context of social networks (e.g., Facebook, Twitter, and Instagram 1 ). These latter are the most used applications because people have been sharing their experiences and opinions across social networks, daily. Several works have been proposed in the literature focusing on online social networks to solve real-world problems such as tragedy prediction, natural disasters, epidemics, and crime prevention [1, 30].
The importance of social networks in people lives might be evidenced by metrics that show Facebook with almost 1,6 billion active users 2 . This amount is near 1/5 of the world population 3 . It makes Facebook the biggest online social network (OSN) in the world and generates more social referrals news than Google 4 . Another popular application is Instagram, which has more than 600 million 5 active users along with Twitter with almost 320 million, generating together over 500 million new posts every single day [3].
Most of the massive data create by social network users (e.g., images, texts, metadata, and geolocation) can be easily accessed through web-crawlers systems or public APIs. Monitoring and analysis of these data might provide valuable information and make possible a variety of work performed by practitioners and researchers.
In the literature, data streams from social networks have been used by researchers to identify validly, novel and potentially useful patterns [12, 24]. Instagram, for example, is used in different tasks such as to analyze user behavior [21], to discover and report local news [31] or to detect local media content [14]. In the recent researches using online social network data, for instance, the use of Instagram to detect events in real time [34], but the idea of being able to detect and report such occurrences is not a trivial task.
There are several challenges in event detection tasks, for instance, the high seasonality of the volume of posts during a period requires algorithms capable of doing nonlinear predictions, which are more complex. Another challenge is related to the absence of a trustful dataset [22] to measure the performance of the algorithms that make the benchmark comparisons more difficult and biased. Finally, as a massive data stream, social networks require a high computing power which makes some experiments not viable.
In this sense, we propose a novel adaptive framework to detect candidate local events in real-time through a semi-supervised learning approach. This framework first collects data from a social network (in our case, Instagram), creates a set of time series, applies different unsupervised and supervised learning techniques (e.g., clustering and regression techniques), then, in a 15 min interval presents the candidate events from a specific geographic sub-region.
Furthermore, in this work, we apply Pearson correlation to group times series from different geographic sub-regions and use it as inputs for a regression technique. Thus, it is to possible reduce the number of processing required to model all of the target sub-regions. Besides the framework and the proposed semi-supervised learning approach, our work also includes an analyze of different parameters for the creation of the time series and manually classification of more than seventy-five thousand posts, which can be used as a trustful dataset. To our best knowledge, this dataset is the first labeled Instagram dataset to become publicly accessible. Finally, we show that the framework is able to detect candidate events with a reasonable accuracy using much less computing resources than the most well-known approaches in the literature.
The remainder of this paper is organized as follows: Section 2, we provide a brief contextualization about events and event detection systems. Section 3 presents an overview of the different approaches to detect events. Section 4 reveals the proposed technique to overcome the introduced problem. Section 5 explains how we define the methodology for the experiments, including techniques, tools, and definitions required. Section 6 covers the results found during the experiments and we conclude our work in Section 7.
Background
In this section, we present important concepts for a better understanding of this work.
Event detection
Despite the existence of several works in this subject, there is no formal definition of what is an event and what is the event detection task. In the literature, some authors use their own interpretation, which makes it not consistent with each other. Trying to avoid even more confusion around it, we borrow the definition existing in the literature.
According to Allan et al. [4], an event is “something that happens at specific time and place with consequences”, by this definition an event should have a time and place to happens. However, there is no mention about the place where this can happen. Aggarwal et al. [2] define an event as: “something that happens at specific time and place but is also of interest to the news media”. In other words, the authors complement the first definition stating that it should also affect traditional news media like a newspaper. For Becker et al. [7], “an event is a real-world occurrence e with a time period T e and a stream of Twitter messages discussing the event during the period T e ”, in that case, the event has to be reported on Twitter.
In this work, we consider the definition from Dong et al. [11] as the most comprehensive interpretation of events in online social networks: “Real world happenings that occur within similar time periods and geographical locations, and that have been mentioned by the online users in the forms of images, videos or texts”. Therefore, intuitively, an event detection system is a set of procedures created to solve the challenge of discovering events [25]. In this work, we are interested in being able to detect any type of local real-time event using Instagram 6 as our primary data source.
Time series
To detect real-time events in our proposed framework, we define a time series as a time-ordered list of values X, each of them associated with a time T for specific small locations - which we call sub-regions - at a regular interval. Formally, a time series is a discrete uni-variate function X = {x1, x2, …, x n } for T = {t1, t2, …, t n } with values x1 as the number of geo-tagged posts from Instagram at time t1, x2 at time t2, and so on.
Figure 1 shows time series for all the four months of the collected data.
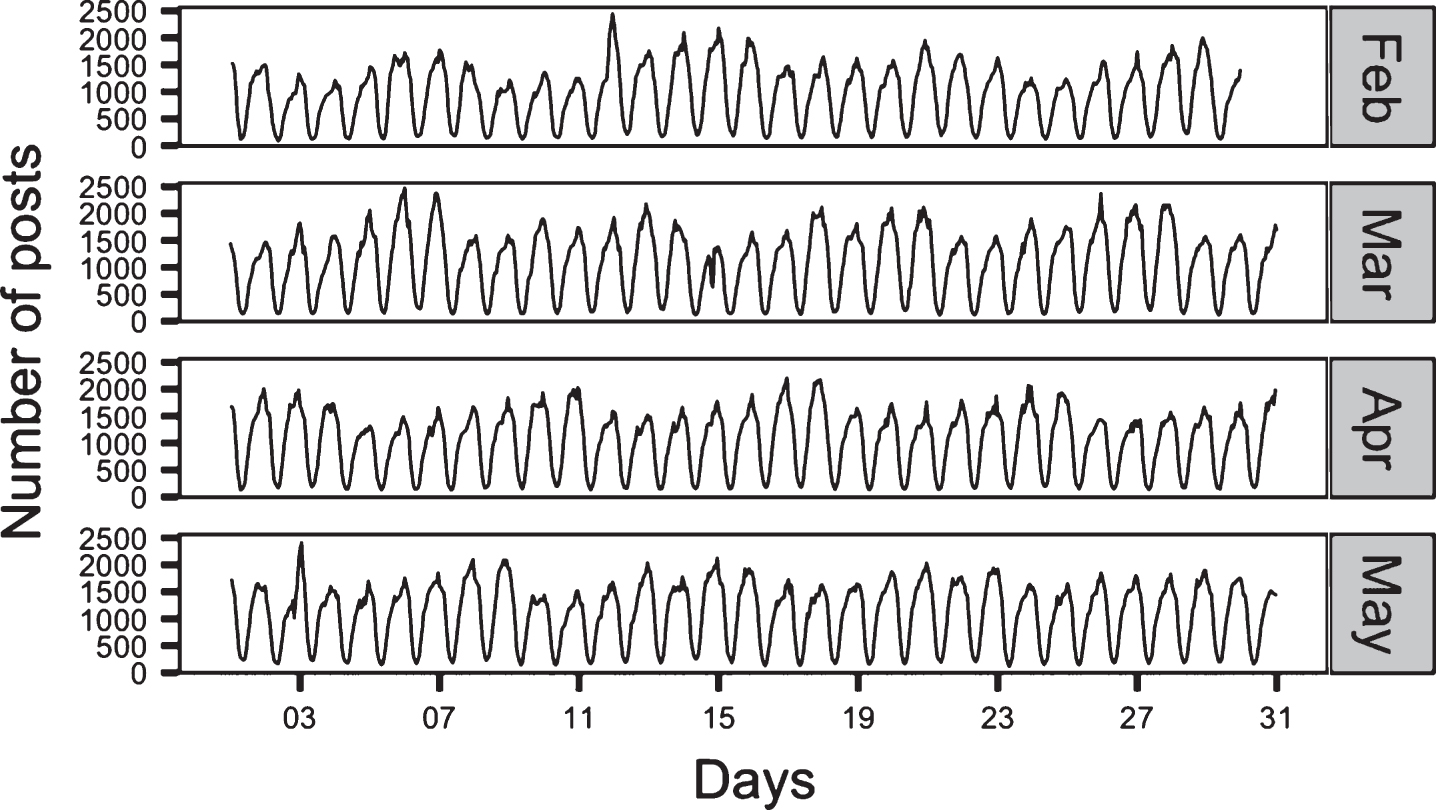
The volume change over time binned by hour.
The Pearson correlation is a measure of linear correlation between two variables x and y. When computing correlation for time series, we are interested in observing the correlation between two variables over the same time, in our case, the volume of posts for two different sub-regions. In order to do that, we use a sample correlation coefficient, where the sample values are the measurements taken during a time range. The sample correlation coefficient r of two variables a and b is defined as the sample covariance q of the two variables, divided by their sample standard deviation S:
Let N be the number of data points from our time series, the sample covariance q is defined as follows:
Where a
i
and b
i
are the data points, and
Finally the sample standard deviation S is defined thusly:
In order to improve the generalization of our regression model, we group the trained models according to the measure of similarity between the time series using the Pearson’s correlation coefficient [26] as done by [18, 27].
Support Vector Regression is a machine learning technique based on statistical learning theory. Given a set of time series data points x (t), where t is a series of N discrete samples: t = 0, 1, 2, …, N - 1, and y (t + Δ) is some predicted value in the future (t greater than or equal to N).
The goal is to map the data points x (t) to a higher dimension “feature” space, via φ (x) (defined as a Kernel Function). Then, perform a linear regression to a higher dimensional feature space [23]. In short, the goal is to find “optimal” weights ω and threshold b.
In this section, we present the relevant works about event detection systems which somehow introduced different solutions for the problem using social networks as the source of the information for their systems.
Online social networks
As an active topic, event detection has attracted a more intensive interesting with the emergence of the social networks, since the users of those networks, can act as social sensors [30, 37] creating sensory information regarding events in the real world.
Some methods focus on specific event types, in this context, a system called SportSense [38] was proposed to detect events from football matches. By filtering some tweets with specific words and using matched filtering, it can detect a game event, a touchdown or field goals within a short delay after the event happened. Another work to detect specific types of events was TEDAS [19] created to detect crime-related and disastrous events. Despite the fact both provide excellent results, the strategy is very tied to a unique type of event using a limited list of predetermined keywords.
From a different perspective, some authors tackle the event detection problem using trending topics - a feature from Twitter. GeoScope [8] detect events using trending topics and its locations with geo-based content from the Twitter data stream. The emerged trend can be, for instance, an emergency, a concert or a national game. The algorithm was designed to model the frequency of a topic t x in any location l i within a time window W. While the algorithm provides good precision and recall, it has a significant error in estimating the location of the trending topics. Moreover, [3, 32] argue that even being able to do real-time detection, modeling trend topics is not suitable for detect events in small regions.
Clustering-based approaches have been extensively used in event detection problem by, for example, clustering features from Twitter messages and analyzing its aspects like: temporal, social and topical features [6, 7].
IBM researchers used clustering techniques in Smart City project to identify events from Twitter messages in New York City. However, this work went beyond the others and also implemented the idea of users as sensors of data. A novel crowd sensing system which is responsible for acquiring data from various sources like social networks, mobile phones (SMS), phone call transcripts, etc. All those data after collected go to a preprocessing stage, then features are extracted, filtered and clustered according to its semantic and contextual similarity [28].
In general, clustering techniques are valuable and yield decent results, but these methods have some drawbacks. First, they require an arbitrary threshold for creating a cluster representing an event. Second, it may suffer from cluster over and under-segmentation, making the choice of the threshold issue even more critical.
Following the strategy of detecting real-time events by monitoring the volume of posts in a time series, some authors used the Gaussian Process Regressor (GPR). GPR models the data as a multivariate normal random variable and then predicts the average value for the target vector, in this case, the number of Instagram posts within an interval. Although it presents satisfactory results, the problem in using GPR is the computational requirements. The method needs to optimize the hyper-parameters by maximizing the marginal likelihood, it is a O (n3) operation and needs to be executed every 24 hours, even for a small sample (around 500 records). It was only possible because the authors used a cluster of 60 machines running in parallel [32, 34].
The aforementioned works tried to solve the problem of event detection in real time by using different approaches, however, they showed to have some limitation. Trying to solve issues our approach differs from the existent literature in some ways.
First, our framework does not work with just one OSN, instead, we created a flexible approach that can be implemented using any OSN as the data source, or even a combination of multiple ones.
Second, we do not set specific keywords to detect a single type of event since our framework is based on changes in the volume of posts.

Architecture of the proposed event detection framework.
Third, we do not use a high consuming computing process model, rather, we apply a lightweight regression technique (SVR) to predict and detect any type of event.
Fourth, we do not employ a static traditional machine learning process based on a unique history of data. Instead, we model the time series using an adaptive approach clustering those that have similar behavior through the time.
Finally, the proposed framework uses the idea of burst detection in time series [16, 32]. We believe every time a real event happens we have a sharp (or abnormal) increase in the activity of the social network. Thus, we created a framework capable of modeling this behavior and trigger alerts every time an event emerges.
Any event detection system can operate in the following ways: looking for the past [35] or new events [5], doing it online [30] or offline [7] and using a Document Pivot or Feature Pivot approach [4]. We can classify the presented framework as a Correlation-based Online Feature Pivot event detection system for new events.
We aim at deciding if a post is an event or not as soon as it arrives (Online) without the need of a time-consuming batch processing (Correlation-based). Furthermore, the applied strategy uses the idea of a “burst of activity” with the volume of posts from a sub-region rising sharply in frequency as the event emerges (Feature Pivot). Accordingly, we propose an architecture formed by three components: (1) Data Collector; (2) Time Series Estimator; and (3) Burst Detector. Each component is responsible for a different task as can be seen in Fig. 2.
Workflow for the event detection framework.
Elbow method determines the optimal number of clusters for three different days (Sunday, Monday, and Tuesday).
Data collector
The first component is responsible for crawling the data from Instagram API. It keeps getting data in real time from the predefined area and storing it in a database. In addition to its location, each crawled post from Instagram has an image and a created time attribute, it also can have a text and other information like the venue.
As in many other architectures from previous works [19], we implemented the data collector using a NoSQL technology for the database. The reason for that is because NoSQL databases are suitable to save documents from Instagram API in pure JSON format and can easily scale if needed.
Time series estimator
The Time Series Estimator uses data collected by our Data Collector component to build the time series. Every 24 h, it generates two time series for each sub-region, the first one, using the time interval of 1 h is used to calculate the correlation coefficient while the second one with a 15 min interval, is used by the regression algorithm to predict the volume of posts.
Burst detector
The event detection is achieved by listening to the data stream from Instagram in real-time, identifying the sub-region of each post, counting the number of items in a sliding window (15 min) and comparing it with the volume predicted by the regression algorithm. If the volume of posts is higher than the defined threshold (3σ) the Burst Detector triggers an alert and store in the database all the posts from Instagram within the event interval. We used this technique based on the results obtained by [32–34].
Event detection process
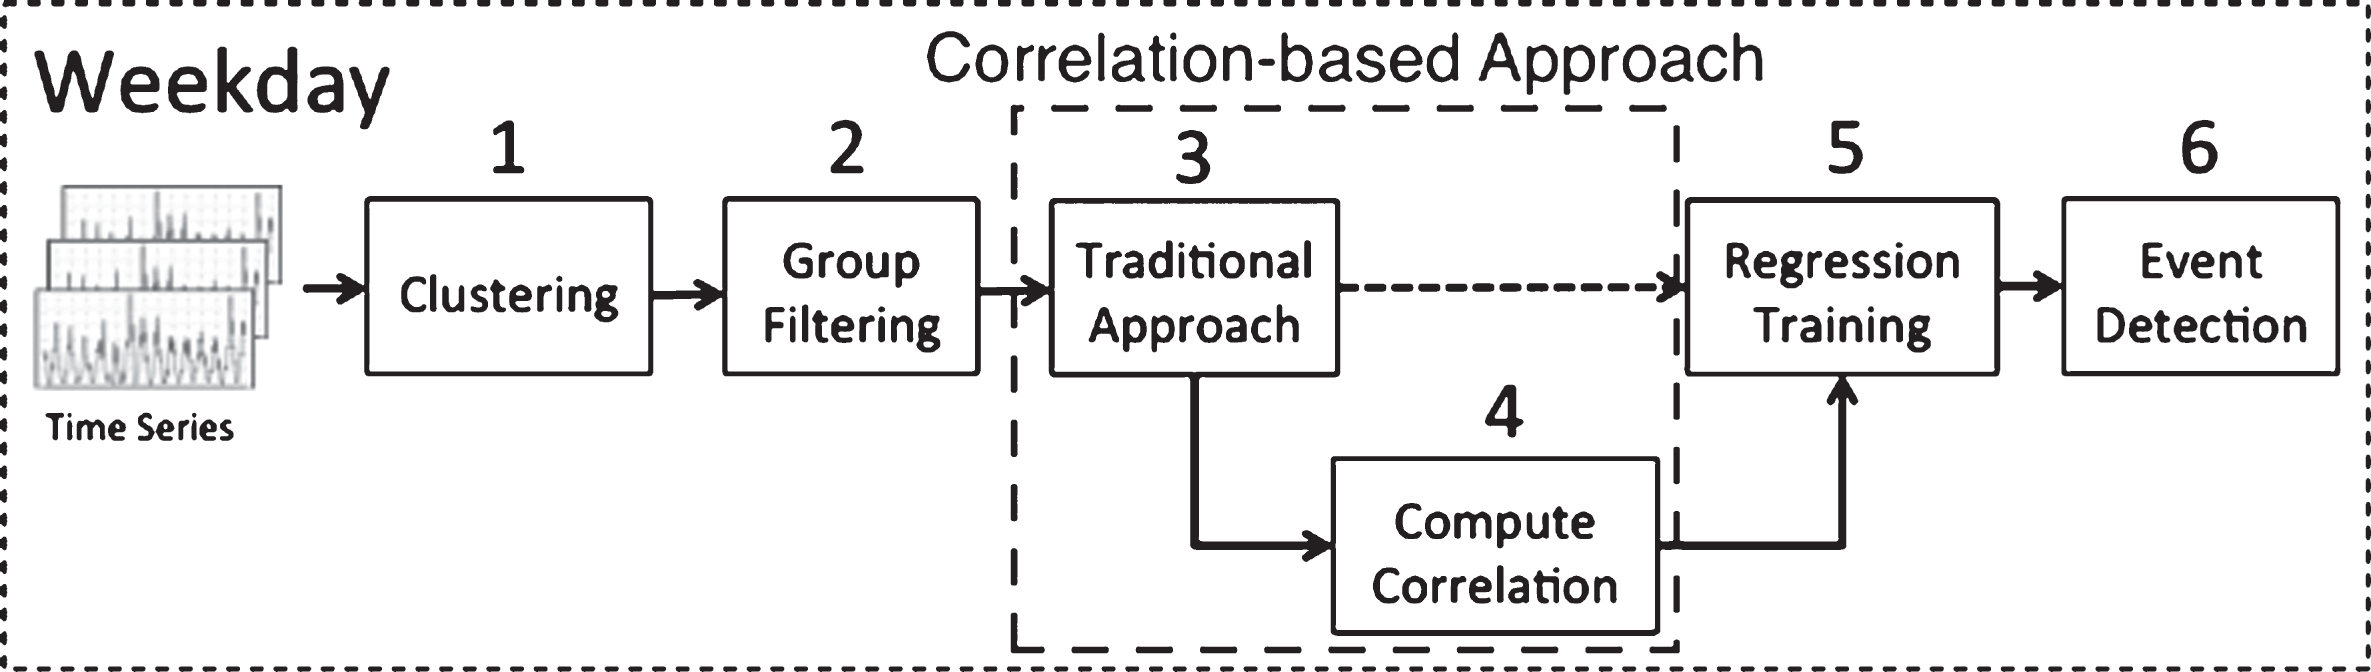
As can be seen in Fig. 3, our event detection framework is composed of different steps, such as Clustering, Group Filtering, Traditional Approach, Correlation-based Approach, Regression Training, and Event Detection. Each step is explained below.
Clustering
In this step, we apply the K-means algorithm [20] to group the geographic sub-regions based on the total number of posts within an interval. The input for the clustering process is the 1 h interval time series generated by the Time Series Estimator. Therefore, the most important parameter to the K-Means algorithm is the number of desired clusters k. In other words, how many clusters we want to group the sub-regions.
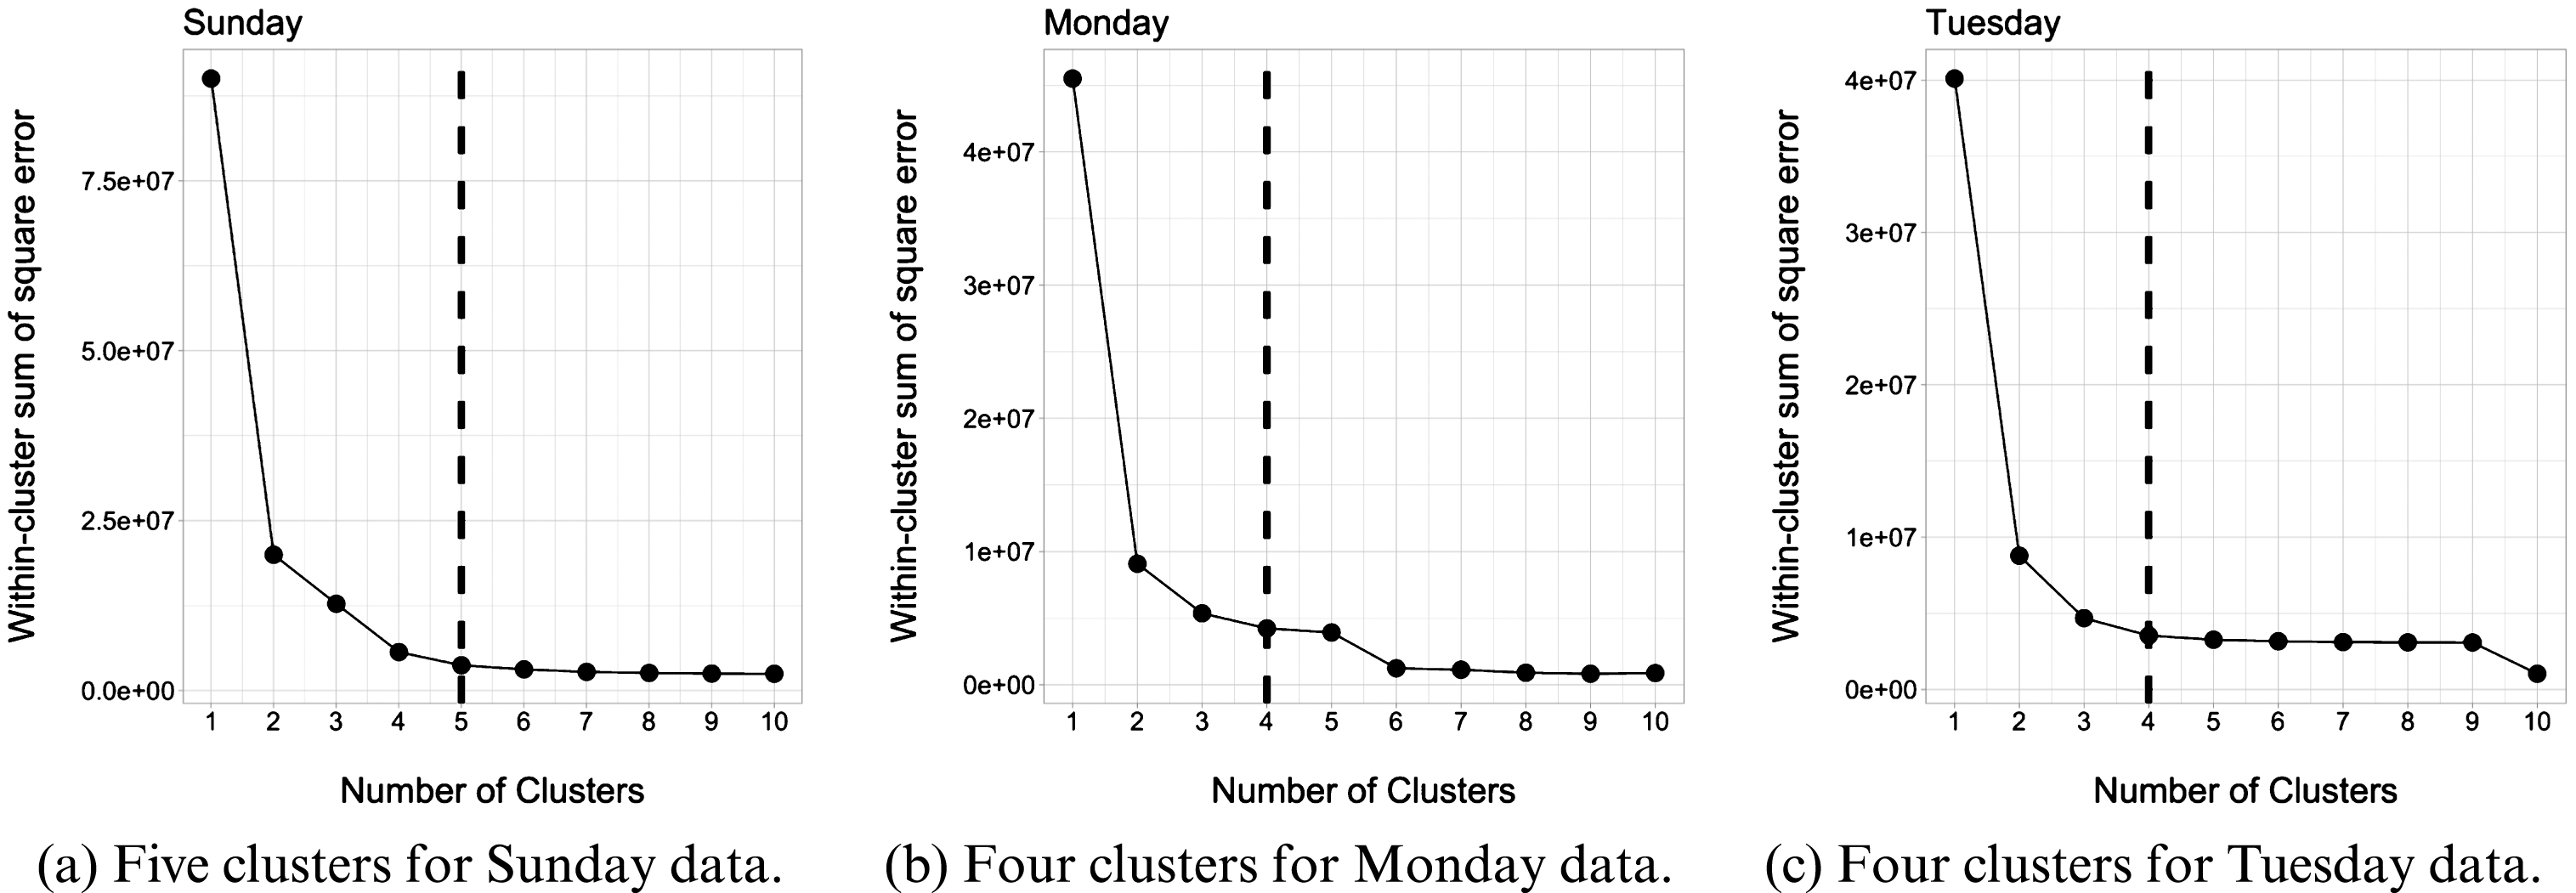
To determine the number of clusters (k), we use the Elbow method [29], which it is a well-known way to find the optimal number of clusters for a target data collection. The idea behind this method, is to run K-Means clustering on a dataset for a range of values of k and for each one, calculate the sum of squared errors between the instance of the cluster and its centroid. Then, we take k when there is no significant difference for e error anymore.
In Fig. 4, it is possible to observe on the y-axis, different k values and on the y-axis the e error computed for each weekday used in this work.
Group filtering
Ideally, we wish to have at least 1 post for each data point of the time series, resulting in a minimum of 96 posts (one post every 15 min). However, sometimes the volume of posts from a geographic sub-region might be very low, almost zero. Therefore, in these cases, it is necessary to discard those sub-regions that do not hold any event.
Instead of defining a static value to be the minimum amount of posts for a sub-region, we apply an adaptive approach that clusters all the sub-regions and discards the clusters with the lowest volume of posts. For example, in the first weekday (Sunday) of our experiments, we cluster all the 625 sub-regions in 5 groups and exclude the fifth, since all the geographic sub-regions within this cluster has just a few posts.
Traditional approach
With the remaining geographic sub-regions from the Group Filtering step, we train a support vector regression (SVR) model that will be used later to predict the volume of posts from a target sub-region. The advantage of this model over other techniques from the literature is the fact that SVR is a lightweight algorithm compared to other techniques (e.g., GPR) and produces similar accuracy in prediction tasks [10].
Correlation-based approach
Besides the traditional approach using SVR, in our framework, we propose a novel approach based on the correlation coefficient. Therefore, our approach calculates the Pearson’s correlation coefficient [26] for the time series from all of the geographic sub-regions using the equation defined in
1
, regardless the cluster defined by the clustering step. As a result, we achieve a correlation matrix of M variables (x1, x2, …, x
M
) as a M × M matrix, where each entry of this matrix is defined as follows:

A randomly created quantile-quantile plot for three time series using different sub-regions and days.
The goal is to find similar time series (i.e., geographic sub-regions), which can be used to predict the volume of posts from correlated sub-regions. In this work, we consider that two regions are similar if the correlation coefficient is greater than a minimum threshold, chosen empirically. We experimented different values: 0.65, 0.70 and 0.75, any value below 0.65 generates too many similar regions while a 0.75 value or higher did not provide a minimum number. However, we found 0.70 to be a good threshold to determine if a time series is similar to another one from a different sub-region.
Figure 5 shows a correlation matrix computed among times series from all 625 geographic sub-regions using a weekday (Sunday). The same proceeding has been performed for all of the weekdays used in this work.
Pearson Correlation computed between all filtered sub-regions for Sunday (March 20th, 2106).
In this step, we train an SVR model for each geographic sub-region R using the 15 min interval time series with 48 h of historical data for each weekday among all of the sub-regions. After building the models, we could make predictions for future volume in each sub-region.
The output of the model is a tuple [v (R, t), σ (R, t)], representing the predicted post volume (v (R, t)) and associated standard deviation (σ (R, t)) for each time t and sub-region R. The prediction for a target sub-region serves as the volumes of posts that we expect to observe given no event is happening for that sub-region at a specified time.
Event detection
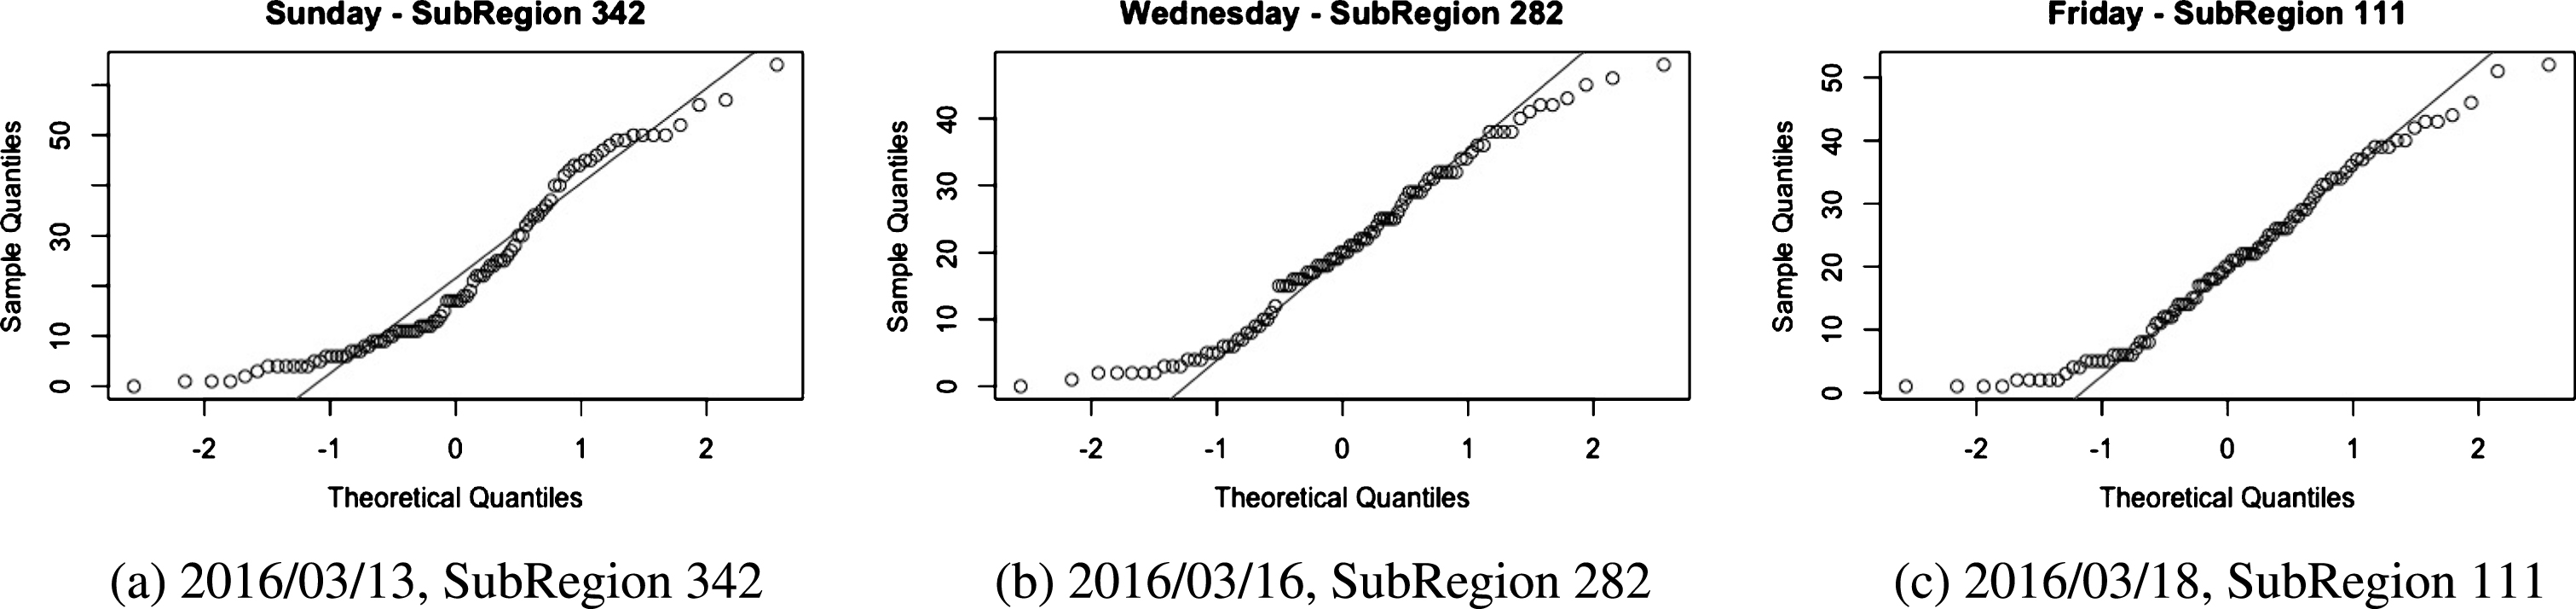
Following the work from [32, 33], an event will be detected if the volume of posts from a sub-region deviates 3σ from the predicted value. According to the available literature [13], assessing the normality (normal distribution) assumption should be taken into account for using parametric statistical tests.
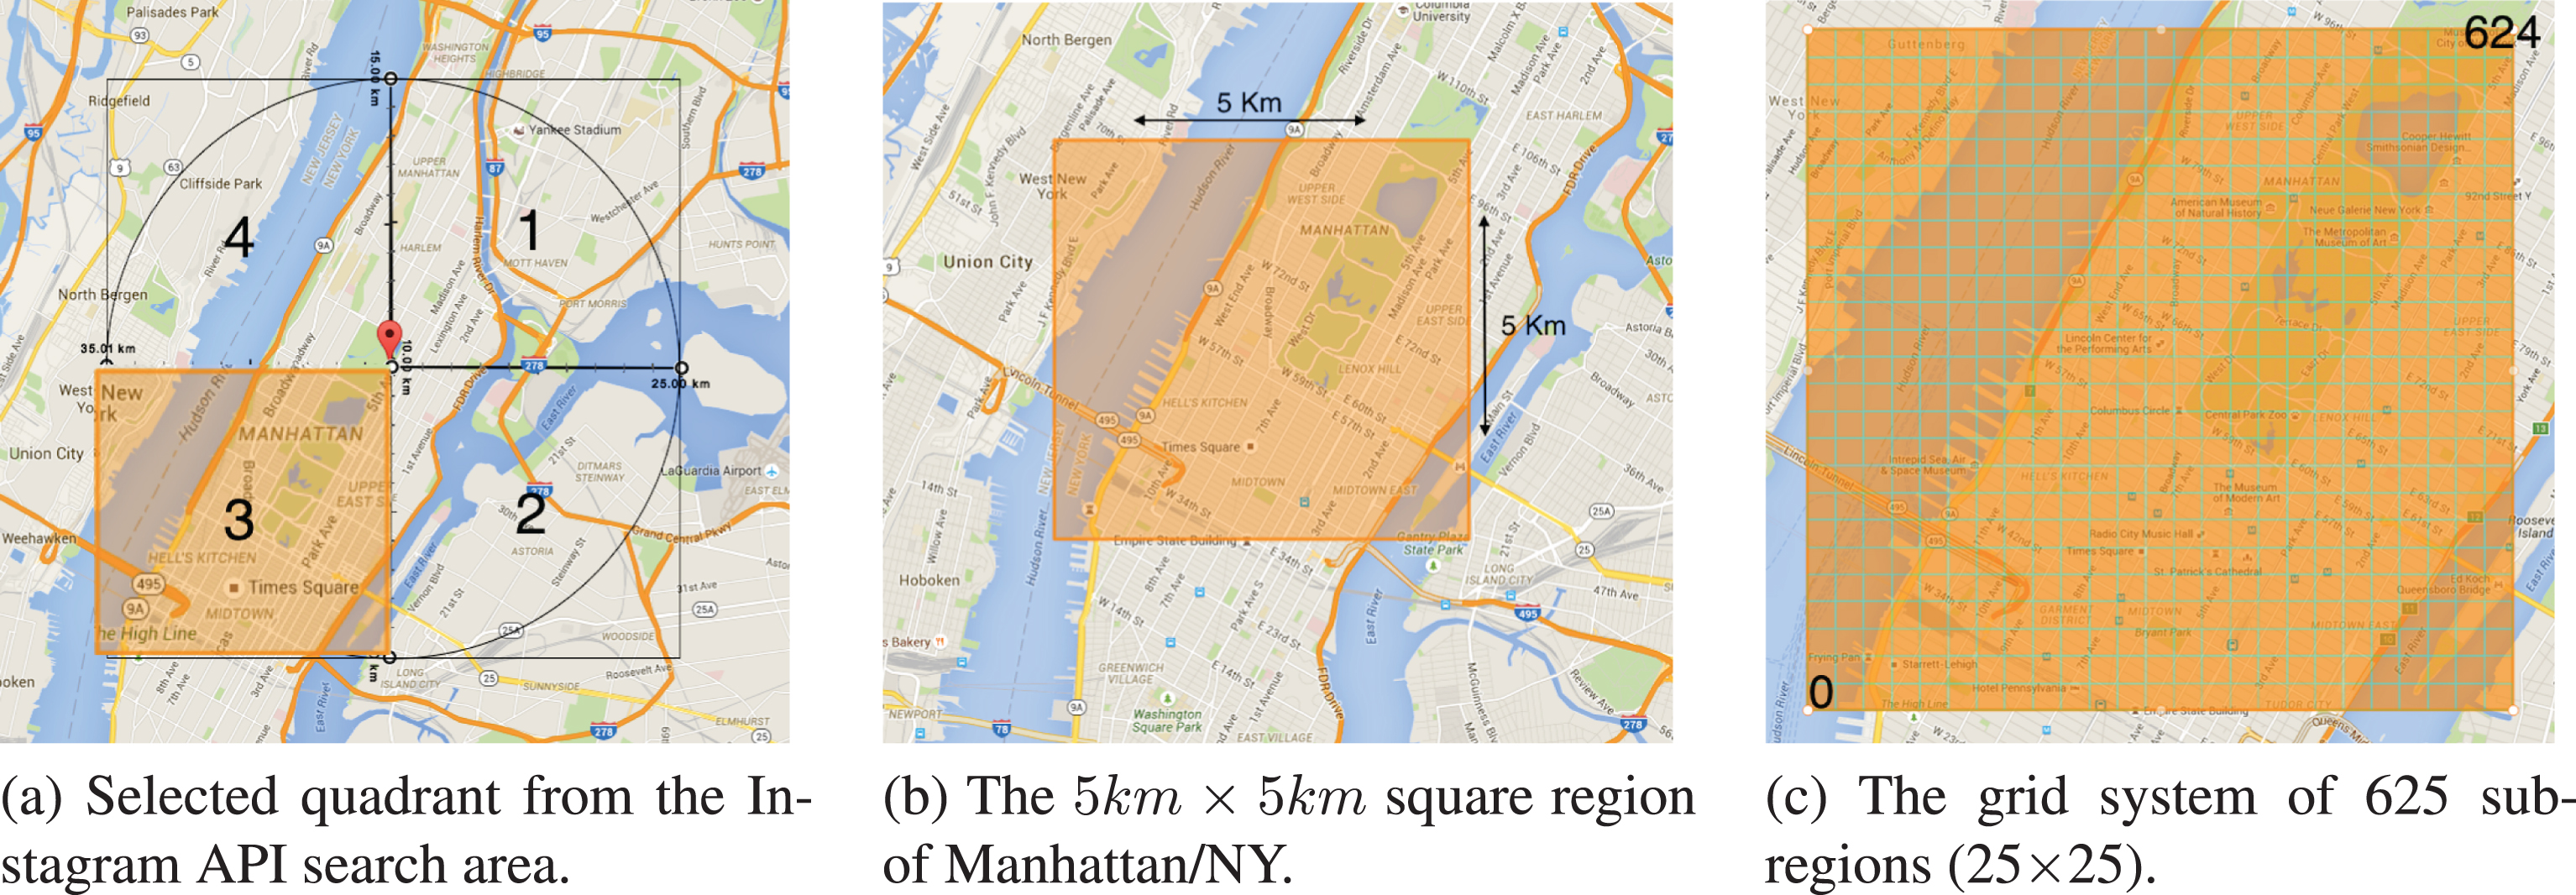
The dimensions and grid system of the land area covered by the data collector.
Therefore, we need to check if the time series we are using follow a normal distribution. In order to do that, we apply a visual test by using a quantile-quantile plot, it allows us to see at-a-glance if our assumption of normality is plausible. The normality of the time series was tested using random sub-regions and random days as one can see in Fig. 6.
Let us follow an example about how all the components from the framework work together to detect events. Supposing we wish to detect events for March 20th, 2106 (Sunday) using the collected historical data.
First, we generate time series with a 15 min and a 1 h interval for all the sub-regions using the two Sundays immediately before the desired date (March 13th, 2106 and March 6th, 2106). Thus, we have time series with 192 and 48 data points, respectively, one for each sub-region.
Second, we group the sub-regions using the 1 h time series by summing the number of posts and using its total amount as the input to the K-means algorithm. The optimum number of clusters is defined by the Elbow method and all geographic sub-regions within the cluster with the lowest number of posts are discarded. Then, SVR model is trained with the 15 min interval time series to predict the number of posts v and its standard deviation σ given a time t.
Next, our novel approach based on Pearson correlation is used to calculate the similarity among all of the sub-regions remaining from the Group Filtering step.
Finally, in real-time, the Burst Detector uses the predicted values v and sigma from the similar sub-region and compare them with the actual sub-region. If the actual number exceeds our threshold (σ R predicted standard deviation) a candidate event is detected.
In order to create the event detection framework, we need to collect, label and store the data from Instagram. In this section, we describe the settings and definitions that have been adopted in this work based on some experiments and past works from the literature.
Dataset
Data collecting
As the first component in our framework, we have the Data Collector, which is responsible for gathering data from Instagram and storing them in a NoSQL database. We have been collecting posts from a particular area of interest within New York over the period of February 1st/2016 to June 30th/2016, it is four months of data with a total of 2, 972, 248 posts.
Instagram API offers a method to read its stream data based on geographical point and a radius of 5 km at most. In this work, we choose the region of Manhattan in New York using the parameters latitude : 40.7626785 and longitude : -73.9659409 as the parameter for the Instagram API. The total land area is around 60 km2 and population over 1.6 million. Although in this work we focus on the area of New York City, this framework can be generalized to any other city.
Due to the geographical nature of the island of Manhattan, we decided to split the area into four quadrants as one can see in Fig. 7(a). Considering the land area covered by the data collector, we choose the most significant one. It is a 5 km × 5 km square region comprehending a total of 25 km2 (see Fig. 7(b)). As a result, the geographical boundaries for our collector are: (lat : 40.7485, long : -74.0140) and (lat : 40.7930, long : -73.9530).
Next, we created a grid system of 25 × 25, yielding a total of 625 sub-regions with around 400 m2 each one (see Fig. 7(c)). The strategy here is to separate the entire area into smaller areas to achieve better accuracy in model fit for the target time series [34].
The decision about how big or small a sub-region should be is a trade-off. If the area on a sub-region is too large, the system detects more events, consequently, more false-positives might appear and it makes the event detection task even more difficult. On the other hand, a tiny sub-region becomes too sensitive and volatile generating too many candidate events, even with just a few posts. This problem is not new and has been already treated in previous works. Therefore, in our experiments, we used a 25 × 25 configuration following the same configuration from [34].
Figure 8 shows the volume of posts for two weeks in all geographical sub-regions with emphasis on the sub-regions with a high volume of posts (over 1000/day).

Bubble map for the volume of posts over the 625 sub-regions.
In Section 1, we have drawn attention to the lack of a reliable dataset as one of the challenges in event detection tasks. To overcome this difficulty, we created a manual annotation process to label 75, 825 posts from two weeks of activity in the selected area. It is the total posts for three days, during the period from March 20th/2016 to March 22th/2016, considering all geographical sub-regions.
The number of labeled posts is enough for our experiments since we can show how our framework is able to detect events in real-time and adapt itself to the changes in the behavior of the time series (i.e., concept drift [15]).
In order to label the data, we created a web page to list the posts from a sub-region in a 15 min interval, then, we asked the annotators to check a list of photos, read their captions, follow all the hyperlinks on it and determine whether there exists at least one post which could clearly be defined as an event. Recall that an event is any kind of happening posted on Instagram, like a car accident, an NBA match, a natural disaster and so on.
Lastly, we made available our labeled dataset in a public repository 7 , which can be accessed by anyone interested on that.
Evaluation metrics
To avoid a possible misunderstanding on the presented results, it is important to explain some nomenclatures of the evaluation metrics that we have adopted in this work. We hope, in the future, other researchers can find it useful and follow the same definitions in their works. Actual Events: It is the truly existing number of events in a specific period from a dataset. This number has been achieved from our labeled dataset. Detected Events: It is the number of candidate events detected by the framework. Actual Events Detected: It is the number of actual events within the detected ones, excluding the false positives.
Effectiveness results among our proposed approach based on correlation coefficient and the traditional approach in the literature
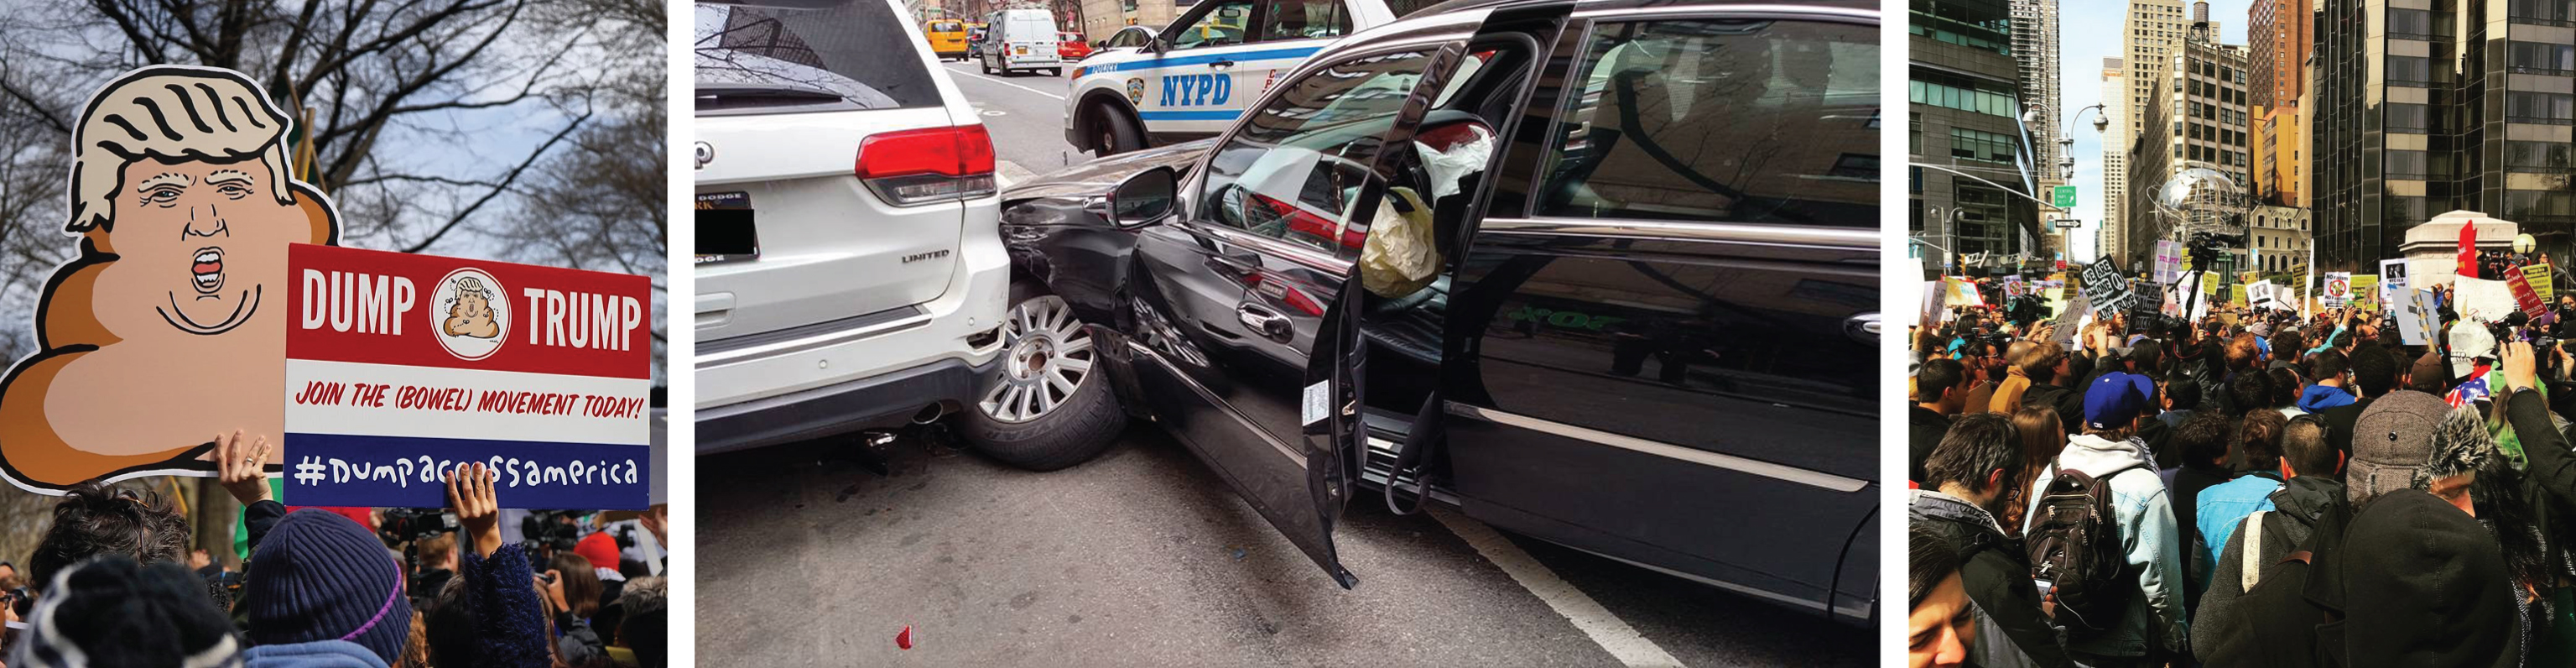
Example of some events detected by our proposed framework using the Correlation-based approach.
In this section, we perform three different analysis for real-time event detection tasks. First, we analyze the robustness of our proposed framework using two approaches: (1) Traditional approach, which uses the time series from a geographical sub-region to predict points of the same region; (2) Correlation-based approach, which uses time series from a geographical sub-region to predict points of times series from other more correlated regions. Second, we compare the effectiveness results of our the best approach against the well-known approach existing in the literature. Finally, we show the efficiency results of our proposed framework using two approaches and compare to time-consuming results of the baseline approach.
Effectiveness analysis
Table 1 shows the effectiveness results among traditional and correlation-based approaches for time series of three different weekdays (Sunday, Monday, and Tuesday) and three evaluation metrics (Precision, Recall, and F-Measure). It is very important to recall that the number of clusters for each weekday has been defined by Elbow method on clustering step (See Fig. 4).
As it is possible to observe, for Sunday data, our proposed framework using the traditional approach achieved the best mean precision (0.2680) than the correlation-based approach (0.2249). However, the correlation-based approach achieved the best recall and F-Measure metrics with 0.4250 and 0.2104 against 0.3120 and 0.1397 achieved by the traditional approach.
In the Monday data, the correlation-based approach achieved better results than the traditional approach in all of the evaluation metrics. Finally, in the Tuesday data, both approaches achieved similar effectiveness results with a slight gain for the correlation-based approach in two evaluation metrics (precision and recall). Notice that our proposed correlation-based approach achieved excellent recall results in all of the weekday’s data. This means that our proposed approach is able to detect a greater number of actual events existing in the labeled dataset.
Furthermore, in this analysis, we compare our proposed approaches to well-known approach based on Gaussian Process Regression technique (GPR) [34] from the literature. In [34], the authors have achieved around 0.13 of mean average precision in their experiments using times series from the same area (Manhattan Island) and a number of sub-regions. In our experiments, our proposed framework achieved around 0.13 and 0.17 of mean average precision for the traditional and correlation-based approaches, respectively. Therefore, our results are very similar to the results obtained by another work [33], demonstrating that the task of detect local events in real-time is arduous.
Figure 9 shows a sequence of three events of actual posts from Instagram detected by our proposed framework for a geographical sub-region. It is just an example among several others real events we have on the dataset.
Efficiency analysis
According to [32], Gaussian Process Regression (GPR) which is based on a robust probabilistic model has been used as time series prediction model due to its ability to adapt to various kinds of time series simply by replacing the kernels. On the other hand, the GPR drawback is the high computational requirement to fit even a small sample of data. Therefore, GPR is a high computational cost approach, taking hours to process a not large volume of data running it in a cluster of dozens of computers. The goal of calculating the correlation coefficient between the time series from the geographical sub-regions is to evaluate if our proposed approach might provide good effectiveness results compared to well-known approach from the literature, using much less computing resources. As Gaussian Process Regression approach proposed by [34] is not available in the literature, it was not possible to create a fair time-consuming experiment among our approaches and GPR. However, we have performed efficiency experiment among our proposed approaches. Tables 1 shows the mean of processing time for each proposed approach. As we can observe, our correlation-based approach is 300% faster than the traditional approach.
Mean of processing time between the our two proposed approaches
Mean of processing time between the our two proposed approaches
Today, online social networks are the most used applications to solve several real-world problems such as event detection, tragedy prediction, natural disasters, epidemics, and crime prevention.
Event detection is a research area that emerged in the last few years and is growing quickly. However, it is still an open challenge due to its complexity and requirements.
In this paper, we proposed a novel event detection framework using Pearson’s correlation coefficient and SVR to model time series and detect local events in real-time from Instagram.
In our experiments, we demonstrated that a time series prediction model trained with similar geographical sub-regions might be applied to generalize the knowledge of other sub-regions. Therefore, this “cross-regions” prediction strategy produces excellent effectiveness results using much less computing resources and requiring a small subset of the time to run compared to the other approaches in the literature [34].
Our proposed framework uses technologies in its architecture that are suitable to be extended (like MongoDB for storage) to cover a bigger geographic area without loose its characteristics and performance. Furthermore, since we did not adopt any specific feature from Instagram, our proposed framework might be used to work with other OSN, like Twitter for instance (generic system).
Finally, we could show that our framework with correlation-based approach is an easy and lightweight solution to work as a first layer in a more complex system. As future work, we plan to improve our framework adding another step on the top of the burst detection algorithm to filter the true positive events.