
Abstract
Newborn cry features extraction for affections detection and classification has been intensively developed during the last ten to fifteen years. In this work, methods from the system identification area have been implemented in order to obtain ten Linear Predictive Coefficients (LPCs) plus a nonlinear one stated as Bilinear Intermittent Factor (BIF) per 20 ms analysis window for 40 normal and loss hearing (deaf) newborn cries each. In order to show the contribution of the nonlinear feature, a Kernel Discriminant Analysis (KDA) is performed and afterwards, two classifications tests employing Supported Vector machines (SVMs) as a standard and the Expectation Maximization (EM) algorithm over a Mixture of Experts (ME) operation, considering the BIF as an expert or parent of the LPCs, allows to obtain a 99.84% classification.
Introduction
Since 1960, a spectroscopic study of newborn cries was carried out by Wasz and Hockert; as a result, it was possible to separate the cries in anger, pain and hunger. Among the most recent papers related to this subject, is the spectrographic analysis of 40 baby cries published in 2011 with the aim of detecting neonatal complications, respiratory problems, neurological disorders and hearing problems [1]. Besides this, the early diagnosis of deafness in newborn babies is determinant, given the fact that children with hearing loss identified before the first 6 months of life, have higher language growth and personal-social development compared to those identified later [2].
Evidence of the existence of a nonlinear dynamic behavior in speech with the aim of improving its synthesis and recognition have been reviewed in the work of M. Faundez-Zanuy et al., [3]. Moreover, nonlinear speech prediction for coding and synthesis using quadratic features have been established [4, 5]. Speech signal chaotic behavior has been studied in order to use it for prediction and possible speech synthesis and production purposes [6]. As a subgroup of speech, newborn cry contains nonlinear dynamic behavior as well; the first work in newborn cry nonlinear estimation was reported for normal, deaf, and asphyxia cases in [7].
In this work, we focus our analysis in normal versus loss hearing newborn cries given its closeness in intensity and frequency components, except rhythm and therefore amplitude sudden variations. The sections in this paper are organized as follows: the techniques used for features extraction is presented in Section 2. Next, the use of a Kernel Discriminant Analysis (KDA) is performed to show the qualitative discriminant contribution of the BIF. Section 4 describes the classification results using the Support Vector Machine (SVM) and the Expectation Maximization (EM). Finally, conclusions and ongoing work are explained.
Features extraction technique
LPCs extraction by hereditary process
In order to obtain the Linear Predictive Coefficients or LPCs, a one-step ahead predictor in ARMA form is used:
Where
The hereditary approach is a transient optimization technique performed at the price of hereditary computation of the model coefficients, which yields a linear t-growing memory of size nt, with n as the system dimension or delay. Considering the augmenting memory aspect, the ARMA model is written now as [8]:
The evaluation criterion of how well (2) performs, consists in minimizing the Mean Square Error (MSE) between the time series y
t
and the predictor
In order to find the LPCs that minimize the criterion (3), it is necessary to have its derivative with respect to the coefficients equal to zero, then to separate the resulting terms to each side of the equality leading us to the normal equations which contain the time-varying correlation and intercorrelation terms, see [9]:
At the moment the LPCs newborn cry signal have been computed, it is possible then to perform synthesis to reproduce the time series that represent the linear part of the signal, which is of interest in the speech production area, see [10].
The first feature within a nonstationary signal is the low frequency content present due to its changing nature, which means that some information is available very few times on time segments. The second feature is represented by signal variations between periodic and irregular patterns that yield nonlinear phenomena named intermittency. These variations represent sudden chaotic phases in the form of bursts or glitches [11]. Both aforementioned features are present on newborn cries where an important amount of power spectral content is found around the pitch, in average from 400 Hz to 600 Hz; see Fig. 1, and when large excursions or attractors add up to the signal, see Fig. 2.
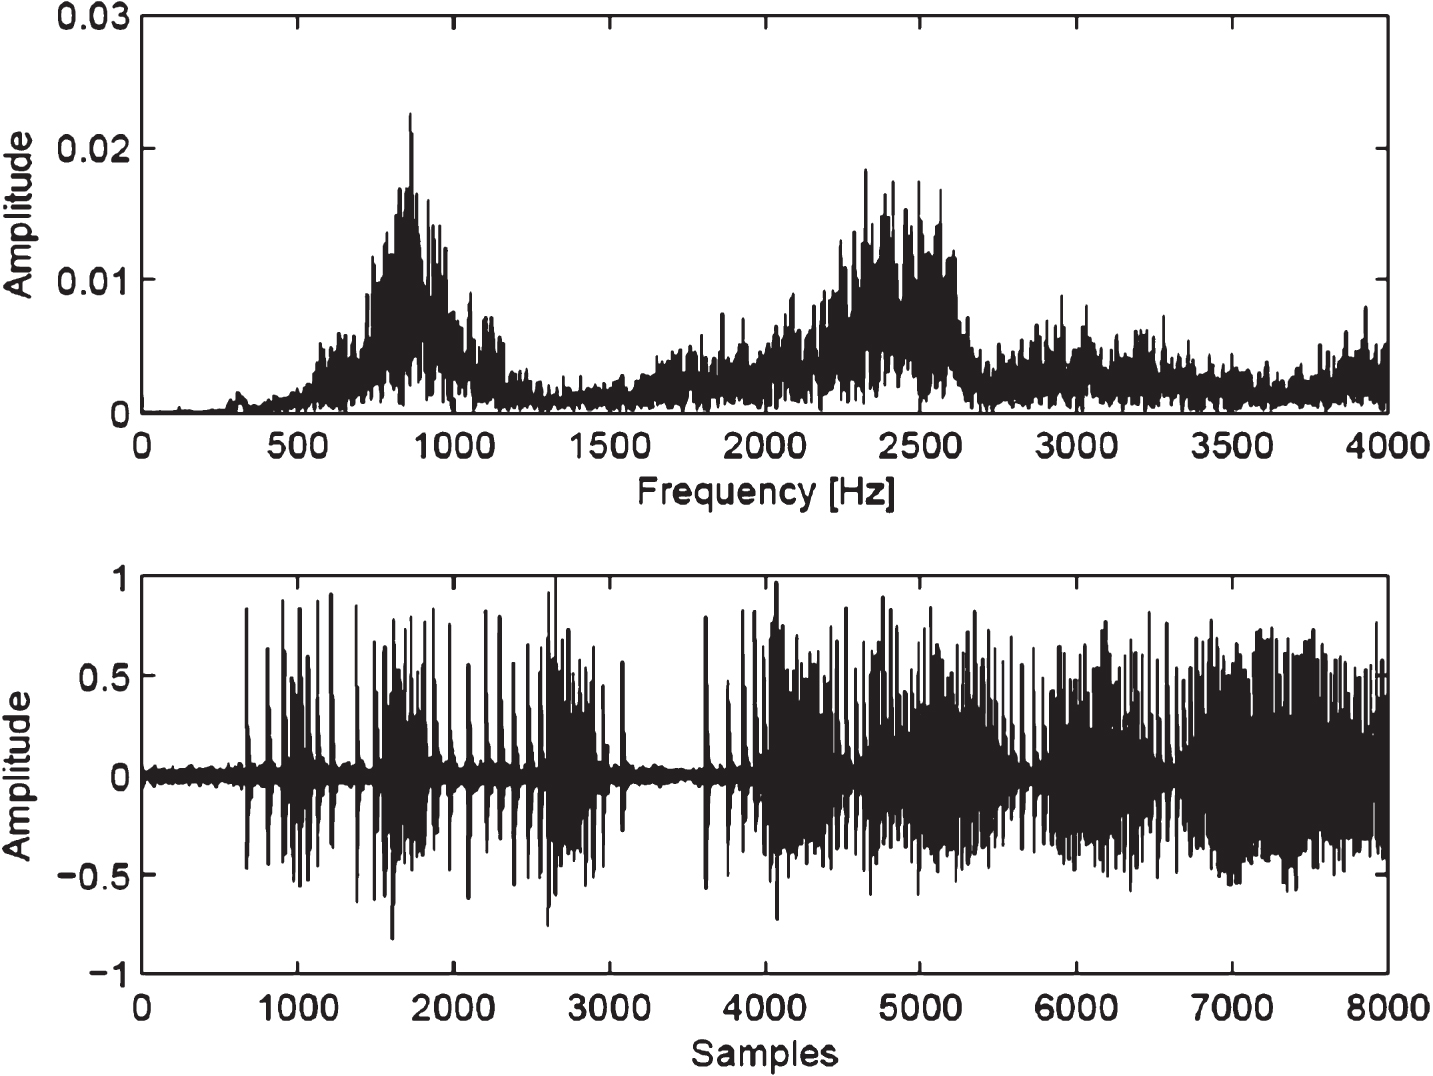
Deaf newborn cry spectra (up) and signal in time with glitches (bottom).
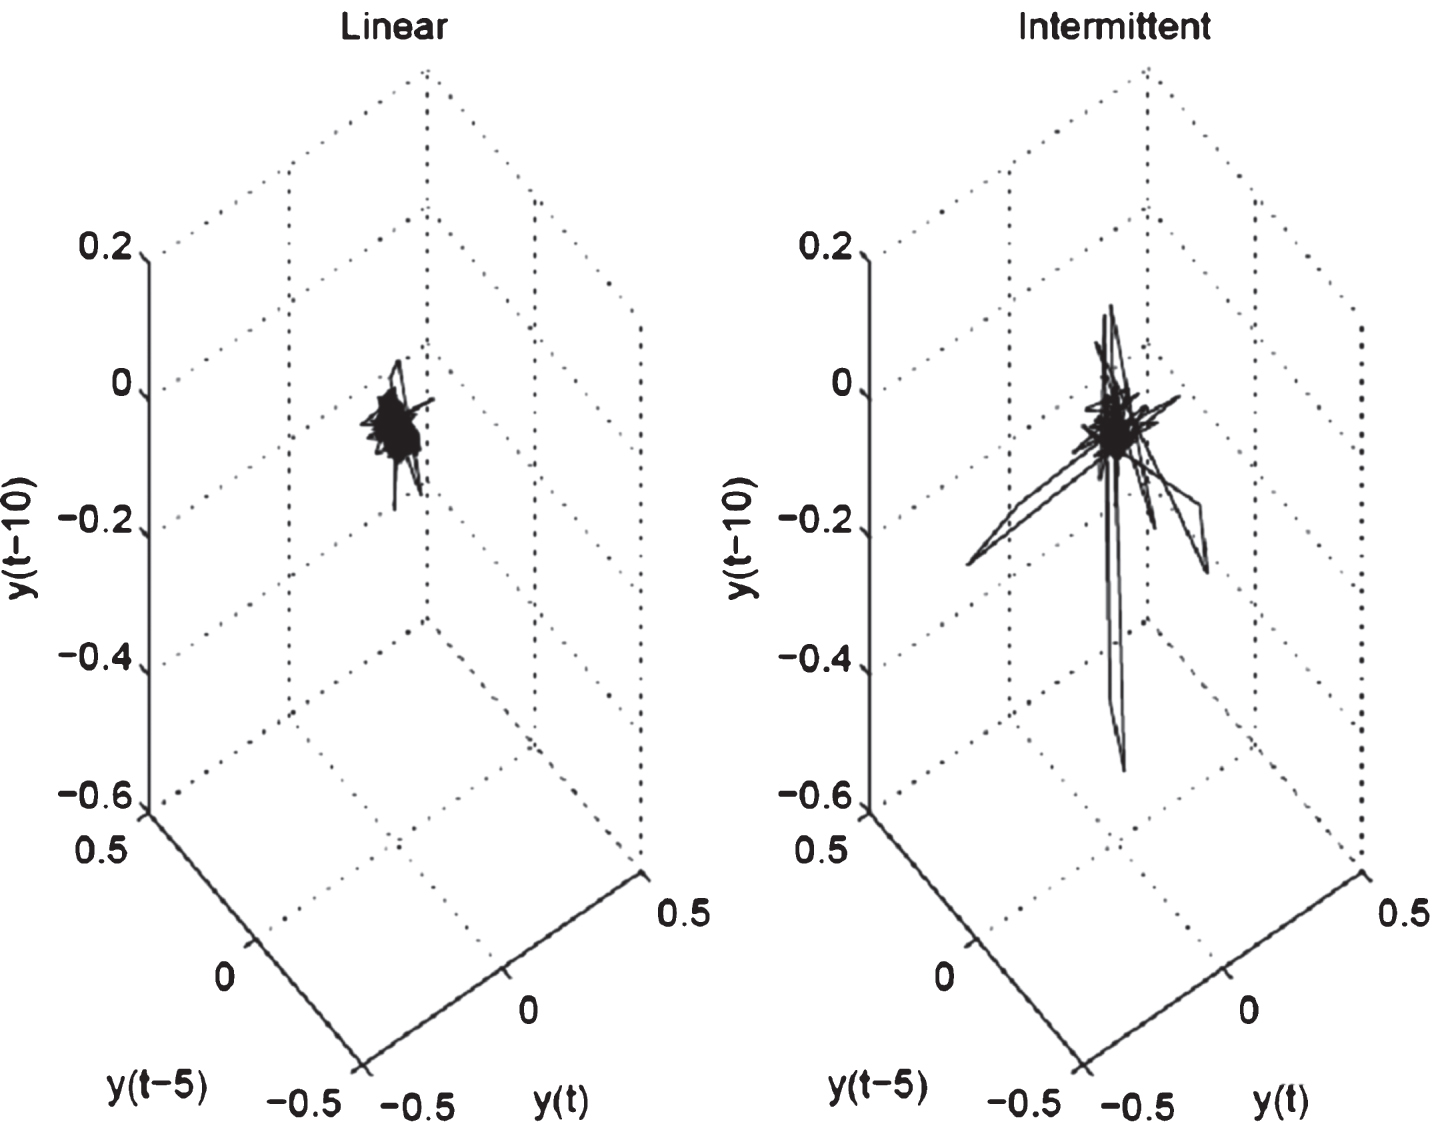
Newborn cry phase plane: linear and intermittent components (large excursions).
Among the special nonlinear models, we find the bilinear ones which were introduced in the control literature during the 70 s; a good explanation on finite and infinite dimensional bilinear realizations is available from Brockett [12].
A general discrete time bilinear infinite dimensional model has the following form:
Where
The previous bilinear model (5) can produce and therefore explain the intermittent behavior present in some signals and systems. The bilinear term is a natural extension to linear ARMA models since it is able to approach to an arbitrary nonlinear degree any Volterra series, see [13]. In other words, every nonlinear system presenting a linear input can be approached locally by a bilinear one [14].
Figure 3 shows how the amplitude excursions on the signal generated by the bilinear term increase as the bilinear term coefficient d on (5) changes from d = 0.5 to d = 0.85 for order n = 1.
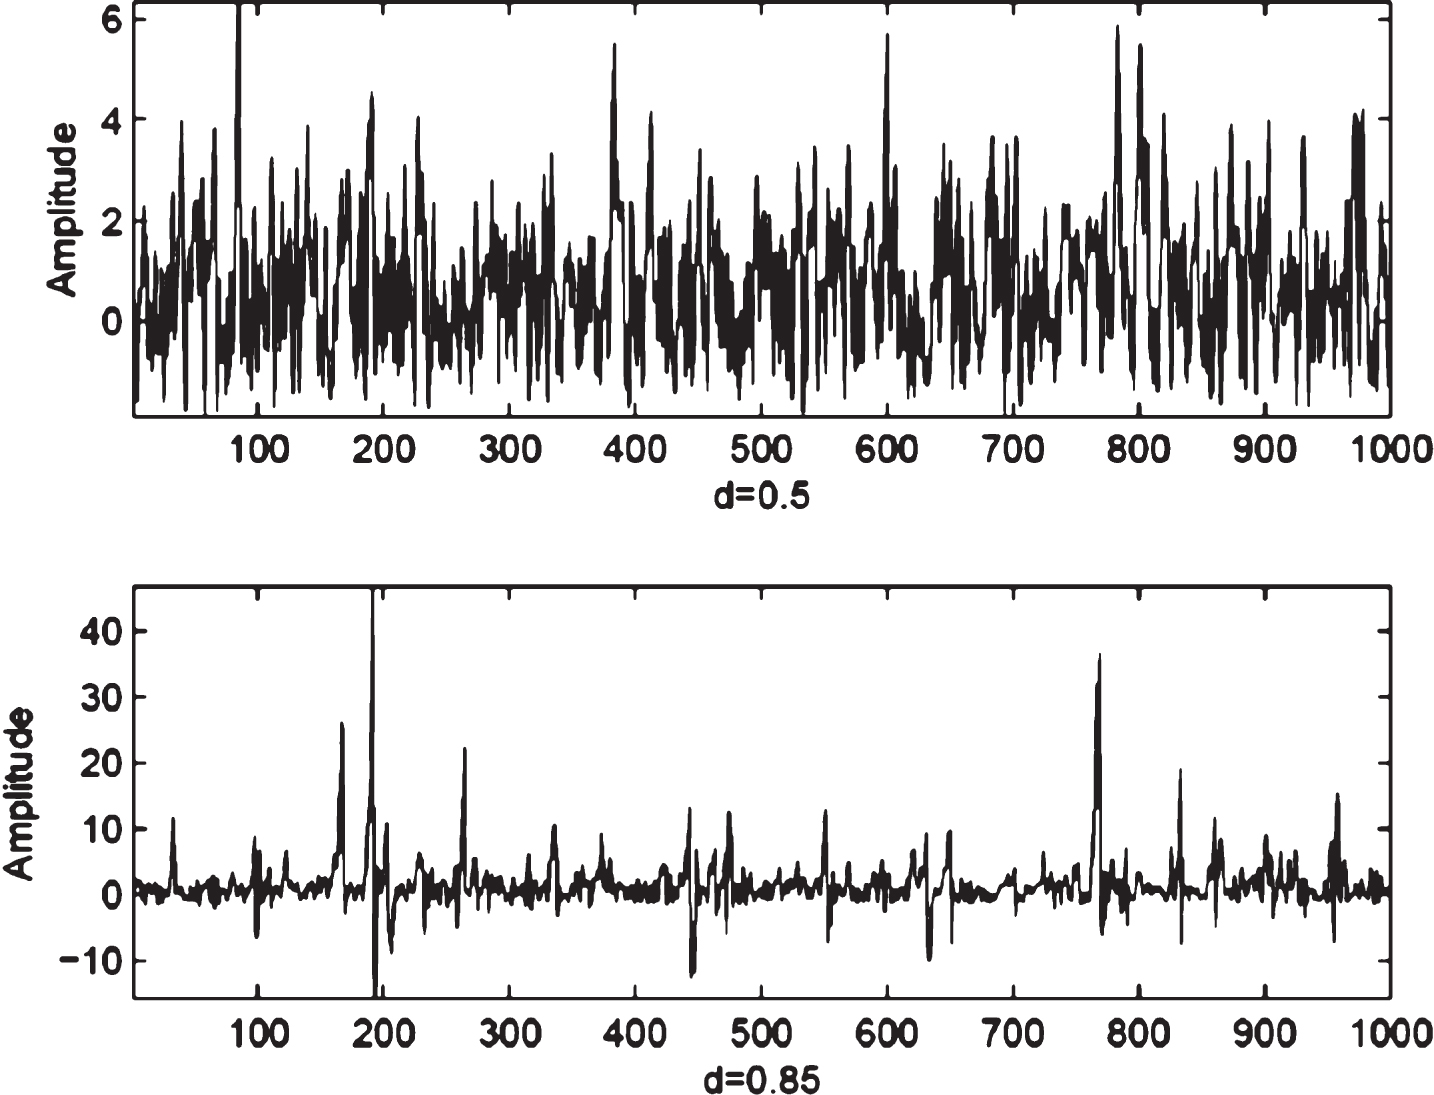
Intermittent component realization by Formula (5).
The bilinear nilpotent or homogeneous realization in continuous time, also known as state affine structure in discrete time, see [15], has the advantage of limiting the nonlinear degree of approximation required for analyzing a nonlinear signal or system. It is the bilinear finite dimensional case where the user can choose the approximant degree to be implemented, depending on the accuracy measured from the prediction process; hence:
If we establish dimension n = 1 and degree k = 3 in formula (6), we end up with a NARMA bilinear nilpotent model estimator in expression (7). This structure approaches a third degree Volterra series and it is able to capture intermittent explosive behavior within coefficient
The error
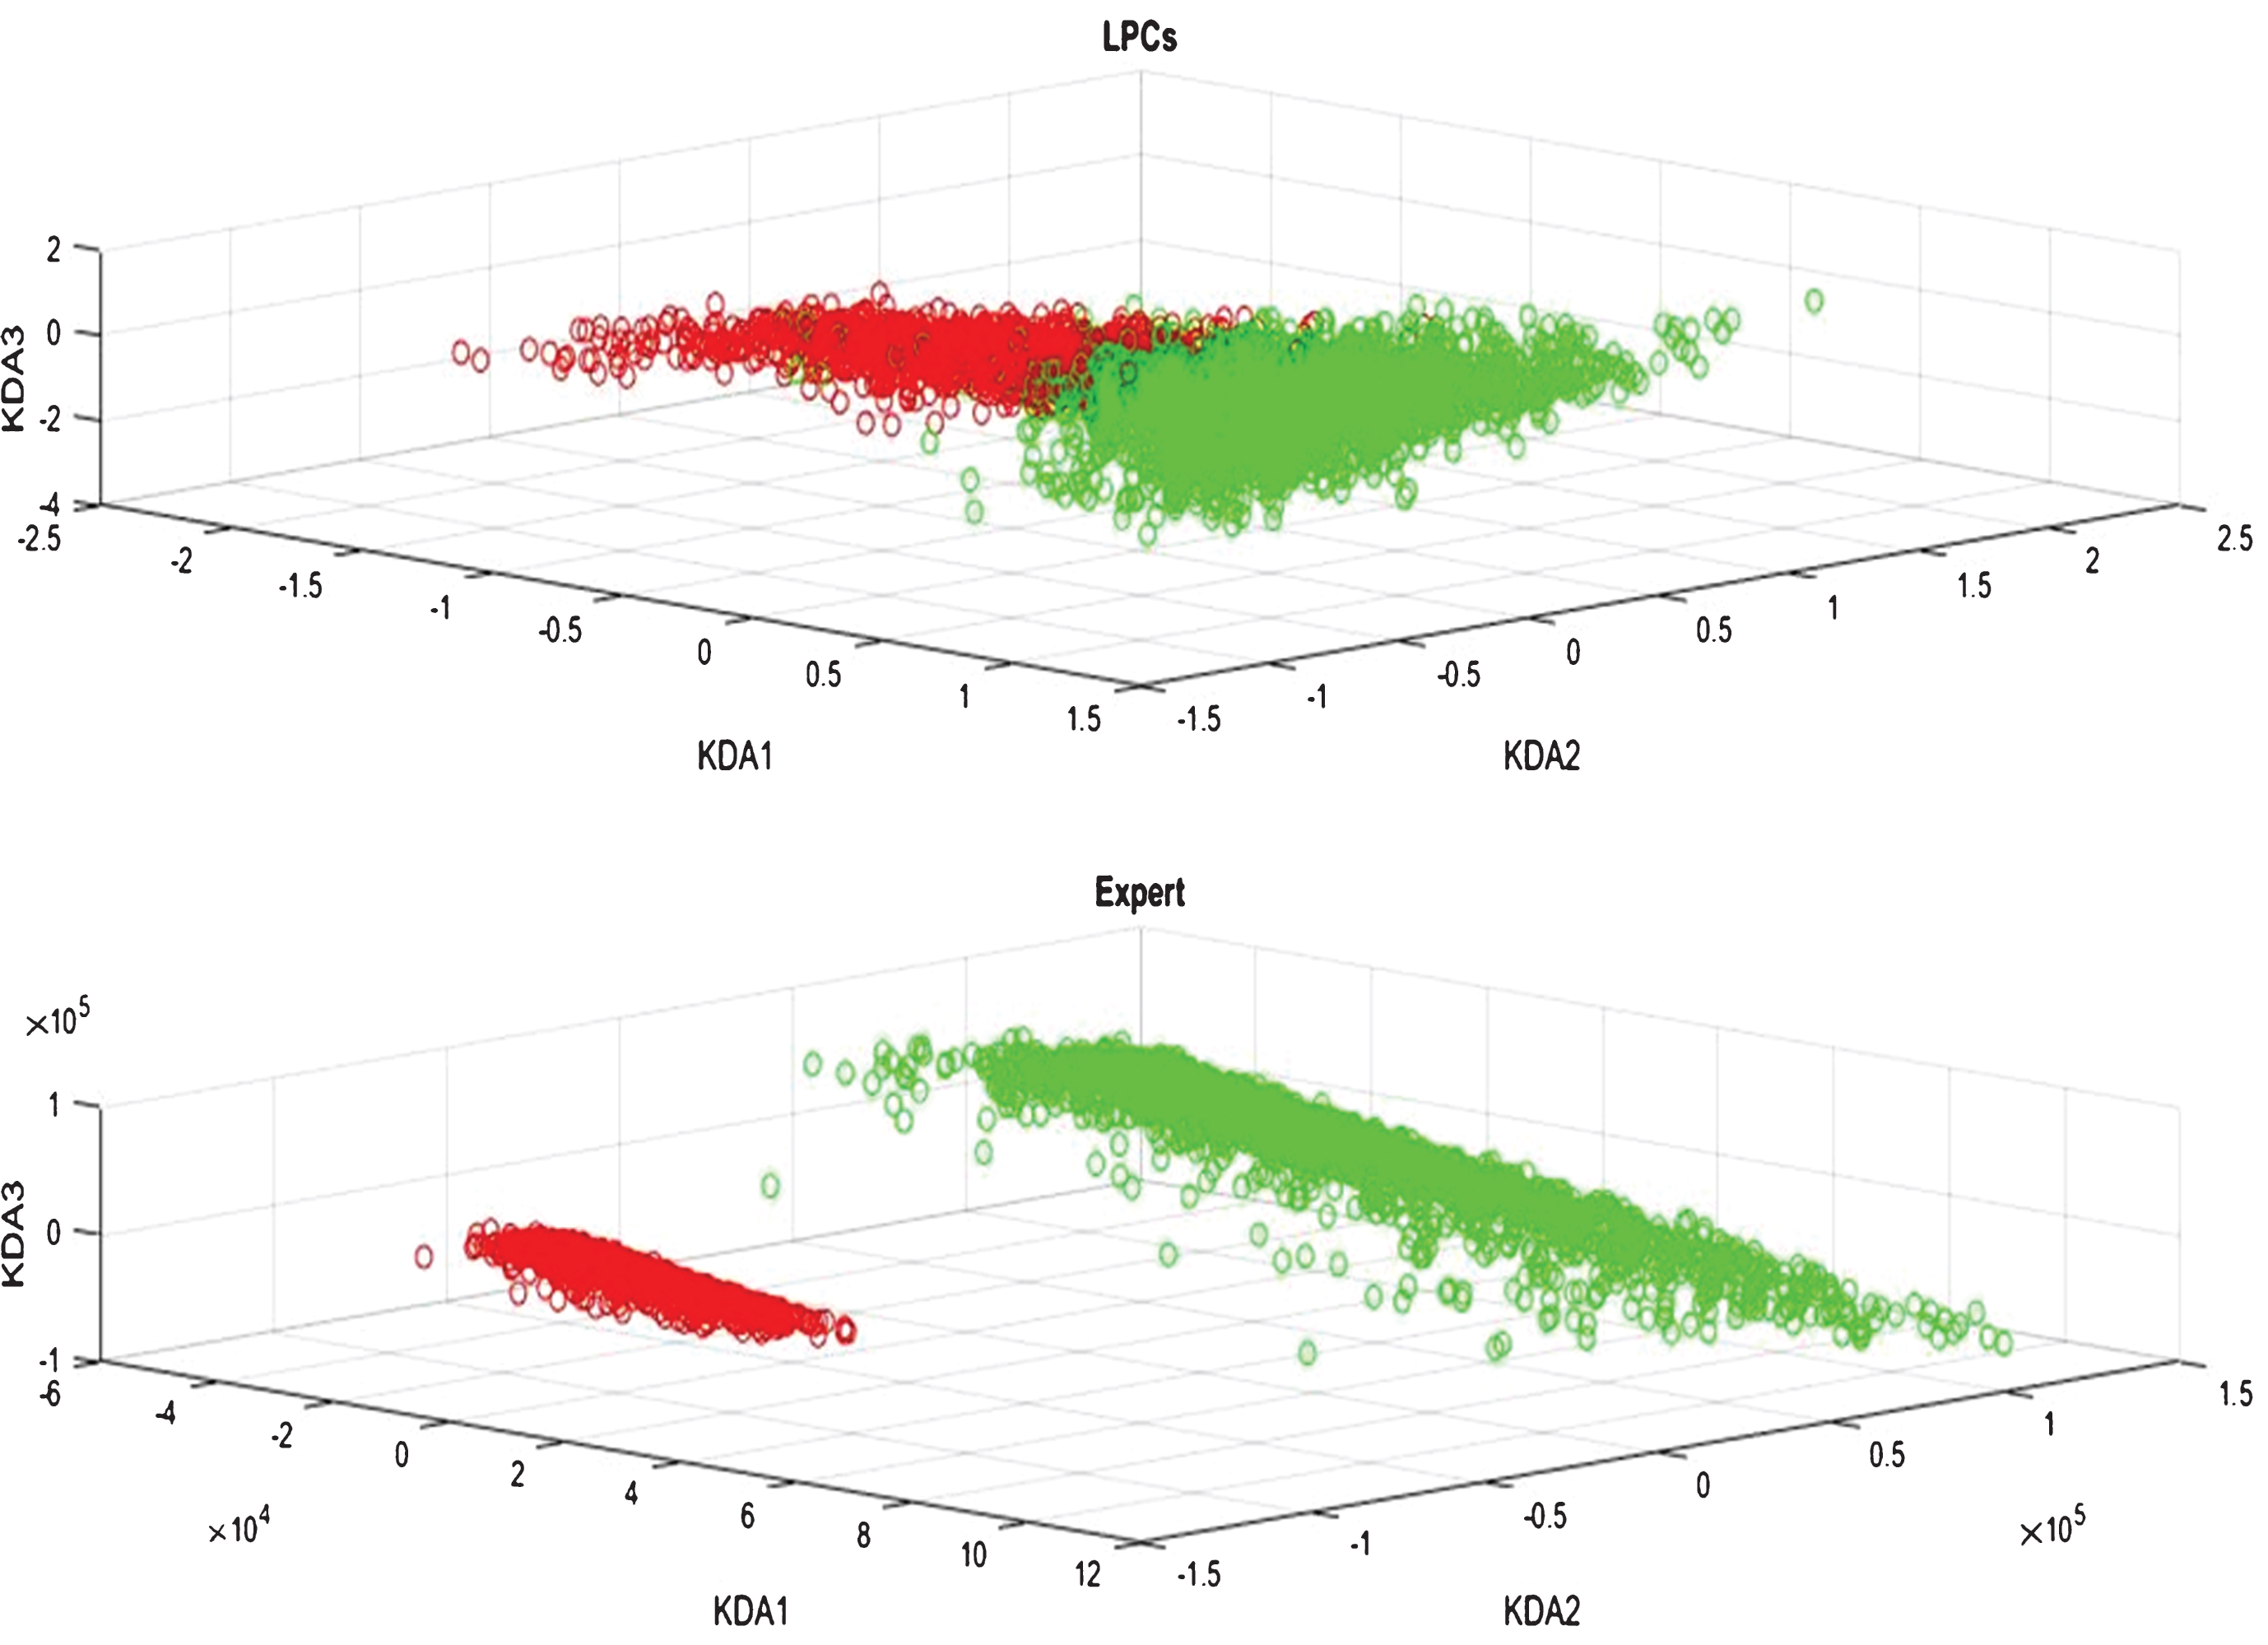
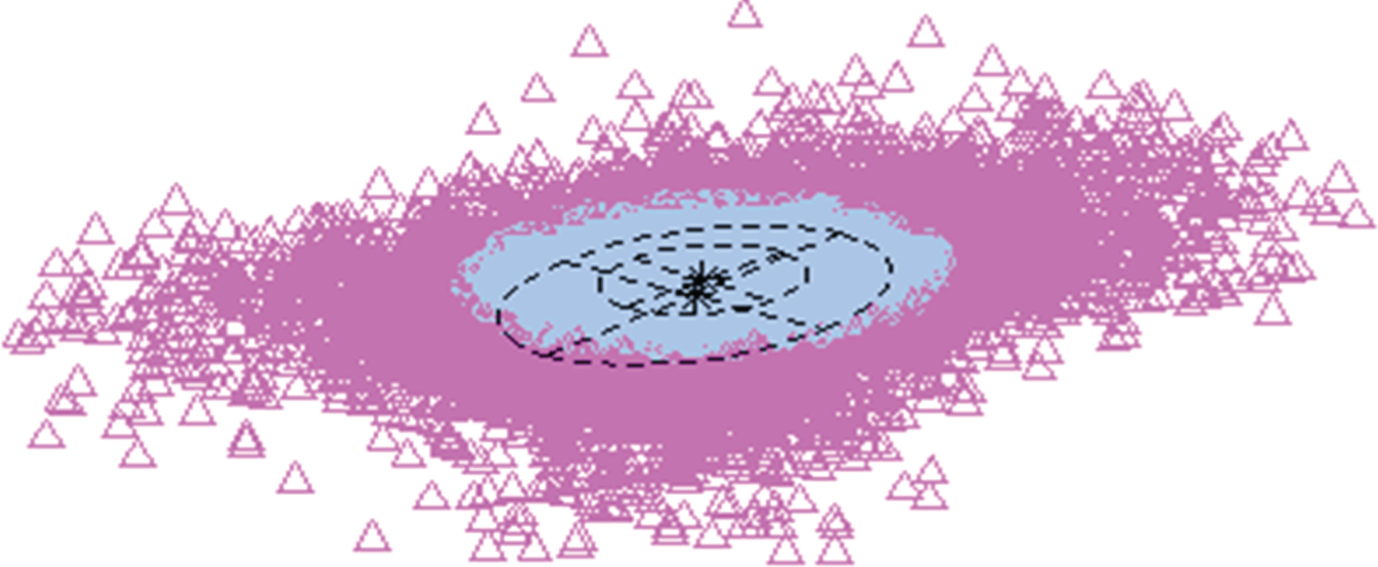
Figure 4 presents a three-dimensional graphical representation of two different classes, normal cries in green color and deaf cries in red color. The graphical representation of these classes is possible by reducing their dimensionality with Kernel Discriminant Analysis (KDA), a kernelized version of Linear Discriminant Analysis (LDA). Feature vectors are transformed into lower-dimensional feature vectors while preserving as much of the discriminatory information [17]. The solution to this dimensionality reduction maximizes the distance between the means of the classes and simultaneously minimizes variance within classes.
Kernel Discriminant Analysis (KDA) for Dataset with linear coefficients (top) and Data with nonlinear coefficients (bottom).
In order to reduce dimensionality while preserving as much of the class discrimination as possible a feature vector
The upper part of Fig. 4 shows the results of applying KDA to data, normal cries and deaf cries, for the case of feature vectors with linear coefficients. Each feature vector contains ten linear coefficients, and through KDA, its dimensionality is reduced to three so that datasets from both classes (normal cries and deaf cries) are plotted in the three-dimensional space.
The Fisher coefficient is a measure of the ratio of inter-class separation over intra-class variances, after KDA is applied to high-dimensional classes. Therefore, the higher the Fisher ratio the higher the discrimination among classes. For the case of KDA, applied to normal-cry class and deaf-cry class, with linear coefficients, the Fisher Coefficient is 1.7919×10-185.
The lower part of Fig. 4 shows how KDA is performed in both classes, normal cries and deaf cries, with linear mixed nonlinear coefficients (see subsection 4.1) as feature vector entries. Each feature vector in the mixed dataset contains 10 entries, and through KDA, its dimensionality is reduced to three. For the case of KDA, applied to normal-cry class and deaf-cry class, with linear mixed nonlinear coefficients, the Fisher Coefficient is 1.0215×10-162. The Fisher Coefficient for data sets with linear coefficients is lower than that of data sets with nonlinear coefficients mixed.
From the upper plot of Fig. 4 we can clearly see that classes (Normal Cries and Deaf Cries) in the dataset, corresponding to LPCs, are not separable. On the other hand, samples of different classes in the dataset, corresponding to LPCs + BIF, (lower part of Fig. 4) are linearly separable and the separation gap between classes is much higher than that corresponding to classes with only linear coefficients. The dynamic range of axes at the coordinate system for BIF data (with nonlinear coefficients mixed) is considerably higher than that of plain data (just linear coefficients).
This section describes the results of the baby cries classification obtained using two different methods: SVM and EM. These tests were performed in a Dell computer model E6510 with Windows 8 Operating System, Intel Core i5 processor and 4 GBof RAM.
Mixture of experts
As it is mentioned at the beginning of this work, the BIF is considered an expert that makes the obtained LPCs dependent of it. Hence, the probability of obtaining a certain Newborn Cry (NbC) type, depends on the input LPC that is assigned to the appropriate experts [18]:
For affecting the LPCs with the BIF expert, the approach is explained by Jordan & Jacobs in [19]; the expert acts as a filter which affects each one of the elements of the LPCs matrix. This follows the next formulation:
Where A is the resulting matrix of the LPCs affected by the expert; B is the BIF expert vector (
SVM is a kernel based supervised classification method with nonlinear capabilities that maps data into a higher dimensional space. This algorithm uses convex optimization and have a n2 computational complexity [20]. As a result, if there is an anomaly, the SVM method will still classify it as it is shown in Fig. 5.
Kernel Discriminant Analysis (KDA) for Dataset with linear coefficients (top) and Data with nonlinear coefficients (bottom).
The method is effective in high dimensional spaces and can use different kernel functions like linear, polynomial, Radial Basis Function (RBF) and sigmoid [21].
In this work, the SVM’s library in.NET of Matthew Johnson (which is available in his Github account [22]) was used in order to classify two types of newborn cries. The kernel used for the decision function was RBF (the library allows to use another kernel function), which is represented in the equation 9:
EM is a statistical algorithm used to maximize the likelihood of data [23]. The EMCluster package from R software was employed for clustering and classifying the two newborn cries analyzed in this work, according to the characteristics obtained. The functions and the parameters needed for the EM implementation are described in the EMCluster documentation [24].
The clusters for each baby cry without the BIF expert applied are shown in Fig. 6. The clusters for each baby cry with the expert mixed are shown in Fig. 7.
Baby cries without BIF expert.

Baby cries with BIF expert.
The algorithm implemented in this work is as follows: Estimate the LPCs coefficients Obtain the linear estimation error Affect the resulting LPCs matrix with the BIF expert vector as described in formula (10).
Results
One second normal and hearing loss newborn cry recordings were analyzed in 20 ms windows as mentioned in the abstract of this work, given this is the time lag for this signal type to be considered stationary; therefore, yielding 50 analysis windows.
It is important to mention that for the linear estimator in formula (2), dimension n = 10 was considered, given it can extract the newborn cry formant plus 4 more frequency components, see [25]. The nonlinear intermittent component was obtained using n = 1 as explained in Section 2.3. Hence, from each newborn cry window, 10LPCs + 1BIF were extracted, yielding a vector of 500 linear elements plus another of 50 nonlinear ones per cry. The 40 recordings of the two newborn cries types employed in this work belong to the Baby Chillanto Database [26].
The nature of the hereditary optimization technique for the LPCs and BIF extraction [8], allows to avoid the use of windowing and overlapping of 20 ms windows every 10 ms as it has been reported in some preliminary works [25].
In order to perform classification, two different.txt files were made; in each file, the 40 normal and 40 deaf baby cries were displayed as a single vector of 20,000 rows (500 for each cry).
The “leave-one-out” strategy was performed, which consists in taking one of the newborn cry patterns out (500) in order to train the classifier with the 39 ones left (19,500), to perform a classification test on both cry types. The training time is taken and presented in seconds and the test presents the percentage of classification.
The results are presented in Fig. 8 when using the SVMs, where the percentage of classification and the training time are illustrated including nonlinear features and without them. The mean percentage of classification using the mixture of experts’ data is 99.43%, while for LPCs only is 60.1325%. The training time has an average of 33.3195 seconds and 177.6825 seconds, respectively.
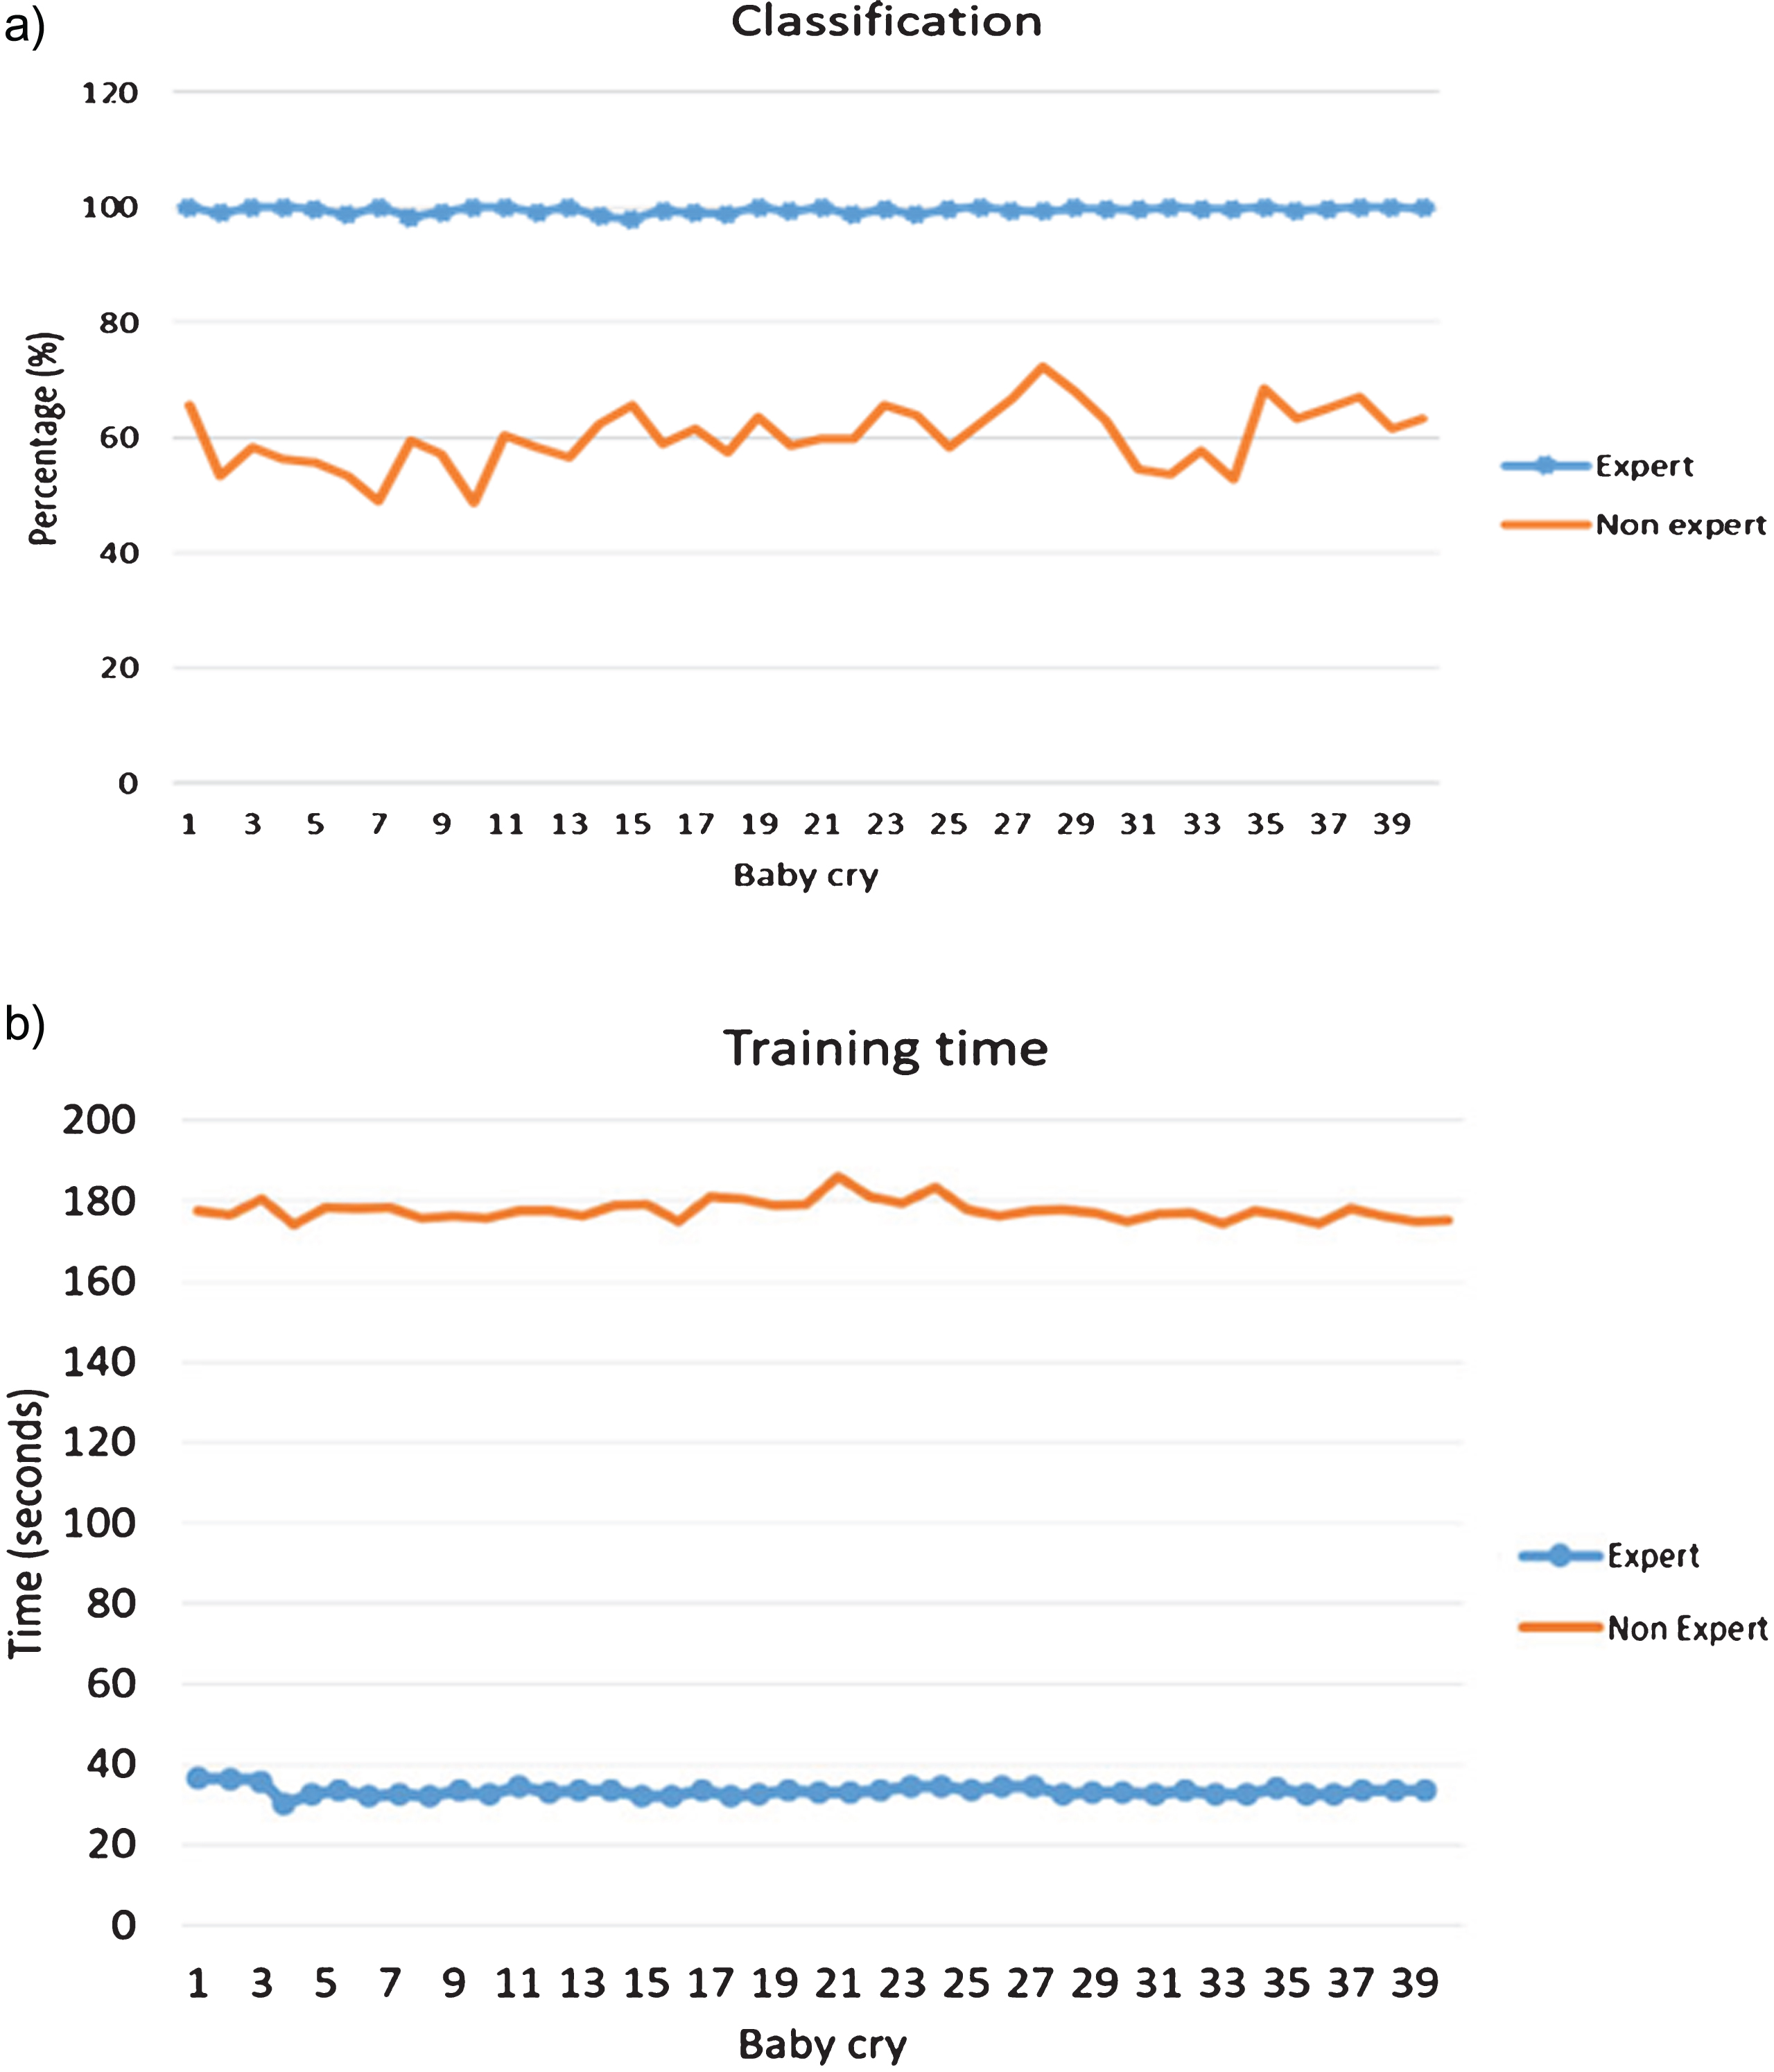
Results using SVM a) Classification percentage b) Training time.
The “leave-one-out” method was performed for the EM method as well. The results are presented in Fig. 9 where the percentage of classification and the training time are illustrated with the nonlinear features mixed and without them. The mean percentage of classification including the BIF expert is 99.84%, while it is of 48.30% when considering only linear features. The average training time is 4.34575 seconds when including the BIF and 4.61775 secondswithout it.
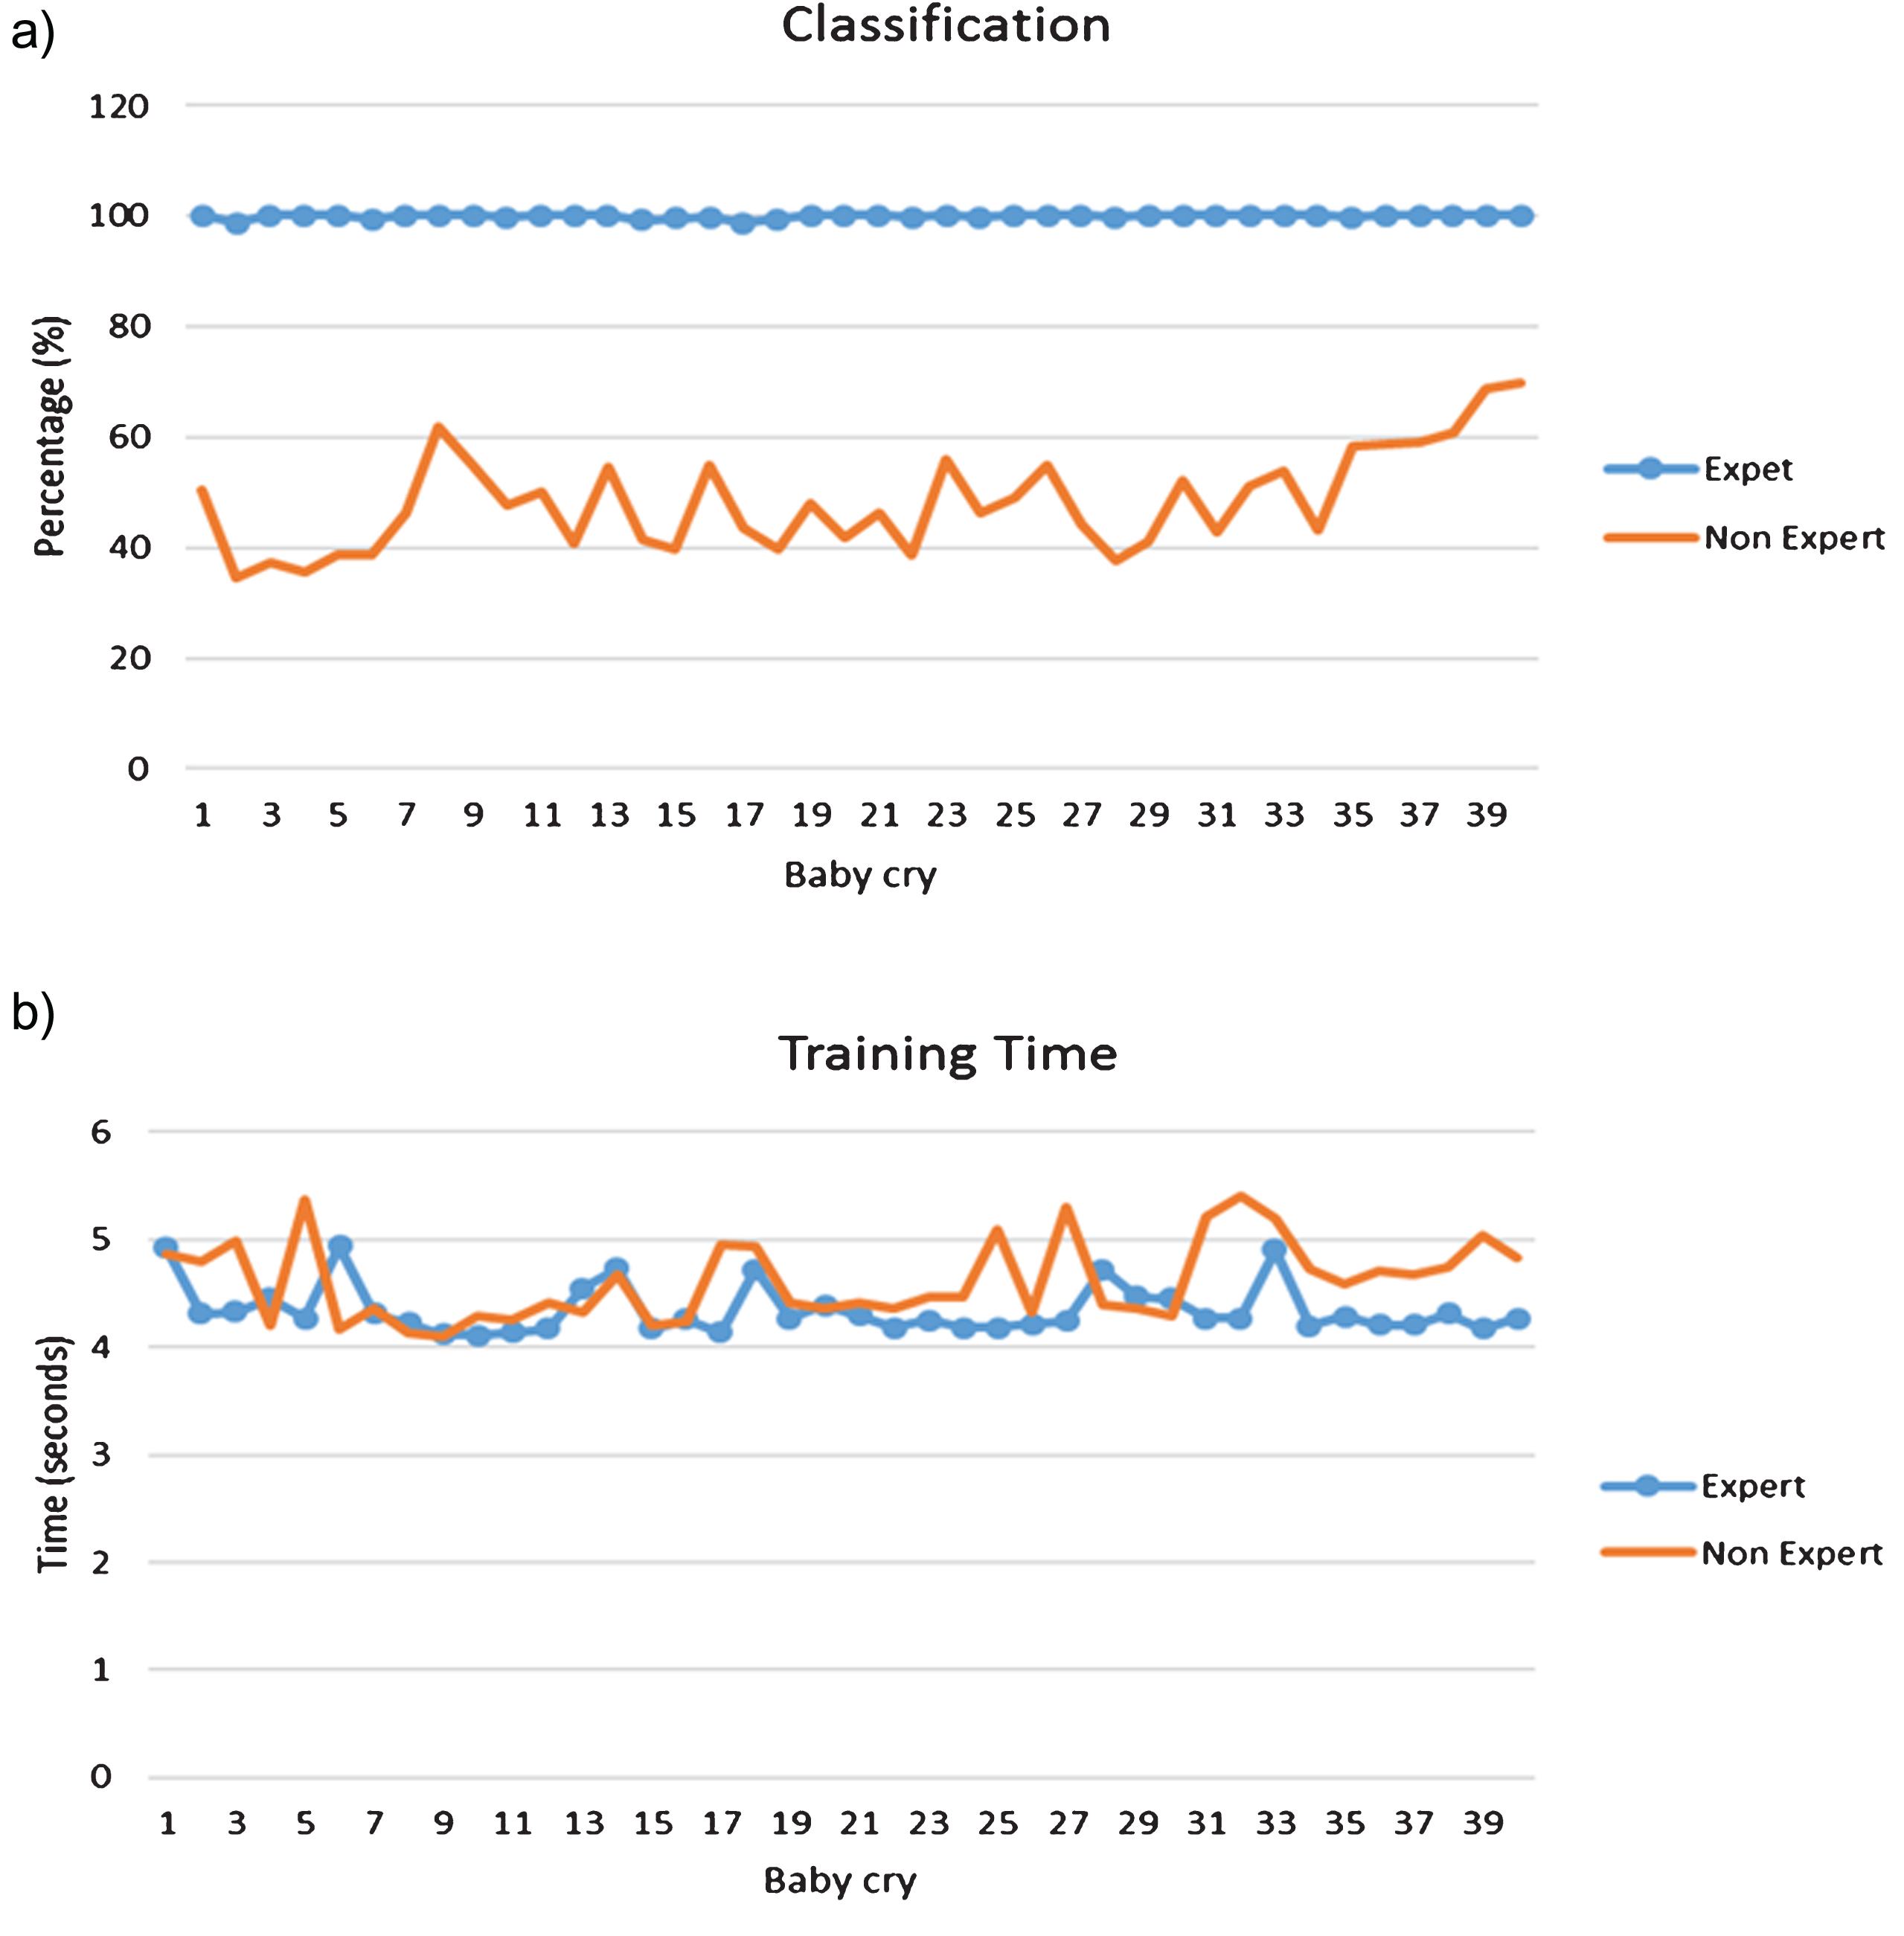
Results using EM, a) Classification percentage b) Training time.
The classification percentage is increased and the training time is reduced when including the BIF, for both SVMs and EM methods, given the features are clearly separated as shown in Section 3 for KDA features projection.
It is possible to extract nonlinear newborn cry features in order to use them for classification purposes. Besides this, it is the first time to the author’s knowledge that a cubic feature containing explosive behavior is employed for this task; elsewhere, it has been obtained for identifying turbulent behavior in sea waves [27] or airplane wings [28].
In this work, only 11 features were required to obtain a state-of-the-art classification percentage, given the discriminant qualitative contribution of the BIF feature and the mixing applied. Other comparable works for these two newborn cry types have reported the use of 20 time-frequency statistical features [29]. Recent analysis for preterm and term baby cries classification have selected 10 out of 22 features for an accuracy of 87% [30], considering this is a different problem which is mentioned here for the sake of completeness. Elsewhere, a systematic evaluation of various models used for infant cry classification is presented [31].
Speech analysis and synthesis commonly employs quadratic features in order to produce a more natural sound [3]. Normal, hearing loss, and asphyxia newborn cries do contain these nonlinear features as well and future work for this research is inprocess.
Footnotes
Acknowledgments
The Baby Chillanto Data Base is a property of the Instituto Nacional de Astrofísica, Óptica y Electrónica – CONACYT, México. We would like to thank Dr. Carlos A. Reyes-Garcia, Dr. Emilio Arch-Tirado and his INR-Mexico group, and Dr. Edgar M. Garcia-Tamayo for their dedication on collecting the Infant Cry database. The authors would like to thank Dr. Carlos Alberto Reyes-García, researcher at the CCC-Group at INAOE, México, for his confidence and support in providing the infant cry database. (![]() )
)
The authors would like to thank the Deanship of Research and Graduate Studies at UDLAP for the support given to publish this work.