
Abstract
Gearboxes and bearings play an important role in industries for motion and torque transmission machines. Therefore, early diagnoses are sought to avoid unplanned shutdowns, catastrophic damage to the machine or human losses; additionally, an appropriate diagnosis contributes to increase productivity and reduce maintenance costs. This paper addresses a methodological framework for the diagnosis of multi-faults in rotating machinery through the use of features rankings. The classification uses K nearest neighbors and random forest, based on the information that comes from the measured vibration signal. Thirty features in time domain are calculated from the vibration signal, twenty-four features commonly used in fault diagnosis in rotating machinery, and six features are used from the field of electromyography. Feature ranking methods such as ReliefF algorithm, Chi-Square, and Information Gain are used to select the ten most relevant features, the same ones that enter the classifiers. Five databases were used to validate the proposed methodological framework. The results show good accuracy in classification for the five databases; furthermore, in all the databases in the first ten features ranked by the three rankings methods are present at least two nonconventional features.
Introduction
Gearboxes and bearings play an important role in industries for motion and torque transmission machines. They are used in several industries such as aircrafts, automobiles, wind turbines, among other applications. Breakdowns of rotating machinery are mostly produced by gear and bearings failures; hence, some strategies are sought to avoid unscheduled stops, or catastrophic damages, in order to reduce maintenance costs and increase reliability [1–3]. Due to the complicated configuration of the gearbox, it is challenging to recognize fault existences and, if any, the failure patterns because the bearing and the gear have different fault patterns; in addition, the fault can appear in both elements. Therefore, multi-fault diagnosis of rotating machinery has gained much attention in order to guarantee safe operations in industries [4, 5].
Data-driven methodologies for condition monitoring use four basic stages to diagnose gearbox and bearing fault patterns: i) acquisition and conditioning of the signal, ii) feature extraction, iii) feature selection, iv) classification [6].
The signal can be acquired from various physical variables such as vibration [3, 8], infrared thermal [9], acoustic emission signals [10], current [11], among others. Vibration signal analysis is the most commonly used technique for condition monitoring because it is easy to measure it; furthermore, it is not necessary to stop the machinery for diagnosis.
Feature extraction of acquired signals can be characterized and analyzed into three domains: time domain, frequency domain, and time-frequency domain; the goal of feature extraction is to obtain the information relevant for understanding and interpretation of the rotating machinery condition [12]. To extract features in the frequency domain techniques such as the Fast Fourier Transform [13], cepstrum [14], power spectral density [15], among others, are used. In the time-frequency domain the Wavelet Transform (WT) is reported as a powerful tool that has gained great attention in several fields as a powerful signal analysis tool for rotating machinery fault detection and diagnosis [16, 17]; additionally, the Empirical Mode Decomposition (EMD) is one of the most powerful signal processing techniques and has been extensively studied and widely applied in fault detection and diagnosis of rotating machinery in this domain [18]. The domain frequency and time-frequency approaches employ complex algorithms to extract a representative set of features. Time domain signals generally contain information on how signal amplitude is varied with respect to time; their analysis can be computationally less expensive to implement and the only necessary preprocessing is to condition the signal. This analysis is simple, involves visually inspecting parts of the time waveform, and detecting abnormal behaviors; however, vibration signals produced by a machine contain many components and it can be very difficult to see them in the time domain, so, it is unlikely that a fault will be detected by a simple visual inspection. Hence, instead of visual inspection of the signal a set features of statistical parameters, called condition indicators, can be extracted; these parameters can be compared with predefined thresholds to determine whether the machine presents normal or fault condition [19–21].
The feature selection is very important prior to the stage of pattern recognition because it allows the elimination of noisy, redundant or irrelevant features by which the set of features is considerably reduced, in most cases allowing to optimize classification tasks and increasing the performance in the learning algorithms. Selecting an appropriate feature or set of features to reflect the condition of the equipment is a critical task in the diagnosis process. It is expected that a good feature or set of features will allow one to distinguish between normal and fault conditions; in addition, it allows the establishment of a trend analysis, avoiding the influence of other parameters of operation of the equipment [22]. In most study cases, feature selection has been considered as a dimensionality reduction problem where several techniques are used, such as Principal Component Analysis, Multidimensional Scaling, Factor Analysis, Projection Pursuit, Kernel Fisher Discriminant Analysis, and other techniques. However, these types of methods commonly generate synthetic features with lower dimension than the original set; consequently, these reduced set features lack of physical significance [23, 24]. The feature ranking methods such as Fisher score, ReliefF algorithm, Wilcoxon rank, Gain ratio, Memetic feature selection, Chi-square, and information gain have been used to select relevant features and improve precision in the diagnosis of failures in rotating machinery [25] and particularly bearing failures [26–29].
Different artificial intelligence techniques have been employed to classify the healthy condition of different failure patterns in rotating machinery. Artificial Neural Networks (ANN) have been used for fault detection in gearboxes since they can be trained for early detection of faults [30]. Recently, Random Forest (RF), as a classification technique, has been used for diagnosis in several areas of engineering [31, 32]; RF it is one of the most accurate machine learning techniques available, and it runs efficiently in case of having a large number of input features and low number of available samples [33, 34]. RF has been used in the diagnosis of failures in gearboxes [16] and bearings [29, 36]. The K nearest neighbor (KNN) is a classification algorithm it has been studied extensively and used successfully in many tasks of pattern recognition. But the KNN present serious problems when features of different classes overlap in some regions in the feature space, so it is a classifier that needs relevant features [3, 37]. Deep learning techniques have also been used for gearboxes condition monitoring [5, 38]. Although the classification techniques reported in this section have had high accuracy, it is necessary to configure several parameters for each of them, specially the number of features at the input. Usually the input features to the classifier must be extracted from the two or three domains to obtain a high accuracy in the classification, as reported in [7, 39–41] or use features obtained from the time-frequency domain [16, 29]. But the feature extraction in two or three domains represents a high computational load to process the signal; for this reason, the authors of this article propose to use time-domain statistical features to classify the failures in rotating machinery with less computational complexity in the signal processing.
In references [27, 42], features are extracted in the time domain considering statistical parameters and entropy as a measure of disorder; good results are reported in the classification of failures in bearings. In reference [43], Zero-crossing (ZC) features extracted from time-domain motor vibrations are useful in classification of bearing faults. ZC features have been effectively used in various signal processing and pattern recognition engineering fields such as speech recognition, automobile classification, and biomedical applications. The simplicity in extracting such features make them very attractive when compared to the features extracted from frequency and the time-frequency domains. Recently, in [44] authors used six time-domain features that are normally used in the biomedical field and six conventional features that are used in the diagnosis of rotating machinery, very promising results were obtained with the inclusion of the non-conventional features for the classification of faults in bearings. It is also emphasized that the nonconventional features improve the accuracy of the classification compared to the conventional features for the case of bearings.
In this paper, the authors address a methodological framework to select the optimal number of feature set using Chi-square, ReliefF, and information gain feature ranking methods; RF and KNN classifiers are used for the evaluations. This article uses thirty features, of these six features ZC, slope sign change, Wilson amplitude, log detector, wave length, and square root amplitude value are not reported in the literature that have been used for the fault diagnosis in gearboxes. Five databases are used to evaluate the methodology and relevance of the six new features.
The document is organized as follows. Section 2 presents the five experiments in rotary machinery used to evaluate the proposed methodological framework. Section 3 presents the theory used in this work. Section 4 introduces the proposed methodological framework for Multi-fault diagnosis of rotating machinery by using feature ranking methods and machine learning. Section 5 shows the results of diagnosis using the feature ranking in the time domain by following our framework, and finally, Section 6 presents some conclusions.
Data acquisition
Five vibration signals datasets were used to validate the proposed methodology. Four datasets correspond to different configurations of a gearbox that were used to carry out the experiments, the fifth used dataset was from the Case Western Reserve University (CWRU) Bearing Data Centre [45].
Four experiments were carried out on a gearbox fault diagnosis testbed, the gearbox can be configured to experiment in one stage (coupling Z1 and Z2 or Z3 and Z4) or two stages as shown in Fig. 1. The gearbox to be diagnosed is driven by a motor through a coupling. The speed of the motor is controlled by a frequency inverter (DANFOSS VLT 1.5 kW). The output shaft of the gearbox is connected to an electromagnetic torque load (ROSATI 8.83 kW) through a belt transmission. The electromagnetic torque load was controlled by a torque controller (TDK-Lambda, GEN 100-15-IS510), which allows one to adjust the torque of the load manually. The vibration signals of the gearbox are collected by an accelerometer. The outputs of the accelerometer are fed into a laptop through a Data acquisition systems (DAQ).
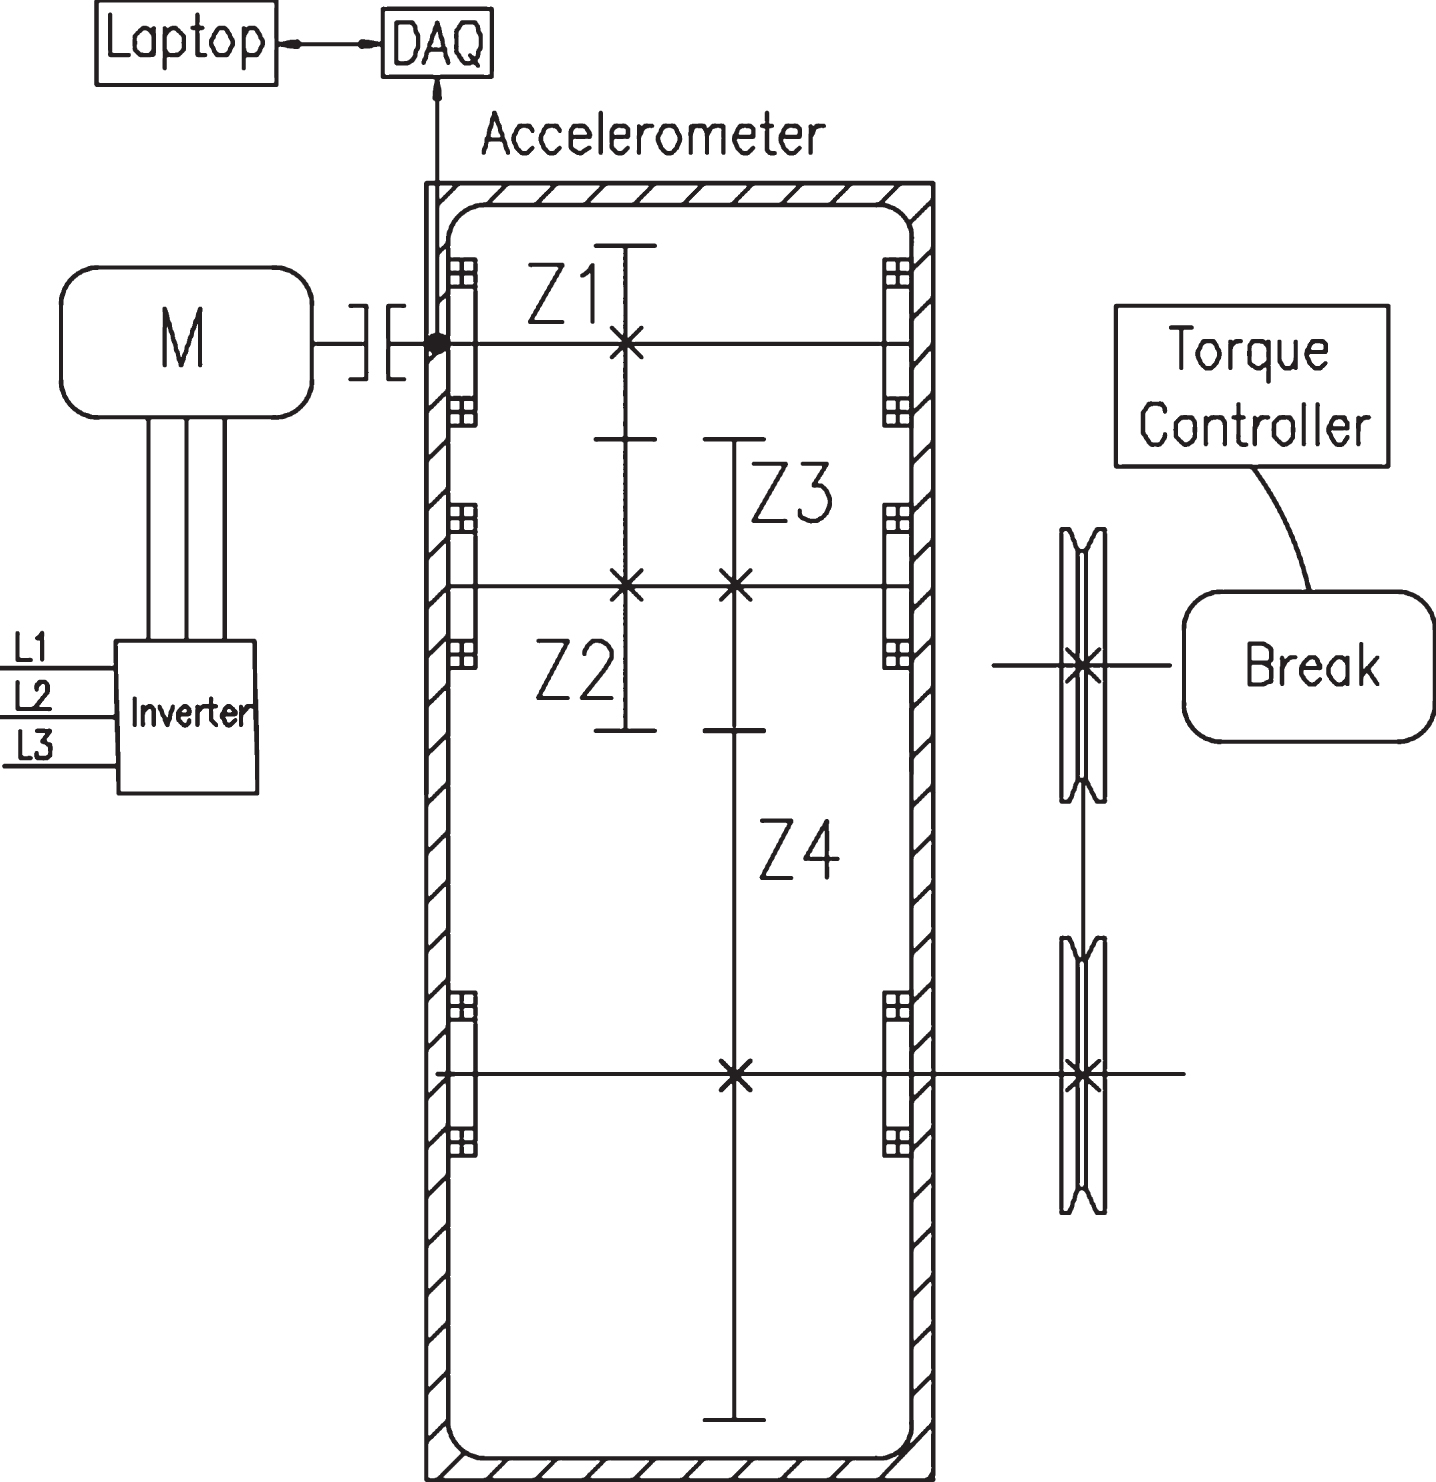
Schematic of the experimental test bed for simulation of faults in rotating machinery.
Dataset 1 (DB1): the configuration #1 is as shown in Fig. 1, two spur gears (number of teeth Z3 = 53, and Z4 = 80 with modulus 2.25 and impact angle 20°) were installed on the input and the output shafts of the gearbox, respectively. We used 10 condition patterns, normal gears, 5 faulty input gears, 3 faulty output gears and 1 faulty in the output and input gear. The experiments were performed with using three loads, three constant speeds, and three variable speeds, in each of them, five samples were collected; in this way, we obtained 900 vibration signals corresponding to 10 condition patterns. More details of the experimentation can be found in references [24, 46].
Dataset 2 (DB2): configuration #2 as shown in Fig. 1, the input gear and the output gear were chosen as helical gears (number of teeth Z1 = 30, and Z4 = 80 with modulus 2.25, impact angle 20°, and helical angle 20°). An intermediate shaft with two helical gears (Z2 = Z 3 = 45) was installed between the input and the output shafts for the transmission. In this experiment we used 11 condition patterns, normal gears, 6 faulty gears (1 input gear, 3 intermediate ones and 2 output ones), 3 faulty bearings (with 1 inner race fault, 1 outer race fault and 1 ball fault, respectively), and 1 eccentric bearing box. The experiments were performed with three constant loads and three speeds, in each of them, five samples were collected; the experimental data are acquired for each one of the gearbox conditions patterns, resulting in a data set with 495 vibration signals. More details of the experimentation can be found in references [38, 46].
Dataset 3 (DB3): the configuration #3 is as shown in Fig. 1, two spur gears (number of teeth Z1 = 27, and Z2 = 53 with modulus 2.25 and impact angle 20°) were installed on the input and the output shafts of the gearbox, respectively. We used 7 condition patterns, normal gears, 2 faulty input gears, 3 faulty output gears and 1 faulty misalignment in output gear. The experiments were performed with three loads and five constant speeds, in each of them, ten samples were collected; in this way, we obtained 1050 vibration signals corresponding to 7 condition patterns. More details of the experimentation can be found in reference [34].
Dataset 4 (DB4): configuration #4 as shown in Fig. 1, the input gear was chosen as helical gear (Z1 = 30, with modulus 2.25, impact angle 20°, and helical angle 20°) and as output gear were chose helical gear Z2 = 45. In this experiment, 10 condition patterns were used to simulate tooth breaking severity of gear Z1, normal gears, 9 levels of severity of broken tooth in Z1 and Z2 in healthy conditions. The experiments were performed with 3 loads, 3 constant speeds and 2 variable speeds, in each of them, 5 samples were collected; in this way, we obtained 750 vibration signals corresponding to 10 condition patterns. More details of the experimentation can be found in references [47, 48].
Dataset 5 (DB5): was obtained from CWRU Bearing Data Centre [24] relative to the 6203-2RS JEM SKF deep groove ball bearing. Vibration signals acquired through accelerometers placed at 12 o’clock on the bearing housing, sampled at 12 kHz the signals were collected under the 0 load at four successive rotation speeds 1730, 1750, 1772, and 1797 r/m. Four condition patterns were simulated: the fault diameters were 0,1778 mm in i) inner race, ii) outer race, iii) ball, and iv) no fault. For each of the above operating conditions, 20 data acquisition experiments were performed, for each signal the data length was 2000 points.
Feature extraction
Several traditional techniques analyze the statistical properties derived from vibration signals for the detection of faults in rotating machinery [49]. Other fields, such as biomedical engineering use electromyography (EMG) signals [50]. These techniques could work together with traditional features to improve the performance of fault classification systems.
For this purpose, a total of thirty features are obtained from a vibration signal and are show in Table 1. Of these, twenty four (T1 to T24) are commonly features used for the diagnosis of failures in rotating machinery [51–53] and the six (T25 to T30) remaining come from the analysis of EMG signals [50, 54].
Time-domain features
Time-domain features
Where x i is a signal for i = 1, 2, …, N. N is the number of data points.
ReliefF algorithm
It is an extension of the Relief algorithm (used for binary classification), which seeks to estimate the quality of the features that allow discriminating between neighboring instances [55]. ReliefF algorithm starts by selecting a random instance then looks k nearest instances of the same class and k nearest neighbors for the different classes. This updates a weighting vector
This test is used in statistics to test the independence of two events [56]. For feature ranking it allows testing if the occurrence of a specific feature and the occurrence of a specific class are independent. Thus, when a feature is independent of the class this is discarded [29]. It can be computed by:
A metric that allows quantifying the amount of impurity in a data set is known as entropy and is represented by H. From this, it is possible to define an IG measure that reflects the additional information about the class Y provided by the feature X that represents the amount by which the entropy of Y decreases [57]. This measure is given by:
K-nearest neighbor (KNN)
It is a non-parametric classification model which uses a training dataset as the basis for the classification of new samples, belonging to the test dataset, applying the criterion of the nearest neighbor. This approach allows finding k samples of the training set that are closer to the new test sample, whose labeling will be based on the classes that predominate in the neighborhood [58].
Given a training set
One of the key points when using KNN is the choice of k value, if it is very small the classifier can be very sensitive to noise, on the other hand, if it is very large it can group many neighboring samples belonging to several classes. Therefore, it is necessary to use a more sophisticated approach for class labeling. This is based on weighting the contribution of each neighboring sample as a function of the distance that exists with respect to the sample to be classified, giving greater weight to the nearest neighbors. For this, it is used a weighting factor that is a function of the inverse square of its distance:
In this way the KNN algorithm is defined as follows:
Another key point when using KNN is the selection of the distance metric, usually using Euclidean distance, but also has the measure of similarity cosine or other metrics such as Minkowsky1, Correlation, Chi-Square among others [59].
It is a potent classifier based on multiple sets of decision trees (CART), which are created by selecting a fraction of bootstrap samples of the input data and the random choice of a subset of variables [60]. In this way the ideas of bagging and the random selection of features are combined; this helps reducing variance and over fit. Each tree gives a sorting, and random forest decides which class is featured to each sample by counting a majority of votes from the response of each tree.
The input data, which were selected to create the trees, are known as data in the bag and the remaining data are out-of-bag observations (OOB) [61]. For each tree t of the forest, OOB
t
is his sample OOB associated. And the error for the classification is defined by:
The vibration signals produced in healthy and faults conditions of the machine are used to calculate 30 features in time domain. Finding the best features that allow good performance in diagnosis will help to optimize the learning process.
In order to analyze the contribution of EMG attributes in fault diagnosis a ranking stage is used, where the best Z attributes will be evaluated by two classifiers RF and KNN to measure their performance through the accuracy of each of the classifiers.
The methodological process, exposed in Fig. 2, consists of the following stages:

Methodological process.
Stage 1: acquisition and conditioning of the vibration signal of the rotating machinery.
Stage 2: calculation of 30 features for each signal as shown in Table 1.
Stage 3: form the feature vector W with the 30 features obtained in stage 2.
Stage 4: feature ranking is performed using three different methods; ReliefF algorithm, Chi-Square and Information Gain.
Stage 5: vector Z, corresponding to the first 10 features ranked by each of the rankings methods, is formed.
Stage 6: RF and KNN are used for the classification stage. Each features groups of the previous stage are evaluated. A cross-validation criterion was implemented using 5 folds: 4 for training and 1 for test. For RF training setting it was used 40 trees, to number of variables to select at random for each decision split were square root of the number of total variables and out-of-bag error was used for training evaluation, on the other hand, for KNN training setting it was implemented cosine as distance metric with 3 nearest neighbors.
Stage 7: the results delivered by each classifier are presented for each group of rankings method.
This methodology was evaluated for five different databases.
The objective of this study was to evaluate a methodological framework to rank features in multi-fault diagnosis of rotating machinery by using RF and KNN classifiers, and know the relevance of using nonconventional features in fault diagnosis processes for rotating machinery. Five databases were used to evaluate the methodology and relevance of the six nonconventional features.
For each database were extracted thirty features in time domain, of these, six features ZC, Slope Sign Change, Wilson Amplitude, Log Detector, Wavelength and Square root amplitude value are not reported in the literature that have been used for the fault diagnosis in gearboxes and the remaining twenty-four are conventional features in fault diagnosis. The thirty features were ranked through Chi-square, ReliefF, and information gain feature ranking methods. Then the top ten features ranked by each of the methods are entered into the RF and KNN classifiers. Table 2 presents the results obtained for each dataset; it can be observed the top ten features by ranking method and the classification accuracy for RF and KNN. The minimum nonconventional features are two which appear in each ranking method and for all databases. On the other hand, the maximum number is 5 of the total 6 this for DB3 using the ReliefF algorithm. This shows that the nonconventional features are among the top ten for the different rankings methods. As for the attributes, Zero crossing and SSC these are present in the 5 databases when was used ReliefF.
Ranking and classifier accuracy results for each data sets
Ranking and classifier accuracy results for each data sets
Table 3 was created using Table 2; the total number of replicates of each of the features for all databases is presented. Where Zero crossing, SSC and Wave length fill the first positions, with 12, 11 and 9 repetitions respectively, proving that these features are the most influential for fault diagnosis in rotating machinery.
Repetitions for each feature
The accuracy in the classification in DB1 exceeds 95.0% from using the sixth feature of any of the ranking methods for both the RF and KNN classifier, while the highest accuracy is 99.3% with the nine features ranked with the Chi-Square method for KNN, which is slightly higher than the one obtained in the reference [24, 46] in reference [24] that achieved 98.5% and proposed Hierarchical feature selection based on relative dependency for gear fault diagnosis and use the three domains to extract the features. The reference [46] was 97.08% and proposed Multimodal deep support vector classification with homologous features and its application to gearbox fault diagnosis also processed the three domains of the signal.
In DB2 exceeds 96.0% accuracy using the eighth feature of any of the rankings methods for the RF and KNN classifiers. The highest accuracy is achieved 98.8% with the nine features ranked with the Information Gain method for KNN, accuracy is higher than that reached in the reference [46] and slightly in the reference [38]. At reference [46], 88.41% accuracy was obtained for this purpose Multimodal deep support vector classification with homologous features and its application to gearbox fault diagnosis but processed the three domains of the signal. At reference [38] 97.68% accuracy was obtained for this purpose diagnosis based on deep random forest fusion of acoustic and vibratory signals.
For the case study of DB3, 80% accuracy is exceeded with the RF classifier from the sixth feature entered with the ReliefF and Information Gain rankings. For the KNN classifier, 76.9% accuracy is achieved by entering the ten ranked features. The features ranked by the Chi-Square method are the least accurate in the classification achieved by both RF and KNN. This database was studied in the reference [16, 34] and accuracy was reached higher than 94%, but 256 and 185 features were used respectively, the features were extracted from the domain time frequency in concrete energy from the coefficient of wavelet packages.
In DB4 it exceeds 93.0% accuracy from using the ninth feature of any of the ranking methods for both the RF and KNN classifier. The highest accuracy is 95.7% with the nine features ranked with the Information Gain method for both the RF and KNN classifiers, similar to the one obtained in the reference [47] that achieved 95.5% and proposed automatic feature extraction of time-series applied to fault severity assessment of helical gearbox in stationary and non-stationary speed operation.
For the DB5 with the first three features ranked by the Chi-Square method, 97.5% accuracy in the classification is exceeded, both by RF and KNN, to reach this accuracy with the remaining two ranking methods, the nine features must be used and KNN, to reach this accuracy with the remaining two ranking methods, the nine features must be used.
This paper addressed a methodological framework for the selection of the optimal number of feature set using Chi-Square, ReliefF, and Information Gain feature ranking methods. The evaluation was performed by using RF and KNN classifiers and five databases were used to evaluate the methodological framework.
For each of the five databases, 30 features were calculated in the time domain, 24 correspond to conventional features and 6 nonconventional features, but are generally used in the EMG field.
The calculated features of each of the databases were ranked by the methods Chi-Square, Information Gain, and ReliefF. From the rankings of the features, it was observed in Table 2 that in the five databases and by the three ranking methods used at least two nonconventional features were present within the first ten features. In addition, the nonconventional features ZC, SSC, WL, and SRAV, were the most present in the first ten features by the different rankings methods. This indicates that the inclusion of the nonconventional features is relevant for the diagnosis of failures in rotary machinery.
On the other hand, for DB1, DB2, DB4 and DB5 the accuracy of RF and KNN classification was high, but for DB3 83.0% was reported with RF and 76.9% with KNN, indicating that the methodology can be improved with the inclusion of new features in either time, frequency, or time-frequency domains. As indicated in the discussion the DB3, good results were obtained in the references [16, 34], but they employ a great number of features in time-frequency domain.
The easy implementation of the methodology compared to the works referenced in the discussion, where the same case studies were used, suggests that the use of nonconventional features helps to improve the accuracy in the classification and it would be feasible to implement it online for the diagnosis of failures in rotary machinery, in particular because features are processed only in the time domain.
Footnotes
Acknowledgments
This work was funded by the Universidad Politécnica Salesiana under grant No. 002-002-2016-03-03. The experimental work was developed at the GIDTEC research group lab of the Universidad Politécnica Salesiana de Cuenca, Ecuador.