
Abstract
Local defects of rotating machinery give rise to periodic impulses in vibration. To acquire this fault information, many diagnostic methods have been reported in the past decades. Among them, the envelope spectrum analysis is usually used as the final diagnostic tool; however, its success highly depends on the correct informative frequency band selection. The key problem is how to find the correct centre frequency and its related bandwidth associated to the fault. In this paper, a novel method is proposed for selection of the optimal frequency band parameters. This method improves the informative frequency band selection performance with two aspects. One is that it incorporates the normal data as a health reference, and the other is that an objective indicator that could fuse multidimensional information is proposed. An optimal frequency band can be obtained through this algorithm, and fault mode is then determined via comparing the squared envelope spectrum between the test and normal signals. At the end of this paper, the proposed method is validated on two diagnosis cases and is compared with two of the other diagnostic methods: the conventional envelope analysis and the kurtogram. Though comparison of the results, the validity and superiority of the proposed method have been proven.
Introduction
Gear and bearing are the main components of rotating machinery. Their reliability has crucial influence on the safety of the machinery system. Analysis should be taken to identify their defects before the catastrophic failure and significant damage to other parts of rotating machinery. Vibration signal analysis, an effective method, has been widely studied in the past decades for rotating machinery fault diagnosis, e.g., fast Fourier transform [1], envelope spectrum analysis [2, 3], short-time Fourier transform [4], and wavelet transform [5]. However, vibration signal tends to be quite complex in reality as the mutual interference between multiple rotating components, e.g., gear, bearing, and shaft. Furthermore, the incipient damage signal with small vibration energy is prone to be submerged into ambient noise [6]. These factors will bring a complex spectrum that degrades the abilities of conventional fault diagnosis algorithms.
Squared envelope spectrum [7, 8] is commonly used as the final diagnostic tool to get information about fault characteristic frequency. To deal with the complex spectrum, envelope analysis is suggested to be conducted on a resonance frequency band to eliminate influence from other irrelevant components [9]. Therefore, informative frequency band selection that aims to recognise this resonance frequency band has been considered a key step in fault diagnosis. Many studies have been found in the literature. Lin and Zuo [10], to some extent, were pioneers in the selection of the informative frequency band. They introduced an adaptive Morlet wavelet band filter and optimised the filter parameters through the kurtosis maximisation principle. Besides, Antoni et al. have done some representative work of the informative frequency band selection based on spectral kurtosis, from the theoretical basis of spectral kurtosis [11] to application for the diagnostics of rotating machinery [12]. Subsequently, kurtogram [13] was put forward to improve the efficiency of the spectral kurtosis. However, it fails in the presence of a relatively strong, non-Gaussian noise with high peaks or a high repetition rate of fault impulses [14].
Recently, many studies attempt to optimise the kurtogram [15–21]. In [15], an enhanced kurtogram was introduced; the major contribution is that the kurtosis values were calculated based on the power spectrum of the signal envelope. Zhang et al. [16] explored a new and improved kurtogram. They utilised the correlated kurtosis, rather than kurtosis, to determine the optimal frequency band. Another improved kurtogram method was put forward in [17], which utilised the wavelet packet transform filter, rather than the filter of the original kurtogram, to precisely match the transients in the noisy signal. Wang and Liang [18] tested an improved spectral kurtosis algorithm towards finding the filter parameter. The method was built upon a window superposition technique, which was beneficial to the adaptive estimation of centre frequency and bandwidth. Wang et al. [19] provided an improved algorithm, named SKRgram, which is the ratio matrix of the fault signal spectral kurtosis matrix and the baseline spectral kurtosis matrix. The method can locate the fault frequency band without eliminating the ambient noise interruption. It also has limitations to the vibration with periodic transients. In [20], the authors presented a novel method, called the PAR-based kurtogram, to choose the informative frequency band with periodic impulses. Gu et al. [21] took advantage of wavelet packet transform in conjunction with frequency domain correlated kurtosis to detect the bearing fault.
Apart from the kurtogram and its enhanced versions, Li et al. [22] applied fuzzy clustering as a soft segmentation method for generating more meaningful frequency bands, and the minimum comprehensive cost is used to guide the optimal informative frequency band. Barszcz et al. [14] introduced the protrugram to select the optimal frequency band that contained the richest fault information. Unlike the kurtogram, it calculates the kurtosis of the narrowband envelope. However, the effect of protrugram will be degraded owing to the fact that the bandwidth found by this method is fixed, which has certain limitations in the practical application. Tse and Wang [23, 24] described a novel definition, called sparsogram, to detect bearing faults. The method firstly decomposed the signal into diverse wavelet packet nodes using the binary wavelet packet transform and compute the sparsity values. Then, the sparsogram was utilised to choose the informative frequency band with more transient signatures. However, from the above literature review, most of the existing methods cannot make use of the normal data and cannot fuse multidimensional information, which leaves a promising space to further improve frequency band selection.
In this paper, a novel method for frequency band selection is proposed. Considering the shortcomings of using a single indicator and lacking a normal reference, a more objective indicator, called accuracy rate, is proposed to measure the discrepancy between normal and test frequency bands. This novel indicator can fuse multidimensional information. It also introduces the normal data into informative frequency band selection to eliminate influence from irrelevant factors. In this method, we choose a supervised learning strategy, cross-validation, as the critical step to evaluate the discrepancy between the test and normal signals and to derive the accuracy rate for each frequency band candidate. It can adaptively determine the optimal informative frequency band based on the proposed indicator. This algorithm is applied prior to squared envelope analysis as it determines parameters of the optimal frequency band, and then obtains the envelope spectrum after demodulating this frequency band. The envelope of the band-pass filtered signal and the health reference envelope spectrum are compared to find the fault characteristic frequencies. It is known that the fault frequency and the corresponding harmonics dominate among the spectral lines in the informative envelope spectrum. The proposed method in conjunction with squared envelope spectrum can be used together to detect fault transients for rotating machinery fault diagnosis.
This paper is organised as follows. Section 1 introduces the background and motivation. Section 2 introduces the theoretical basis of the proposed method. Validations with experimental signals are carried out in Section 3. Finally, Section 4 provides the conclusion of this paper.
Methodology
The proposed algorithm is introduced in this section from three crucial steps: preprocessing, feature calculation, and cross- validation. Section 2.1 presents the basic framework and the three crucial steps. Section 2.2 provides the detailed process of this method. The squared envelope spectrum algorithm is introduced in Section 2.3.
The basic framework
The new indicator of the accuracy rate proposed in this paper is based on classification in machine learning. Figure 1 shows the basic flowchart of the proposed method for a frequency band. It is worth pointing out that classification hereby is used to generate the accuracy rate that guides the selection of the frequency band; thus, the accuracy rate is a metric to quantify fault information in each band and it is not directly related to the decision making of what fault mode occurs in machinery. Details about the three steps will be provided in the following.
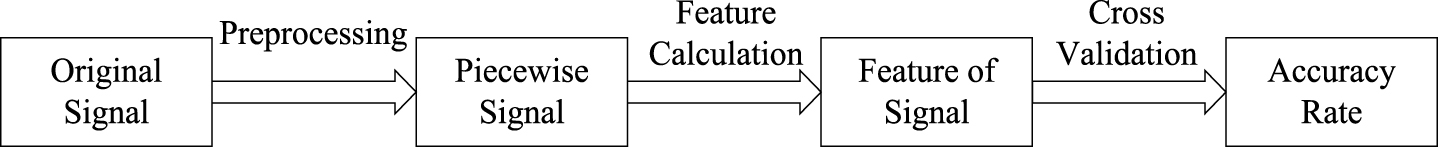
Flowchart of the proposed method.
The main purpose of the preprocessing step is that the health and test signals are divided into a number of segments with the same time interval. Figure 2 shows a division algorithm, i.e., sliding segmentation. The sliding segmentation balances the relationship between the total length of the collected data and segment number. The four parameters, including overlap, N, seg, and len, cooperate to make a flexible division. Their relationship is as follows:

Demonstration of the sliding segmentation.
Informative features can help the supervised learning become more efficient and effective [25]. In the second step, the information in each segment signal is extracted by means of calculating kurtosis and root mean square (RMS). Each signal segment can be represented by taking advantage of these two features.
Currently a number of researchers have demonstrated that the kurtosis of the vibration signal can characterise the transients that arise from the faults in rotating machines [26]. In Equation (2), it is found that the numerator is the biquadratic expression of the signal amplitude and the denominator is the quadratic expression of the signal amplitude. Therefore, the kurtosis will increase sharply if vibration impact appears.
RMS in Equation (3) is a statistical measure defined as the square root of the arithmetic mean of the squares of a set of numbers. RMS is used to measure the overall energy characteristic in the vibration signal. The high magnitude of the vibration signal will lead to a high RMS value from the global viewpoint. Therefore, the RMS is another good feature to distinguish the fault signal from the health reference.
Based on the above discussions, RMS and kurtosis can respectively reveal the information hidden in the signal from global and local perspectives.
n-fold cross-validation is a frequently adopted method to obtain a reliable estimation of the test accuracy rate. It randomly divides training samples into n disjoint and equal (or approximately equal) subsets. In n-fold cross-validation, n– 1 folds are used for training and the last fold is used for evaluation. This process repeats for n times, leaving one different fold for evaluation each time. One accuracy rate can be calculated at each time through the classification algorithm of k-nearest neighbour (kNN). kNN is based on the principle that the instances within a dataset will generally exist in close proximity to other instances that have similar properties. Finally, we average the n accuracy rates to get a mean of the accuracy rate for a specific frequency band candidate. Again, we need to highlight that this accuracy rate is not the result of fault mode classification.
The fundamentals of the proposed method
The detailed schematic diagram of the proposed algorithm is illustrated in Fig. 3. In this method, it is assumed that the test and normal data are all available. Then the normal signal that has the same length as the test signal is treated as the health reference. It is obvious that the aforementioned three steps described in Section 2.1 should be performed with both types of data in every frequency band. Then, the accuracy rate associated to each frequency band will be obtained. The essence of this method is to capture the differences between the test signal and the health reference. Finally, the informative frequency band that contained the richest fault information is confirmed through the guidance of the accuracy rate. The details of the algorithm are summarised as follows.
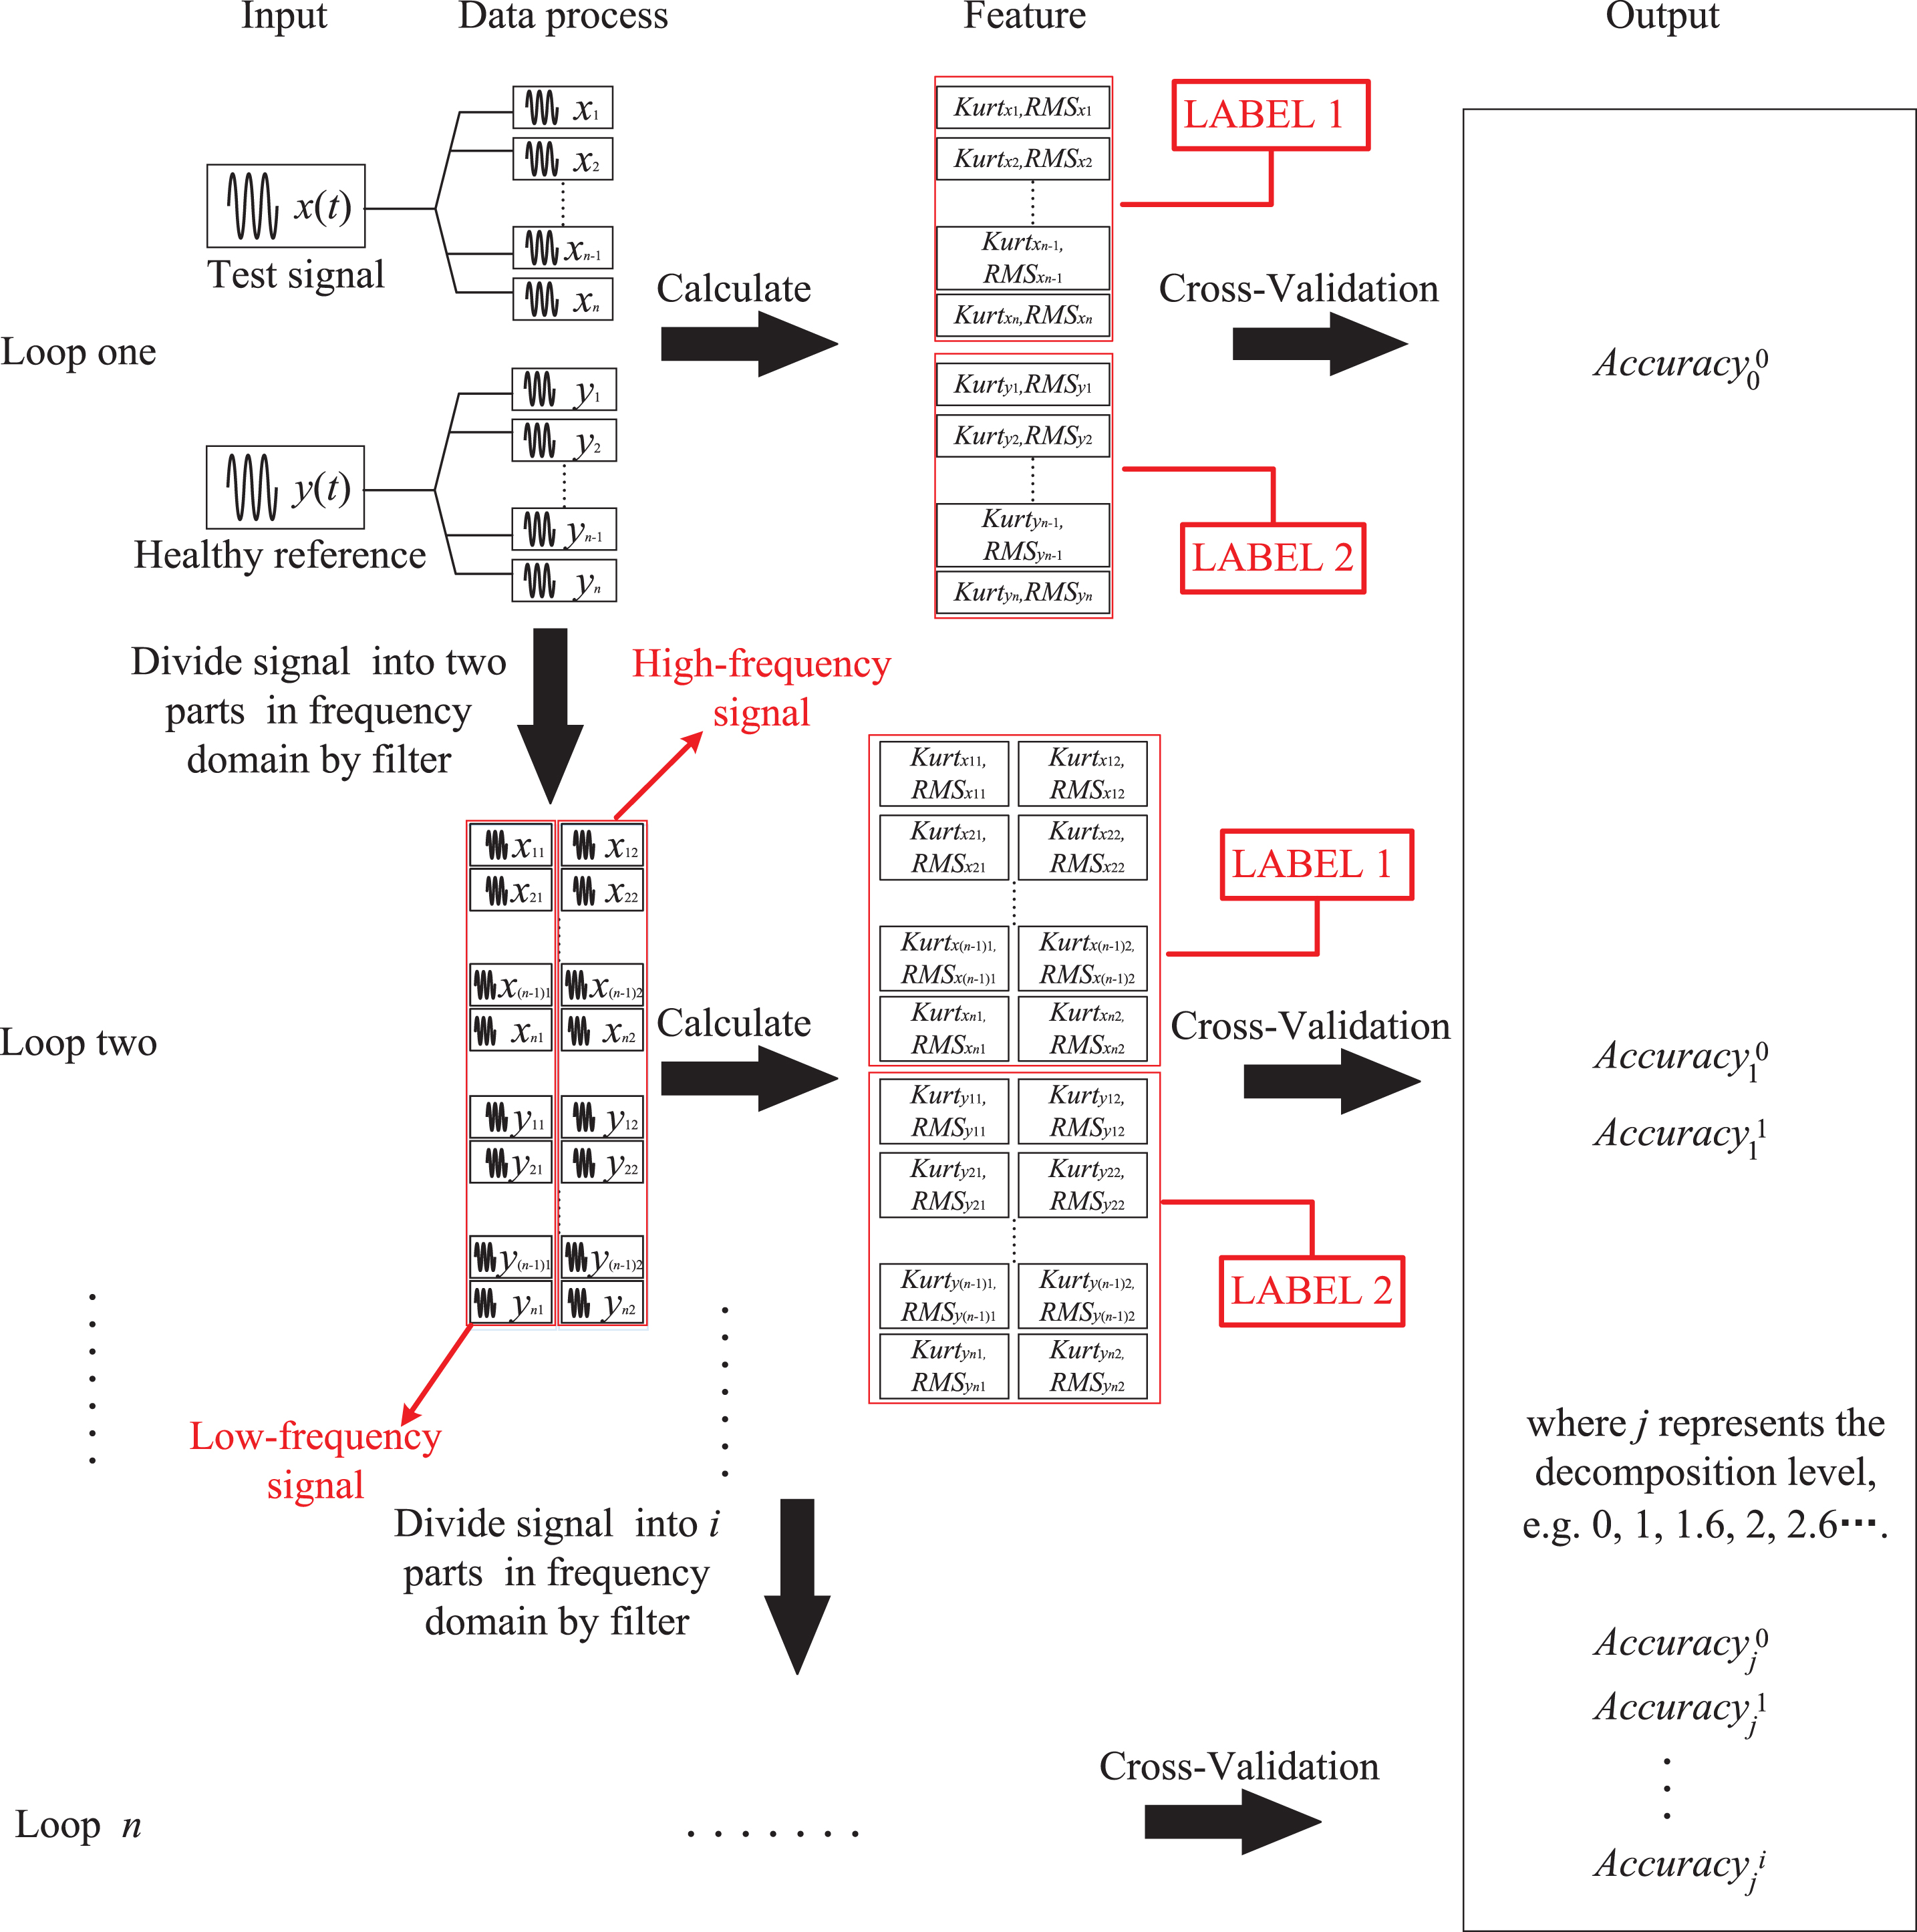
The schematic diagram of the proposed method.
In the first loop, 2 × N signal segments can be obtained after the sliding segmentation. Then, kurtosis and RMS of the 2 × N signal segments are calculated. Using these two features as ordinate and abscissa, then the 2 × N signal segments can be considered as 2 × N points within a 2-dimensional instance space. The signal segments are mapped into points in a two-dimensional coordinate plane. Then, feeding the 2 × N points into n-fold cross-validation described in Section 2.1.3, we can obtain n accuracy rates from n kNN classification models. By averaging the n classification accuracy rates, the first accuracy rate corresponding to the full frequency band,
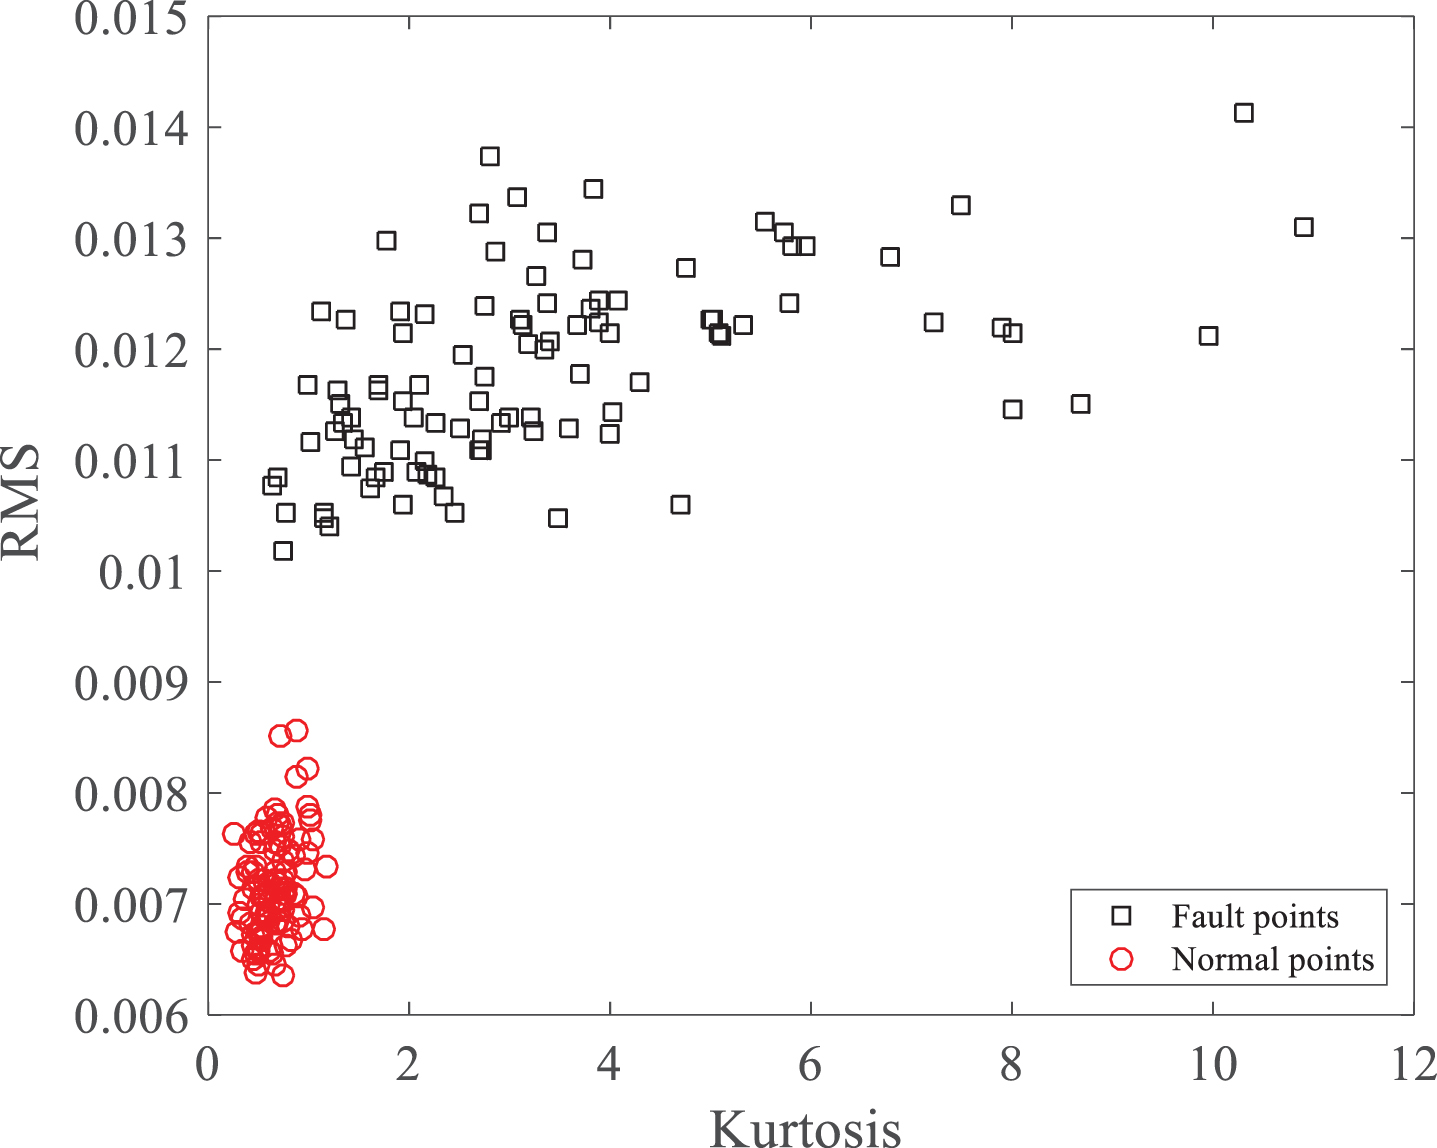
Large discrepancy between the fault and normal points.
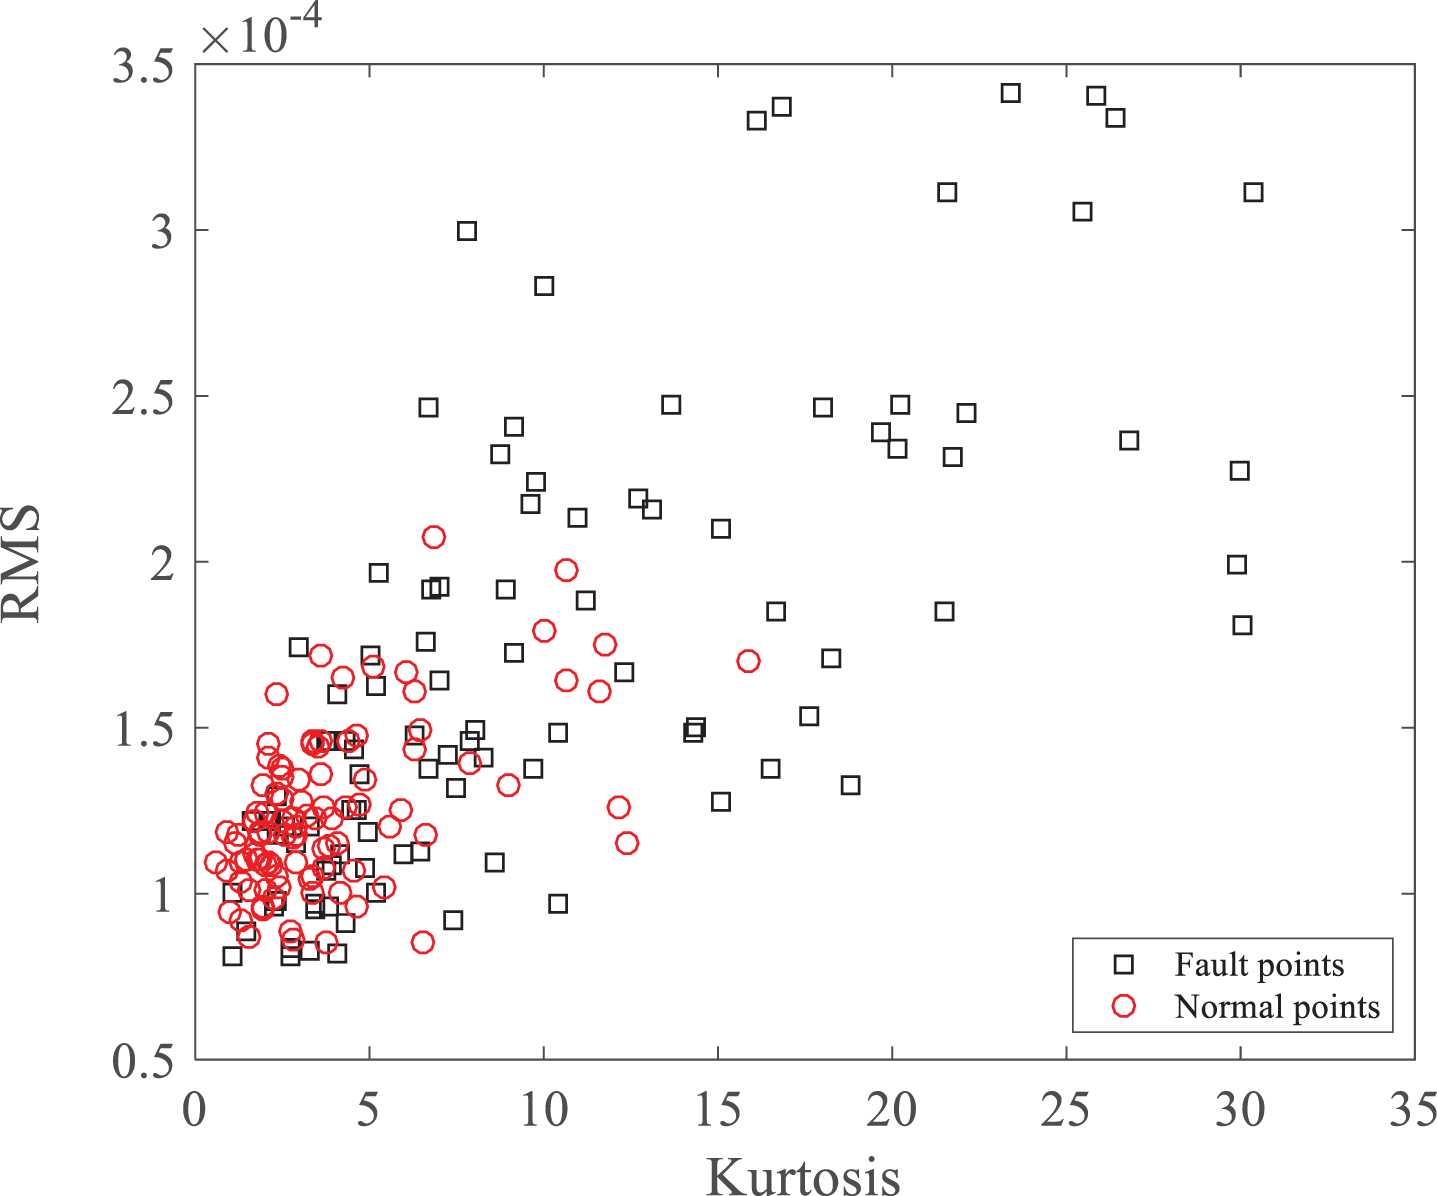
Small discrepancy between the fault and normal points.
In the second loop, we should partition the 2 × N signal segments into a low-frequency signal and high-frequency signal through digital filtering methods. Firstly, we calculate the two features (kurtosis and RMS) of the 2 × N low-frequency signal segments. After cross-validation, we can also get an accuracy rate
In the third loop, separating the original 2 × N signal segments into a low-, mid-, and high-frequency signal through digital filtering methods, we can get three accuracy rates in the same way.
By Repeating the same loop, the frequency band can be partitioned into a predefined deep level, and we simply set the maximum partition level to five in this paper to demonstrate the proposed method without further justification. Then a series of accuracy rate
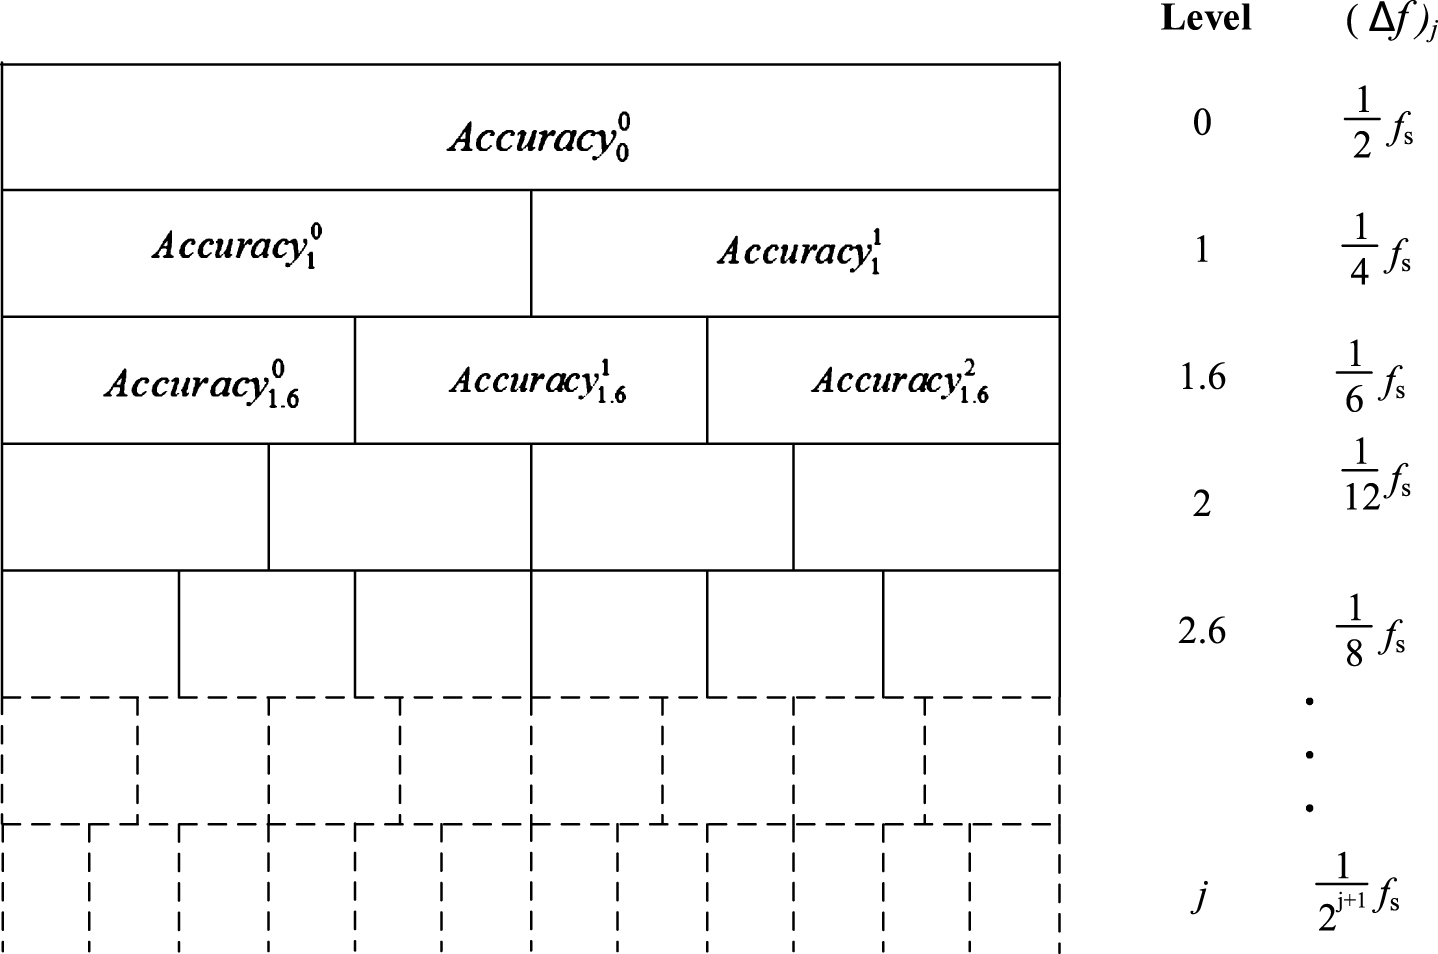
Accuracy rate matrix.
The accuracy rate matrix of the measured vibration is calculated using the proposed algorithm described above, which is displayed with the fault information of different frequency bands. The corresponding centre frequency f c and its related bandwidth Δf are recorded at the same time. The accuracy diagram can be obtained by plotting the accuracy rate matrix, and the frequency band with high accuracy rate value is seen as the part highlighting fault. Then the frequency band with the highest accuracy rate is selected as the informative frequency band. By filtering the raw fault signal with these filter parameters, the squared envelope spectrum can be obtained according to the method described in Section 2.3. Similarly, we can get the squared envelope spectrum of the health reference with the same filter parameters. By comparing the amplitude of fault characteristic frequency between the fault envelope spectrum and the normal envelope spectrum, the fault mode could be identified easily.
Envelope analysis is the frequency analysis of the envelope of the raw signal, which is used to identify the fault characteristic frequency. The fault characteristic frequencies are easier to recognize in the envelope spectrum than in the frequency spectrum, because the wide distribution energy makes the fault difficult to detect through conventional spectrum analysis [3]. Hilbert transform is a common and effective method to obtain the envelope signal. There are numerous benefits from reconstructing an analytic signal to obtain its envelope through Hilbert transform. The Hilbert transform H [x (t)] of the vibration signal x (t) is shown in Equation (6).
In addition, the analytic function z (t) of the vibration signal x (t) is defined in Equation (7).
Then, the envelope of the x (t) is obtained by
The squared envelope spectrum is a further development of envelope analysis, which is given by
This is because the squaring operation has the advantage in highlighting the fault characteristic frequency components in the spectrum and improving the signal-to-noise ratio in the certain situation [8]. In this paper, we choose the squared envelope spectrum as the final analytical tool.
In this section, three diagnostic methods are applied to the same data for comparison. The first method is direct envelope analysis with the raw signal, which is utilised as the baseline to aid in testing new diagnostic algorithms. In method 2, the kurtogram is employed to detect the impulsive frequency band, and finds the fault characteristic frequencies in conjunction with envelope analysis. In addition, method 3 is the proposed method. The effectiveness of the above-mentioned three diagnosis algorithms is compared using the following two sets of experimental vibration signal.
Planetary gearbox with sun-gear missing tooth
The first set of data comes from the experiment that was carried out using the planetary gearbox with the sun-gear tooth missing on the test rig at University of Electronic Science and Technology of China. As shown in Fig. 7, the experimental test rig consists of a spur gearbox and a one-stage planetary gearbox driven by a 2.24 KW three-phase electrical motor with a motor speed controller [27].
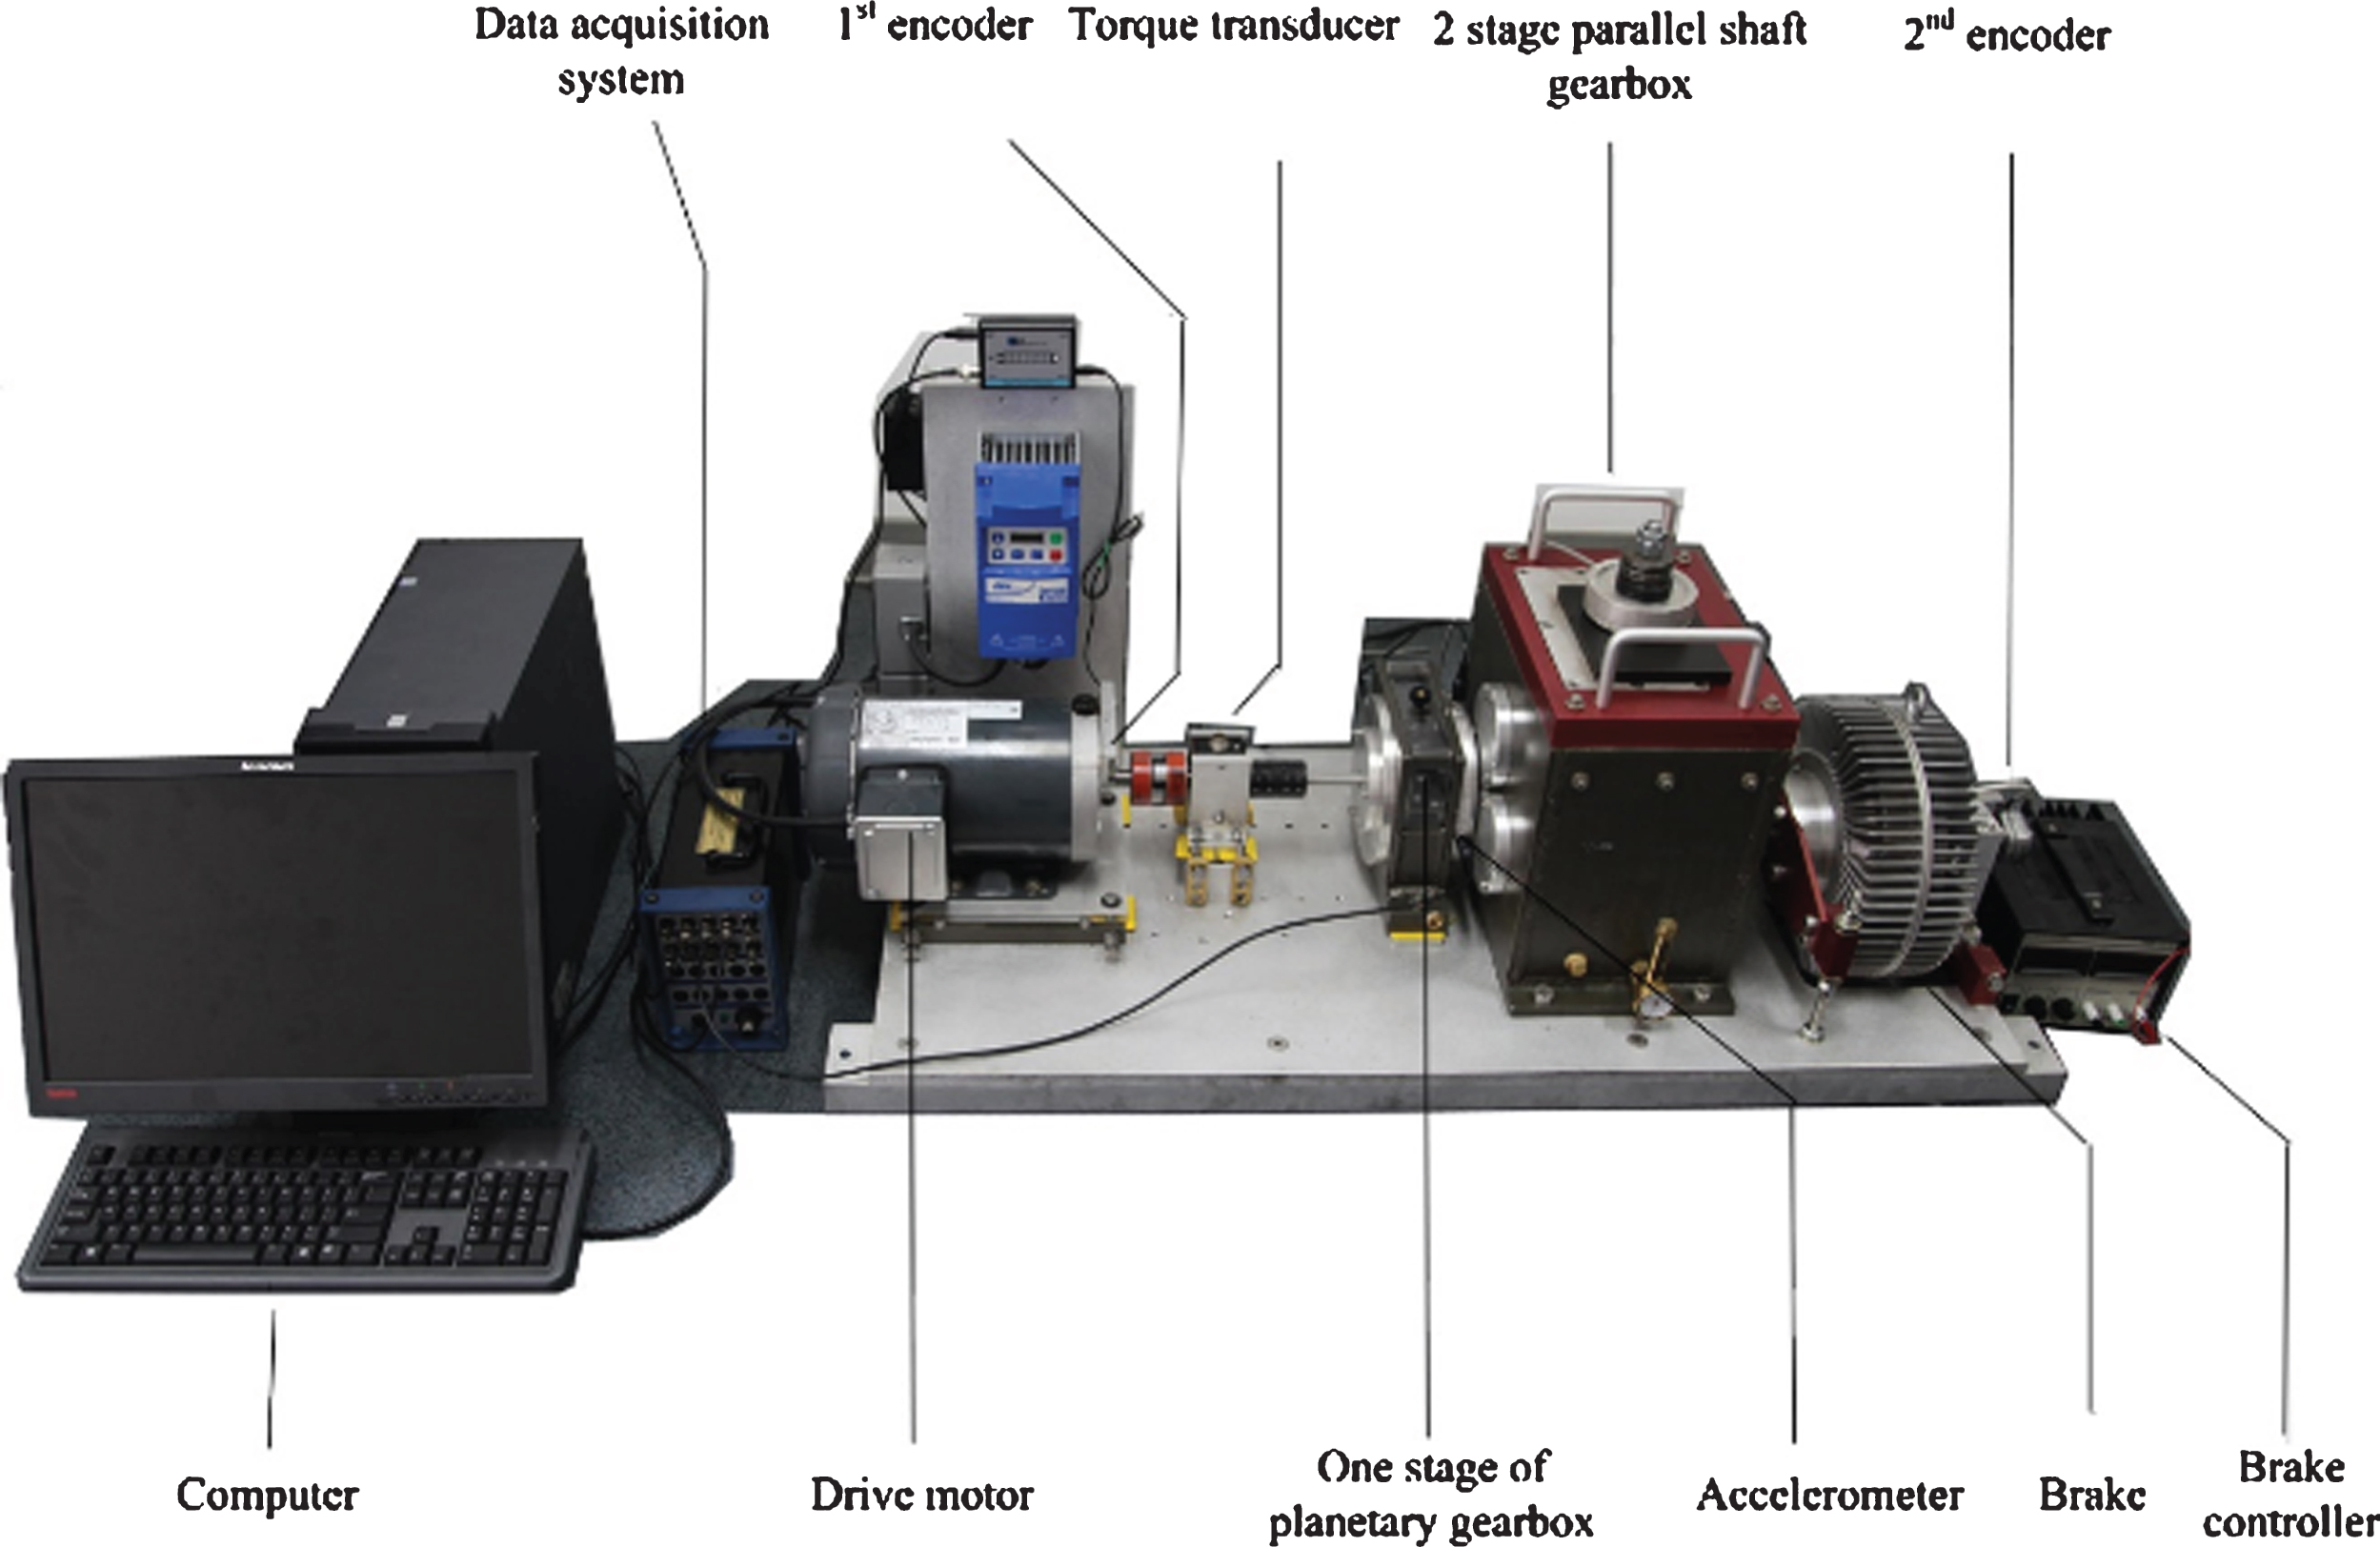
The planetary gearbox test rig.
The scheme of the one-stage planetary gearbox is shown in Fig. 8, and its physical parameters are as follows: sun-gear, 28 teeth; planet gear, 36 teeth; ring gear, 100 teeth; and number of planet gears, 4. The tested gear was missing a tooth fault in the sun-gear, shown in Fig. 9.
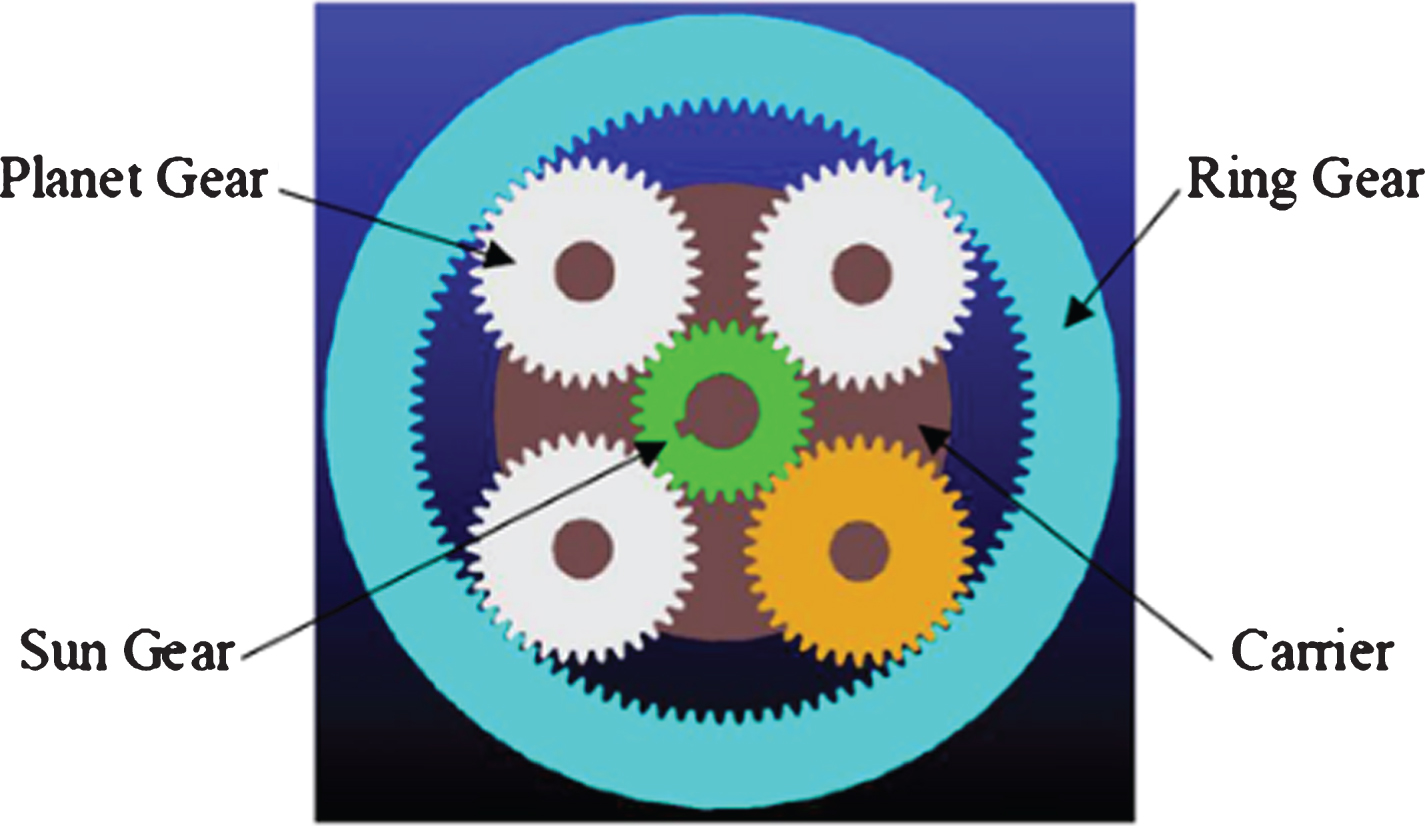
Planetary gearbox scheme.
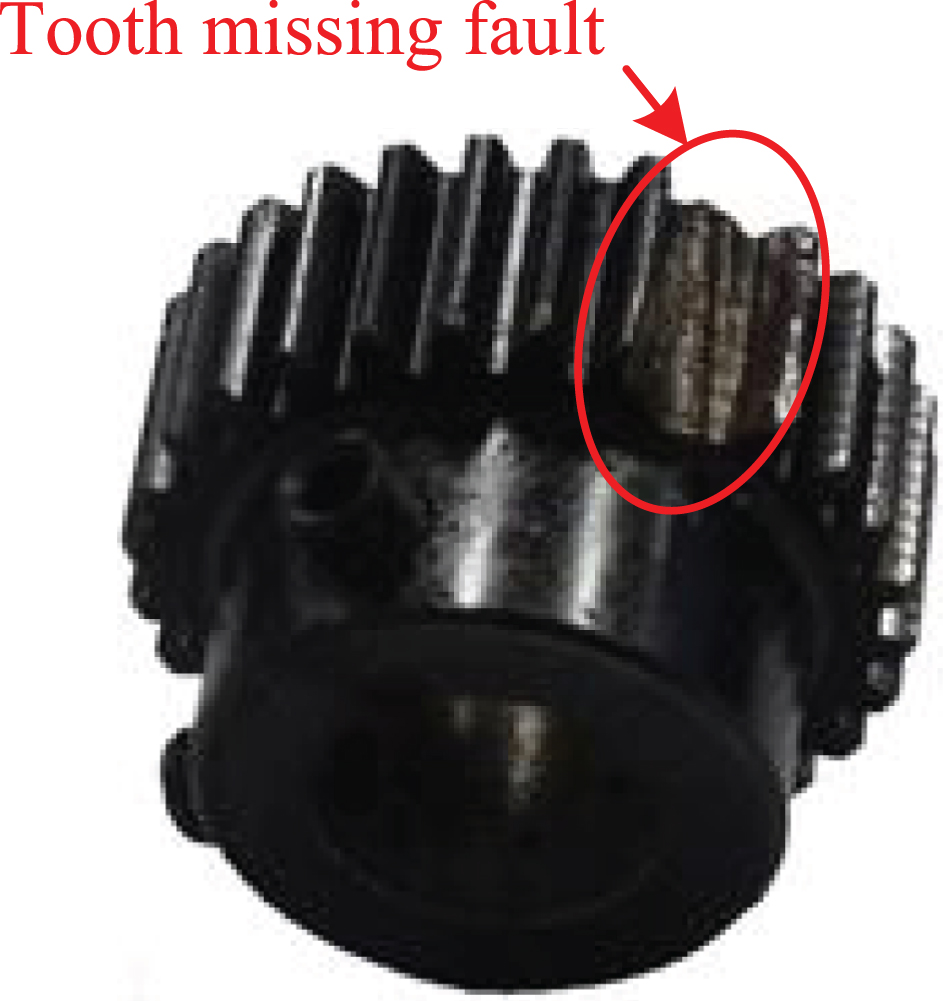
Sun-gear with missing tooth.
In the experiment, the accelerator was mounted on the top of the planetary gearbox and the vertical vibration signal was collected. The sampling frequency f s is 30720 Hz, the shaft rotating frequency f r is 50 Hz and the data sampling point number is 196608. In this example, the theoretical fault characteristic frequency of the sun-gear missing tooth is 3.125×f r = 156.25 Hz. In addition, the ring gear is stationary, and the sun-gear is the input of the planetary gearbox. We prepared two sun-gears, one healthy sun-gear, and one missing tooth sun-gear. Each sun-gear was installed separately on the test rig to obtain two sets of data (fault data and health reference) for this example. Figure 10 shows the raw time signal and corresponding envelope spectrum from Method 1. The vibration signal is shown in Fig. 10(a). Figure 10(b) provides the squared envelope spectrum of the original signal. Although this method is easy to perform, the frequency band is so wide that it brings detective blindness. From Fig. 10(c), it is found that the zoomed envelope spectrum (0–640 Hz) is dominated by the harmonics of the fault characteristic frequency of the sun-gear missing tooth. In the spectrum, there are many spectral lines with high amplitude, but unrelated to the existed fault. This result is unsatisfactory due to its wide frequency band and many irrelevant spectral lines.
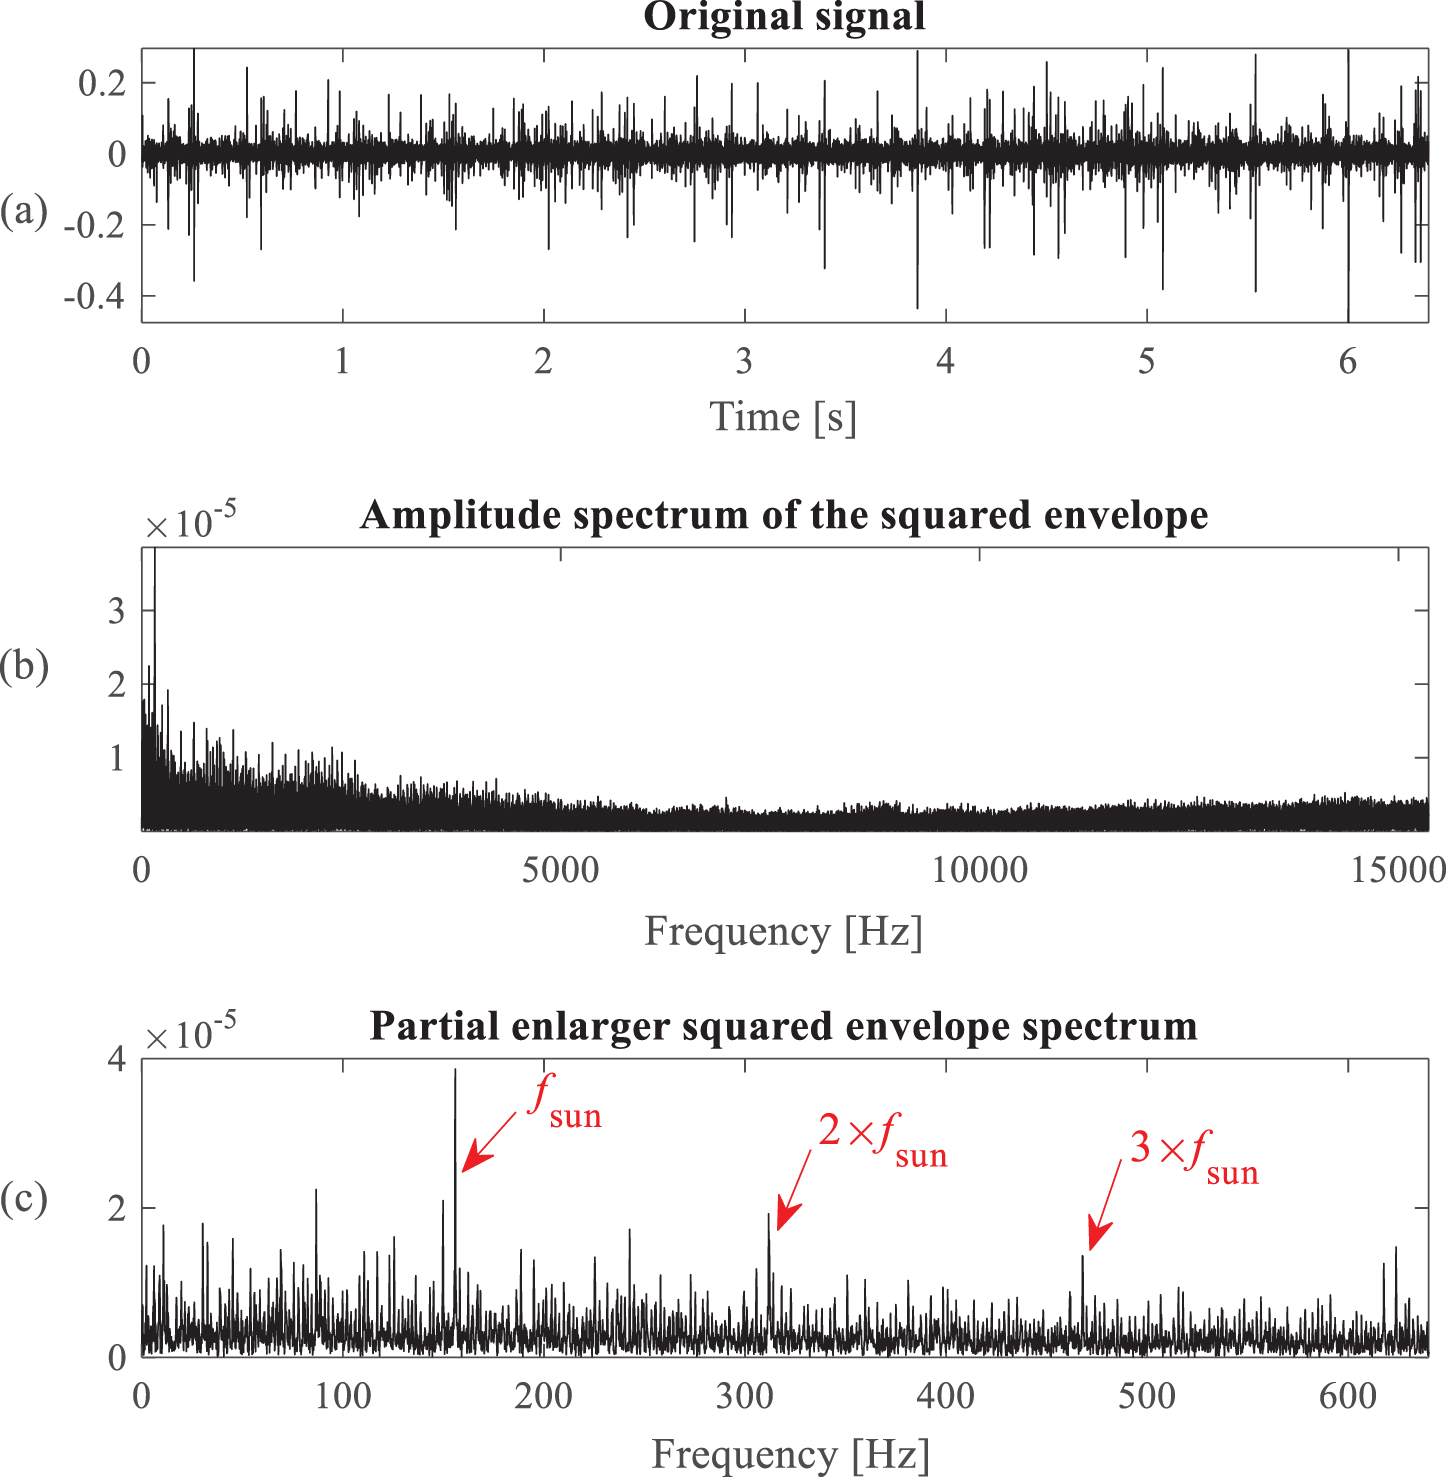
(a) Raw time signal; (b) Squared envelope spectrum from the method 1 (envelope analysis of the raw signal); (c) Zoomed spectrum from 0–640 Hz.
Then the same signal is applied to the kurtogram. The kurtogram for this example is displayed in Fig. 11. It clearly reveals the presence of sharp abnormal shocks in the signal with a maximum kurtosis of 172.5. The centre frequency f c is 8960 Hz and its associated bandwidth is 2560 Hz. The corresponding envelope magnitude is shown Fig. 12(b), and its squared envelope spectrum is shown in Fig. 12(c). There is no denying that the envelope spectrum immediately indicates the fault of missing tooth. However, the bandwidth Δf returned by the kurtogram is much wide, which may not exclude enough irrelevant frequency components out of the envelope spectrum.
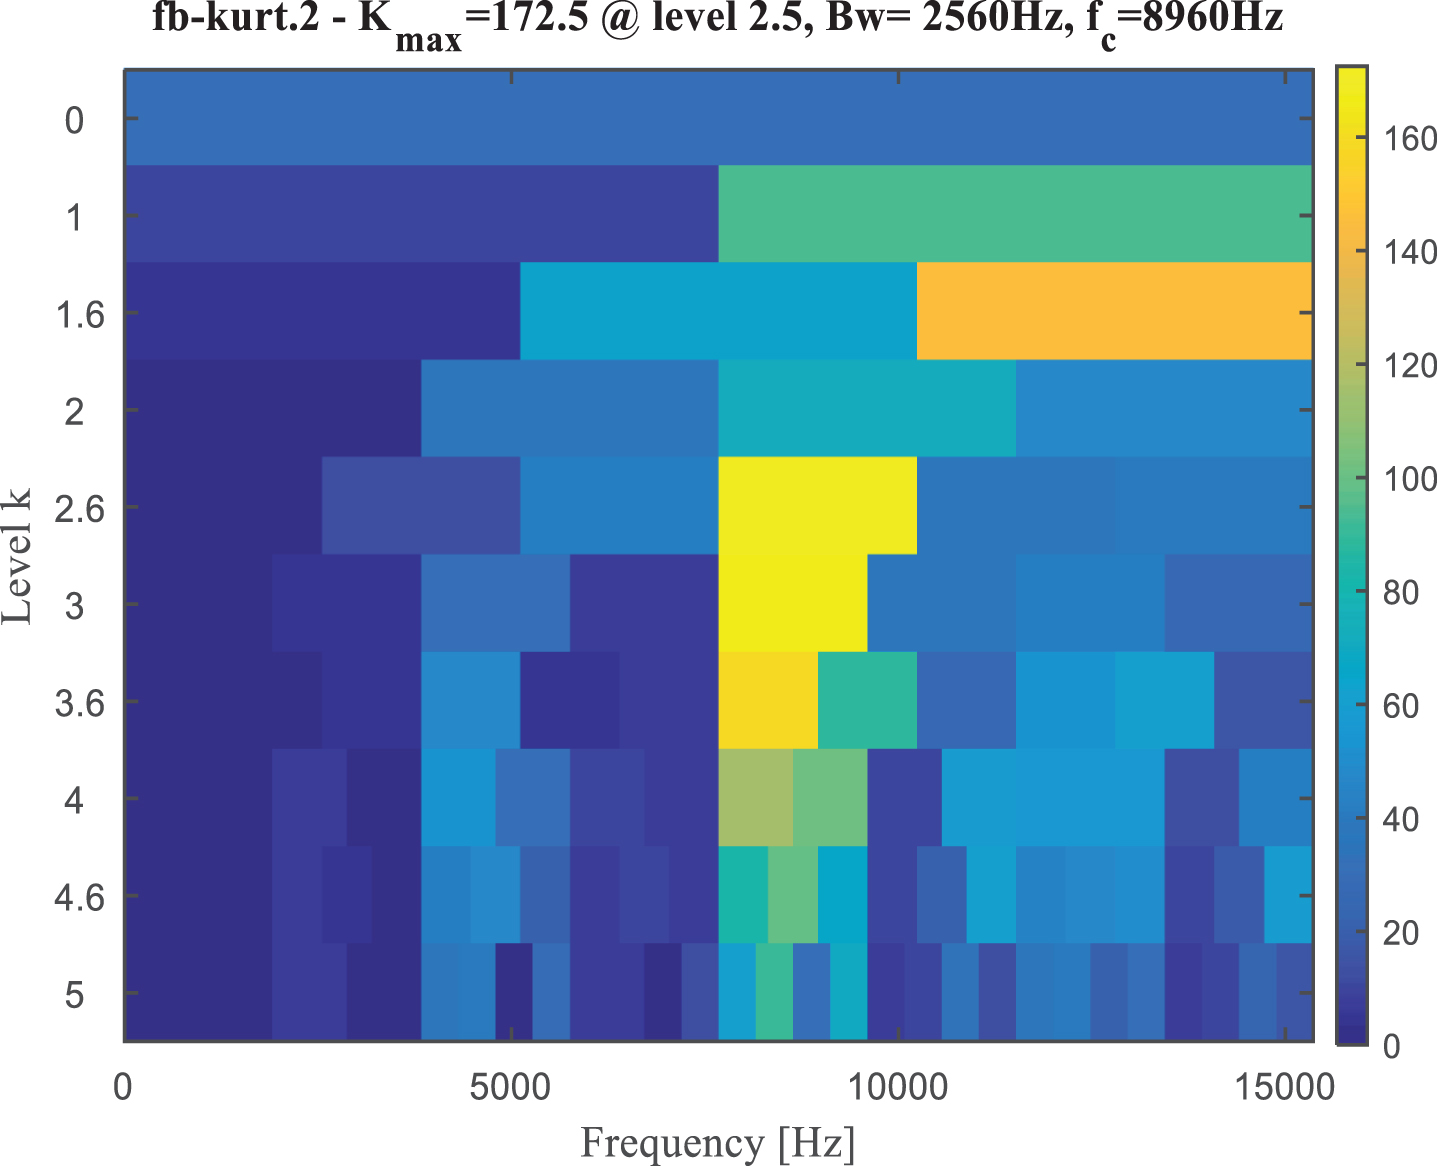
Kurtogram of the first example signal.
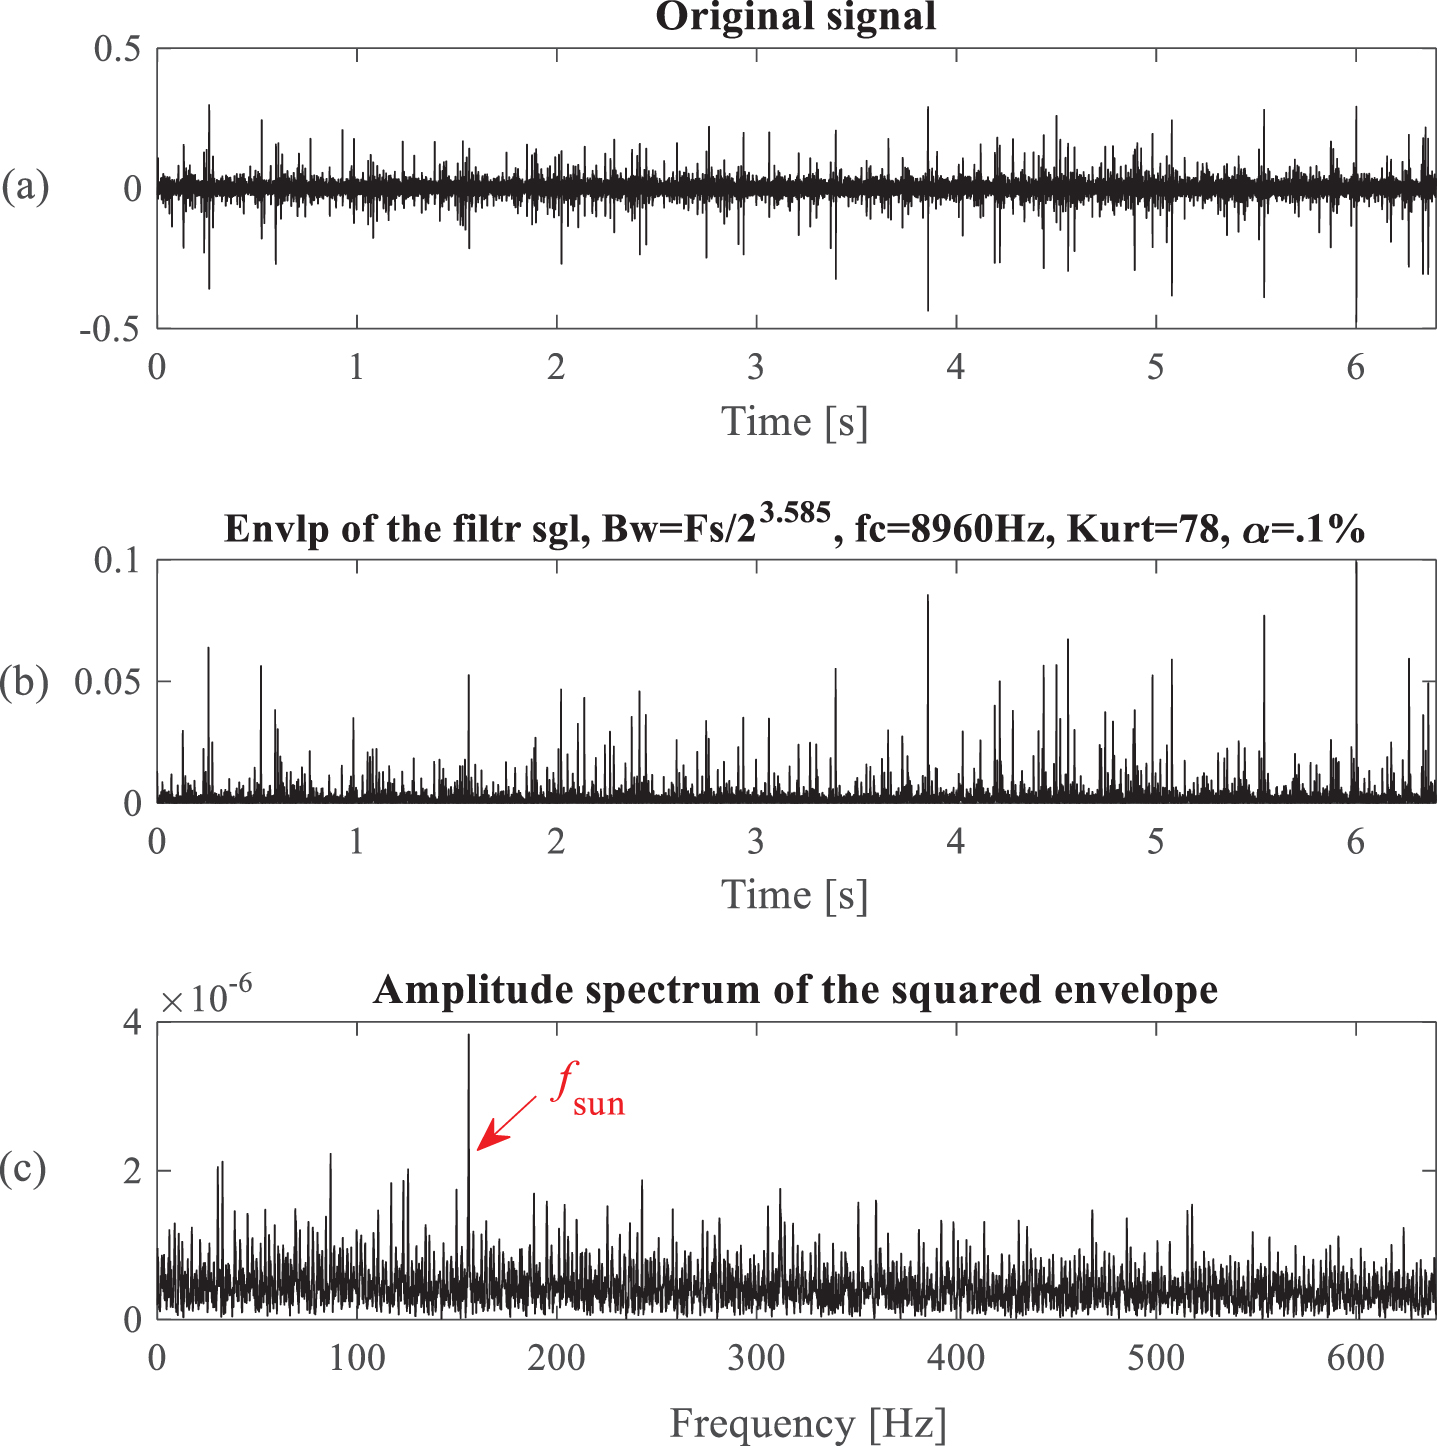
(a) Vibration signal; (b) Magnitude of the complex envelope that maximises the kurtogram; (c) Squared envelope spectrum as provided by the Fourier transform.
Finally, the proposed method is applied to the same data, and the time signal is displayed in Fig. 14(a). The accuracy diagram shown in Fig. 13 is able to detect a maximum accuracy rate at the level 4.6. The centre frequency and its associated bandwidth are 1600 Hz and 640 Hz, respectively. By filtering the fault signal and the health reference with the parameters returned by the proposed method, the targeted frequency band signals are obtained. And then their squared envelope spectrum is respectively calculated, as shown in Fig. 14(b) and (c). The dotted lines in the Fig. 14(b) illustrate the fault characteristic frequency and its second harmonic. Comparing the Fig. 14(b) and (c), the fault of missing tooth can be easily detected. More important, the fault characteristic frequency f sun and its second harmonic 2 × f sun are dominant in the squared envelope spectrum. Compared with the kurtogram, the filtering bandwidth is narrower and the narrowband envelope spectrum is clearer, so the proposed method has a better capacity of locating the fault characteristic frequencies.
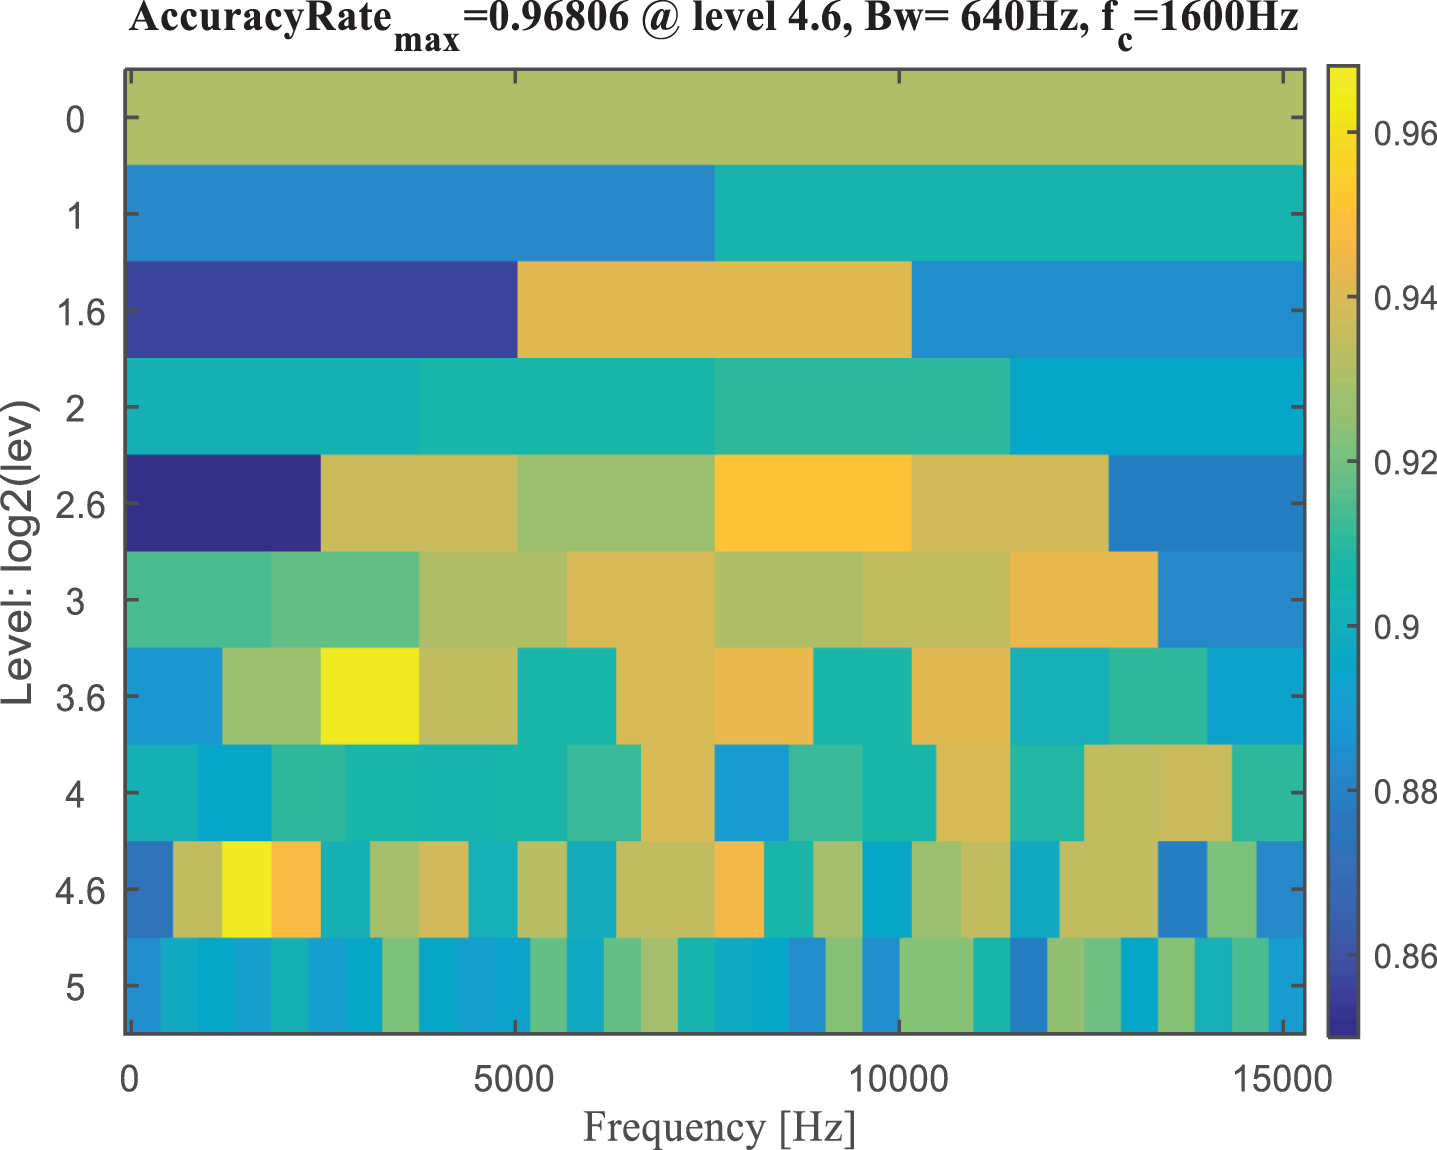
Accuracy diagram of the first example signal.
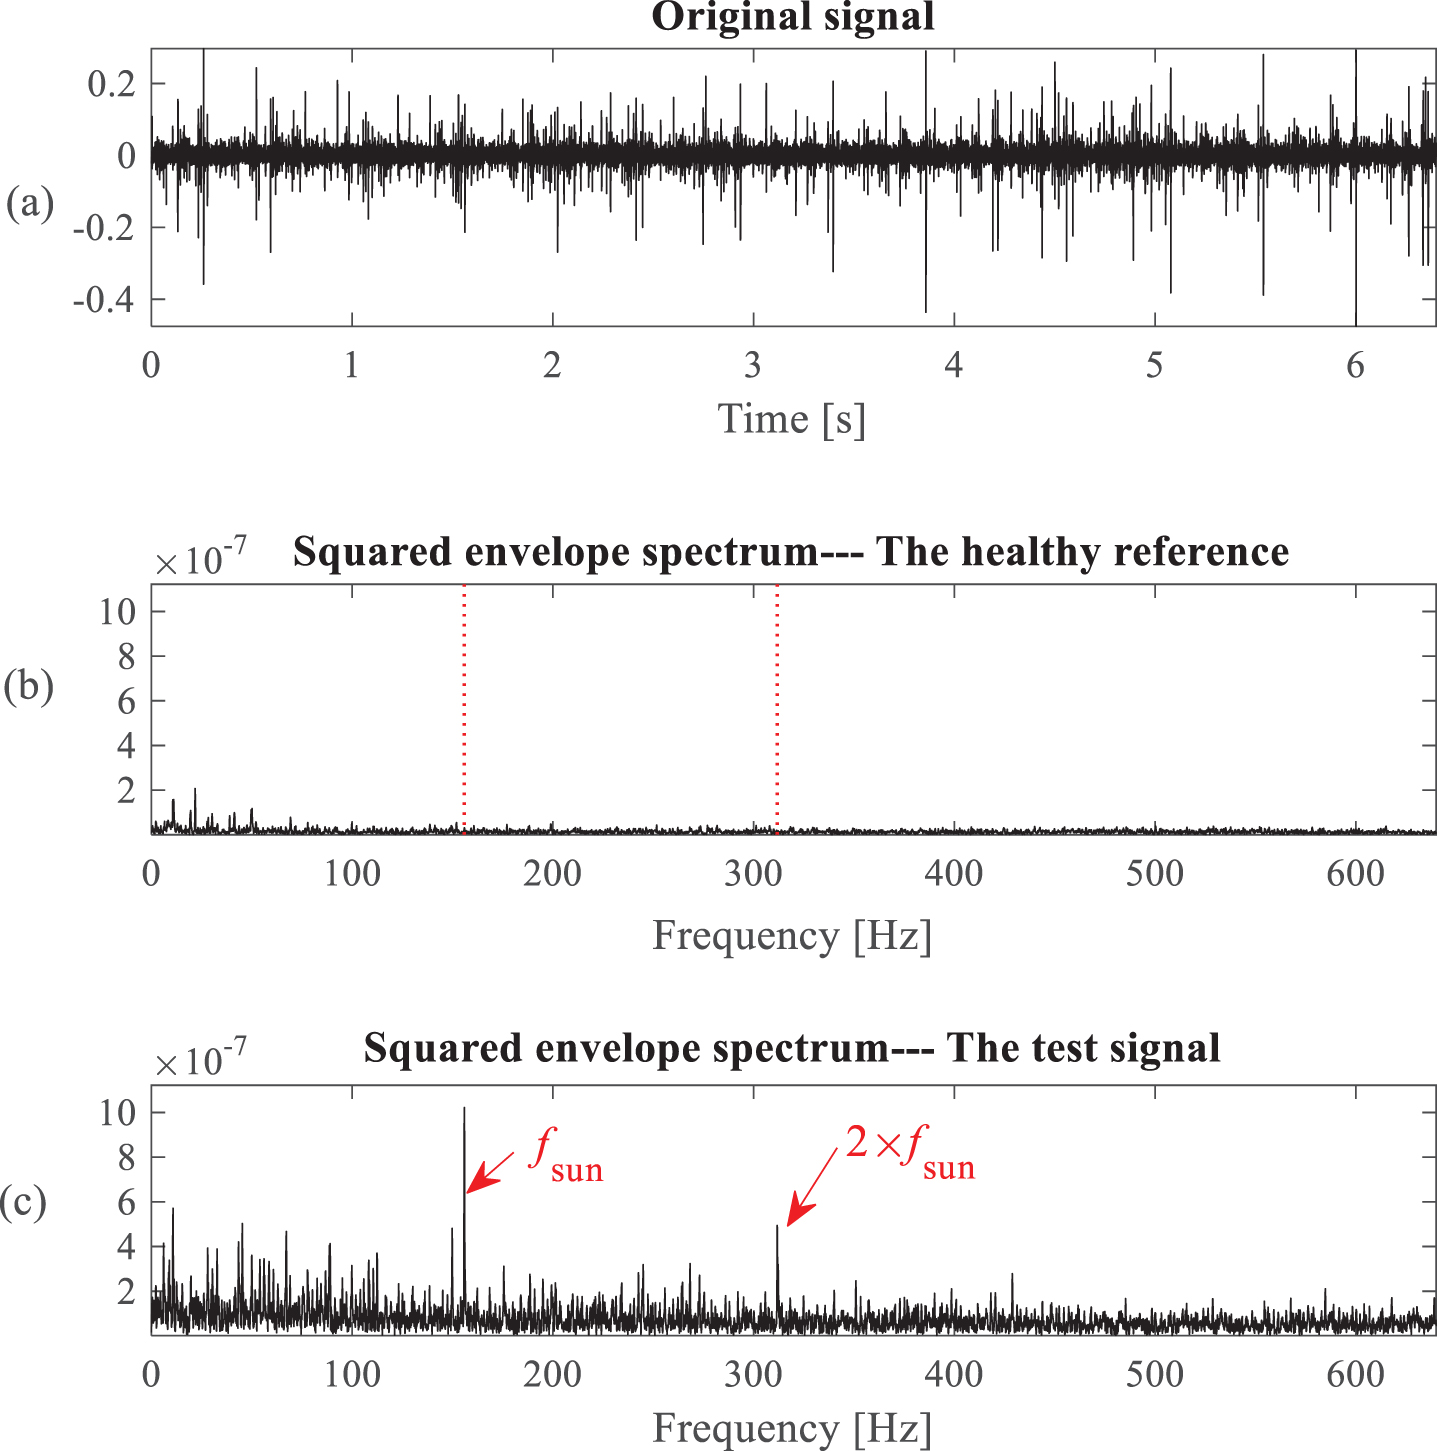
(a) Vibration signal; (b) Squared envelope spectrum of the health reference for comparison; (c) Squared envelope spectrum as provided by the Fourier transform.
In this example, although three diagnostic methods successfully provide the correct diagnosis result, the proposed method can indicate a narrower band. In addition, the fundamental characteristic frequencies in Fig. 14 have become more legible.
The second set of data comes from the Case Western Reserve University Bearing Data Center. For this section, we randomly select the data set 177 FE as the example, which is verified to be corrupted with patches of electrical noise and is difficult to diagnose in [28]. The fault (fault width in 0.36 mm) was seeded on the inner race of the drive-end bearing (SKF deep-groove ball bearing), and the other components are healthy on the test rig. It was then running at a constant speed for a motor load of three horsepower (approximate motor speeds of 1726 rpm). This studied signal is a 10.1-second sample recorded with a sampling frequency of 48 kHz. The theoretical ball pass frequency on inner race (BPFI) is equal to 5.415 × f r = 155.743 Hz. The acceleration of this set of data was also measured in the vertical direction.
Figure 15 (a) displays 10.1-second of the vibration signal to be analysed with method 1 and its corresponding envelope spectrum in Fig. 15(b). From the partial enlarged envelope spectrum (Fig. 15(c)), there are many unknown lines appearing in the spectrum. Furthermore, in addition to the fundamental BPFI, its harmonics have low amplitudes and are buried in a high level of additive noise.
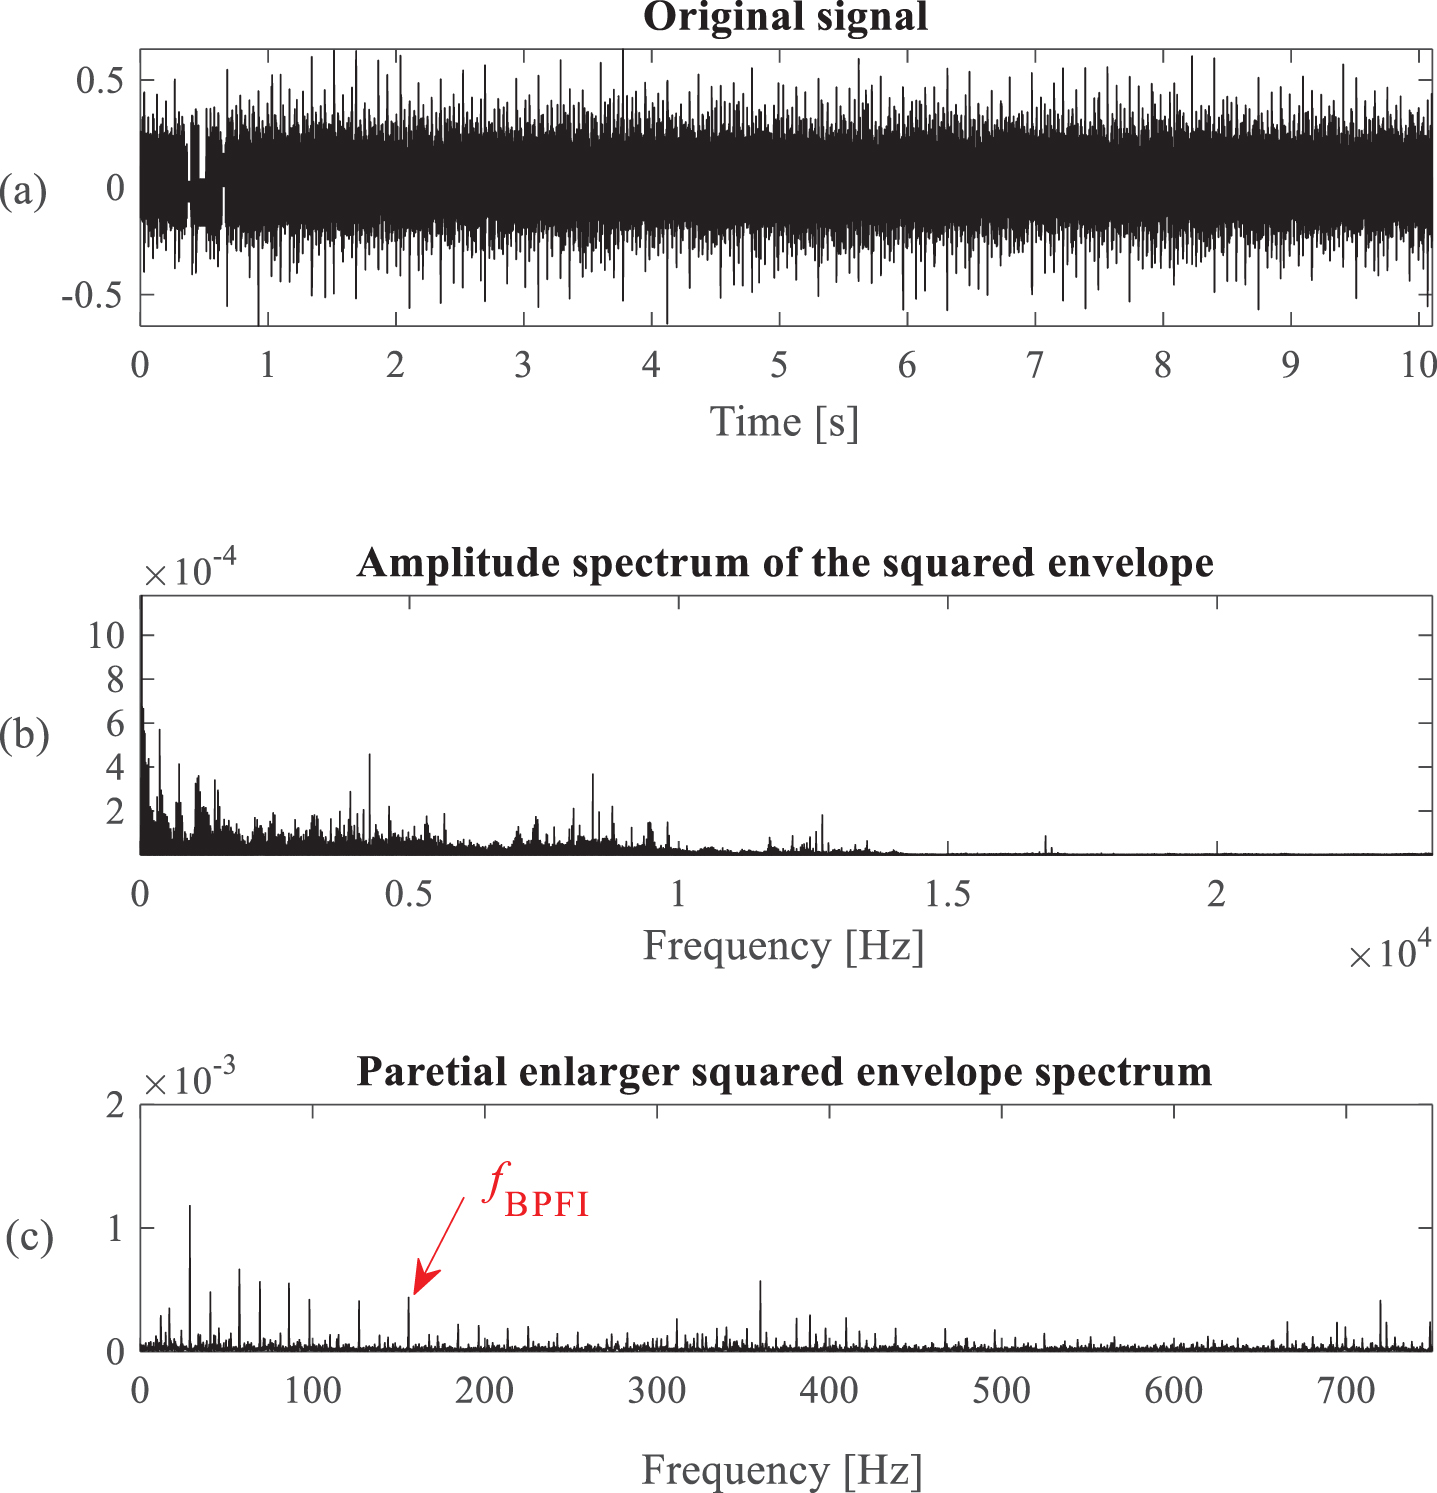
(a) Raw time signal; (b) Squared envelope spectrum from the method 1 (envelope analysis of the raw signal); (c) Zoomed spectrum from 0–750 Hz.
Then the same date is analysed with the kurtogram. We choose to analyse it with five partition levels. The corresponding kurtogram is displayed in Fig. 16, which clearly shows a maximum kurtosis of 107.9 at {f c ; Δf} = {13125 Hz ; 750 Hz}. It points out a high impulsive activity around the centre frequency f c = 13125 Hz. However, in the squared envelope spectrum of the filtering signal (see Fig. 17(c)), it can be found that the fault characteristic frequency is not dominant in the spectrum, so the kurtogram cannot prove that this is an effective frequency band. In short, the kurtogram is performed, but did not yield a significant band for signal demodulation.
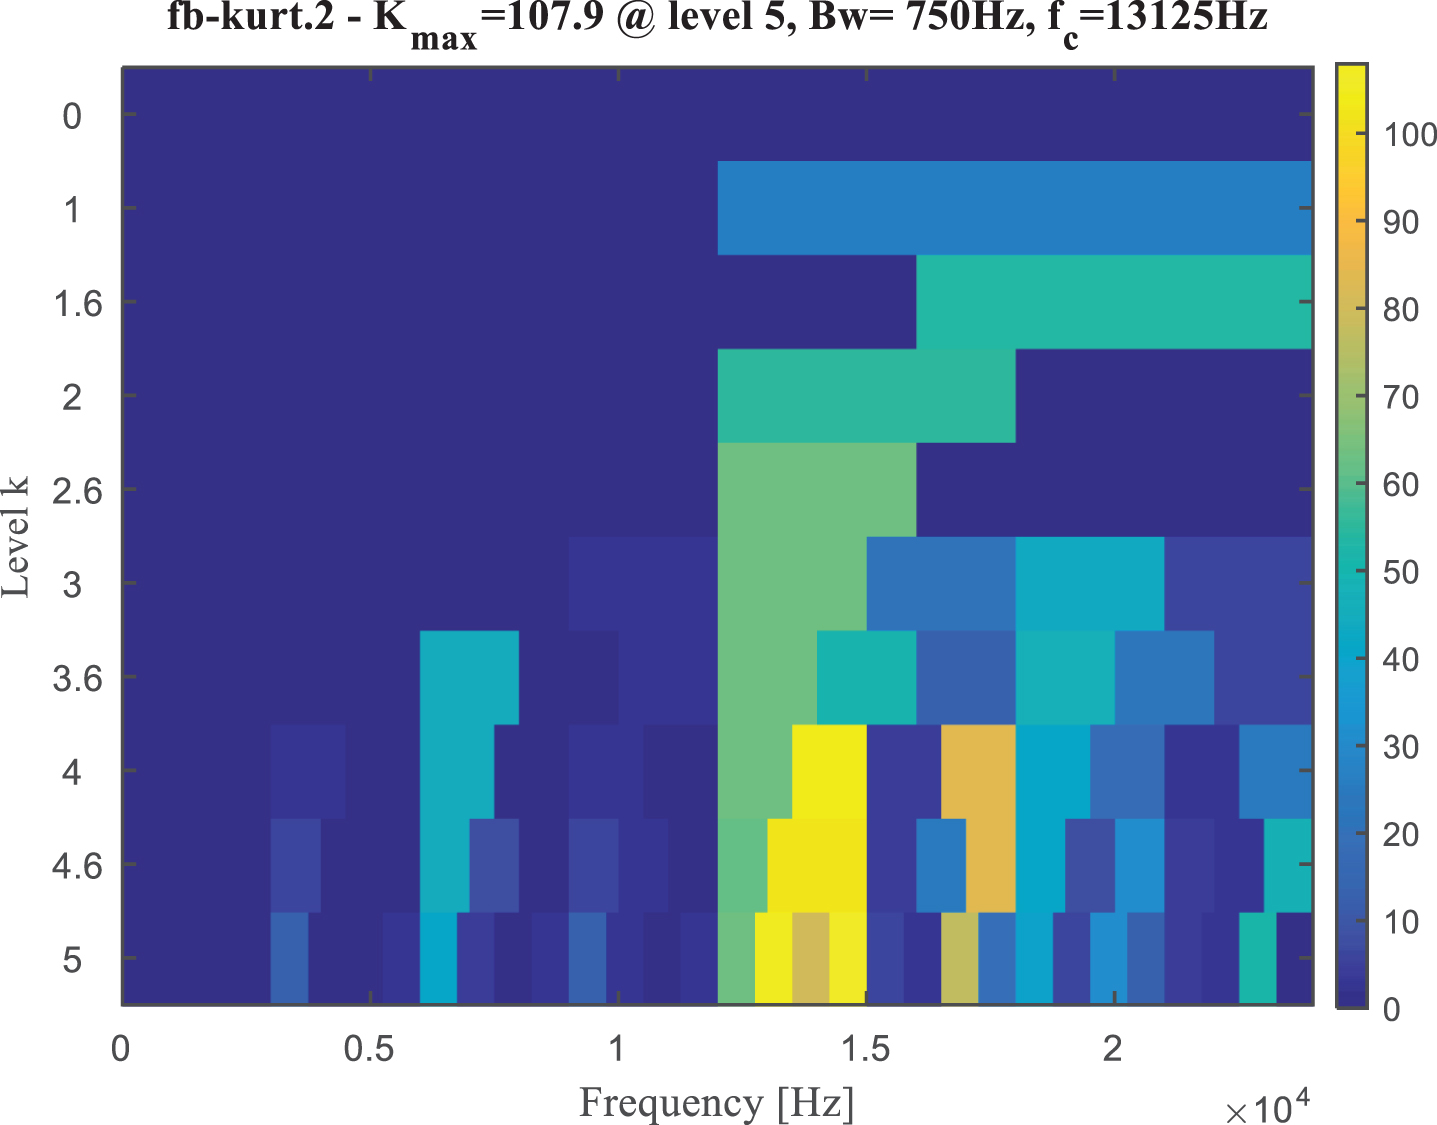
Kurtogram of the bearing signal.
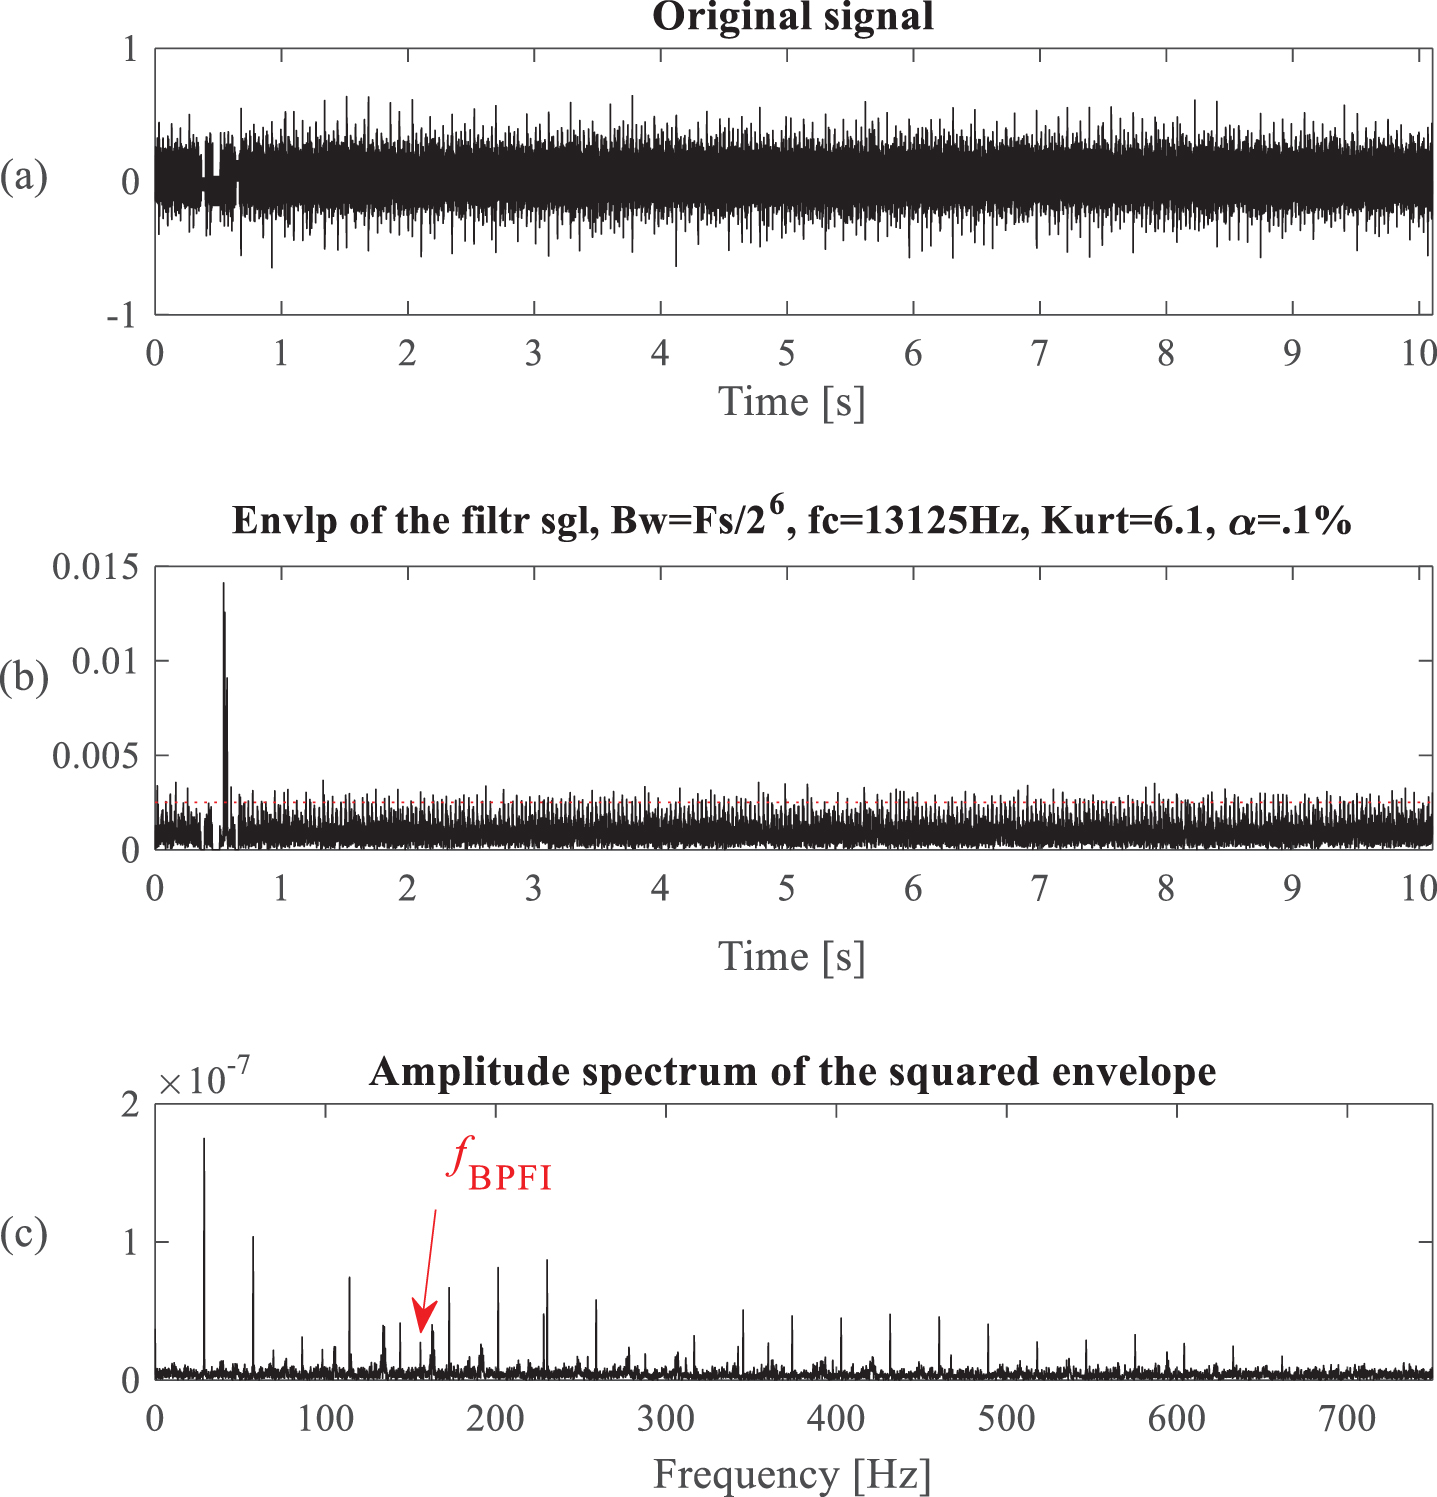
(a) Vibration signal; (b) Magnitude of the complex envelope that maximises the kurtogram; (c) Squared envelope spectrum as provided by the Fourier transform.
In this set of data, the kurtogram is not able to detect a valid frequency band (see Fig. 17(c)). Figure 18 shows the corresponding accuracy diagram that exhibits several local maxima accuracy rates. The frequency band with the highest accuracy rate value is located in {f c ; Δf} = {9500 Hz ; 1000 Hz} at the level 4.6. With filtering parameters selected by the accuracy diagram, the squared envelope spectrum of the healthy bearing signal can be calculated, as shown in Fig. 19(b), and the corresponding envelope spectrum of fault signal in Fig. 19(c). Through the comparison of envelope spectrum, it indicates the inner race fault characteristic frequency f BPFI and its second harmonic 2 × f BPFI . Apart from that, the fault characteristic frequencies are dominant in the squared envelope spectrum.
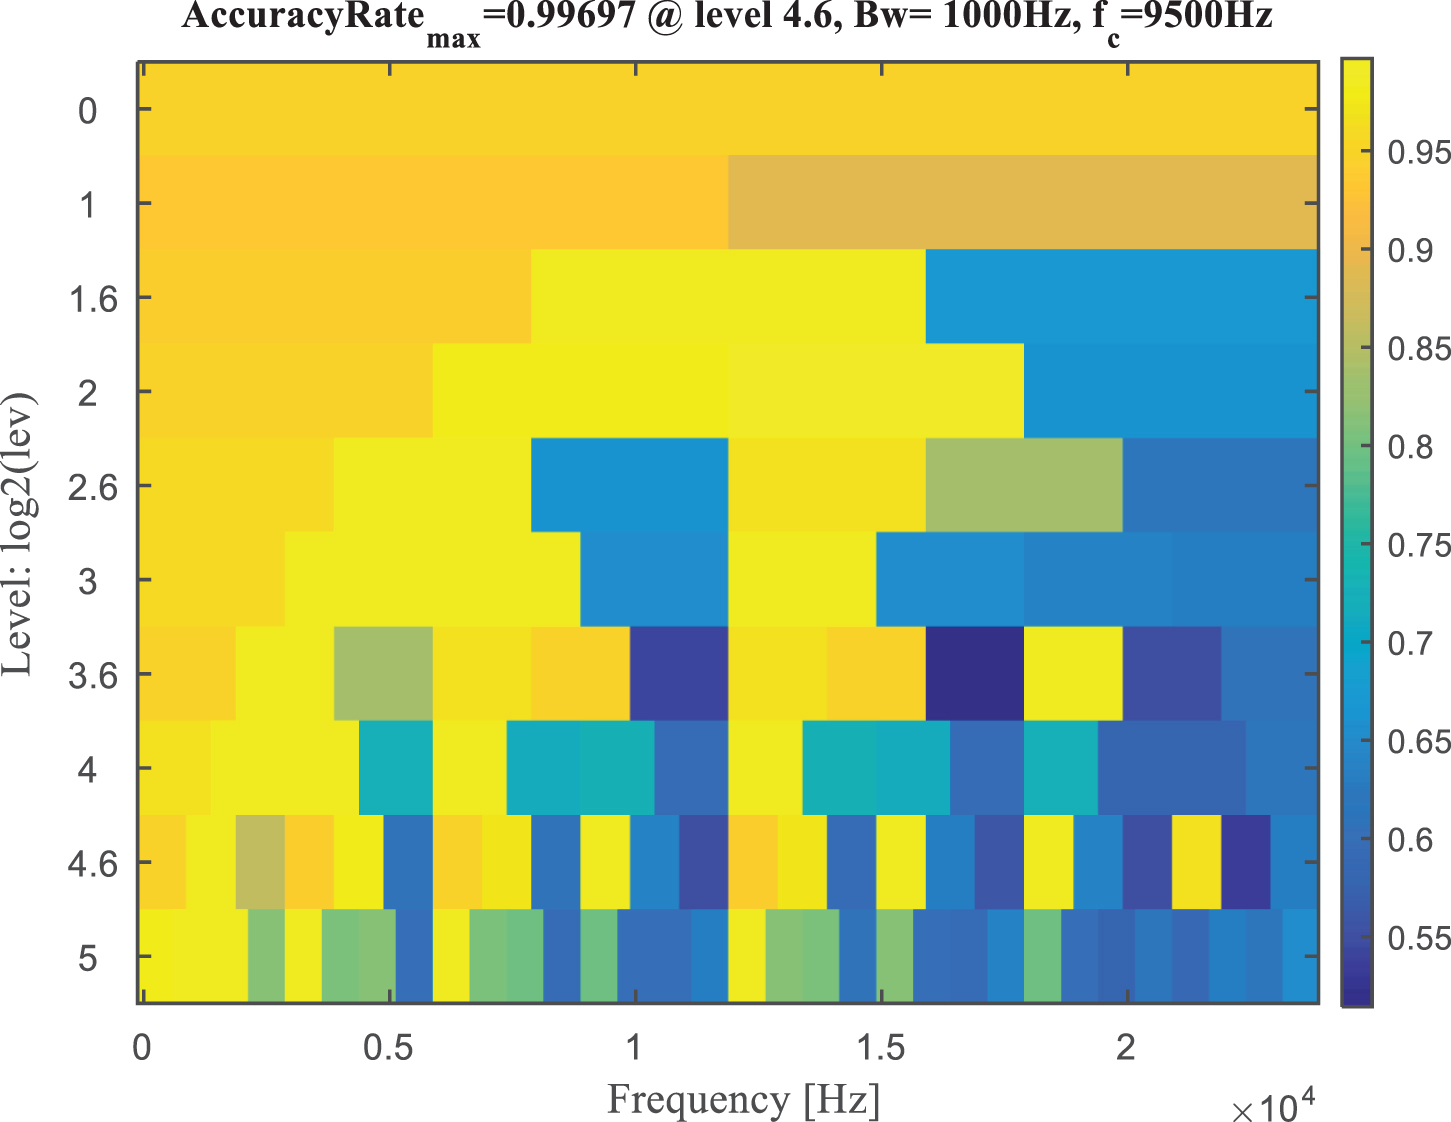
Accuracy diagram of the bearing signal.

(a) Vibration signal; (b) Squared envelope spectrum of the health reference for comparison; (c) Squared envelope spectrum for the test signal.
In this example, method 1, direct envelope analysis, shows a relatively inferior envelope spectrum. In addition, the kurtogram also cannot detect the satisfied frequency band as the dominant envelope spectral lines were relatively far from the faulty bearing, so that the fault frequency components are weaker and the spectrum contained more interference frequencies. The proposed method, on the other hand, is still able find the fault characteristic frequency and second harmonic, and the fault characteristic frequency also dominates in the spectrum. This case demonstrates that the demodulation of the accuracy rate-indicated frequency band shows a promise to overcome limitations encountered in the raw signal envelope analysis and the kurtogram.
In this paper, a new method for frequency band selection is proposed to find the potential filtering band that contained the richest fault information. The essence of the method is to locate the frequency band that has the biggest difference between the test signal and health reference. This work improves the informative frequency band selection within two aspects. On the one hand, the health data, as the important criterion, is added into informative frequency band selection. On the other hand, an objective accuracy rate indicator is proposed to guide the targeted frequency band, which could fuse multidimensional information, e.g., RMS that reveals information from a global viewpoint and kurtosis that reveals information from a local viewpoint. The algorithm involves the cross-validation step prior to envelope analysis of the band-pass filtered signal. The main purpose of cross-validation is to obtain an accuracy rate that is positively proportional to the degree of discrepancy between the test signal and health reference. This step is based on kNN model. Subsequently, a new tool for presentation of these accuracy rates, called the accuracy diagram, is proposed. The frequency band with the highest accuracy rate value can be found immediately through the accuracy diagram. The proposed method has been applied to diagnose the sun-gear fault and the bearing fault. The results, especially the second example, have shown that the proposed indicator is very effective in locating the fault frequency band. It has been verified that the frequency band selected from the proposed method actually enables a good extraction of the fault information.
Footnotes
Acknowledgments
Special thanks should be expressed to the editor and anonymous referees for their constructive suggestions. This work was supported by The National Key Research and Development Program of China (2016YFB1200401), National Natural Science Foundation of China (51505066), State Key Laboratory of Traction Power, Southwest Jiaotong University (TPL1608), and the Fundamental Research Funds for the Central Universities (ZYGX2015J081).