
Abstract
Condition monitoring is an effective methodology to evaluate the health state of power electronics converters. Aiming at multiple devices health state estimation for boost converters, a non-invasive condition monitoring technique is proposed in this paper. Taking the equivalent circuit model of these components into consideration, the formulations of failure precursors with detection signals are derived based on hybrid system theory. Then, the parameter identification problem is translated into an objective function optimization issue. Therefore, the precursor parameter values of inductor, capacitor, diode and power MOSFET can be obtained using crow search algorithm. Meanwhile, the boost converters under variable operating conditions are also analyzed. Compared with particle swarm optimization (PSO) method, both simulations and experiments are conducted to validate the effectiveness of the presented approach. The results show that these parameters can be estimated simultaneously and the identification accuracy of them reaches to more than 90%.
Keywords
Introduction
DC-DC converters are essential and critical parts in the power conversion systems which are common used in the fields of photovoltaic power generation, electrical aircrafts, electric vehicle and energy storage systems [2, 21]. With the increasing of switching frequency and power-level of these converters, they are toward more complex and prone to suffer performance degradation and ageing, even critical failures when they are exposed to harsh operating and environmental conditions, i.e., high temperature, over current, over voltage, mechanical vibration, electromagnetic stress and radiation. In order to enhance the reliability and evaluate the health state of the power electronics converters (PECs), condition monitoring is an effective methodology to achieve these purposes. On the other hand, it can reduce the downtime and maintenance cost [12].
According to a questionnaire survey of reliability for power electronics based on over 200 products from 80 companies, the power semiconductor devices and capacitors are the two major components which are responsible for more than 50% of the breakdowns in PECs [18]. In recent years, much great efforts have been devoted to the fault diagnosis and condition monitoring of power switches and capacitors. Compared to sound electrolytic capacitors, aged ones could offer a higher impedance path for the AC current because the evaporation of electrolyte solution, as a result, the equivalent series resistance (R C ) will get an increase. What’s more, it will lead to the output voltage ripple rise in DC-DC converters which accelerates the degradation process and changes the capacitor characteristics. Eventually, the converters will fail to regulate the output voltage. Meanwhile, the capacitance value also decreases as a result of the changes in the dielectric properties of the oxide layer and reduction in amount of the capacitor electrolyte. Hence, the majority of the condition monitoring for capacitors are based on the estimation of capacitance and R C which are typical indicators of the degradation of capacitors [7, 11]. Ma et al. [8] established the hybrid model of a Buck circuit and presented a parameter identification-based method to obtain the R C and capacitance. However, this method needs a higher data sampling frequency more than the power switch operating frequency. An on-line fault detection strategy of electrolytic capacitors was proposed in terms of the relationship between input current and output voltage ripple [4]. Yao et al. [13] deduced the R C and capacitance computational formulas from analyzing the capacitor voltage ripple and designed a measurement system based on DSP without additional current sensor. This method has an advantage that only two values of capacitor voltage at particular moment within a switching cycle need to be sampled and can monitor the R C and capacitance variation at different working conditions. A new type of Rogowski coil sensor (RCS) is used for capacitor R C monitoring in non-isolated single-switch DC-DC converters [6]. An accelerated test system under power cycling was developed to trigger the failure mechanism in regards to die-attach damage, due to mismatch on the coefficient of thermal expansion of the different elements in the component’s packaged structure. It is concluded that the variation of the drain-to-source on-resistance is identified as the failure precursor of power MOSFET, which is dependent on junction temperature [9, 17]. A software frequency response analysis method was developed in [17] to monitor the health condition of power MOSFETs through the on-state resistance variation. The measurement method based on spread spectrum time domain reflectometry (SSTDR) was applied to identify the aging level of power MOSFETs inside a live converter circuit, which may bring in large cost to monitor more power switch devices [14].
These above methods only can monitor one type device such as capacitor or power MOSFET, the approaches of condition monitoring of multiple devices in a converter have got increasing concerns. Sun et al. [15] presented a parameter identification method based on particle swarm optimization algorithm to achieve multi-component (including inductor, capacitor and power MOSFET) soft fault diagnosis. The inductance and capacitance estimation of DC-DC converters are paid more attention in [10, 20]. A multiple parametric fault detection and identification method for power converters based on hybrid bond graph and genetic algorithm was developed in [19] that both active and passive components are taken into account. Li et al. [5] proposed an on-line parameter estimation approach by injecting pseudorandom binary sequence (PRBS) perturbation signals to the DC-DC converters, which can monitor the capacitance, capacitor RC, inductance and so on based on biogeography-based optimization.
Actually, the previous approaches still have drawbacks and limitations, because they need a current sensor to collect inductor current which may interrupting the converter’s normal operation in an invasive manner. Additionally, it is inapplicable for off the shelf power converter systems. Thus, in this paper, aiming at multiple devices health state estimation for boost converters, a non-invasive condition monitoring technique is proposed. The parameter identification problem is translated into an objective function optimization issue that the parameter values of inductor, capacitor, diode and power MOSFET can be obtained using crow search algorithm (CSA). Several simulations and experiments are conducted to validate the proposed condition monitoring technique which will be the basis of further study of the circuit-level prognosis and remaining useful life prediction.
This paper is structured as follows: Section 2 illustrates the components failure modes and equivalent circuit model. In Section 3, the condition monitoring for boost converter is developed. Both simulations and experiments are discussed in Section 4. The conclusion of this paper is presented in Section 5.
Components failure analysis and equivalent circuit model
In practical industrial applications, environmental stress and operating stress such as high temperature, mechanical vibration, over voltage or switching impulse during regular operations may cause components aging which could affect power converters characteristics like output voltage ripple, switching loss, conduction loss, etc. Therefore, analysis of these electronic components failure is an essential part for the PECs condition monitoring.
Electrolytic capacitor
Electrolytic capacitors have become one of the most critical components in power converters and have been widely used for filtering, coupling, bypass and many other applications. Unfortunately, they are also responsible for a large amount of breakdowns in power electronics systems [19]. It is known that the common failure modes are open circuit, short circuit, capacitance (C) decreases and equivalent series resistance (R C ) increases [3, 4]. The former two types are hard faults while the other two are soft faults.
During the operation time, when electrolytic capacitors are submitted to current spikes and voltage surges, fault modes like dielectric breakdown and leads crack are very likely to occur, which eventually leads to OCF and SCF. The main aging mechanism of degradation failure is electrolyte vaporization which influenced by temperature, ripple current, over-voltage, etc. Meanwhile, the reduction of the electrolyte enables the electrolyte resistivity to increase and the contact area between the electrolyte and dielectric to reduce. This causes a decrease in capacitance and an increase of the R C . Thus, R C and C are often used as fault characteristic parameters (FCP) for the electrolytic capacitor. It’s suggested that the lifetime of an electrolytic capacitor has ended when its R C value increases by 280–300% of its initial value or the capacitance C decreases by 20% below its pristine condition value at room temperature. The simplified equivalent circuit of an electrolytic capacitor consists of an ideal resistance in series with an ideal capacitor.
Equivalent circuit model of an inductor.
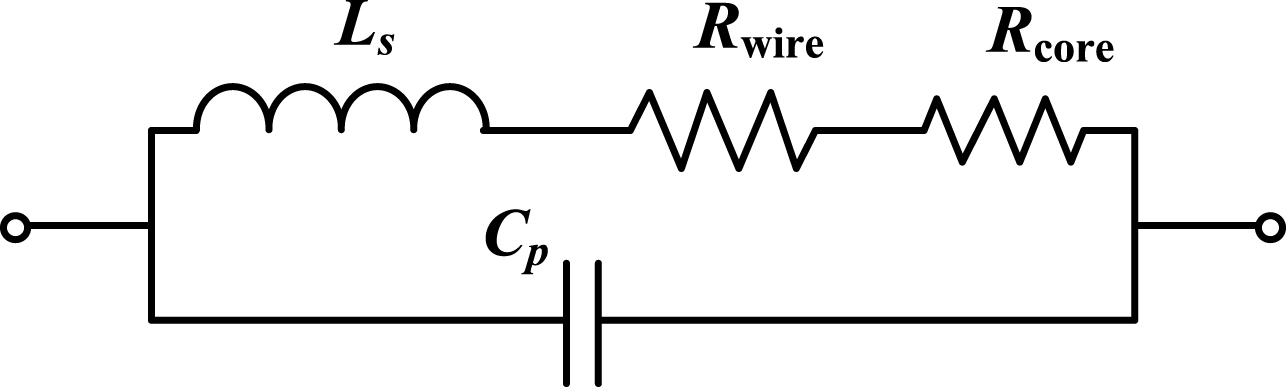
When an inductor suffers from thermal overstress, the insulation may be damaged, resulting in short circuit between the adjacent turns. Once the phenomenon occurs, the inductance value will decrease [4]. Figure 1 shows the equivalent circuit model of an inductor, where Ls represents the inductor inductance, Rwire the wires resistance, Rcore the core resistance and Cp denotes the parasitic capacitance. As a result of the resonance frequency of inductors is usually greater than the operating frequency of the DC-DC converters, the parasitic capacitance Cp can be ignored. Therefore, the model of an inductor can be simplified as a series of an ideal inductance L in series with an ideal resistance RL. Also, the inductance is used as the failure precursor of the inductor.
Schottky barrier diode
Compared to pn diodes, schottky barrier diodes (SBD) are built using a metal-semiconductor contact with a lower forward voltage drop and a much shorter switching time, therefore, they are commonly used in switching power supplies, voltage clamping, reverse current and discharge protection applications. However, they may be exposed to excessive current, thermal fatigue, these external forces may result in open circuit fault (OCF) and short circuit fault (SCF) [16]. On the other hand, many research proved that the performance degradation of diode mainly reflects in the increase of both reverse leakage current IR and the series on-resistance RD. Consequently, the equivalent model of SBD is represented by series combination of an ideal diode VD, a forward voltage drop UD and an on-resistance R d which is used as the FCP of SBD, as shown in Fig. 2.
Power MOSFET

Equivalent circuit model of SBD.
Power MOSFET is a power semiconductor switch used for the conversion of electrical energy. In the reality, the devices are often subjected to thermal stress and electrical overstress which may cause them to deteriorate. The failure mechanisms for a MOSFET can be divided into two groups: chip-related failures and packaging-related failures. The reasons for chip-related failures are electrical overstress (EOS), electrostatic discharge (ESD), latch-up, etc. The packaging-related failures are mainly related to the dissimilarity between the coefficients of thermal expansion (CTE) of chip and the package which lead to the contact migration, wire lift-off, die solder degradation. Therefore, the structure of a power MOSFET can be characterized as a series of an ideal switch and the drain to source on-resistance R on in the field of fault diagnosis [14, 17].
Boost converter modeling
Base on the aforementioned in the Section 2, the simplified equivalent circuit of a boost converter can be illustrated as shown in the Fig. 3, where Vin, uo represent the input voltage and output voltage, repectively; uab denotes the potential difference between the point a and b, R o denotes the load resistance and iL the inductor current.

Simplified equivalent circuit of Boost converter.
The boost converter operates in the continuous current mode (CCM) is considered in this paper. The following Equation (1) can be obtained in steady state, based on the Kirchhoff’s voltage laws and hybrid system theory.
When power switch is on-state, it is obvious that uab (t) can be expressed as:
From Equation (2), it can be rewritten as a derivative expression, as shown in Equation (3).
Therefore, substituting Equations (2 and 3) into Equation (1), then Equation (4) can be deduced after rearranging.
On the other hand, the following Equation (5) can be obtained based on Kirchhoff’s Current Law.
Where, uc(on) (t) denotes the following Equation (6).
When the power switch is off-state, it also can be deduced that the relationship between voltage uab (t) and uo (t) can be expressed as:
Where, uc(off) (t) denotes the following Equation (9).
The parameters values of L, R L , R on , R d , C and R C are needed to be identified by detecting voltage signals uab and uo, based on the Equations (4–9). It is not simple and convenient to obtain these values accurately and directly, due to the computation is extremely complicated. However, the parameter identification problem can be equivalent to an objective function optimization issue. Therefore, it is feasible to gain these parameters values by optimization algorithm.
Crow Search Algorithm (CSA) is a recently proposed evolutionary computation technique which is based on the behavior in flocks of crows [1]. Crows are considered to be one of the most intelligent animals in the world, thus, their behavior can provide interesting heuristics. One of the intelligent behaviors of the crows is that they can hide their excess food in specific hiding places and recall the food place when it is needed. On the other hand, crow has a greedy habit by which it follows the other crows to find the place of their hiding places and steal their food once the owner leaves. As a result, in order to prevent their food sources from being pilfered, crows conduct extra precautions. CSA tries to effectively mimic this intelligent behavior for providing an efficient methodology to solve optimization problems.
It is assumed that a flock of N crows in CSA, the position of crow i at iteration k is given by
Where ri is a random number between 0 and 1, fl is a parameter that controls the flight length.
The other probable scenario is that the owner crow j know that the thief crow i follows it, thus, the owner crow will deceive crow i by going to any another position of search space. The position of crow i is updated by a random position. These two cases in the CSA can be summarized by the following expression:
Where the parameter AP is named as awareness probability in range [0, 1]. Compared to other search algorithm, there are two specific parameters in CSA, flight length (fl) and awareness probability (AP). The parameter fl determines the step size of moving towards the interesting hiding place. When the fl is between 0 and 1, the new position of a crow will between its current position and the position of the interesting hiding place. If the value of fl is chosen more than 1, the crow can visit beyond the interesting hiding place. The parameter AP provides a balance between diversification and intensification. Small values of AP increase intensification and large values increase diversification.
In order to estimate the components parameters of the Boost converter, the CSA is used to solving the optimization problem. The required steps of CSA are presented in the flow chart of Fig. 4. The first step is the initialization of the CSA, including fl, AP, flock size and stopping criteria. The next step consists in randomly initialize the crow positions and evaluate them by computing the fitness function. The positions are uniformly distributed in the search space. After that, the new positions are generated according to Equation (9). All the new positions are evaluated in the objective function, and the memory is updated. Finally, the stopping criteria are verified in order to terminate or continue with the iterative process.

The flowchart of the CSA.
It is known that a fitness function is needed in solving objective optimization problem. Based on the aforementioned Equations (4 and 5) and Equations (7 and 8), the following functions can be defined as:
Therefore, considering the power switch no-state and off-state, functions F1j and F2j are constructed as:
Where SW represents the state of power MOSFET, SW = 1 indicates the power MOSFET is in the on-state while SW = 0 means the power MOSFET is off-state. Moreover, the value of F1j and F2j could be close to zero when the parameters L, R
L
, R
on
, R
d
, C and R
C
are estimated accurately. Based on the principle of least mean square error (MSE), the fitness function of the CSA is defined as:
It is observed that parameters identification in this paper turns to be a minimum optimization problem.
Only the voltage signals uab and uo would be sampled to achieve condition monitoring for boost converter. Additionally, it is noteworthy that the state of power MOSFET SW does not determined by the driving signals. When the power MOSFET is on-state, according to Equation (1), uab (t) can be expressed as:
As a result, the Equation (19) can be acquired.
In the same way, when the power MOSFET is off-state:
Therefore, the following Equation (22) can be deduced based on Equations (20 and 21).
Simulation results and discussion
The simulation circuit of boost converter is modeled by the software Matlab 2016a/simulink. Meanwhile, the proposed condition monitoring method for boost converter is implemented with MATLAB R2016a and executed on a computer with an Intel Core i7-6700 CPU @ 3.40 GHz/16 GB RAM. The nominal circuit parameters of the boost converter are given in Table 1.
The nominal circuit parameters of boost converter
The nominal circuit parameters of boost converter
To verify the effectiveness of the proposed parameter estimation approach based on CSA, the particle swarm algorithm (PSO) is also used for comparative analysis. In PSO and CSA, the maximum number of iterations is both set to 500. The parameter setting of AP and fl in CSA are 0.1 and 2, respectively. The parameters learning factors c1 and c2 in the PSO are both set at 2. It is known to all that the performance of these two stochastic algorithms may be sensitive to initial conditions, therefore, the effect of population size for PSO and CSA are analyzed whose value is in the range of 30 to 100. The mean fitness value varies with the population size over 50 runs for the parameters estimation problem under normal condition is illustrated in Fig. 5. It shows that PSO is more affected than CSA with the population size. When the population size reaches to 50, the fitness best value tends to a steady and minimum value in CSA while the fitness best value based on PSO gets a minimum.

The fitness best value with the population size (50 runs).
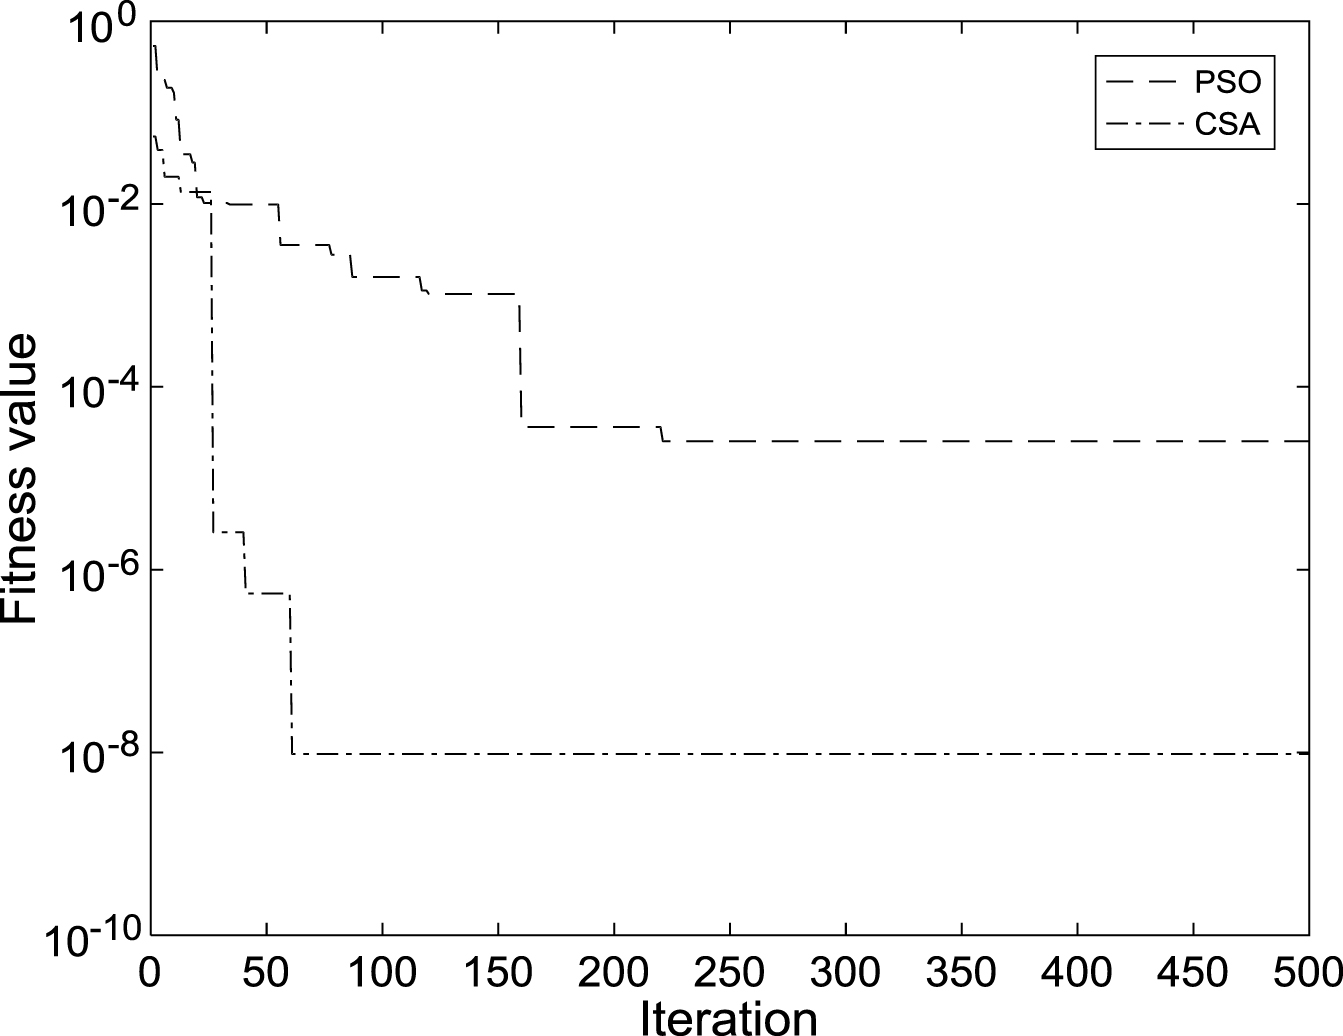
Convergence curves of PSO and CSA for components parameters identification problem (population size: 50).
The convergence curves of the PSO and CSA are provided in Fig. 6 when the population sizes of them are both 50. It is obvious that the convergence rate of CSA is greatly faster than PSO. Therefore, considering the tradeoff of convergence speed and estimation accuracy, the population size is set to 50 in the following parameter identification problems. Statistical results obtained by PSO and CSA are recorded in Table 2. In terms of the worst, best, mean and standard deviation indexes, it can be concluded that CSA outperforms the PSO algorithm. Table 3 shows the parameters identification results based on CSA and PSO. It is noteworthy that the parameter identification results in column 2 and 4 are represented by the mean value of the optimal solutions from 50 runs based on PSO and CSA, respectively. In the following tables, the estimation values of the parameters identification results are the same meaning as mentioned above.
Comparison of statistical results obtained by PSO and CSA (50 runs)
The parameters identification results based on CSA and PSO (50runs)
From Table 3, it is indicated that the absolute error of each parameter (AE) estimations are among 1.0% based on CSA, while the maximum AE based on PSO reaches 3.90%, which means the estimation value by CSA gets a higher precision than PSO. Moreover, the CSA method has faster convergence ability than PSO. In order to verify the feasibility and validation of the proposed approach, the case of power converters under components degradation and variable operating conditions are also discussed.
The converters would suffer voltage fluctuation and load changing at times when work in variable operating conditions. Several simulation experiments have been conducted to analyze the effect of different operating conditions by changing input voltage and load resistance separately. Components parameters are keep the same with their nominal values. Input voltage varies from 9 V to 11 V, partially listed in Table 4.
The identification results under variable input voltage conditions based on CSA (50 runs)
The identification results under variable input voltage conditions based on CSA (50 runs)
It can be seen that the estimation results of these four groups could get a high accuracy and the maximum margin of absolute errors for these six parameters are 0.4227, 0.326, 0.792, 0.28, 1.15 and 0.6417 percentage points, respectively. Actually, a great quantity of such simulations under variable input voltage conditions has been developed. The results show that the estimation values of parameters C and R on have little effect with the input voltage changing while the absolute errors of other four parameters (L, R L , R d and R C ) change with the input voltage fluctuation, that is, the greater fluctuation, the larger absolute errors.
In the cases of load changing, the load resistance R o varies from 9.0Ω to 11.0Ω. The identification results show that they are quite similar with the results in Table 3, which means the load changing has litter effect on these parameters estimation. Thus, it still shows the effectiveness of the CSA method and all of these absolute errors are no more than 1%.
Components under degradation conditions
The converters would suffer performance degradation when they are wearing out, which leads to the parameters values of components change. Multiple parametric faults are considered in this paper, which the capacitor, power MOSFET and inductor occur are supposed to suffer degradation. Three groups of these parameters setting and the corresponding estimation results are recorded in Table 5.
The identification results under components degradation conditions based on CSA (50 runs)
The identification results under components degradation conditions based on CSA (50 runs)
It can be observed that the estimation values of these six parameters in the three groups are very close to the real values, in spite of several components suffer degradation at the same time. The absolute errors of the parameter estimation are quite small that the greatest absolute error is within 2%. As a consequence, the proposed approach shows good performance in multiple components condition monitoring in that these parameters can be obtained accurately.
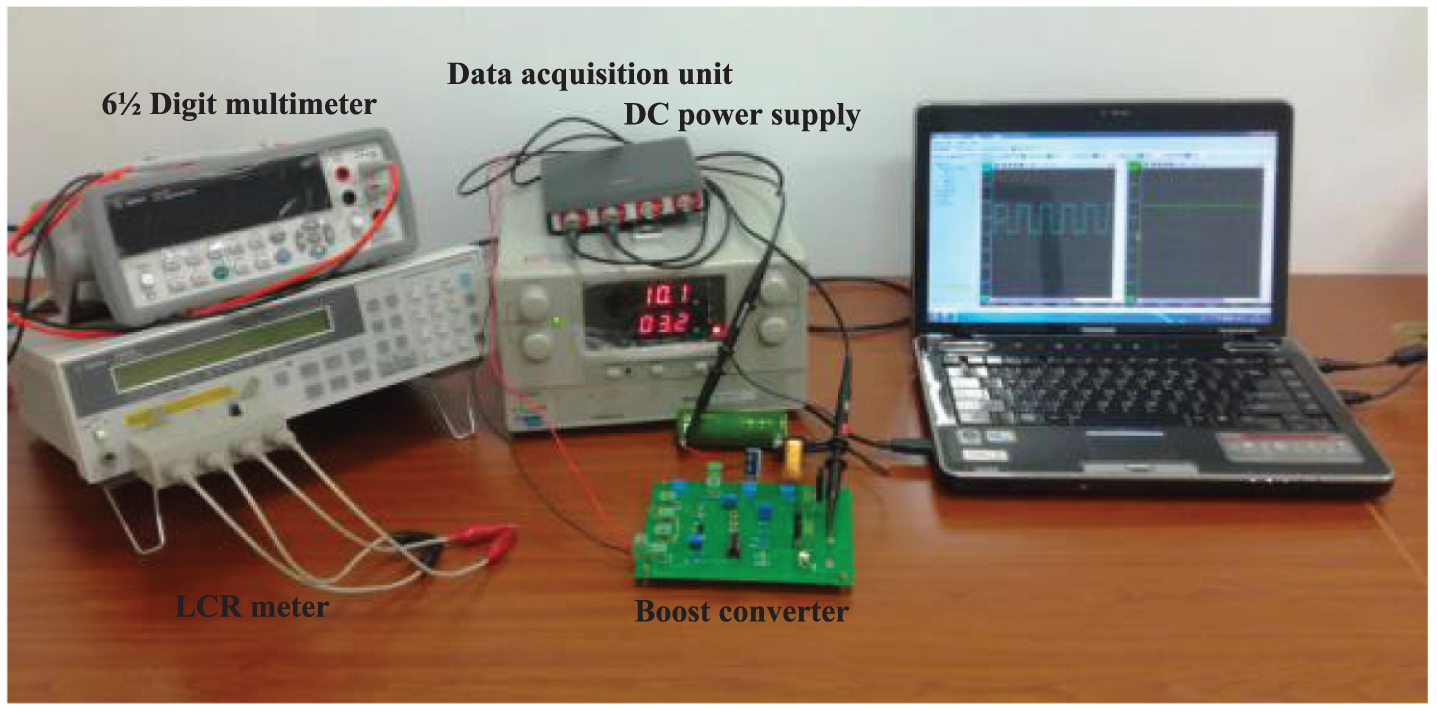
In order to validate the effectiveness and feasibility of the proposed method, an experimental study has been conducted on boost converter circuit. The test rig is as shown in Fig. 7, composed of DC power supply, 4-channel data acquisition unit, the boost converter and a laptop. The input voltage of the boost converter is 10.11 V, measured by Agilent 34410A digit multimeter. The parameter values of the inductor, capacitor and load resistance are off-line measured by Agilent 4263B LCR meter before the experiment. The load resistance is 10.048Ω. The specifications of diode and power MOSFET are MBR3045 and IRFP460, respectively. In this experiment, the voltage signals uab and uo are collected with a sampling frequency at 1 MHz that the boost converter operates in continuous current mode.
Experimental setup.
The parameter values of the three capacitors and two inductors
Six cases with different capacitor and inductor
The signals are processed by wavelet denoising to eliminate the measurement noise. Also, in order to verify the effectiveness of the proposed method, three capacitors from different manufacturers and two inductors with different specifications are used to simulate boost converter degradation. The parameter values of the three capacitors and two inductors measured by LCR meter at 20 KHz are listed in the Table 6. Therefore, there could be six cases with the combination of different capacitors and inductors, as shown in Table 7. However, in order to get the real value of parameters R d and R on when the boost converter operates in the CCM, the inductor current is also collected. Thus, the real value of R on can be calculated in terms of u ab and i L when the power switch is on-state. Moreover, R d can be obtained from the relationship between uab - u o - U d with i L . To decrease the effect of measurement errors, the average values of R d and R on in a certain period of time are regarded as real value. The estimation results of the six cases are recorded in Table 8. It can be concluded that the identification of parameter R d gets the largest absolute errors which the temperature and line impedance factors may be the main reason that does not considered in the paper. Also, the neglected parts could also lead to the errors in parameter R on estimation which the absolute error reaches to 5.75%. The parameters L, R L , R C and C can be estimated within a lower absolute error that means the proposed method performs great results.
The estimation results of the six cases in the experiment based on CSA (50 runs)
In order to achieve the purpose for multiple devices health state estimation of boost converters, a non-invasive condition monitoring technique is proposed in this paper. The voltage across the drain and source of power MOSFET and the output voltage of boost converter are needed to be sampled while the state of power switch is determined by their relationship. Considering the parasitic parameters of inductor, capacitor, diode and power MOSFET, the circuit model of boost converter is simplified that the formulations of failure precursors with detection signals are derived based on hybrid system theory. The parameters values of L, R L , R on , R d , C and R C can be identified accurately and simultaneously based on crow search algorithm, which outperforms the PSO algorithm. Both simulations and experiments are conducted to verify the effectiveness and feasibility of the proposed approach. The results show that identification accuracy of these parameters reach to more than 90%. The effect of temperature on parameters identification will be studied in the future work. Additionally, the presented technique will be a useful means for parametric fault diagnosis and remaining useful life prediction for power electronic converters.
Footnotes
Acknowledgments
This work is supported by National Natural Science Foundation of China (No. 61371041), the Fundamental Research Funds for the Central Universities and Funding of Jiangsu Innovation Program for Graduate Education (No. KYLX_0250).