
Abstract
Roller bearings are among the most frequently encountered components in the majority of rotating machines. Thus, prognostic and health management of roller bearing plays an important role on the working conditions of the machine. Remaining useful life prediction is one of keys to apply PHM for practical applications. The collected bearing vibration signals are generally non-linear and non-stationary. However, those auto-regression model based methods are only suitable for the prediction of linear and stationary time series. Moreover, most of the existing machine learning based techniques require considerable training and parameter tunings which are time consuming and difficult for practical applications. To overcome these issues, a novel remaining useful life prediction method for rolling bearing prognostics is proposed in this work based on the sparse coding and sparse linear auto-regression model without training and parameter tunings. Sparse coding is formulated as a basis pursuit L1-norm problem, where a sparse set of weight can be estimated for each test vector. Sparse local linear and neighbor embedding are employed to construct the proposed weight constraint sparse coding method. Two different experimental validations are conducted to well demonstrate the effectiveness and robustness of the proposed method for remaining useful life prediction of bearing via root-mean-square, peak-to-peak and kurtosis indicators in time-domain.
Keywords
Introduction
Prognostic and health management (PHM) has recently attracted substantial attention due to its importance in increasing the maintainability and reliability of machines. PHM mainly involves condition monitoring [1], fault diagnosis [2] and remaining useful life (RUL) prediction [3], health management etc. As a fault can be predicted as early as possible, catastrophic consequences and economic losses can be avoided [4]. Thus, machine health management via RUL prediction has attracted much research interest in the past decades.
A large number of data-driven methods have been proposed for machine PHM [5]. Classical linear prediction techniques apply different autoregressive and moving average (ARMA) models [6]. Moreover, some machine learning based techniques, such as fuzzy artificial neural networks [7], support vector machines (SVMs) [8, 9] and back-propagation neural networks [10] methods have also been attempted to analyze the degradation process of a machine. Tse et al. [11] proposed a method to forecast RUL of a defective gearbox in a compressor and a bearing in a cooling tower fan based on recurrent neural networks. Recently, the RUL of the rolling element bearings was predicted using SVM [12]. Huang et al. [13] employed self-organizing map and BPNN to predict the trend of rolling element bearings. However, machine learning based techniques usually take much time in the training stage, and their prediction accuracy greatly depends on the historical data. Consequently, it is difficult to use them for practical online applications.
Recently, dictionary-based L1-norm sparse coding (SC) has been used for image super resolution [14], pattern classification and nonlinear time series analysis etc. Different from those traditional machine learning methods, SC algorithm [15] is an unsupervised learning method through looking for an over-complete set of basis vectors to efficiently represent the sample data. Actually, two dictionaries are constructed in a SC model for time series prediction: one dictionary contains predictive training vectors, and the other one involves the corresponding target values [16]. Thus, a testing series can be constructed from the linear combination of the first dictionary atoms of SC and sparse weight. The main advantages of SC approaches are that it does not need any training process and time-consuming parameters tuning [17].
Consequently, a novel approach is proposed to predict RUL of rolling bearing in this paper using SC model combined with local linear embedding and sparse neighbor embedding technique. The rest of this paper is organized as follows. Section 2 recalls the theory of the SC prediction algorithm. In Section 3, the effectiveness of the proposed method has been demonstrated using data of accelerated degradation tests on rolling element bearings. Conclusions are drawn in Section 4.
The RUL prediction using sparse coding
SC-based time series prediction model has been successfully applied in many fields. Its improved version of SC will be adopted in this work for fault prediction of rolling bearing. This section describes our proposed method in detail.
Dictionaries of SC
In the case of one-step-ahead time series prediction, the training data is described by prediction window vectors of length L and their corresponding scalar targets. Given a sample series X, a training vector with a predictive window is given by:
SC is considered as an unsupervised method to efficiently represent samples via an over-complete dictionary. This prediction model needs two dictionaries: one is applied for the prediction vectors in the form of the matrix ψ with the dimension L × N,
The other dictionary is introduced by targets in the form of a vector X
N
with the dimension N × 1, which can be written by:
In this paper, the sample series X N is the fault characteristic vector that represents fault trend of a rolling element bearing. Then, a test vector can be written below:
Normalization of the data is applied to improve its sparsity and dimensional homogeneity, which plays an important role in data mining and image processing. Thus, normalization will be also adopted to SC technique. The standard deviation G1 (L1 -norm) of a vector Y with length J has been used for normalization in this paper, which are given below,
Thus, those target vectors are also normalized in the same way,
However, the test vector X
mL
is normalized by its own norm:
Moreover, dictionary ψ can be also normalized using Equation 6.
Many methods can be used to solve the weight estimation problem of SC, such as the basis pursuit (BP), basis pursuit denoising (BPDN) and LASSO. BPDN is used for SC approach, where the linear programming problem is solved with the primal-dual algorithm in this work. The over-complete dictionary is modified for each test vector to include only the K-nearest neighbors [21]. Moreover, sparse vector reconstruction problems can be solved via several different equivalent methods [19]. In this paper, sparse vector reconstruction is conducted by
Subsequently, the constrained reconstruction algorithm, named locally linear and manifold embedding (LLE) [20] and sparse neighbor embedding are employed in this work. Combined with the Equation (9), for any given testing vector, the sparse weight that is also named as the weight constraint sparse coding (WCSC) is written by
Time series is forecasted via over-complete dictionary coding using sparse linear prediction model in this work. Given a training series with N samples, the test vector
in which R
N
(w) is a regularization function on the weight vector corresponding to a Lagrange coefficient τ. The weights can be estimated using Equation (10) if τ = 0. Then the estimated weights are used to calculate the predicted value of a test vector in terms of a linear superposition of (not necessarily orthogonal) basis functions [15],
Then, Equation (13) can be further written as follows:
Combined with Equation (7), the predicted value is thus given by
Moreover, the optimal weight vector is also estimated in the process of solving a convex optimization problem.
In this research, the BPDN is used for the SC approach in which the corresponding linear programming problem is solved with the primal-dual algorithm. The parameter of prediction error is always set to 0.001 (ɛ = 0.001) for all datasets [16] in this work. Due to the non-stationary and non-linear of the degradation of the roller bearing, a good robustness of the prognostic technique is necessary for the practical applications. The proposed method can well solve these problems, which will be demonstrated in the following section.
In this section, data collected from two experimental test-rigs were utilized to verify the effectiveness of the proposed method. The first experimental validation mainly demonstrated performance of the trend prediction using the proposed model with different step length, while the second one will further verify the robustness and accuracy of the RUL prediction using some different datasets.
Moreover, the performance of the proposed method is also compared with the existing techniques, for instance, support vector regression combined with particle swarm optimization (PSO-SVR), sparse nearest neighbor embedding (SNNE). PSO-SVR does not need any prior knowledge due to its analytic property of the generalization performance measure. Thus it can be used to determine some multiple hyper-parameters at the same time [23]. It should be noted that BP is used for the SNNE and the dictionary is modified for each test vector. The L1-magic library that uses the primal-dual algorithm for linear programming is utilized in BP algorithm. Herein, PSO is also applied to optimize three hyper-parameters of support vector regression γ, ɛ and c in cost function. All of these approaches use the same parameter settings for all datasets in this work.
Time-domain feature and evaluation criterion
Three time-domain features, i.e., peak-to-peak value F p , kurtosis F k and root mean square F rms are used to indicate the degradation of bearing in this paper. All those parameters are illustrated in Table 1.
Time-domain features used in this work
Time-domain features used in this work
Since normalized mean square error (NMSE) is independent of the length of the time series, it is well suitable for evaluating the performance of a time series prediction approach. NMSE is given by
Introduction to the experimental system and vibration data
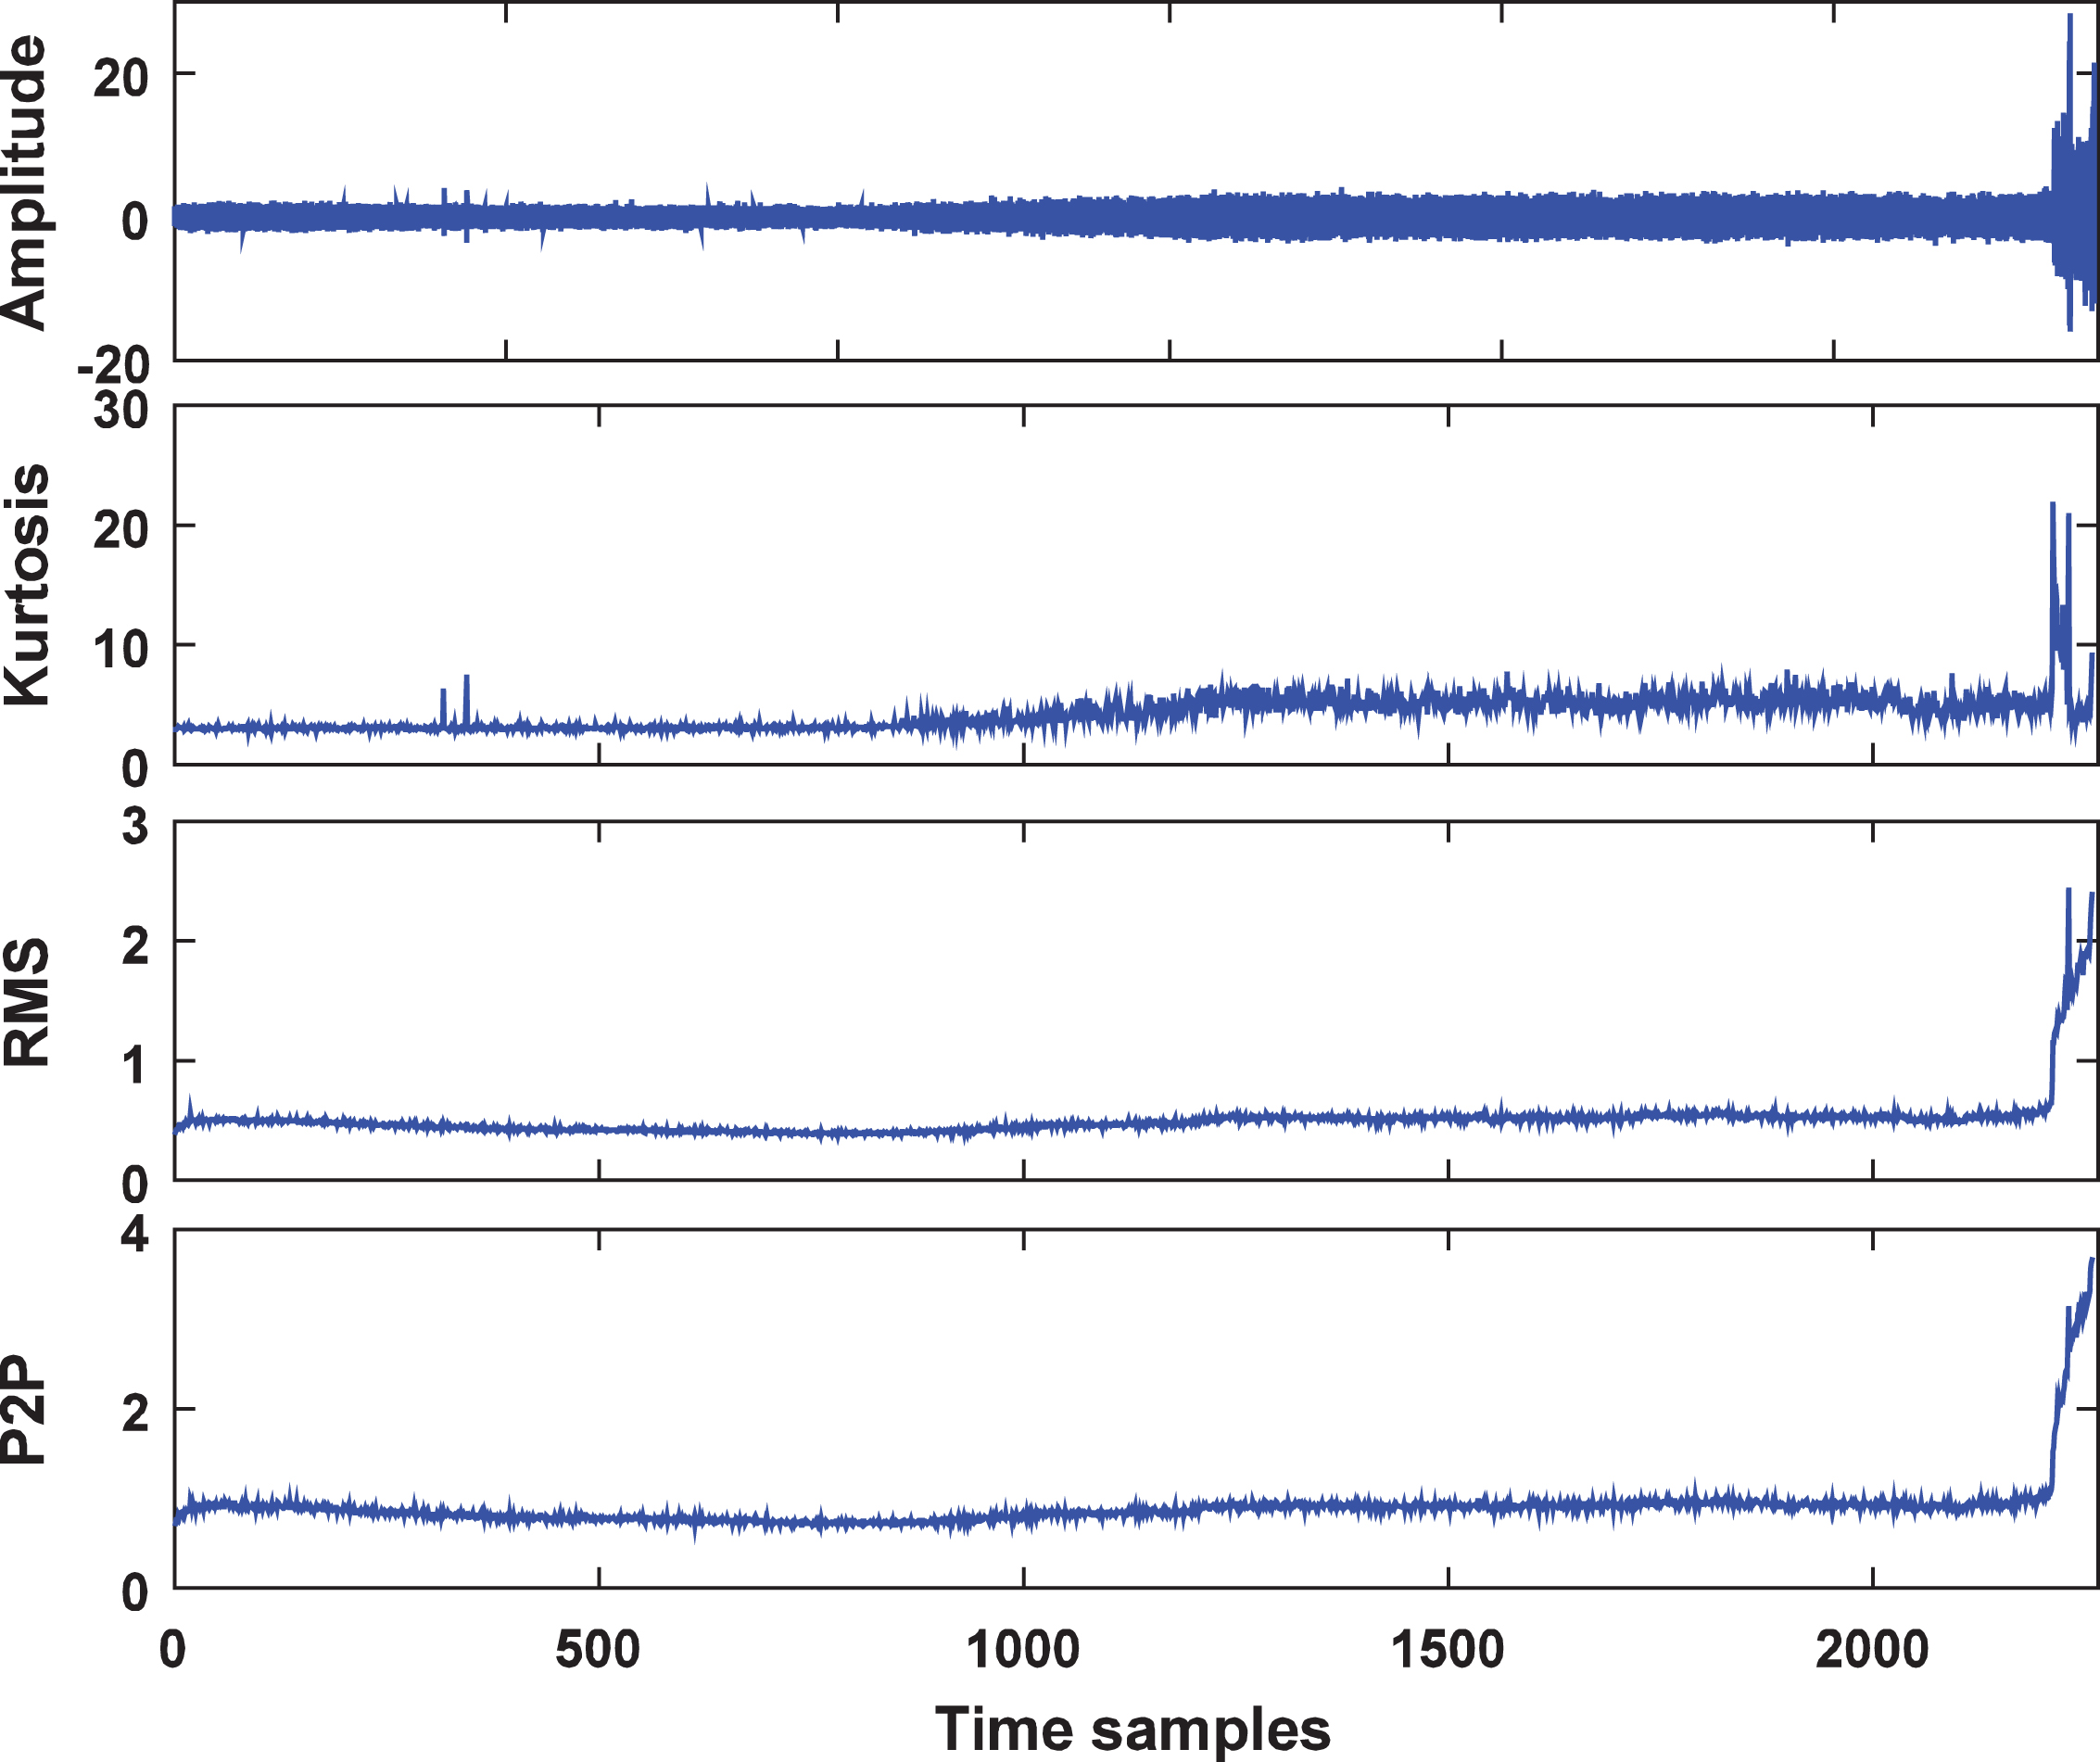
The performances of three methods have been evaluated using rolling element bearing run-to-failure tests [24]. The bearing test platform and its sketch are both shown in Fig. 1. In this bearing accelerated life testing, the power was transmitted from an AC motor to a shaft by a belt. Additionally, the shaft was supported by four double-row bearings of type Rexnord ZA-2115 [25]. A radial load 26648.16N was applied to bearings No. 2 and No. 3 by a spring mechanism. Additionally, accelerometers with high sensitivity were installed on the bearing housing. The rotating speed of the shaft was set to 2000RPM. Bearings have been worked more than 100 million revolutions which was far more exceeded the schedule lifetime of the bearing. The vibration data from the shell of bearing No. 1 was recorded at the specific interval of ten minutes. The experiment totally collected 984 data files in the bearing lifecycle with the sample frequency 20 kHz, and each file has 20480 sample points. Since three signatures can be computed using equations given in Table 1 for each file, 984 signature samples corresponding to a time-domain feature are used in this work.
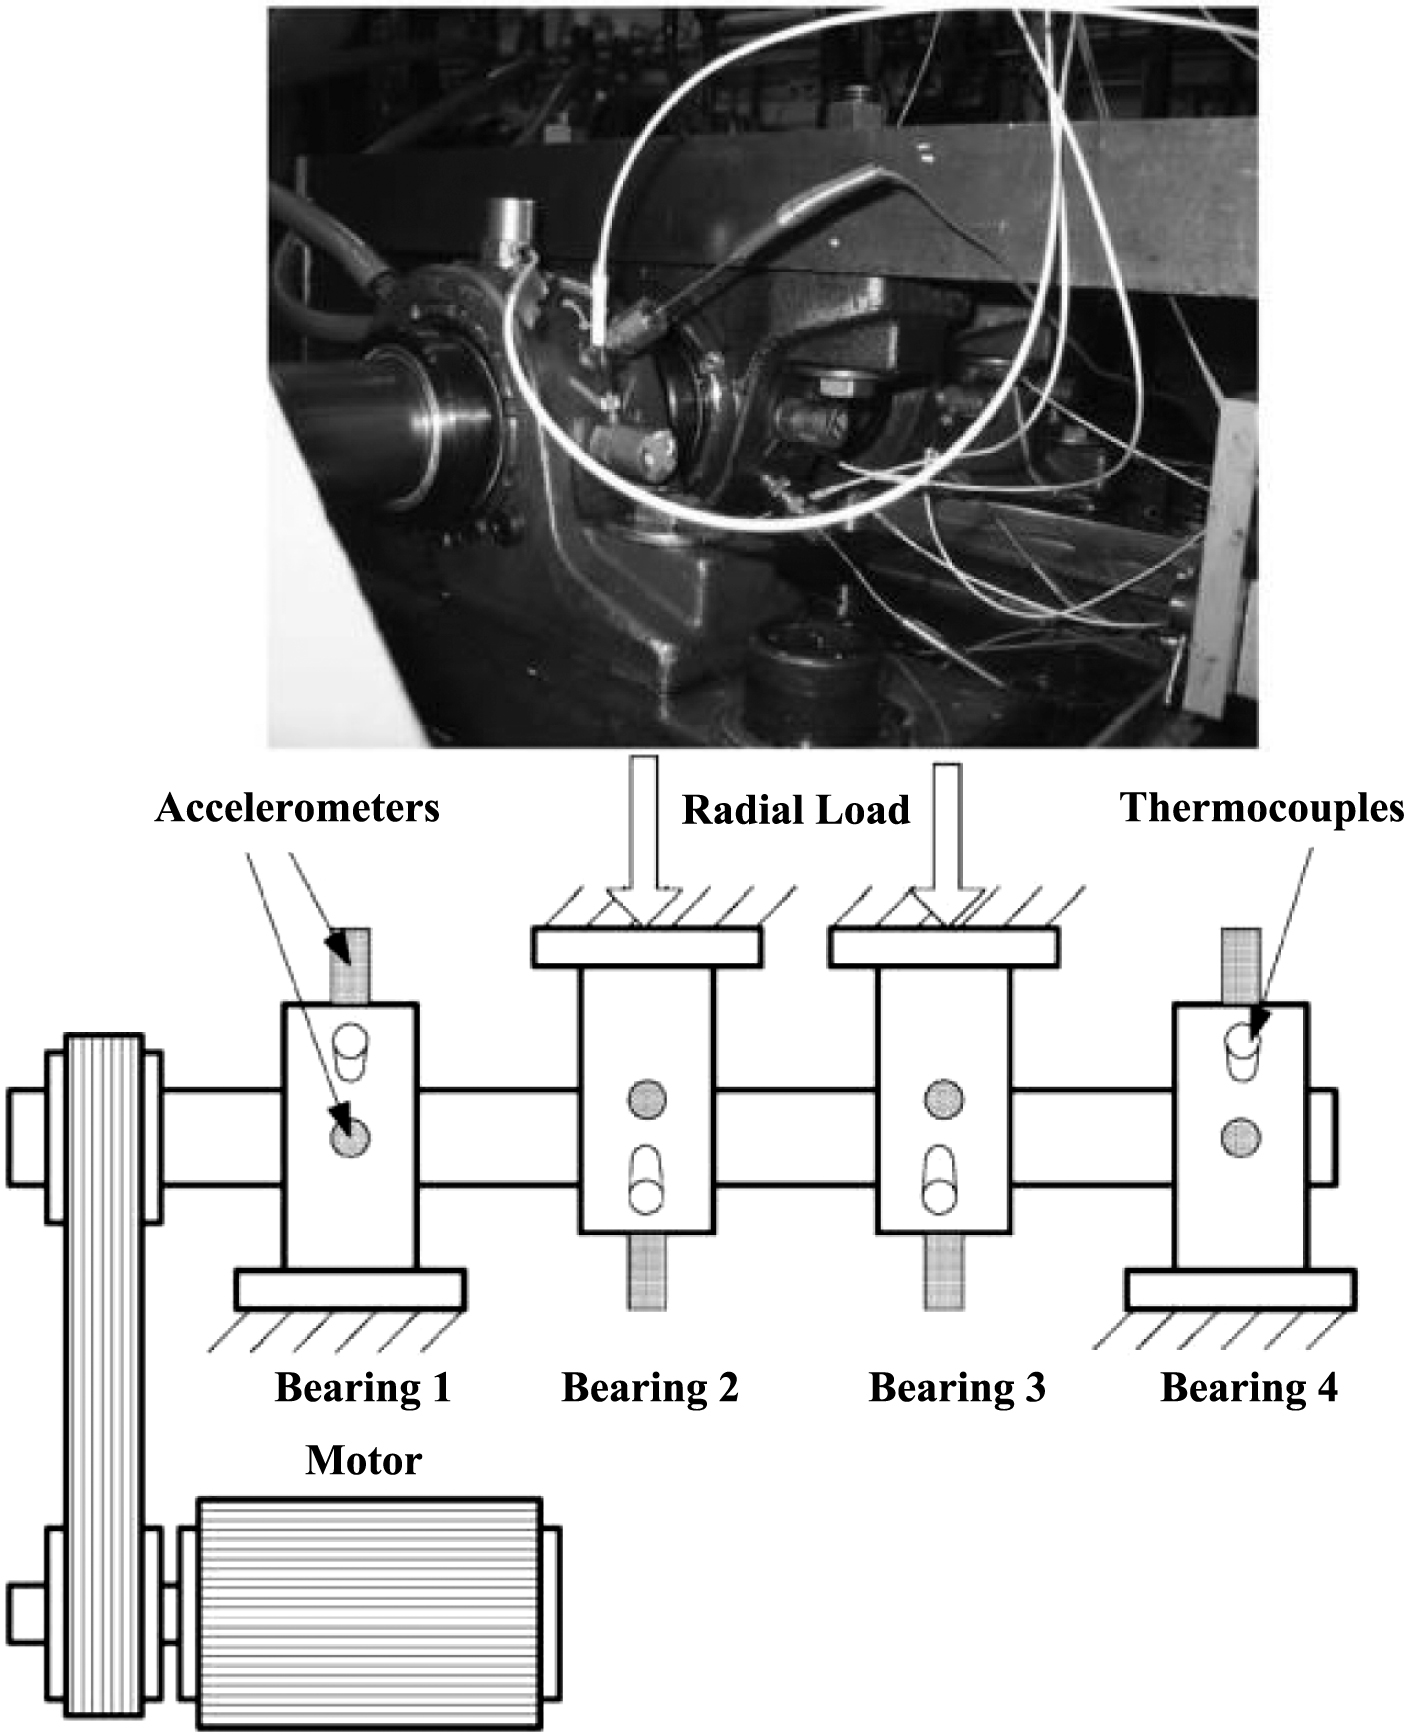
The bearing test-rig of the IMS.
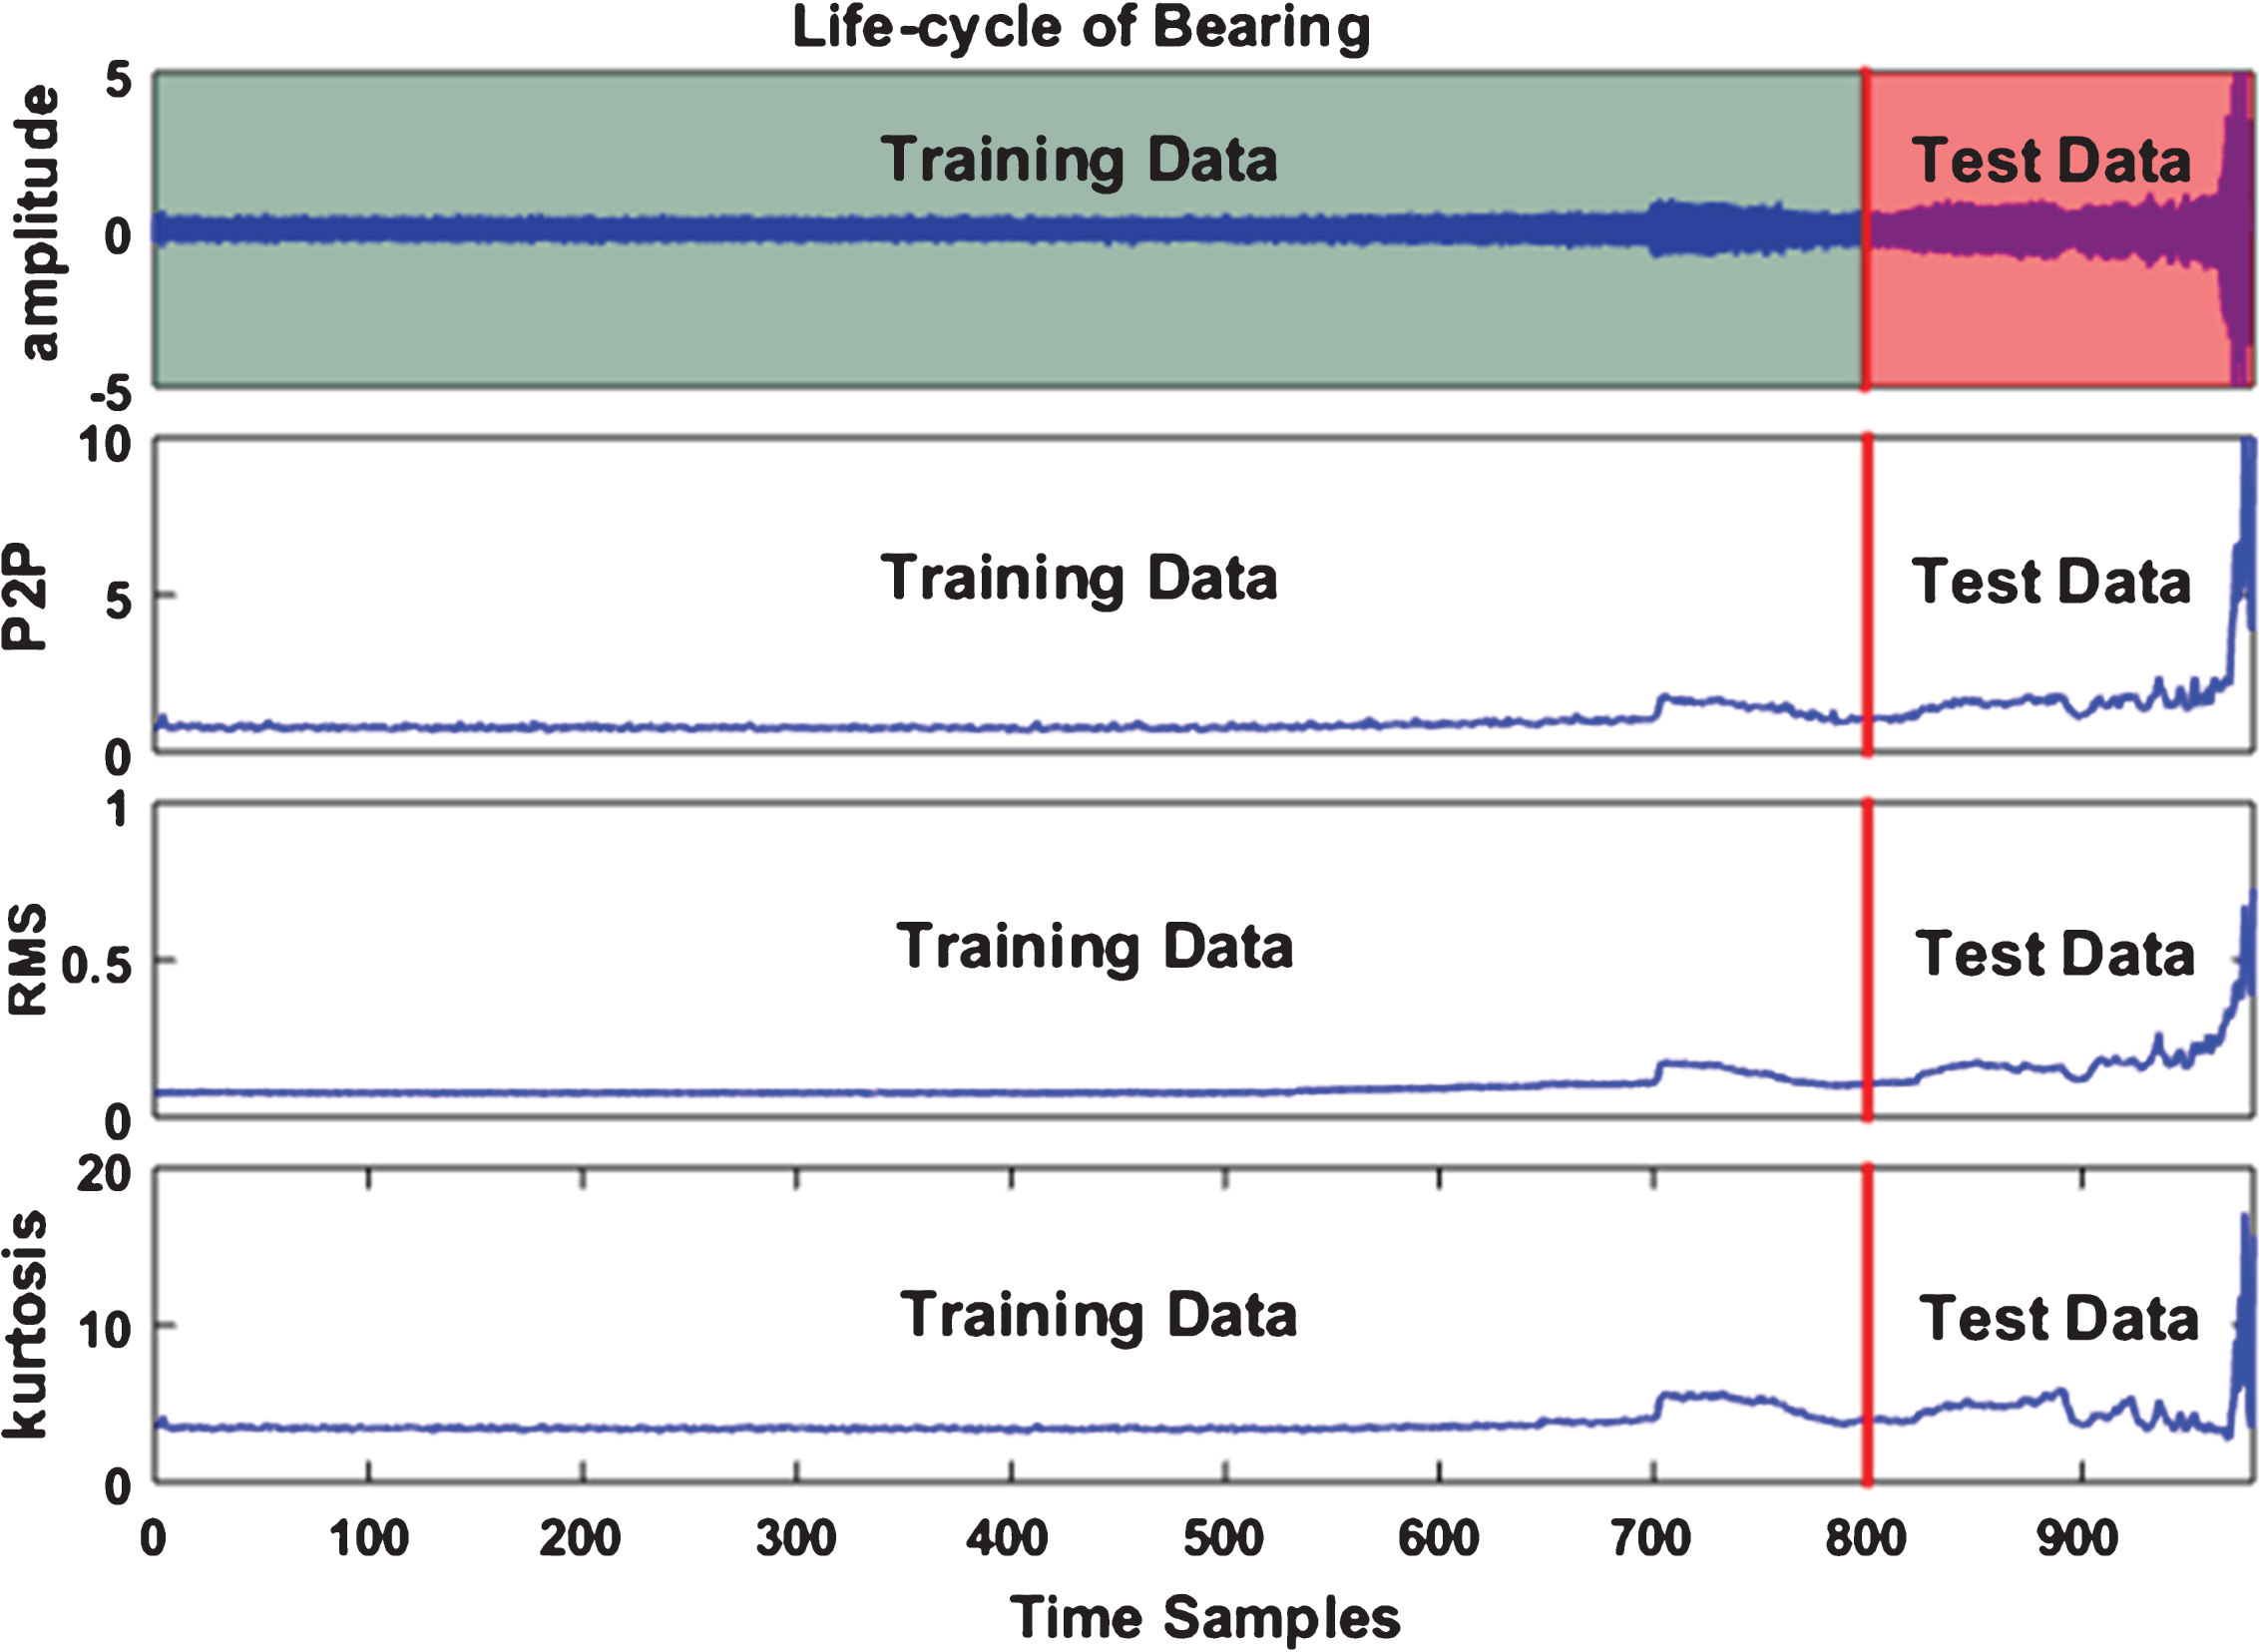
The bearing vibration signal and its time-domain features.
It can be found in Fig. 2 that the first 700 sample points are relatively stable. Subsequently, magnitude of the signature samples fluctuates nonstationarily. Therefore, for case I, 800 samples in each data set are used in the training (training is only used in the competitor methods), while 180 ones are used for the following test.
Figure 3 shows the comparison of forecasted and actual trends of three feature sets, as well as their NMSEs with different steps of prediction. It is clearly shown in Fig. 3(a), (c) and (e) that the proposed method not only well predicts the failure trend but also has a good performance for both nonlinear and nonstationary detail characteristics. Then, the step length of prediction is initially set to 1 and will be increased one for the following 30 predictions in this paper. The results of NMSE are illustrated in Fig. 3(b), (d) and (f), where we can find that NMSE gradually increases as the step raises.
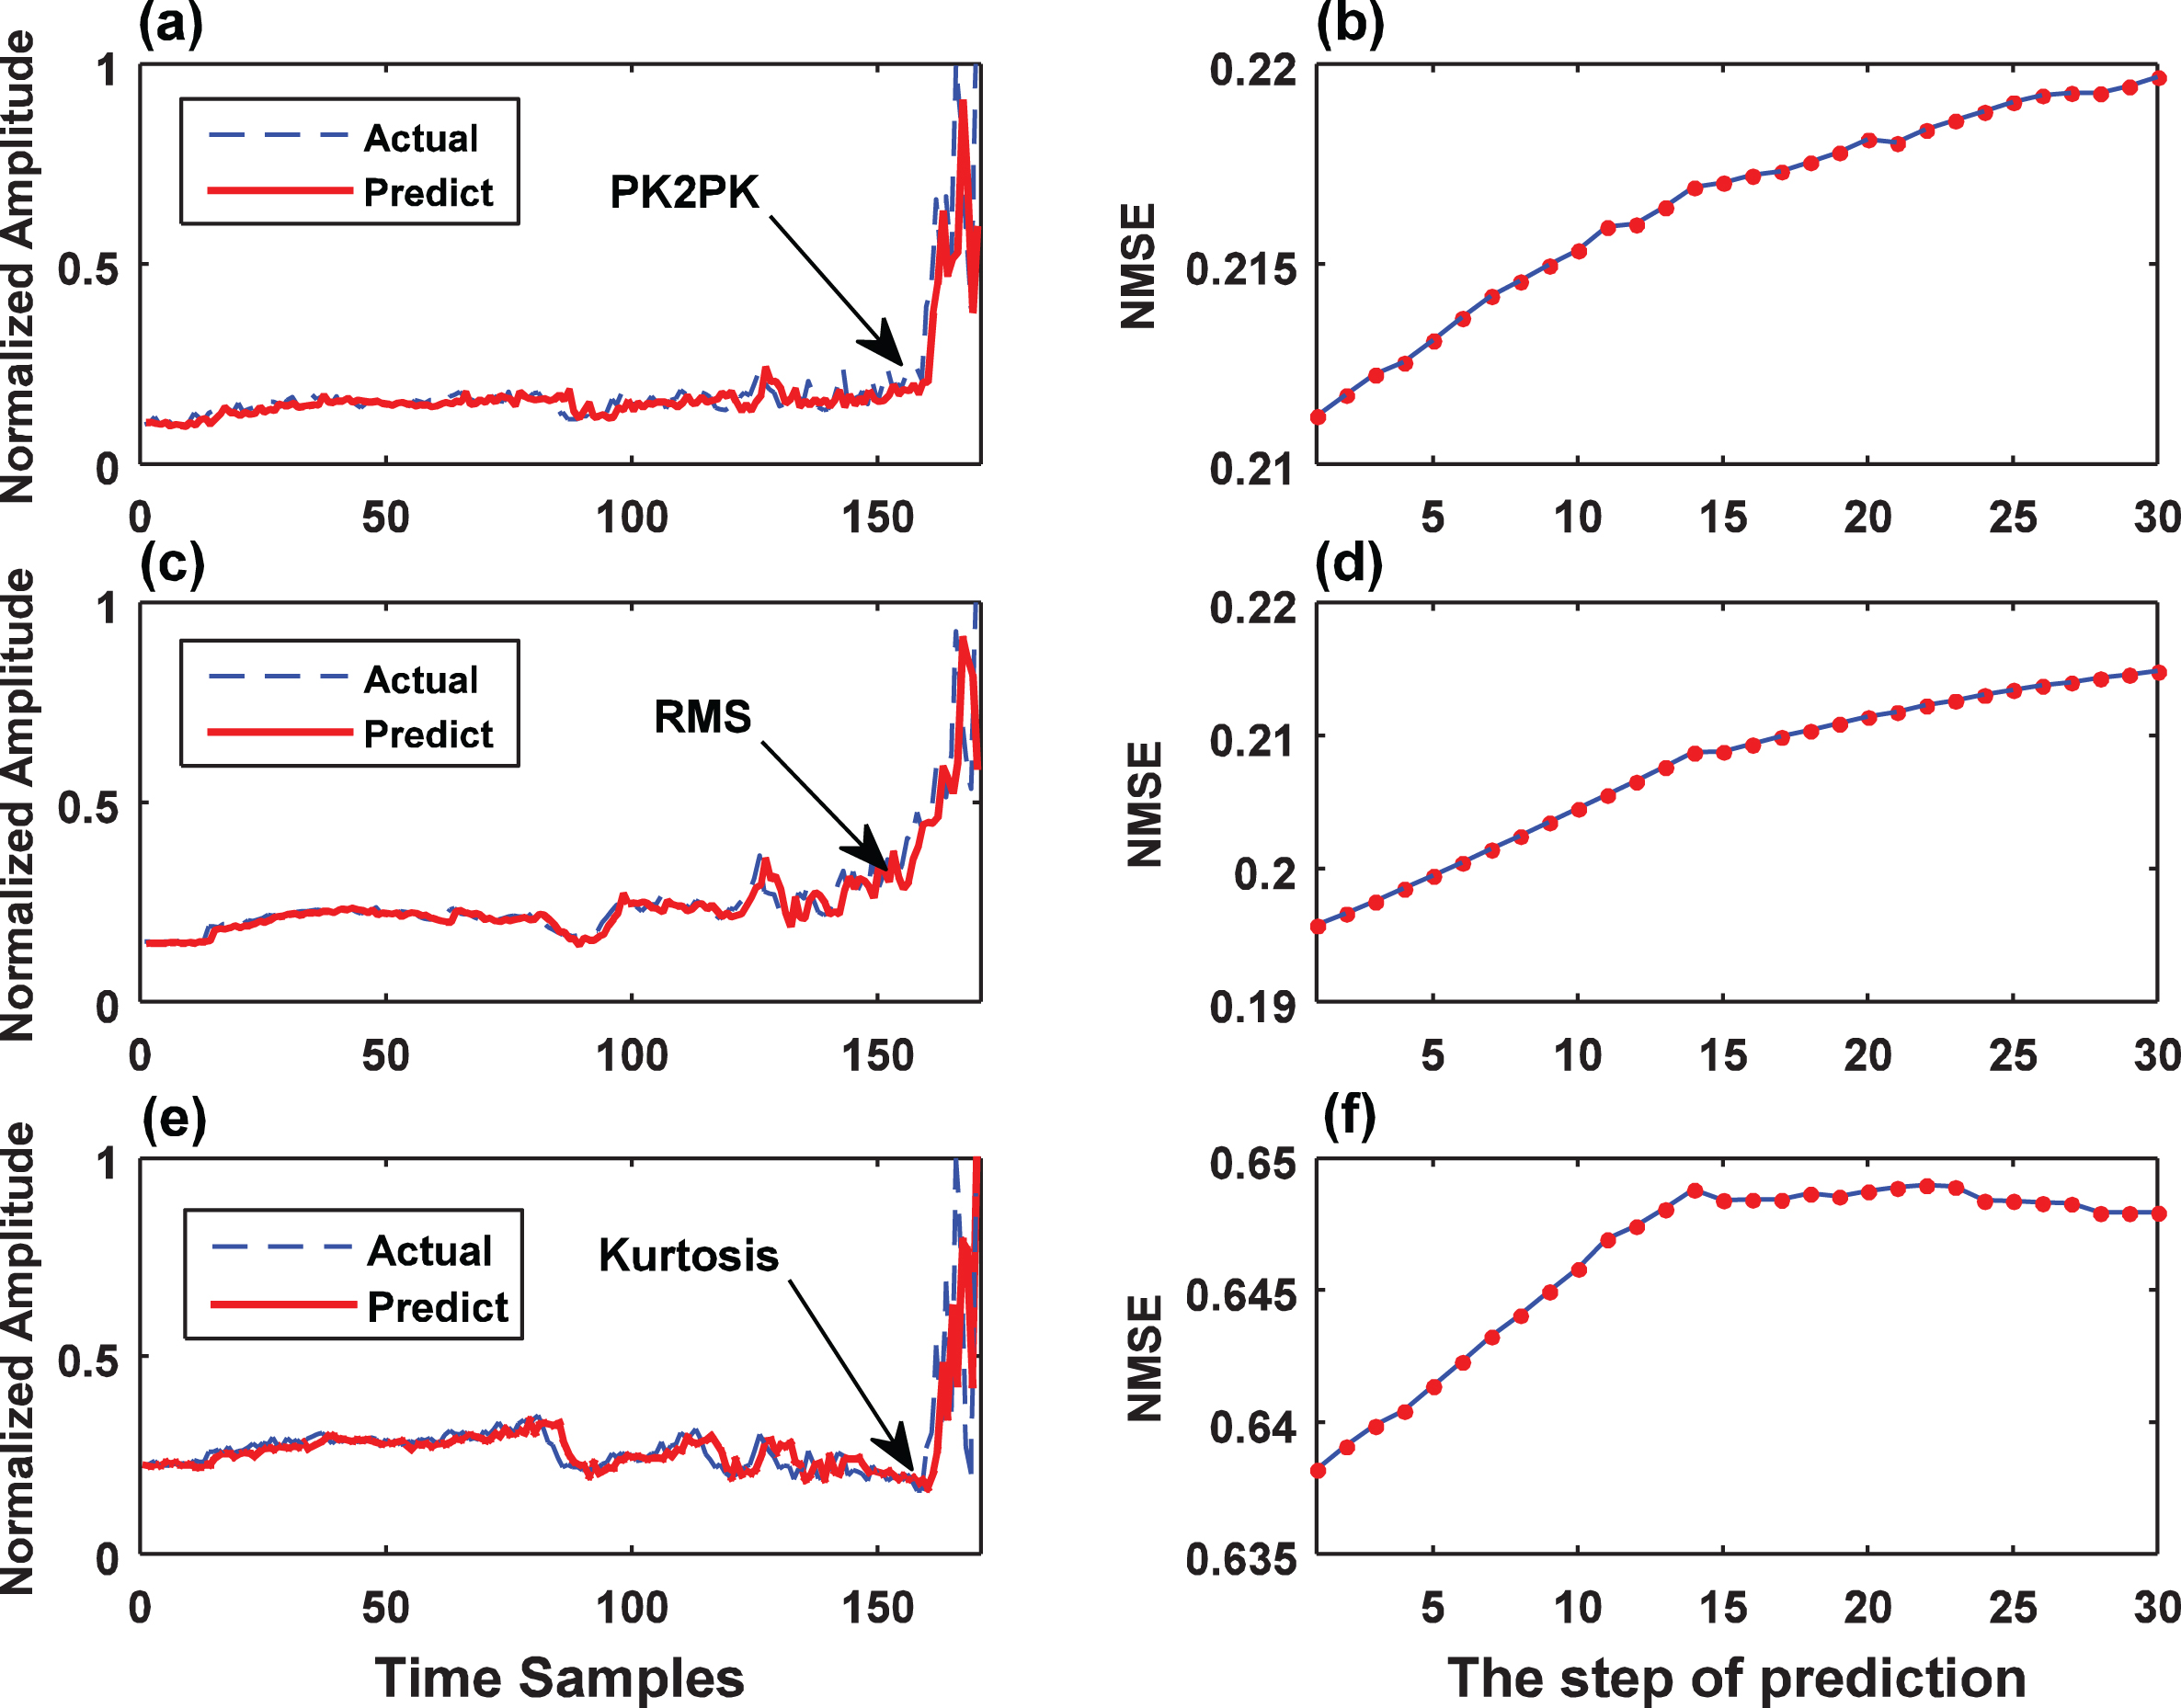
Results of bearing trend prediction and their corresponding NMSEs using three different features.
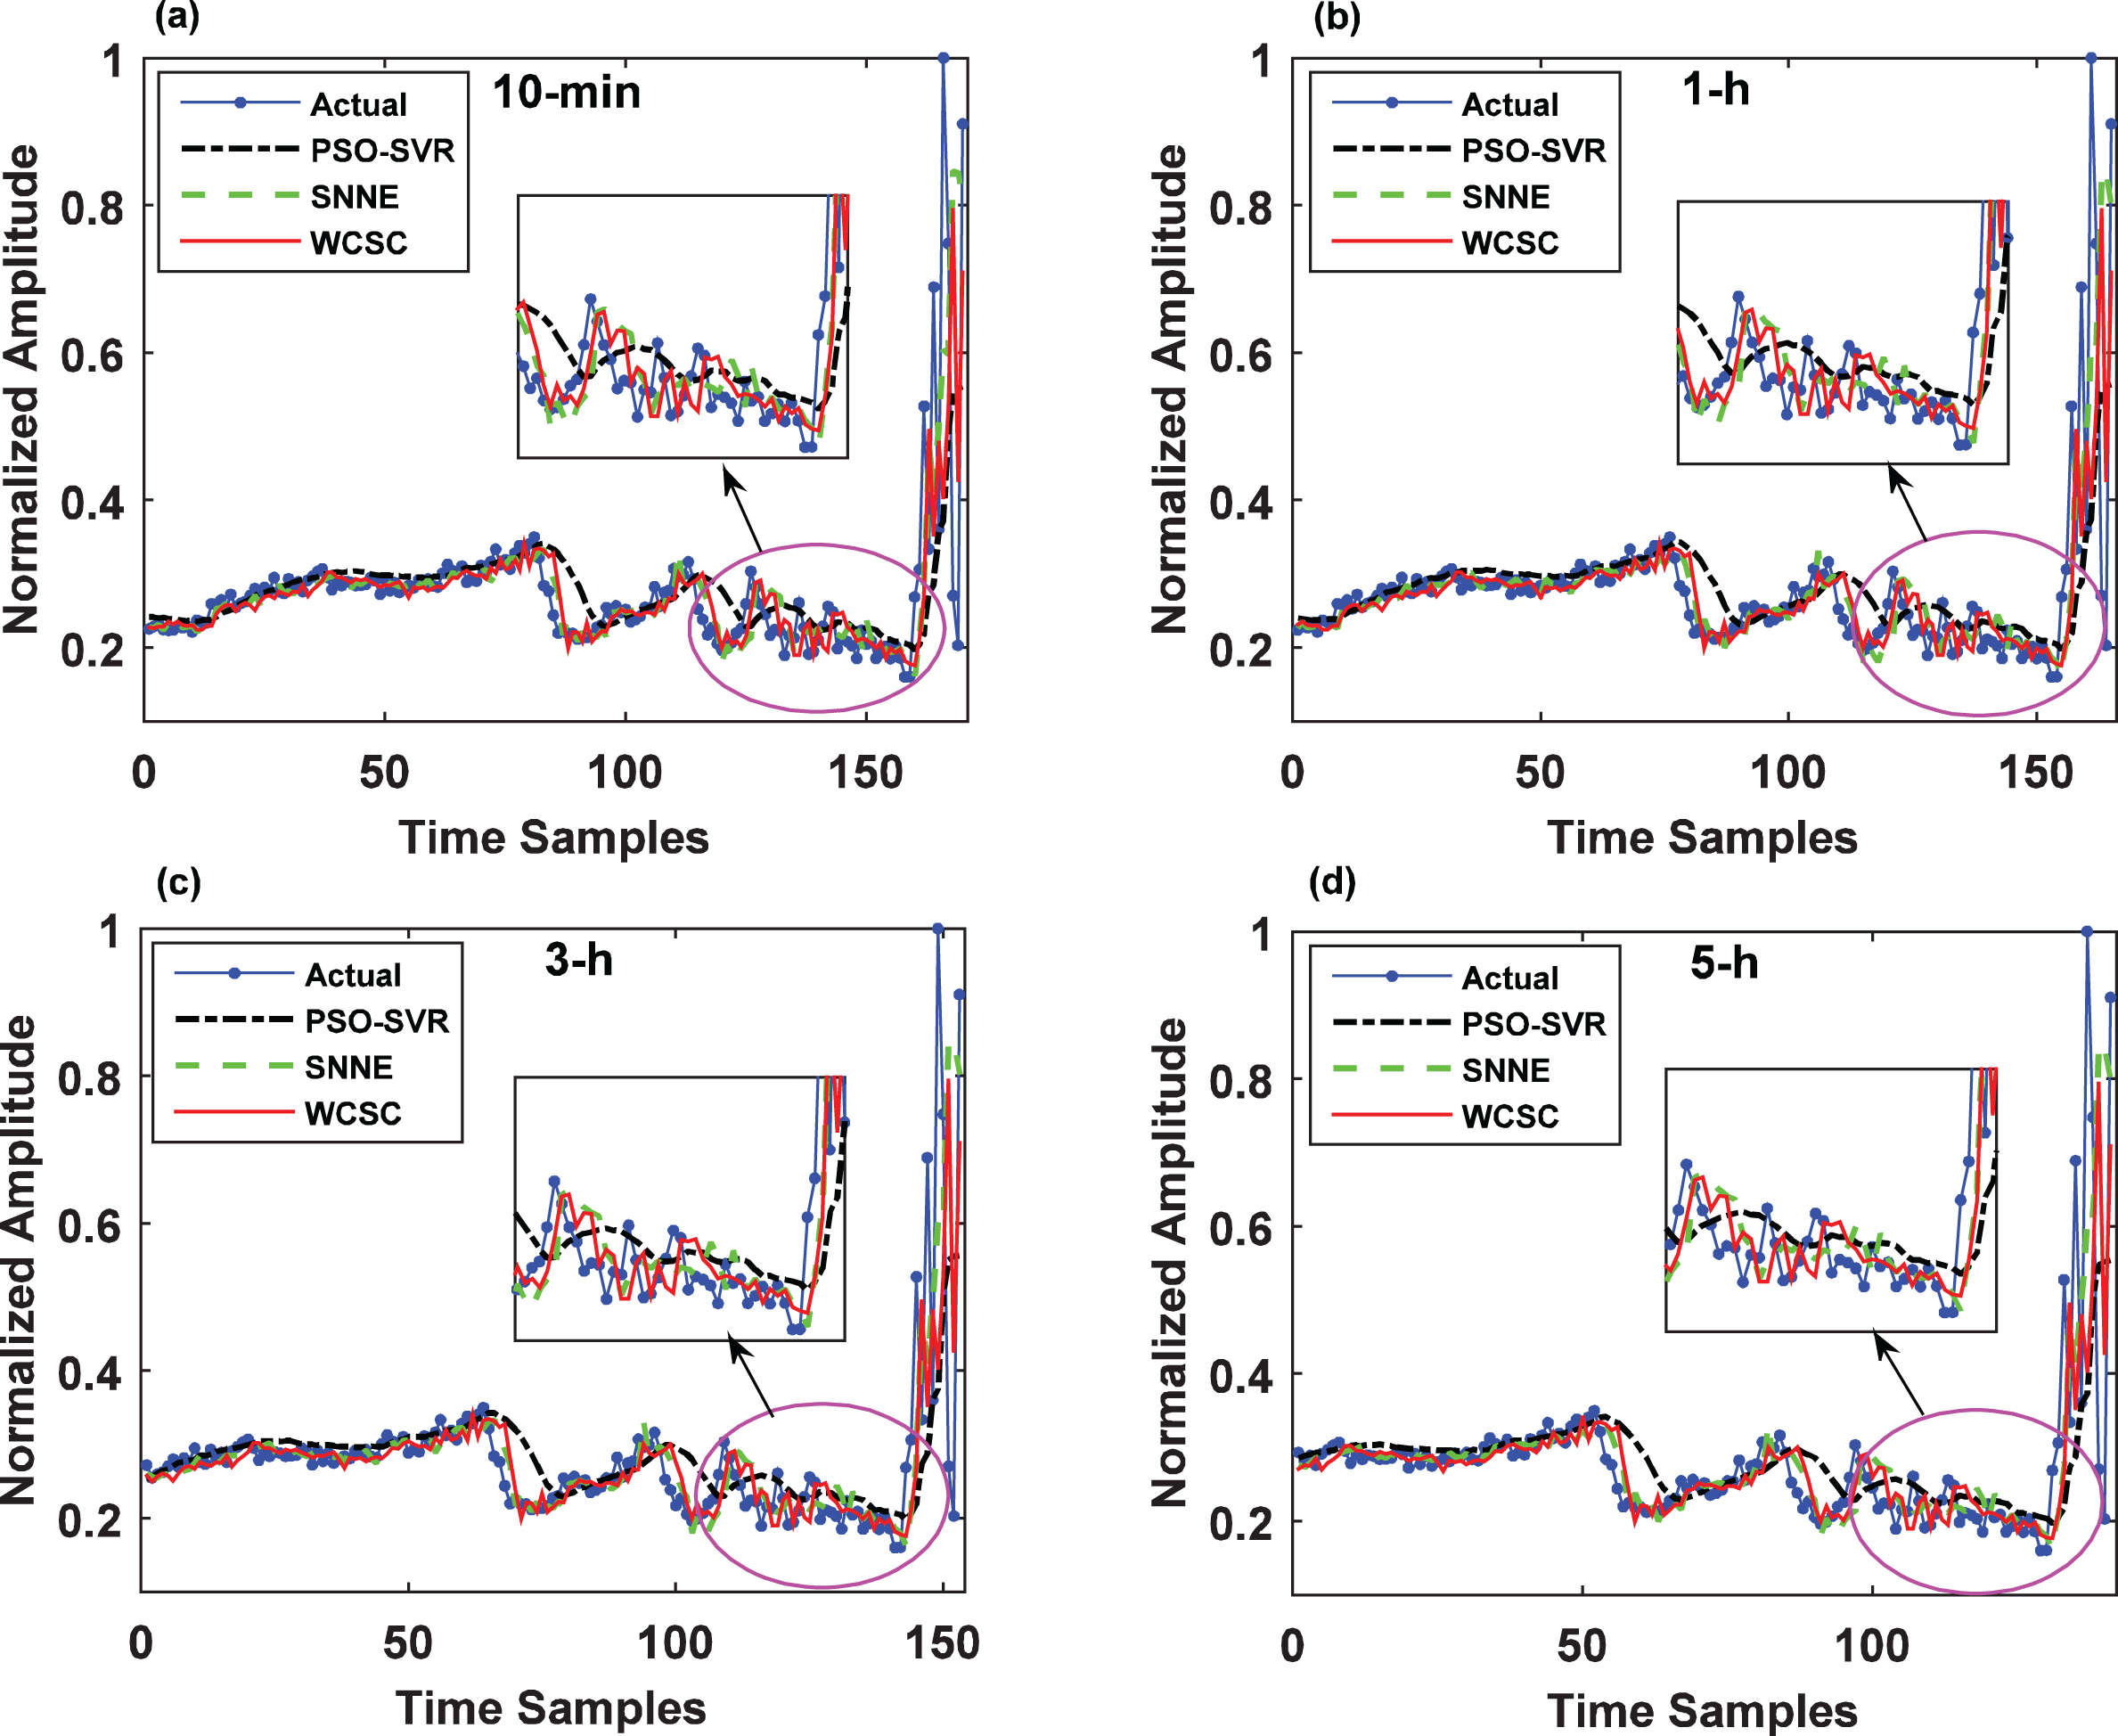
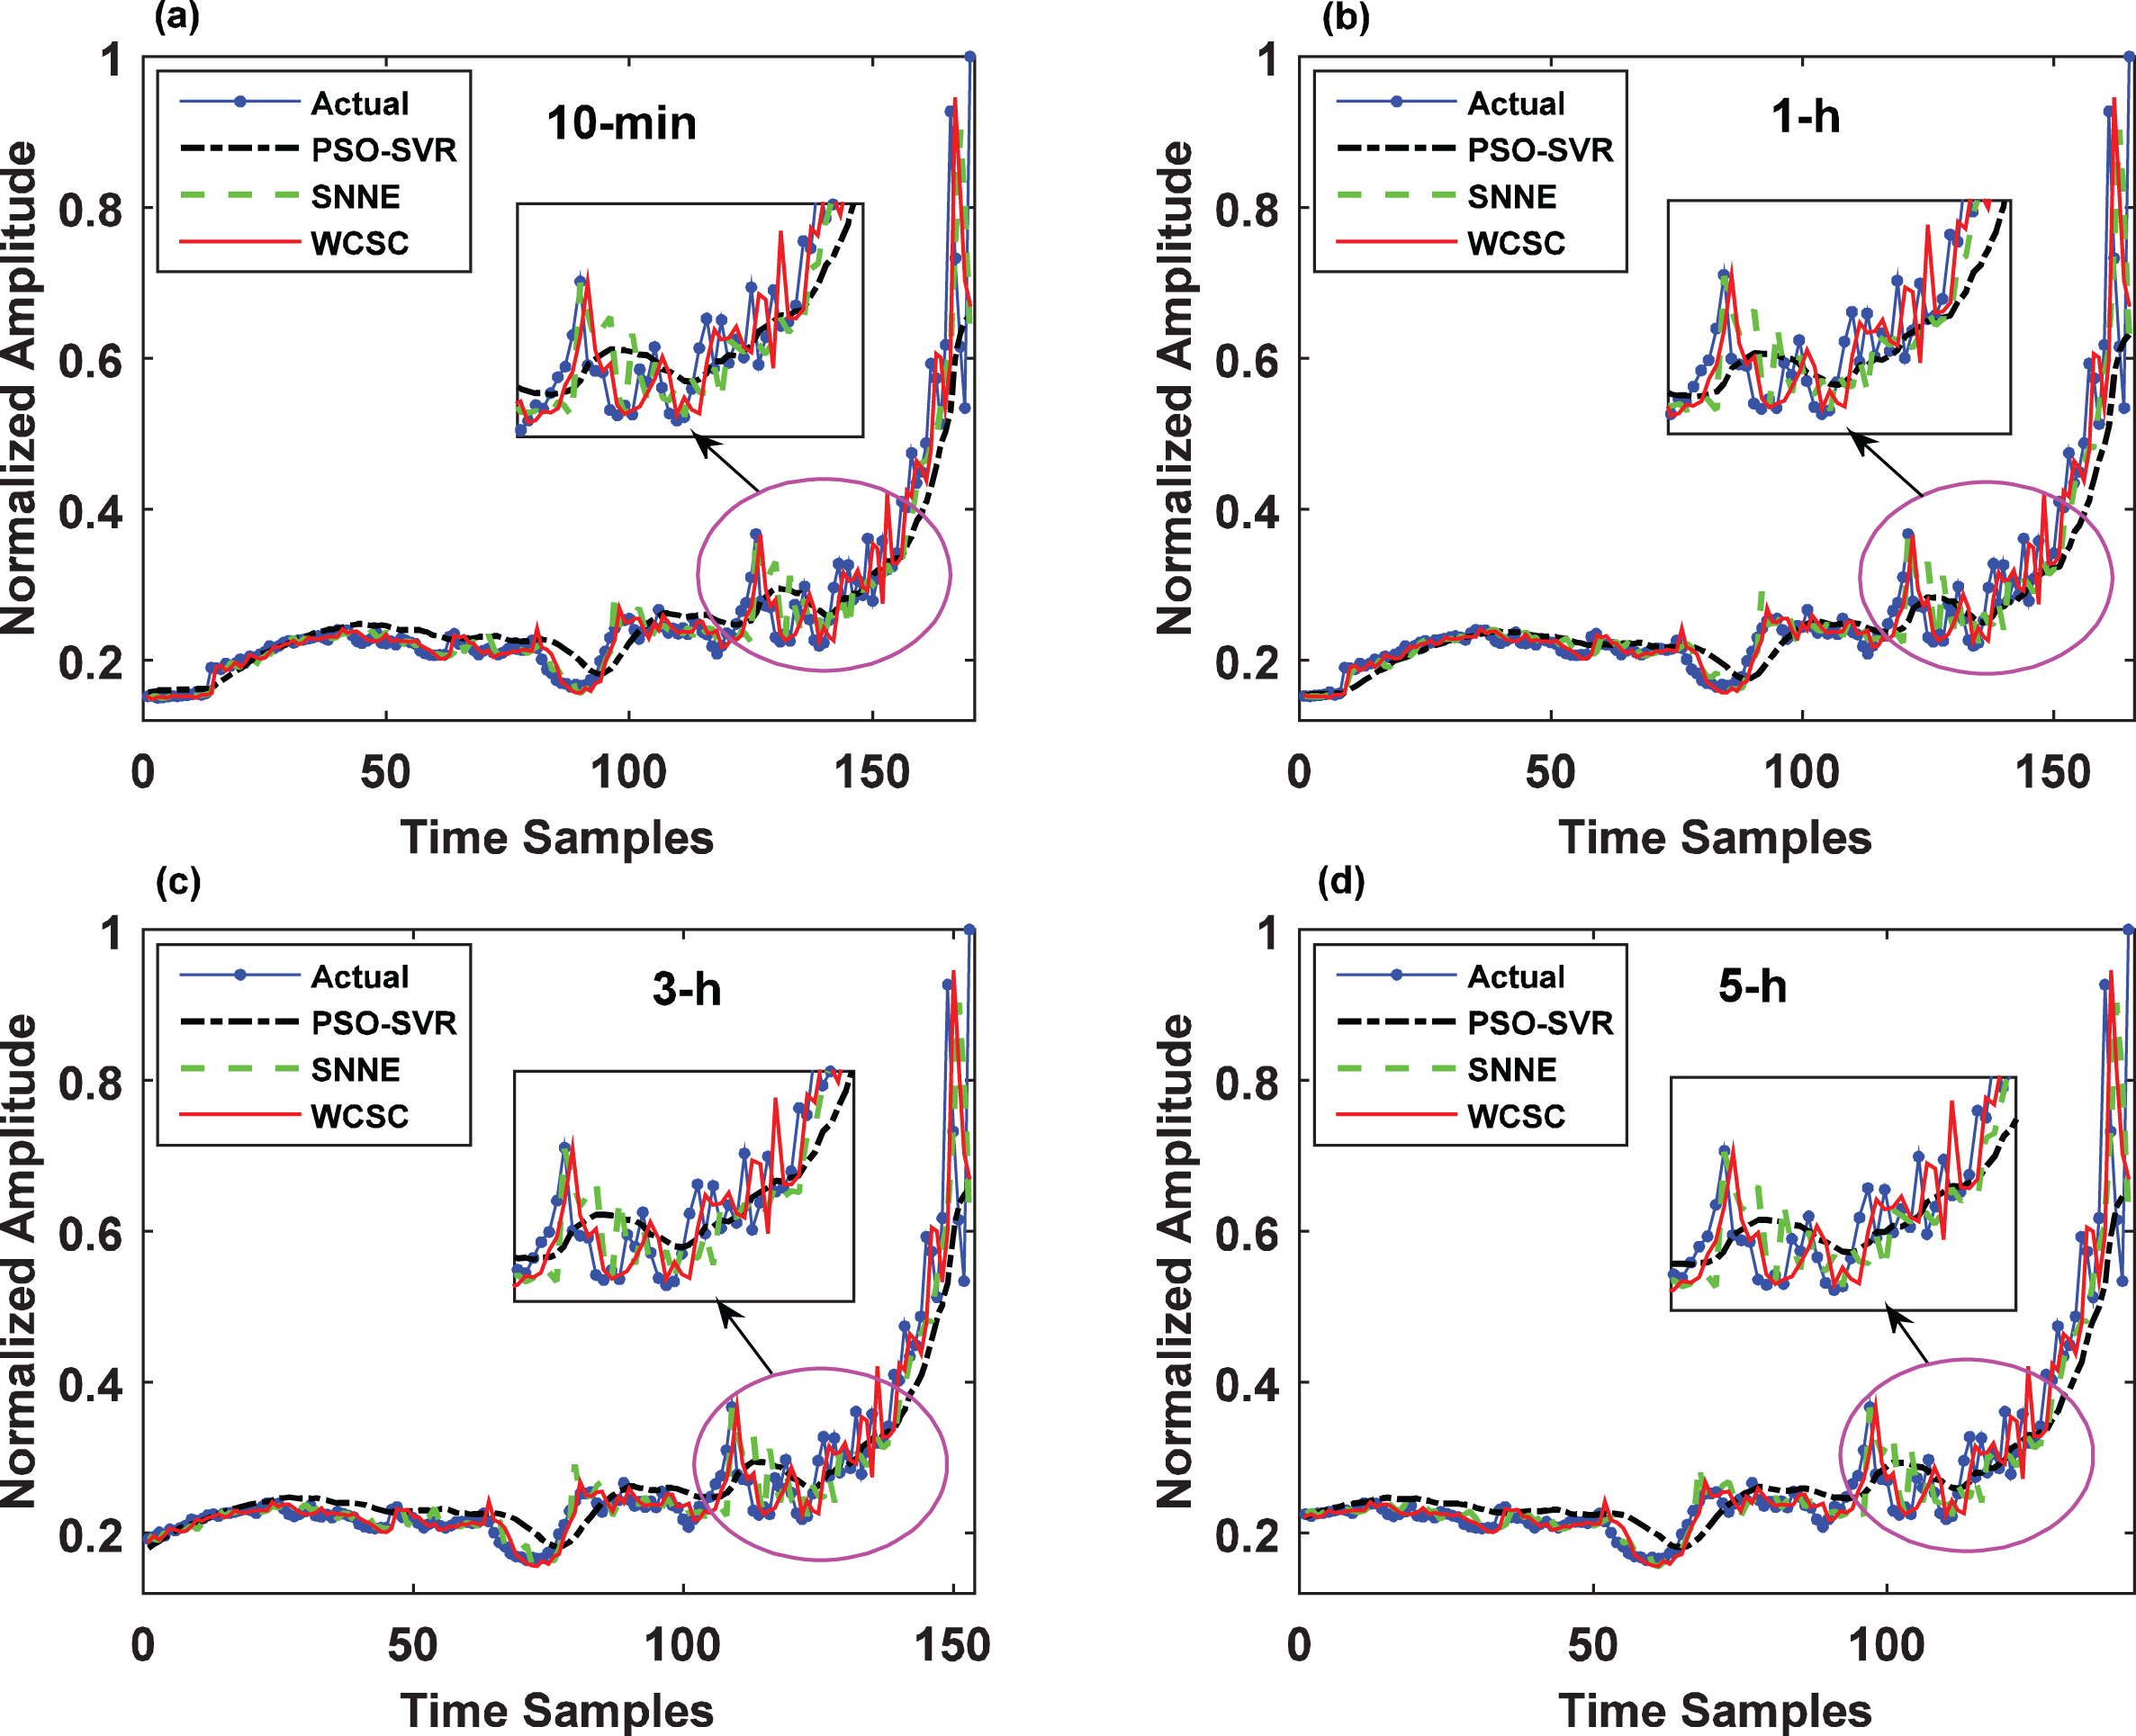
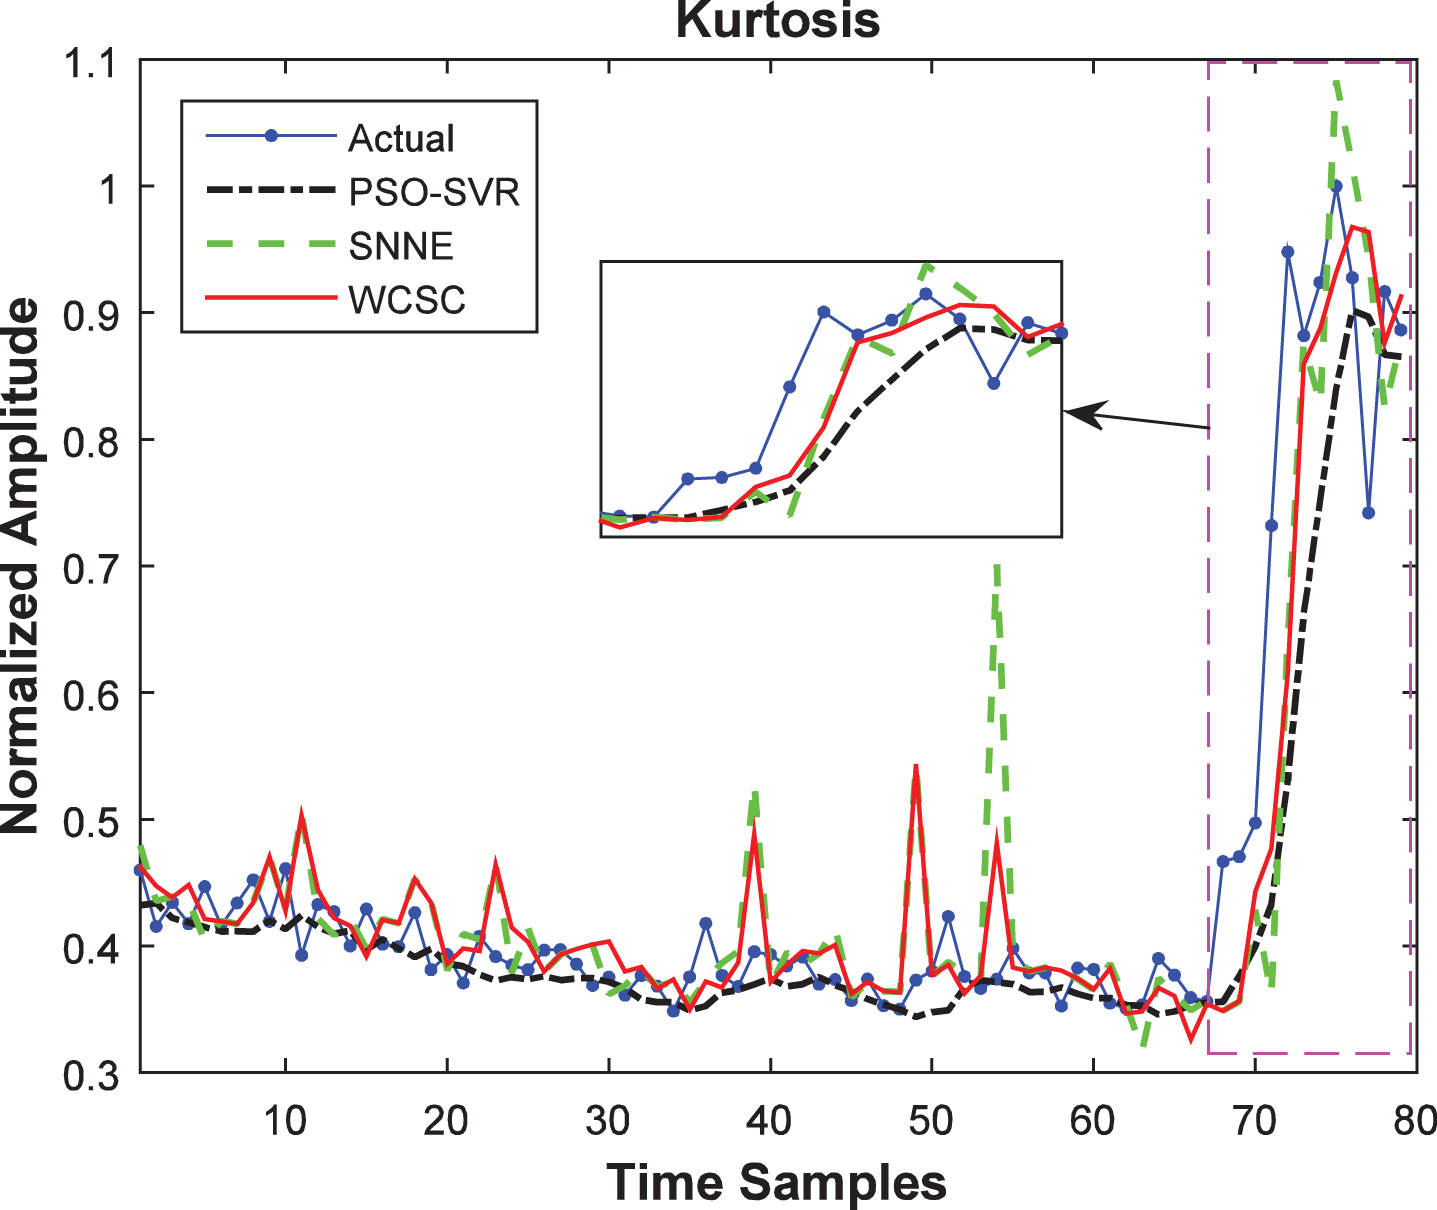
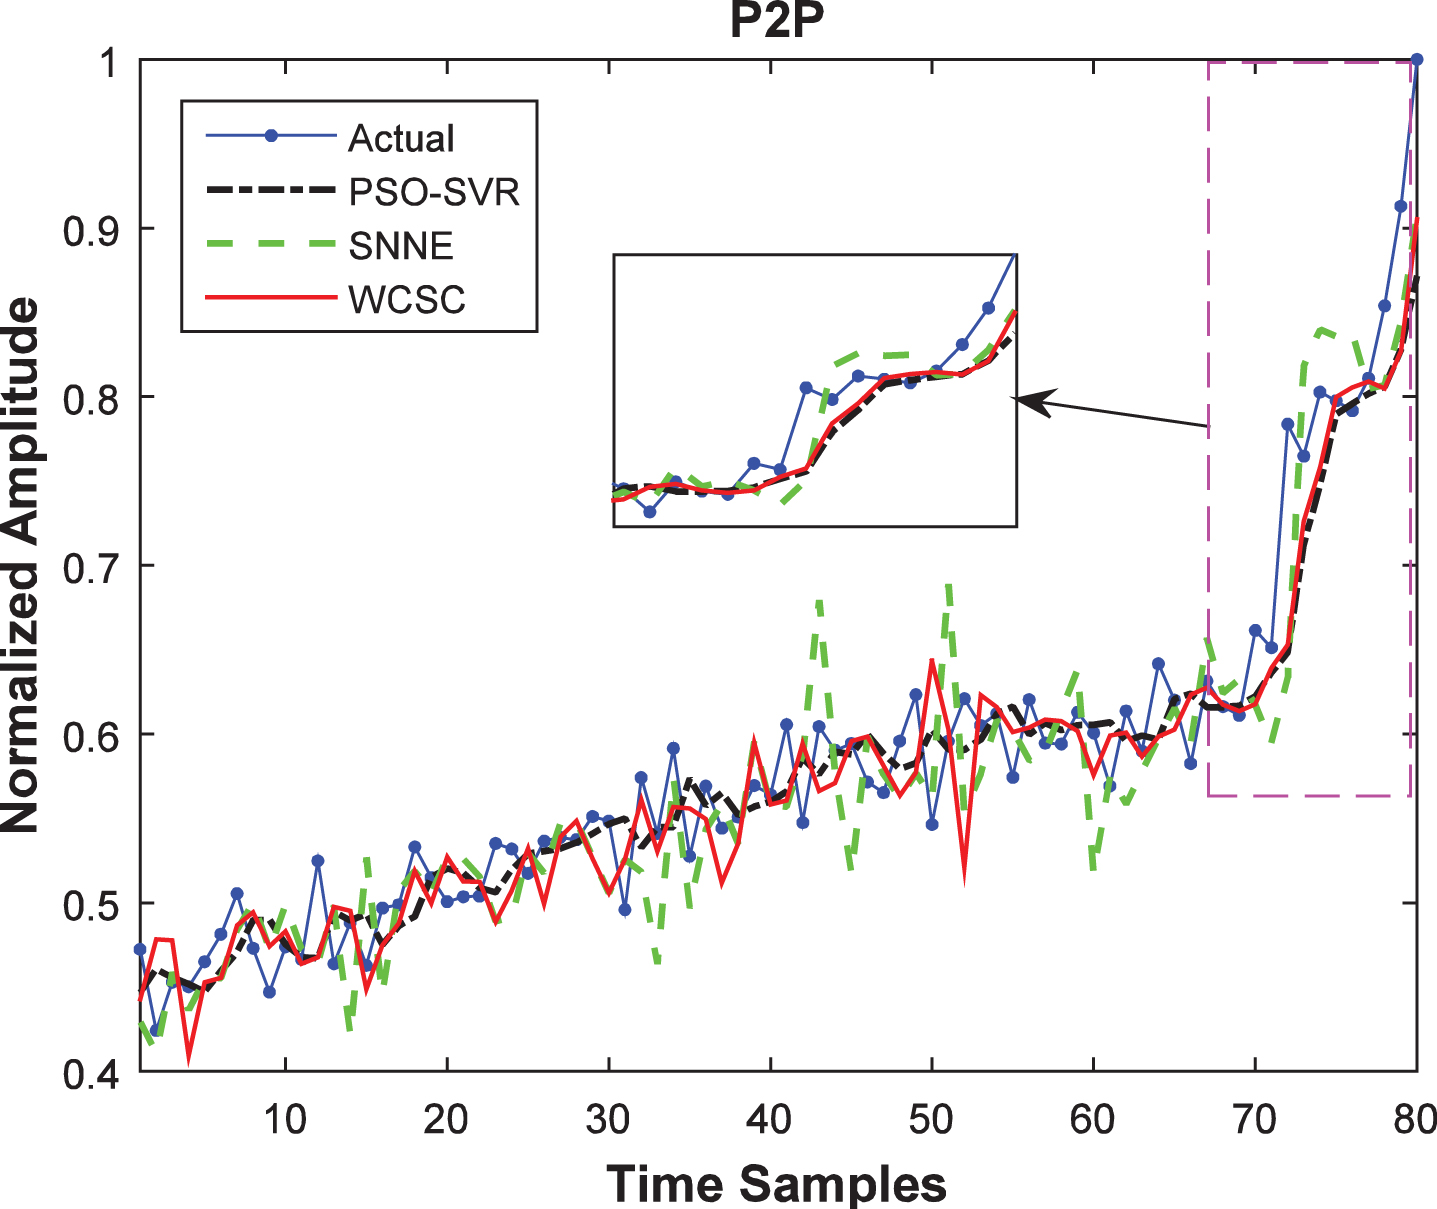
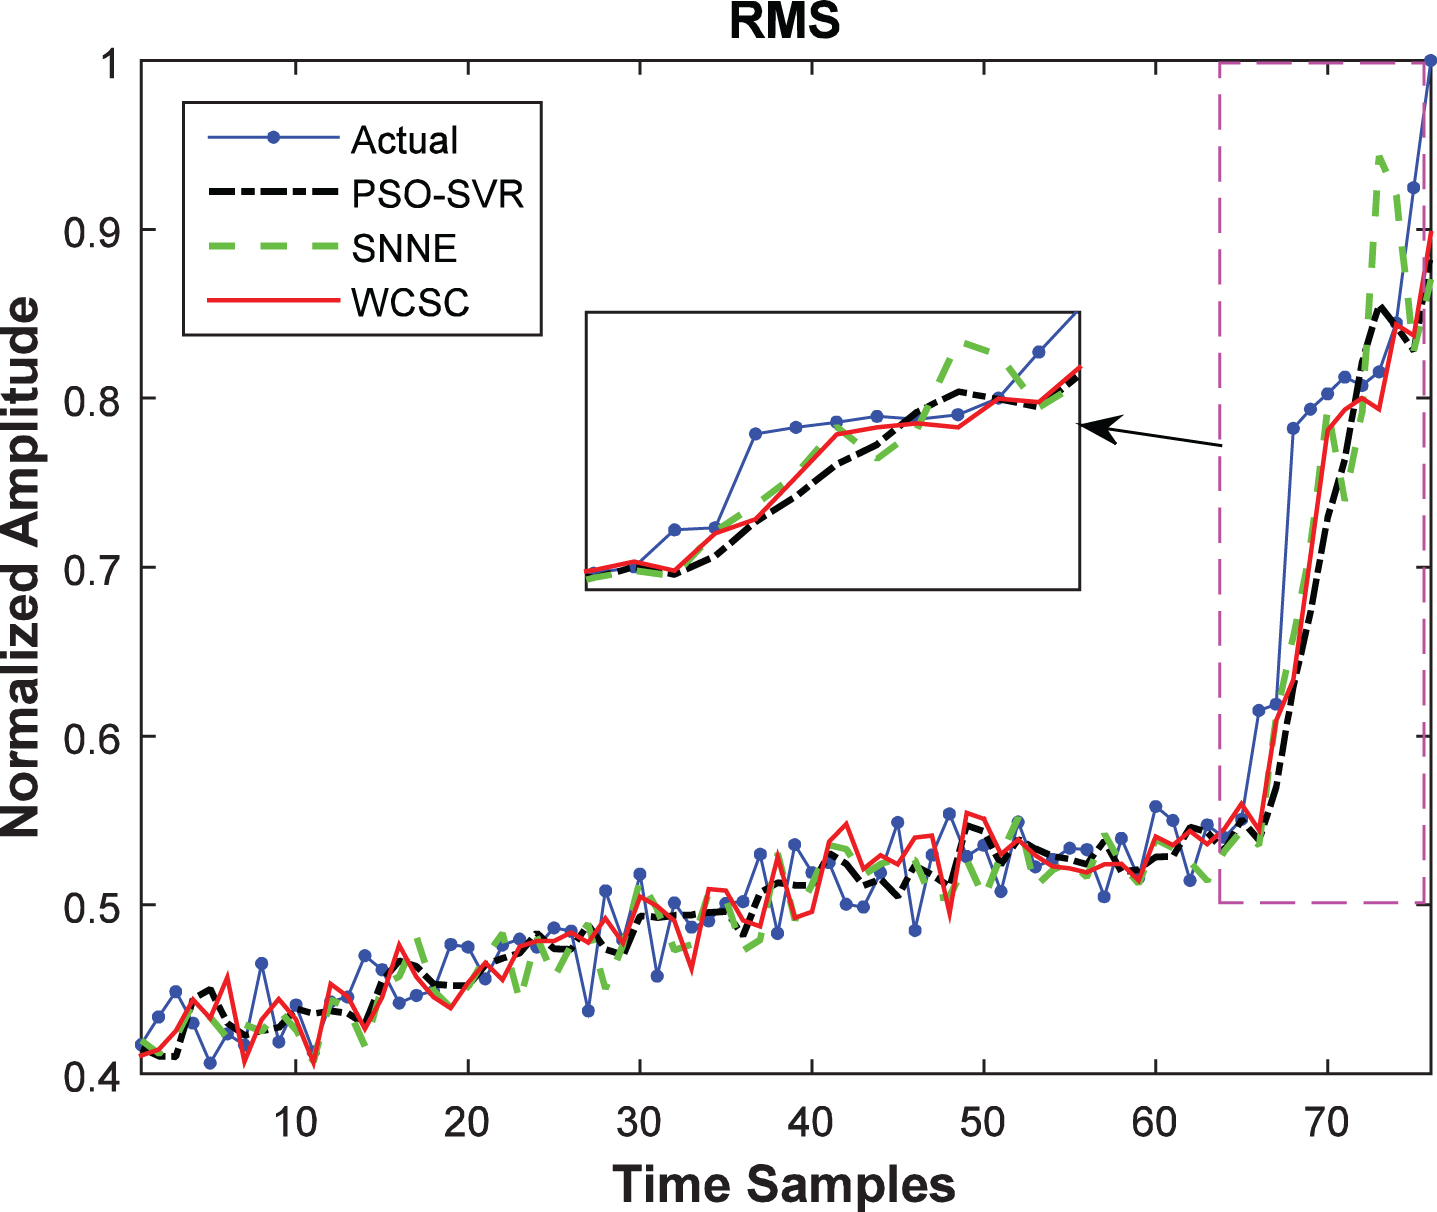
A series of experiments have been carried out to further evaluate the proposed method using different training and testing strategies. All of the data-sets recorded feature values every 10 minutes. Figures 4–6 show the comparison of the actual data and the predicted results of the above mentioned three sets. Four different time scales, that is, 10-min, 1-h, 3-h and 5-h have been used as the prediction step in these experiments. As is shown in these results of the proposed WCSC method are much better than those of SNNE and PSO-SVR. More specially, the enlarged local parts illustrated in Fig. 4 clearly show that the proposed method has its unique advantages in the process of bearing fault deterioration. It can be also seen in the local enlarged figures marked in Figs. 5 and 6 that WCSC also displays the stable predictive performance even in the fault transition phase.
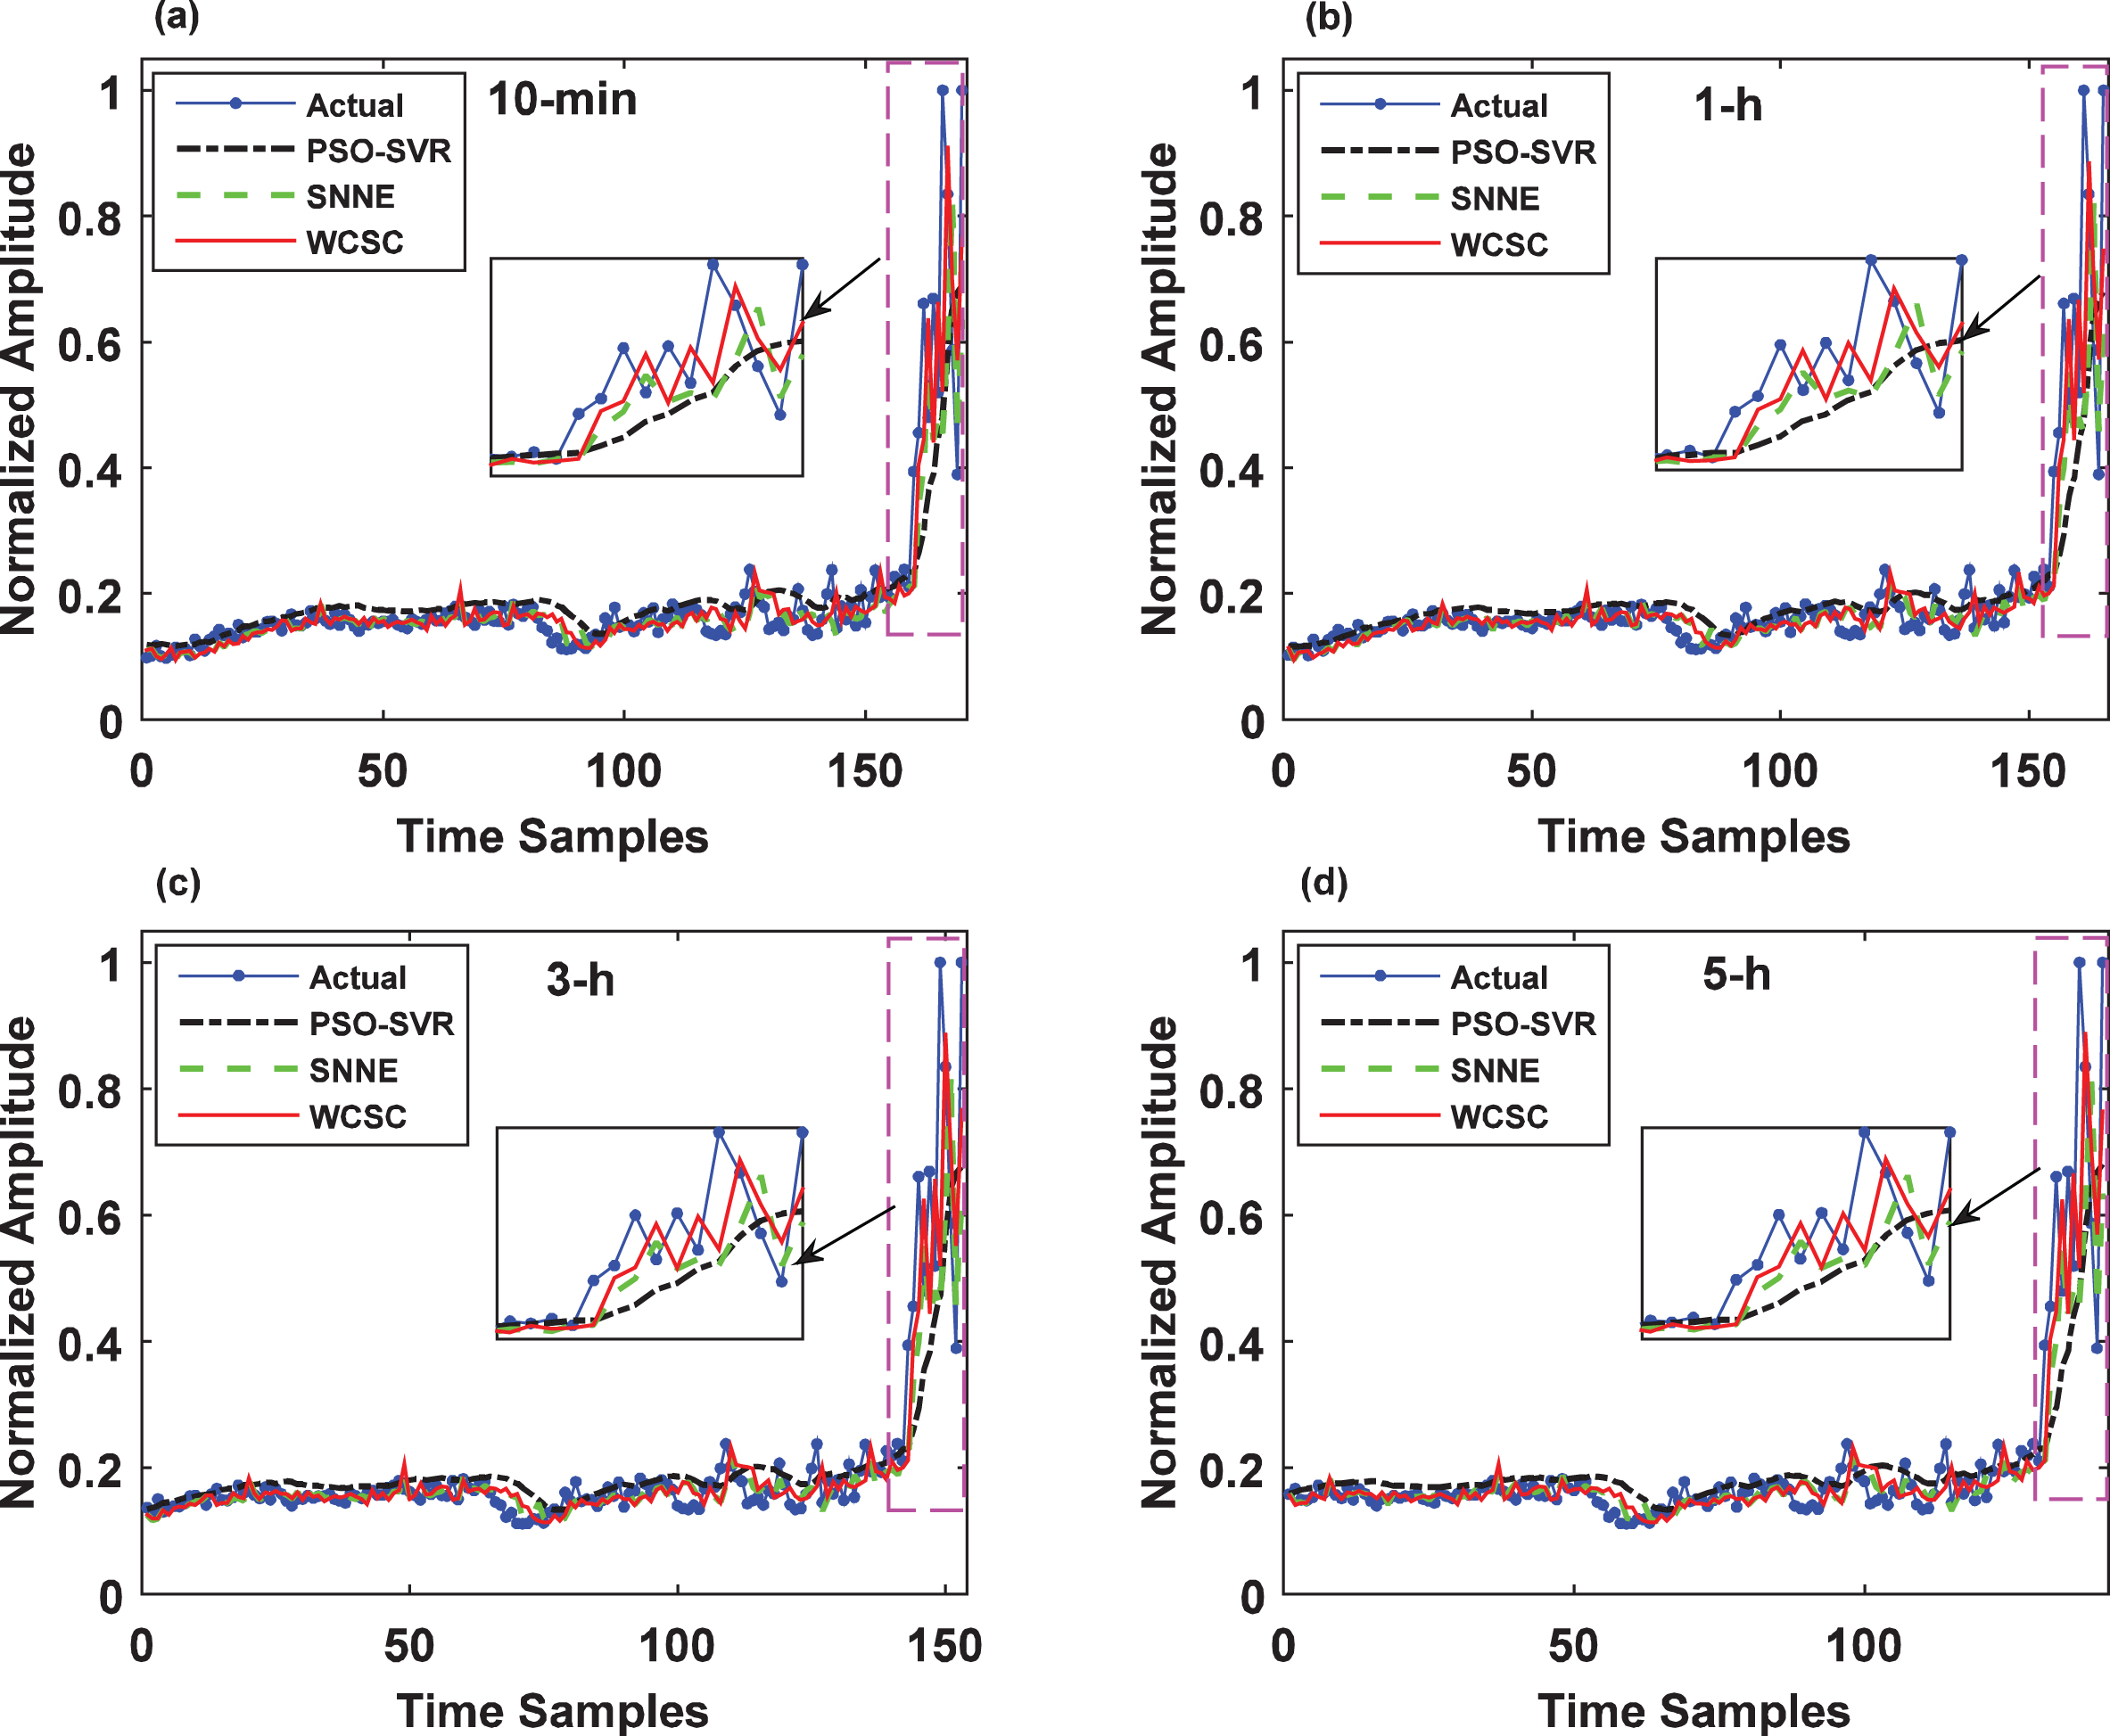
Predicted results of P2P data using three methods and four different time scales.
Predicted results of kurtosis data using three methods and four different time scales.
Results of RMS data using three methods for four different time scale predictions.
Tables 2–4 summarize results of NMSE for P2P, RMS and kurtosis feature sets, respectively. It has been demonstrated that WCSC outperforms the other two methods (SNNE and PSO-SVR) for the fault prediction, except for the 33- and 67-h training data. The reason is that the training data is not enough for WCSC. Nevertheless, for RMS and kurtosis signature sets, results of WCSC are always better than SNNE and PSO-SVR. It is noted that the SC technique has obvious advantages over traditional machine learning methods like PSO-SVR.
Introduction to the experimental system and vibration data
NMSE of Three methods with four different time scales on P2P feature set
NMSE of Three methods with four different time scales on P2P feature set
NMSE of three methods with four different time scales on RMS feature set
NMSE of three methods with four different time scales on kurtosis feature set

Overview of the experimental system.
The experimental data was provided by the IEEE Reliability Society and the Franche-Comté Electronics Mechanics Thermal Science and Optics-Science and Technologies (FEMTO-ST) Institute [4]. The experimental system is illustrated in Fig. 7. Type of the tested bearings is NSK 6804RS. In order to conduct accelerated degradation testing for bearings, a horizontal force that equals to the bearings’ maximum dynamic load 4000 N was applied to the tested bearings. The rotating speed was set to 1800 r/min. The load and the speed were accurately controlled by the pressure regulator and the speed controller of the motor, respectively. The load and speed were both kept constant in the experiments. Therefore, influences of their variations on the RUL prediction can be ignored in this paper [26]. The sampling frequency was 25.6 kHz, and 2560 samples were recorded every 10 seconds. In order to avoid damages to the test-rig, the end-of-life time was determined when the amplitude of the acquired vibration signal magnitude exceeded 20 g.
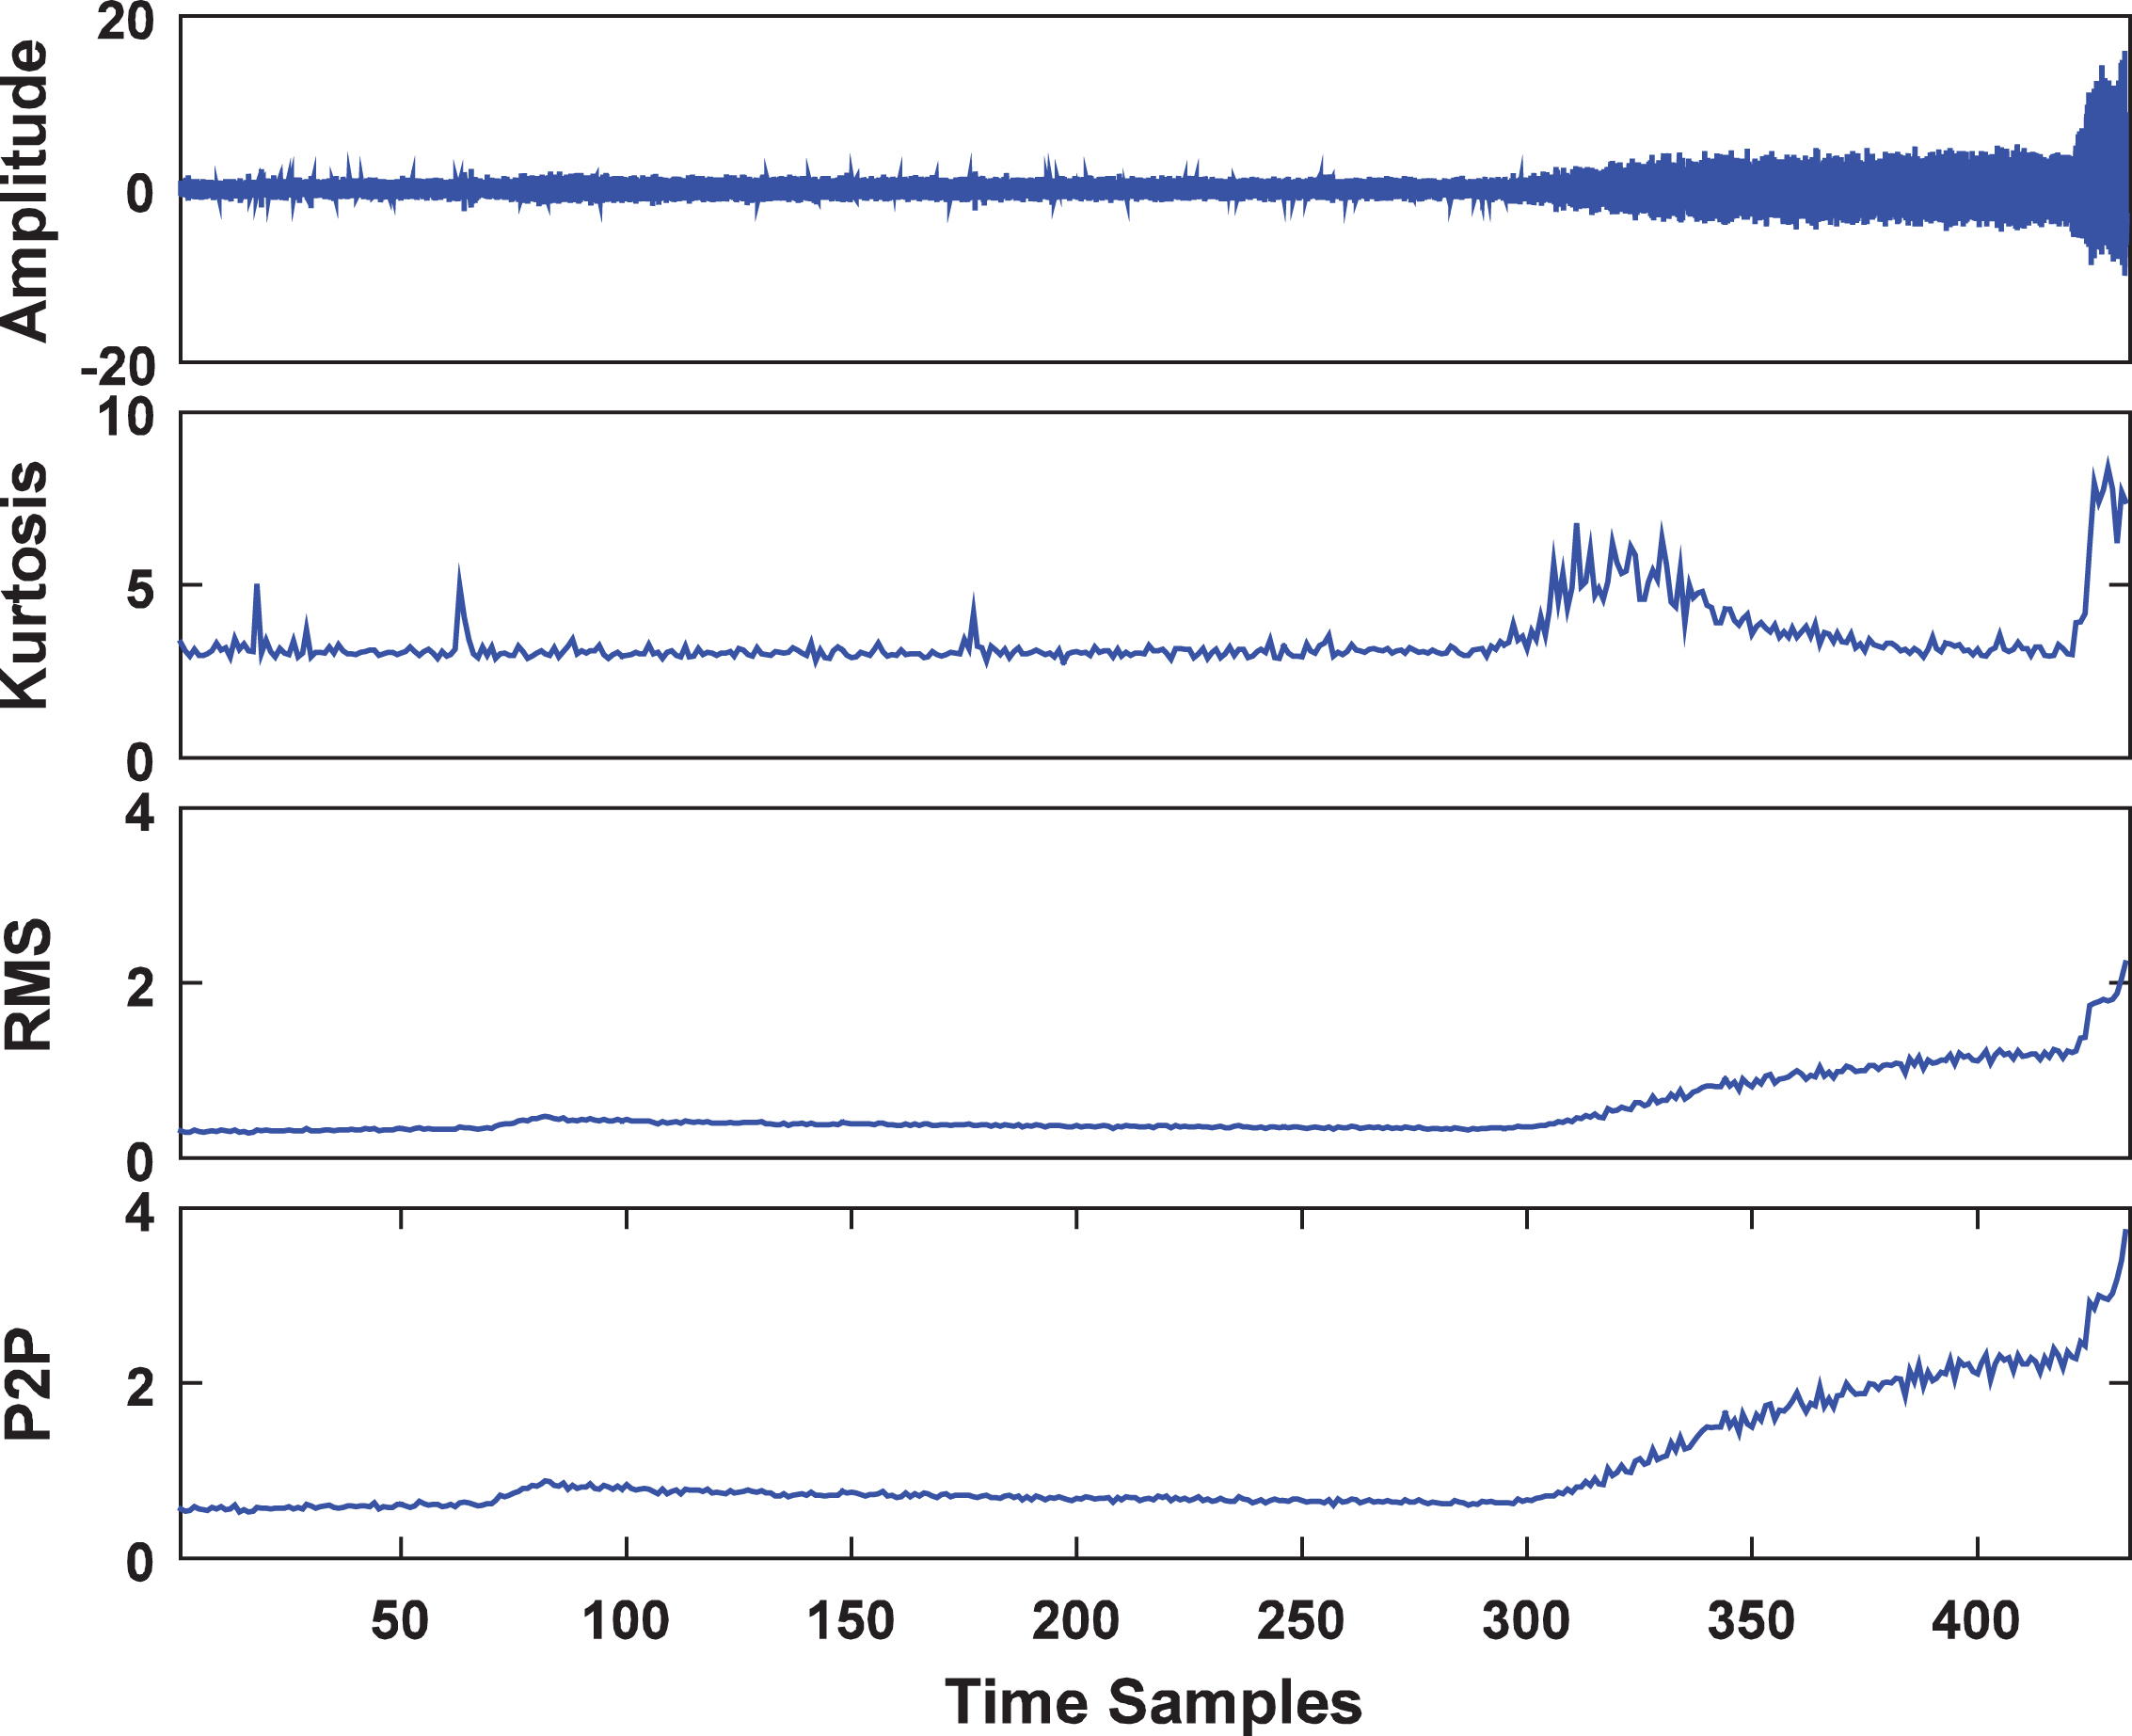
The temporal vibration signal of data Bearing1_7 (Top) followed by three features.
The temporal vibration signal of data Bearing3_3 (Top) followed by three features.
Bearings of these three operations were separately tested 7, 7 and 3 times. Thus, those recorded data are named as Bearing1_1 to Bearing1_7, Bearing2_1 to Bearing2_7 and Bearing3_1 to Bearing3_3, respectively [27]. The first two data sets in every group were regarded as the training set and the others were used as the testing sets. Figures 8 and 9 show the original vibration signal and its three feature sets of Bearing1_7 and Bearing3_3. It can be seen that the amplitude of vibration signals rises along with the degradation of the bearing performance.
Description of all the datasets
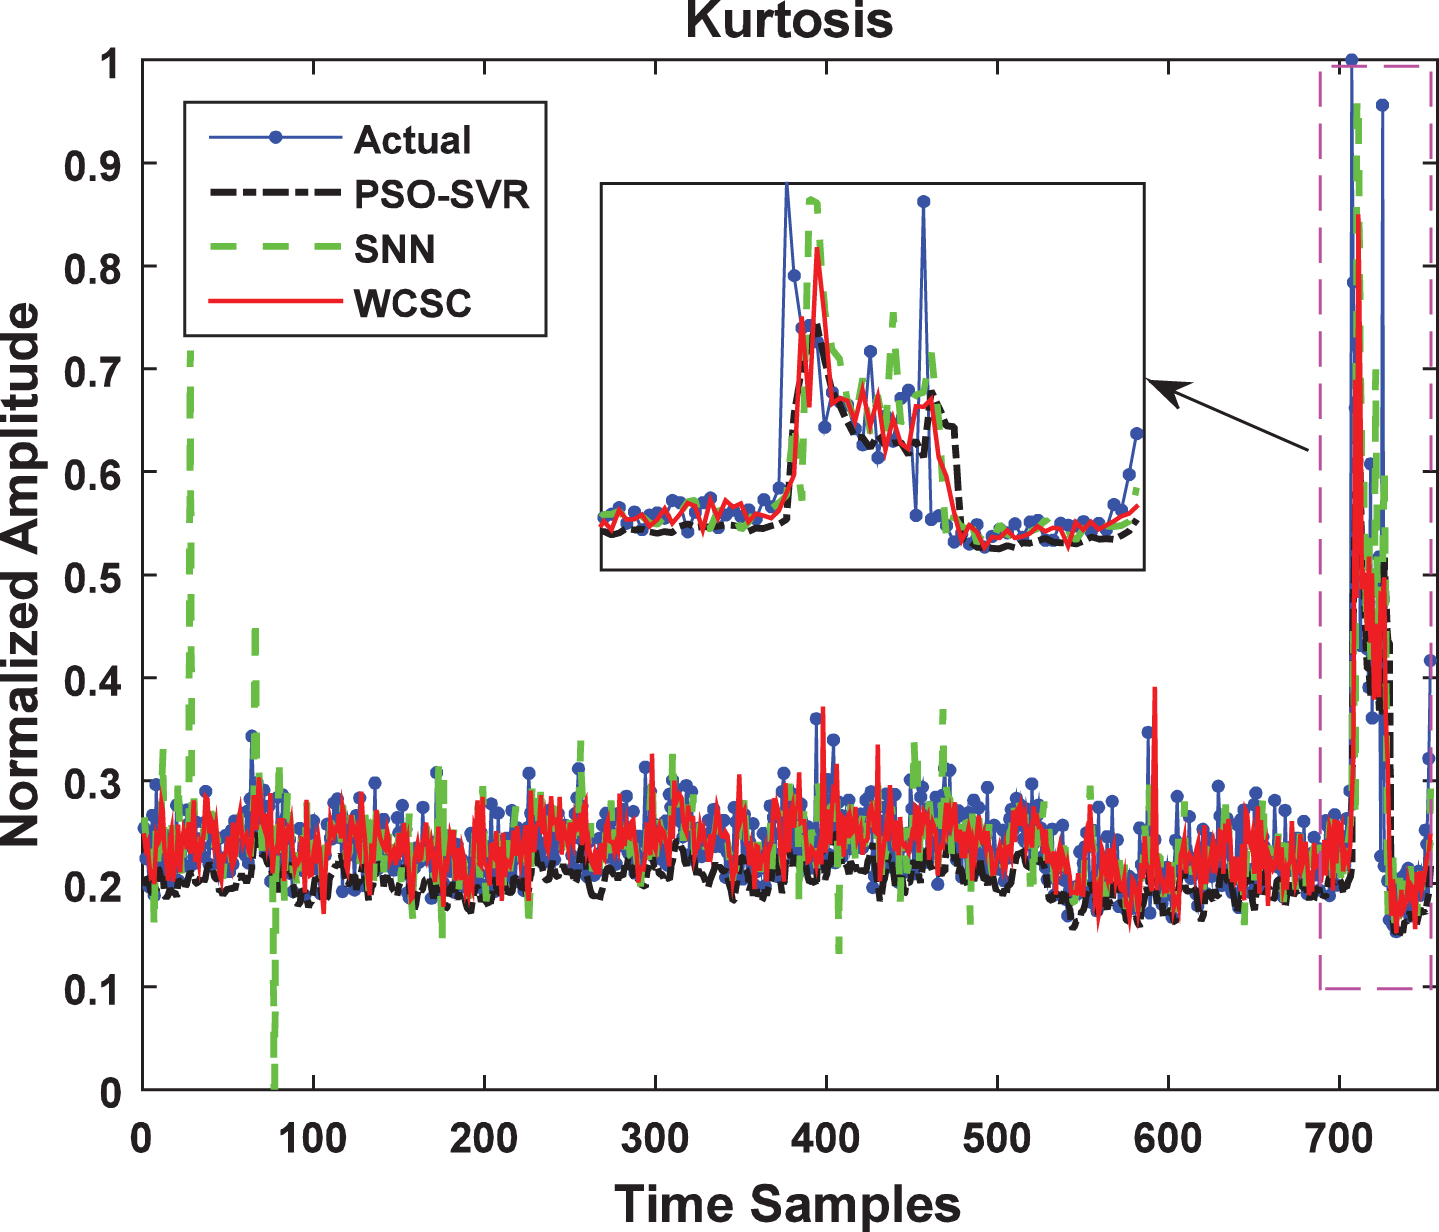
Results of kurtosis feature of the data Bearing1_7 using three methods.
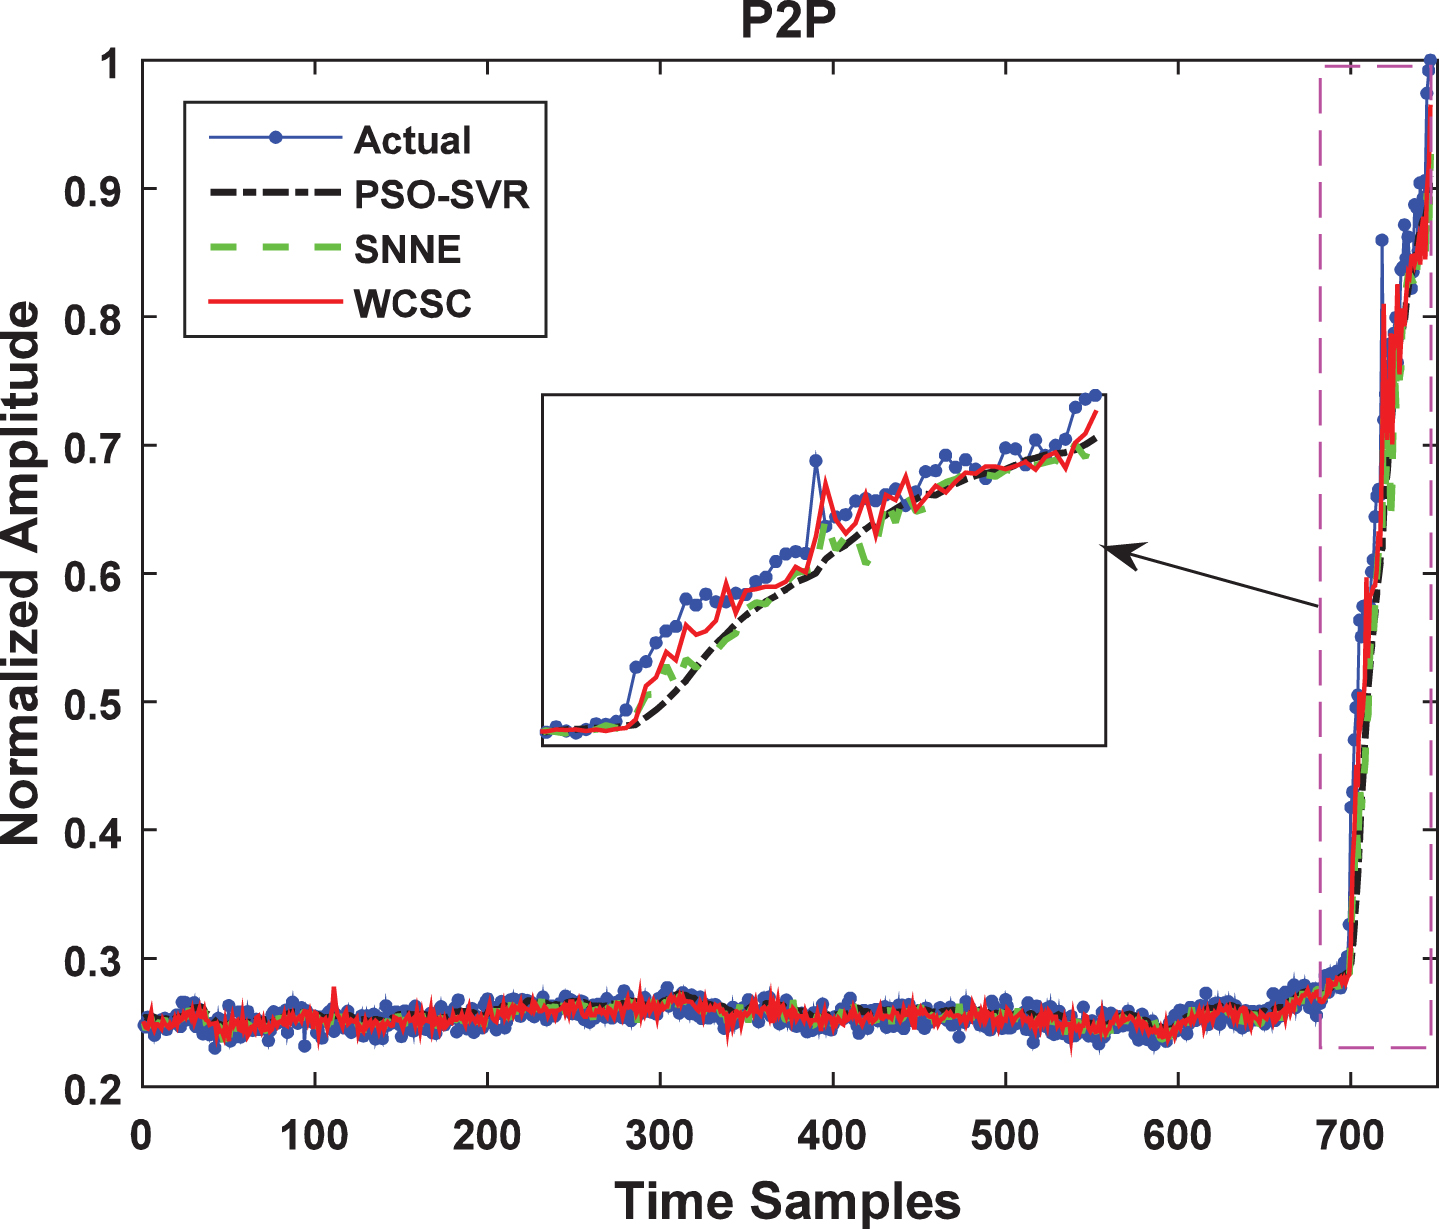
Results of P2P feature of the data Bearing1_7 using three methods.
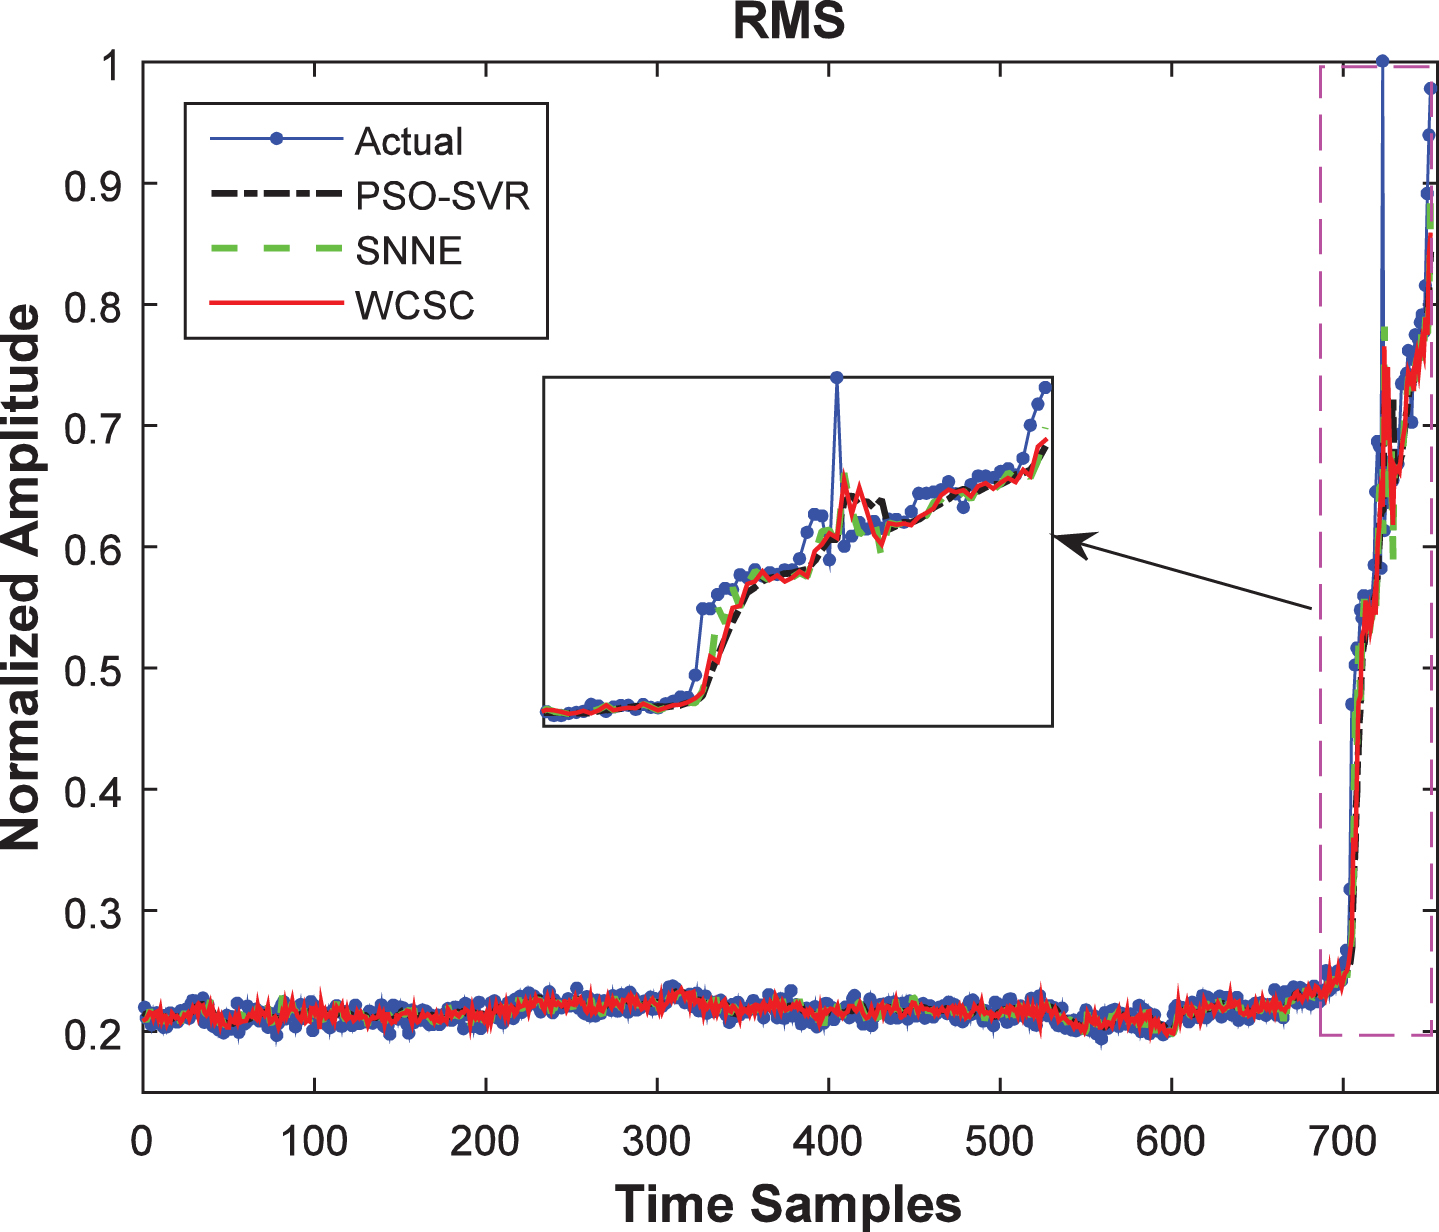
Results of RMS feature of the data Bearing1_7 using three methods.
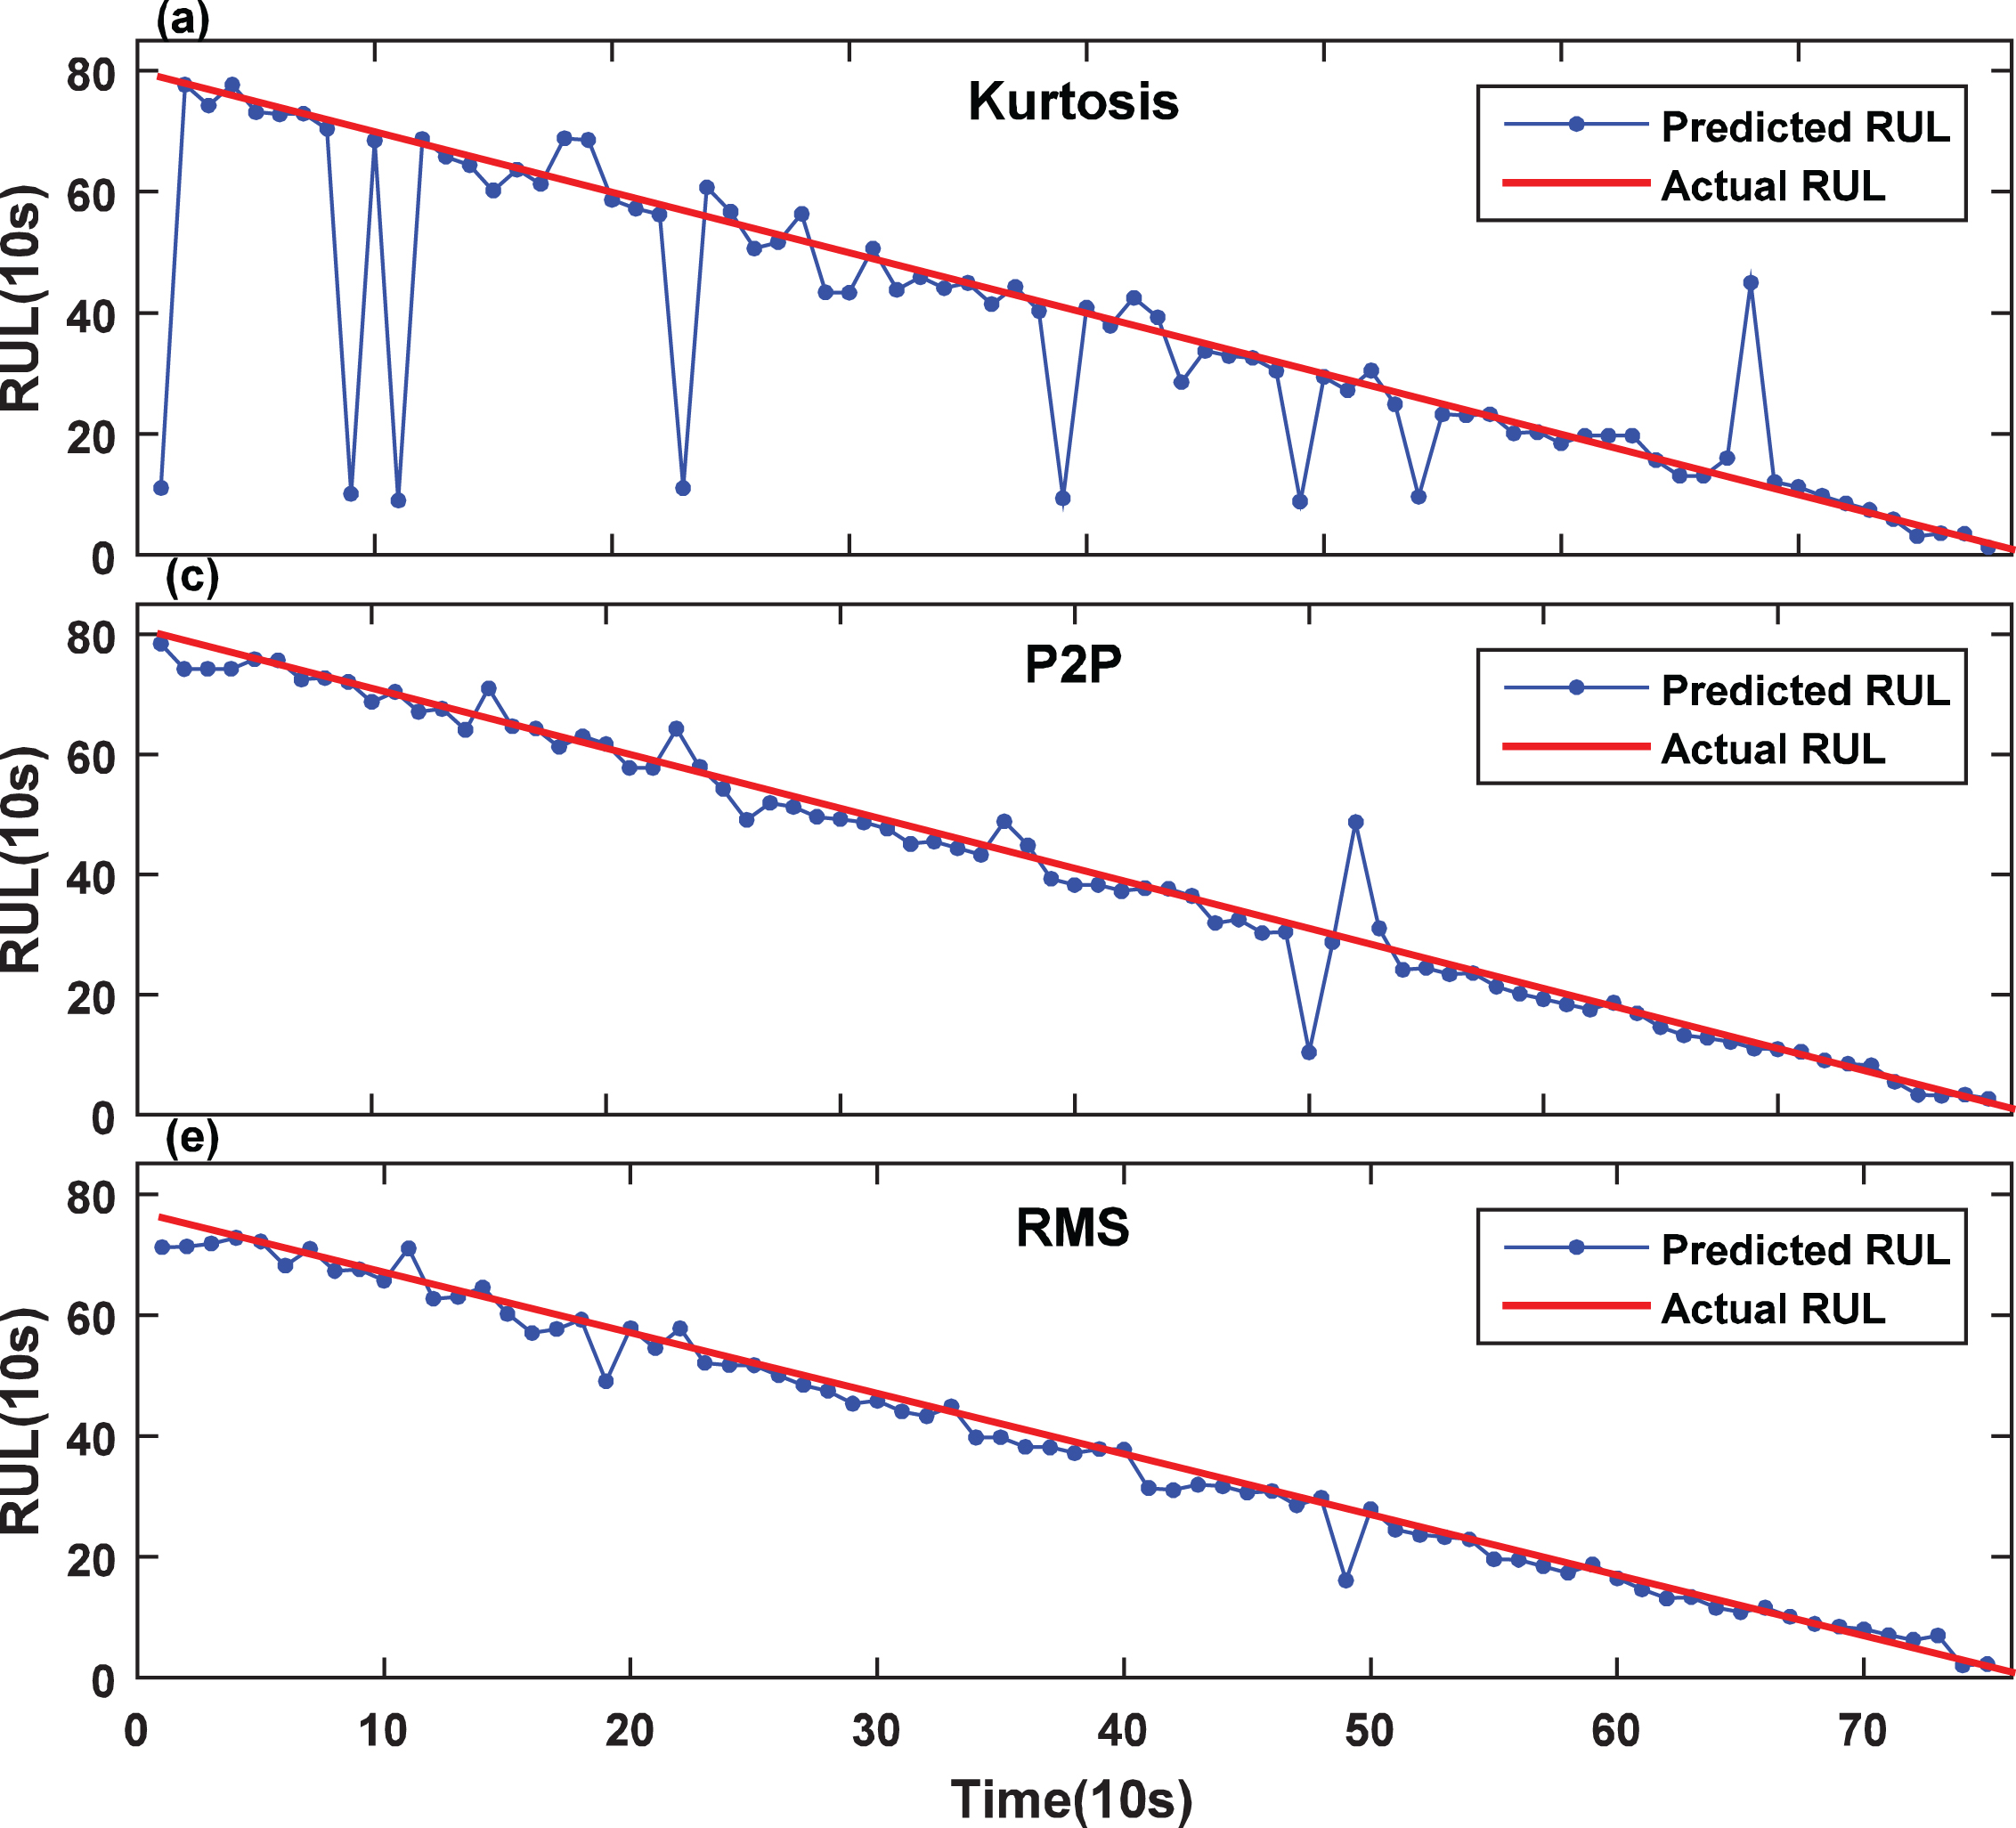
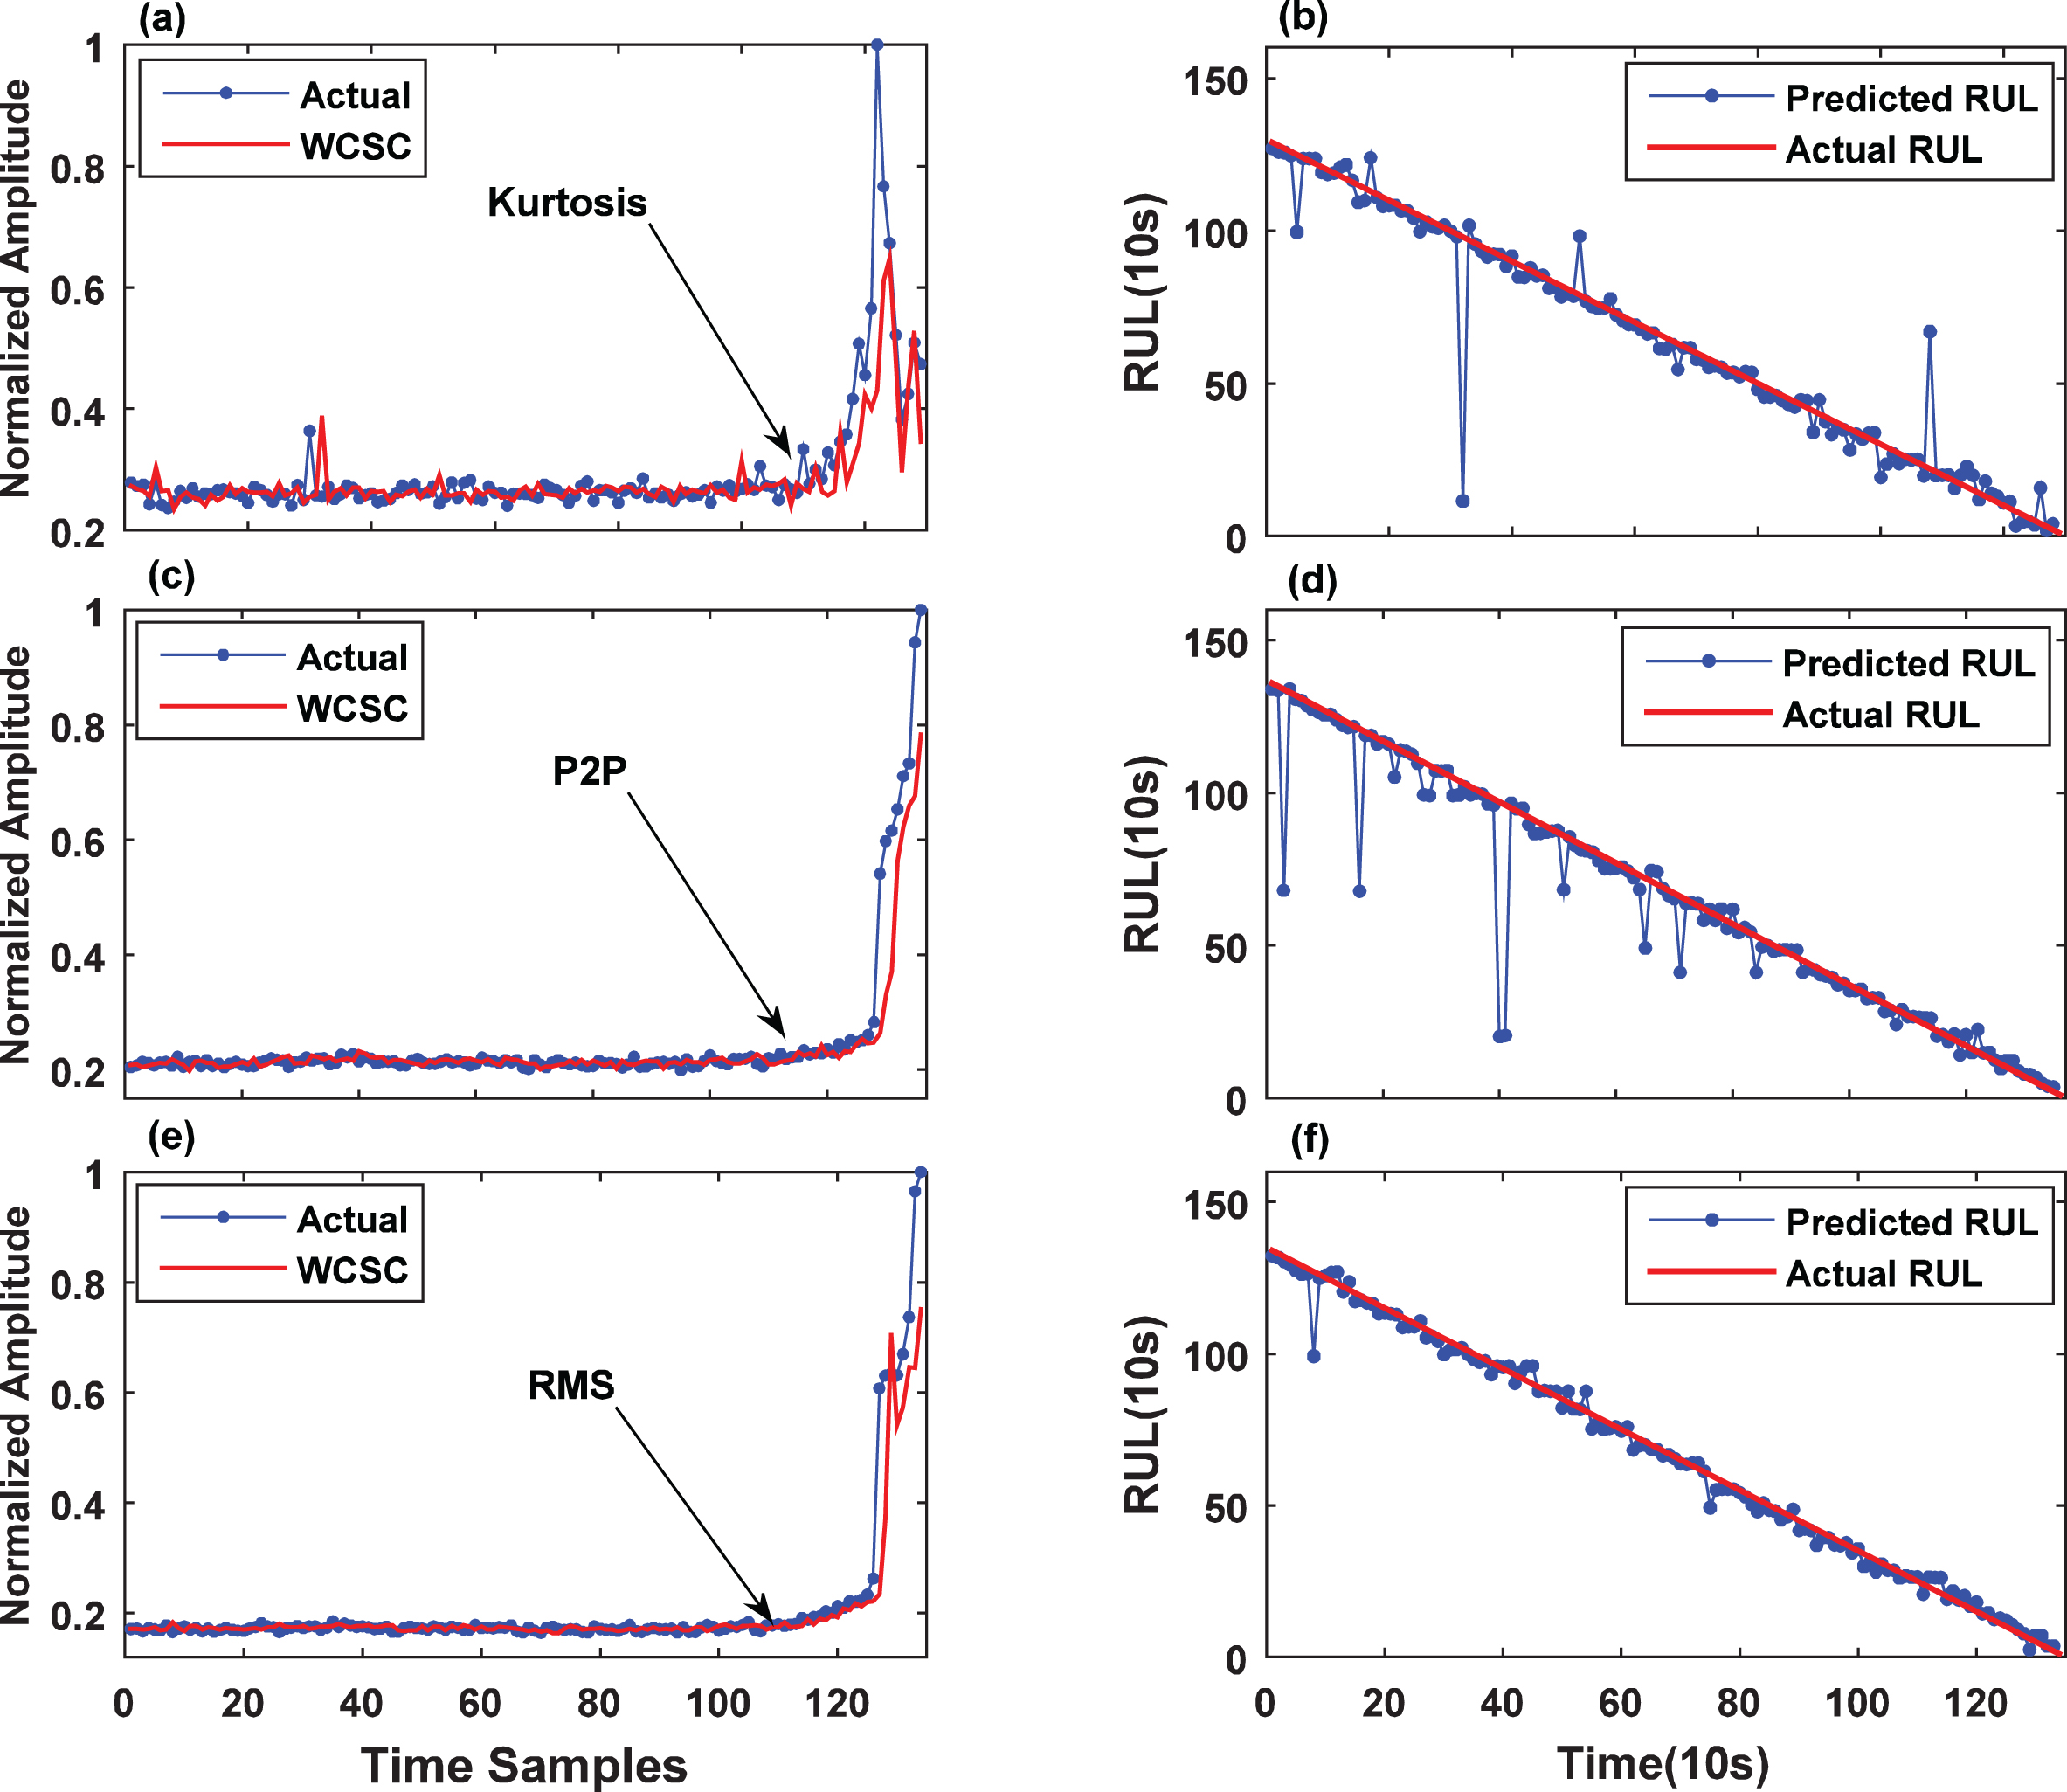
In this experiment, all the training data and test data are shown in Table 5. Figures 10–12 show the actual trends results of three feature sets for Bearing1_7, respectively. RUL prediction results of Bearing1_7 with three features are given in Fig. 13. Similarly, Figs. 14–16 separately show the actual trends results of three feature sets for Bearing1_7. Bearing3_3 and Bearing2_4. RUL prediction results of Bearing3_3 with three features are given in Fig. 17. It can be seen that the proposed method not only well predicts the failure trend but also has a good robustness. Bearing RUL can be well predicted using three features. However, prediction results using RMS feature is much better than those achieved using P2P and kurtosis features. Figure 18 shows the fault trend prediction and its RUL results of the data Bearing2_4.
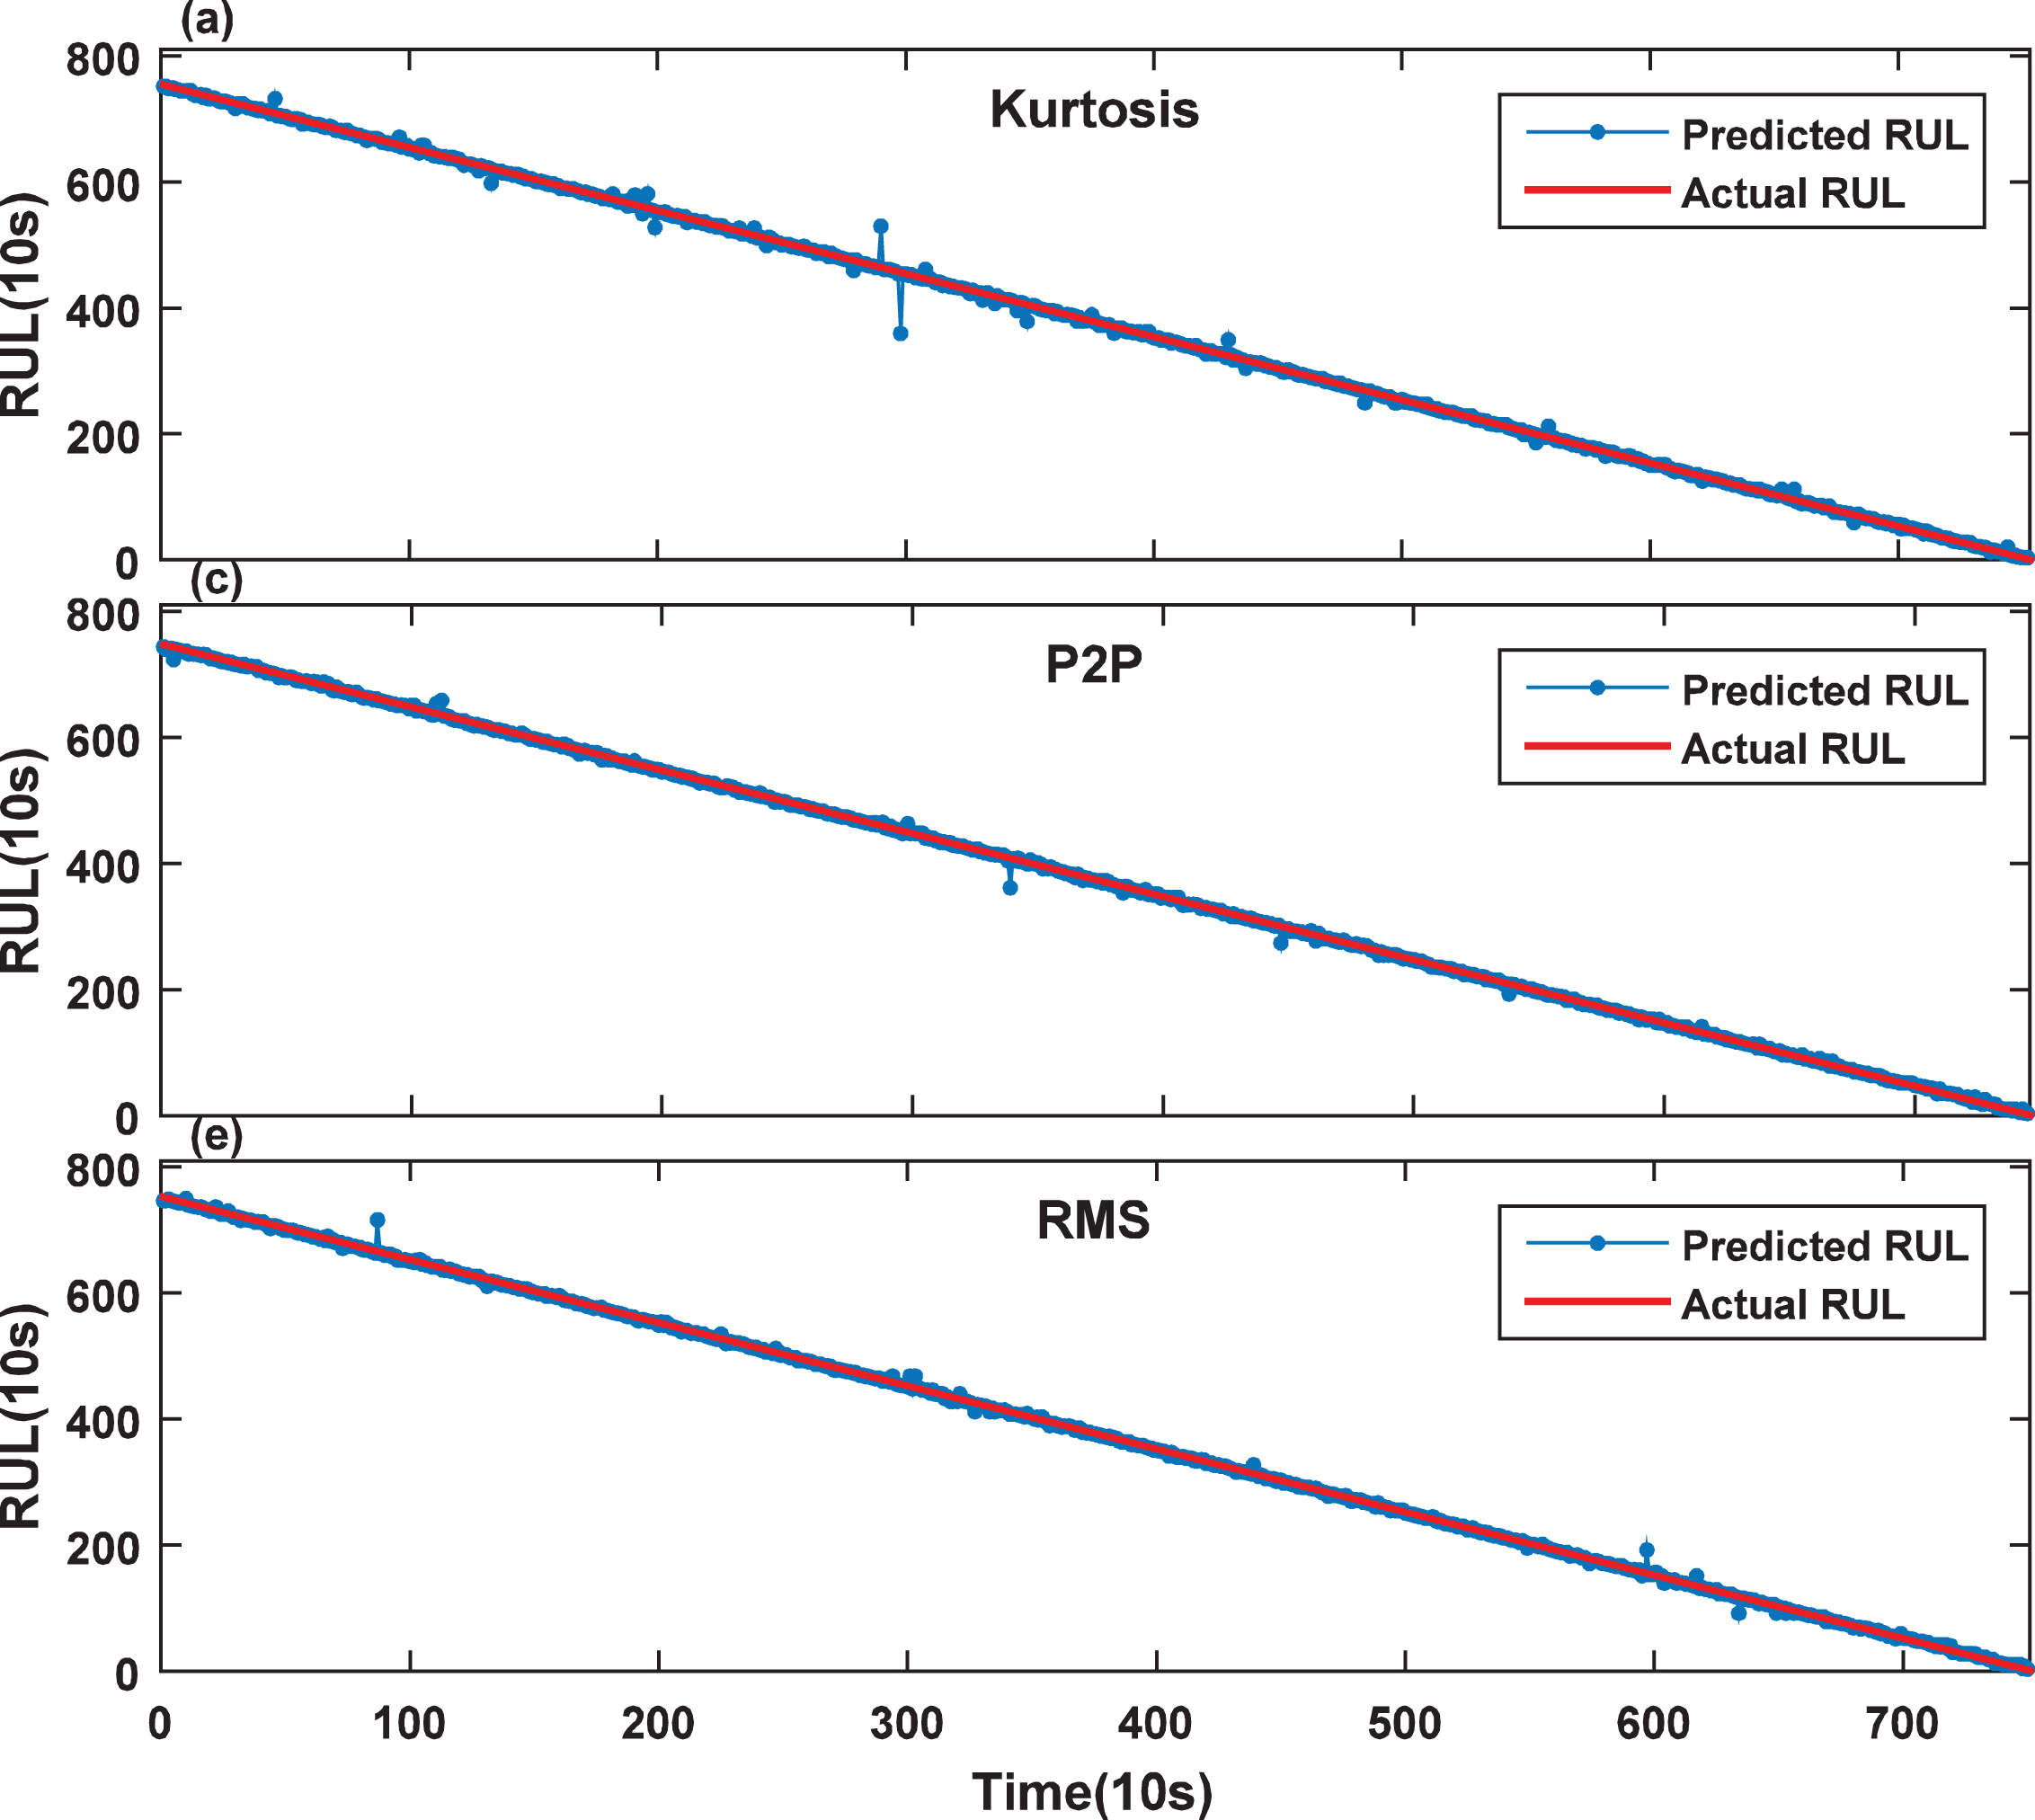
The RUL prediction results of three features of the data Bearing1_7 using WCSC.
The comparison of three models of Bearing3_3 on Kurtosis Data.
The comparison of three models of Bearing3_3 on P2P Data.
The comparison of three models of Bearing3_3 on RMS Data.
The RUL prediction results of the data Bearing3_3 using three features and WCSC.
Results of the predicted trend and RUL of data Bearing2_4 using three features and WCSC.
A series of experiments have been carried out to further evaluate the proposed method using different bearing dataset. All of the data-sets are used to record feature values in 10-second intervals. Figures 10–12 show the comparison of the actual data and the predicted results of the above mentioned three features of the Bearing1_7 dataset. As is shown in Fig. 10, results of the WCSC and the PSO-SVR are both much better than those of the SNNE. However, the result of our method shown in the enlarged local part has the best performance. It can be seen in Figs. 11 and 12 that results of the proposed method and SNNE are relatively similar and are both much better than that of the PSO-SVR. WCSC is still superior to the SNNE as is illustrated in local enlarged figure. The RUL prediction results of three features are shown in Fig. 13. It is seen that the results of RUL prediction almost coincide with actual RUL, but RMS has the better performance. Simultaneously, the RUL prediction result of data Bearing3_3 with RMS feature is also better than P2P, as is shown in Fig. 17. This implies that RMS are much more suitable for RUL prediction than kurtosis and P2P. This observation can be also found in the RUL prediction result of data Bearing2_4, as is illustrated in Fig. 18.
The comparison of NMSE results using three methods for all datasets
The comparison of NMSE results using three methods for all datasets
Moreover, it can be clearly seen in Figs. 14–16 that proposed WCSC method has the best results in comparison with PSO-SVR and SNNE methods. More specially, the prediction results of PSO-SVR shown in Fig. 15 shows a better performance than that of WCSC for the stationary stages. However, WCSC has its unique advantage when the fault became seriously shown in local enlarged part of Fig. 15. These results show the proposed model has good performance in RUL prediction of bearing.
In order to further verify the robustness of the model, all of the datasets given in Table 5 were used for demonstration its validations. Results of three datasets are illustrated in Table 6 where we can find that the proposed model has the lowest NMSE for the majority of datasets. For example, the best results of NMSE can be obtained using the proposed WCSC method for seven bearing datasets among them, while PSO-SVR only achieves the best result for the dataset Bearing1_3 and SNNE get the best results for the last three bearing datasets. For the P2P feature, WCSC shows the best results of NMSE of six bearing datasets, while PSO-SVR and SNNE can only get their corresponding best results for some of bearing datasets. As for RMS metrics, it is still clearly revealed that the proposed approach almost achieves good results for all bearing datasets. In general, most of results of NMSE for all bearing time-domain features sets achieved using the proposed method show the best performances in comparison with PSO-SVR and SNNE techniques. Thus, it is demonstrated that the proposed sparse coding based prediction method exhibits better robustness than PSO-SVR and SNNE for bearing fault prediction. These experiments further verify the WCSC technique has obvious advantages over traditional machine learning methods. Hence, the proposed WCSC method is much more suitable for bearing fault trend prediction.
A RUL prediction method is proposed for rolling element bearing of rotating machine based on the proposed WCSC technique and the sparse linear AR model. The main advantage of the proposed approach is that it does not require any training, which is very suitable for practical applications. Moreover, fault trend of rolling bearing is indicated via three time-domain metrics, that is, RMS, P2P and kurtosis. Data collected from two different bearing run-to-failure test-rigs is used to evaluate its performances. Results show that the proposed method is much more effective for three time-domain features with one-step-ahead prediction, compared with SNNE and PSO-SVR methods. The results from two cases also demonstrate the good robustness of the proposed method. Moreover, remaining useful life (RUL) of bearing can be also further computed based on the predicted fault trend.
Moreover, it should be noted that the proposed method is able to be adjusted to different operation conditions benefited from the WCSC algorithm.
Footnotes
Acknowledgments
The financial sponsorship from the project of National Natural Science Foundation of China (51475098 and 61463010) and Guangxi Natural Science Foundation (2016GXNSFFA380008) are gratefully acknowledged. It’s also sponsored by Guangxi Key Laboratory of Manufacturing System & Advanced Manufacturing Technology (1514030001Z, 1638012004Z) and Innovation Project of Guangxi Graduate Education (YCSW2017136).