
Abstract
In the interest of the hybrid electric vehicle(HEV) real-time road gradient and vehicle load(driving condition) effective identification during the running process, this work takes the series–parallel HEV as the research object and studies on the dynamic identification mechanism of slope and load, based on the analysis of its structural parameters. Firstly, vehicle’s driving condition identification model is developed, and the optimization goal function is established using the least square method. Secondly, six different kinds of particle swarm optimization(PSO) algorithm are used for the recognition of vehicle’s driving condition, and the results show that hybrid PSO algorithm based on hybrid training algorithm has better calculation accuracy for this problem. Finally, Experiments are carried out to verify the driving condition recognition method based on PSO algorithm. Through the acquisition of a real vehicle data during the running process, road grade and vehicle mass are estimated by using the proposed method, and the effectiveness of the proposed method is proved through comparison of errors between recognition results and true value.
Keywords
Introduction
Hybrid electric vehicles(HEVs) are emerging automotive products that have the capability to increase vehicle performance and fuel economy, and to reduce the environmental impacts of personal transportation [1, 2]. As one of the core technologies of HEV energy saving and emission reduction, the vehicle driving energy control strategy has been a hot research topic in HEV, and some progress has been made in the research. However, current study did not consider that the dynamic changes of driving conditions have a reaction on energy control strategy. It’s a difficult problem to be solved well that how HEV energy control strategy to make the driving torque of HEV consistent with the driver’s intention, especially when driving condition changes. Drivers will be forced to change the accelerator pedal position frequently when the HEV driving torque is not consistent with the drivers’ intention, to expect that the dynamic change of the HEV drive torque in real time to respond to the dynamic change of the drivers’ intention. And then, it will make the driving torque of HEV fluctuate frequently, so that the control of the power system will be more difficult, furthermore, the increasing of driving torque means the increasing of energy consumption. The above analysis shows that the driving condition recognition is of great significance for the research of control strategy.
So there is increasing interest in the automotive industry for model-based estimation of vehicle mass and road grade, which can be used in transmission shift scheduling and vehicle longitudinal control, cruise control, hill holding, and traction control [3]. Current research about driving conditions(road gradient and vehicle mass) recognition, from the point of the research object, mainly concentrate in the traditional heavy vehicle [3–5], part of them focus on the pure electric vehicles [6, 7], and few studies appear in the hybrid electric vehicle, from the research objective point of view, mainly concentrate in the automatic transmission gear shift strategy, dynamic control, GPS navigation, and application in HEV driver’s demand torque intention identification or energy control strategy research are rarely, from the point of recognition method, most literature focus on vehicle load [6–9] or road slope [4, 11] recognition independently, and recognition of both still very few. E Wilhelm et al. studied vehicle mass real-time estimation method based on a Ford light pure electric connection truck [6]. Feng Yuan et al. of Tongji University studied on an in-wheel motor driven electric vehicle mass estimation method, and the results show that automotive mass can be estimated accurately due to driving torque and wheel speed can be accurate measurement of pure electric vehicle [7]. H.K. Fathy et al. and S Rhode et al. studied on traditional automobile mass estimation method by using the least squares methods [8, 9], S Rhode through six different vehicle mass experimental results show that the results of vehicle mass estimation were more accurate [8]. BGanji et al. used digital map and vehicle sensor to get the slope of the road in the future, and proposed a road-slope-prediction-based energy control strategy of HEV [10]. J Ryan et al. and H.S. Bae et al. both estimated the road slope of the vehicle using GPS signal [11, 12], H.S Bae et al. calculated vehicle mass based on the slope of the estimated results [12]. In Ref. [3] a model-based two-stage estimation strategy have been developed to determine a heavy-duty vehicle’s(HDV’s)mass and road grade. A Vahidi et al. determined the feasible region of the parameters to be estimated at first, and then used the least squares methods to estimate the mass and slope [5].
In this paper, in order to identify the real-time road gradient and vehicle load effectively during the HEV driving process, which, in turn, can provide the basis for the dynamic adjustment of the vehicle control strategy, the dynamic identification mechanism of the road gradient and vehicle mass of HEV is studied and the effectiveness of the proposed method is verified by experiment, based on a hybrid HEV as the research object.
The recognition mechanism of PSO algorithm of HEV’s driving condition
The structure and parameters of Series - Parallel HEV
Put a typical parallel-series type hybrid electric vehicle as the research object, the power coupling mechanism is planetary gear system, as shown in Fig. 1. The generator M1 is connected to the sun round of planetary gear system, the engine is connected to the planet carrier, and the motor M2 is connected to the ring gear. The final power output component of the coupling mechanism is the ring gear. The power will transfer further to HEV’s driving wheels through ring gear, chain, gears, main reducer, differential and axle shaft gear.
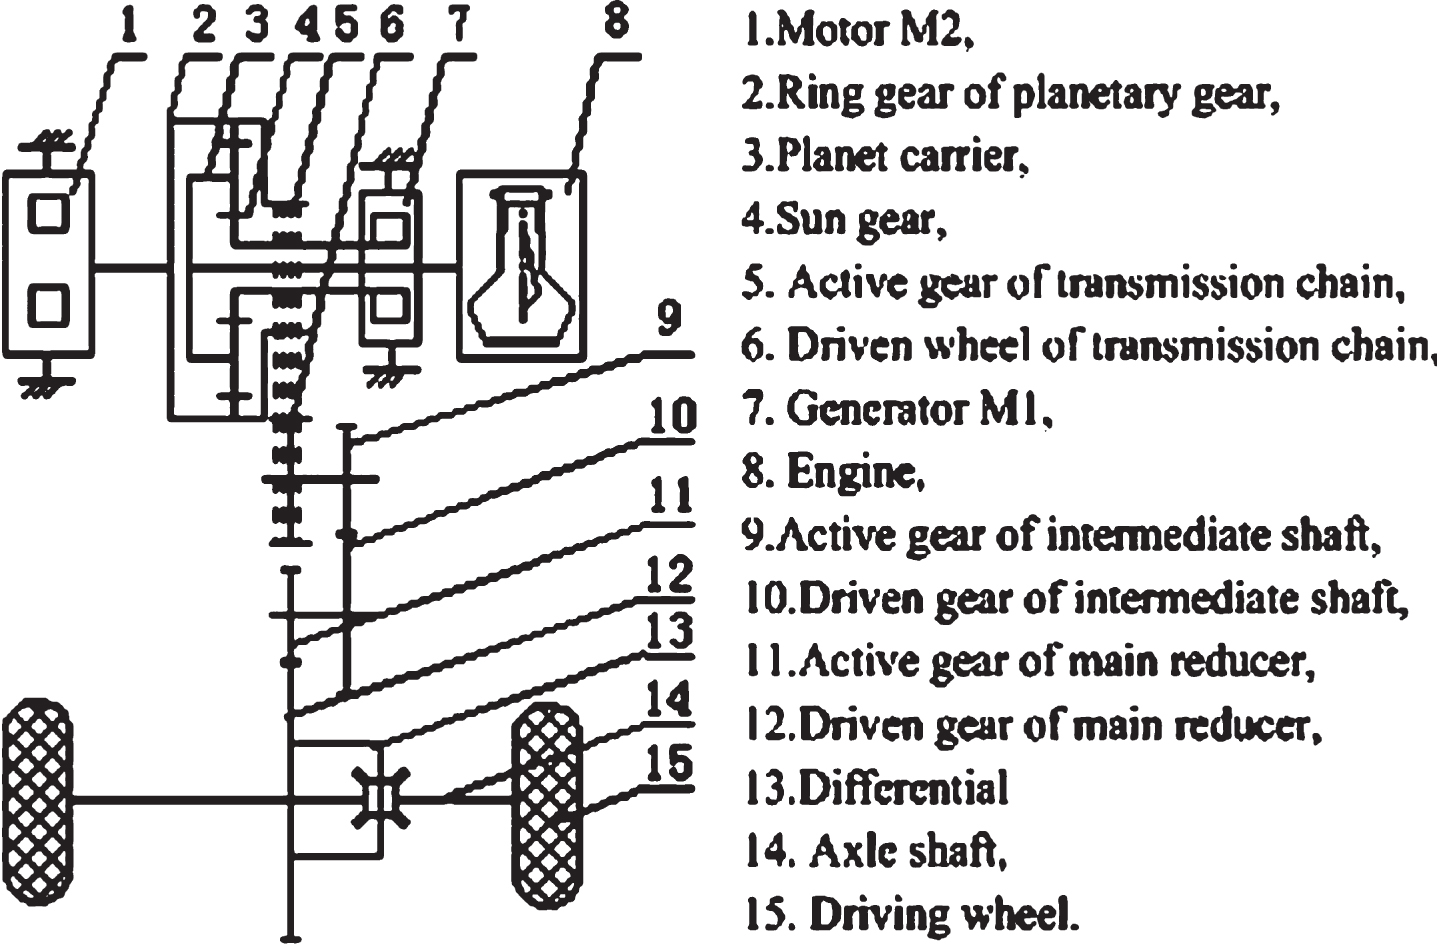
Structural diagram of planetary gear Series-Parallel HEV.
The primary parameters of HEV are shown in Table 1.
Major relevant parameters of planetary gear HEV
Notes: C D —drag coefficient; A— max vehicle cross section; δ— rotary mass coefficient; r— wheel free radius; r r — wheel rolling radius; m z — curb weight; f— rolling resistance coefficient.
According to vehicle longitudinal dynamics principle, at the current moment t, vehicle differential equation can be written as:
where,
In Equation(1), under the premise of the driving force, velocity and acceleration are known, there are still two free variables i.e., m and α. To solve the variables, two equations are required only, namely, we can use t-1 and t-2 moment equations to solve m and α, and they can be written as follows:
For t-1 moment:
For t-2 moment:
Considering the error of related parameters on the test during the process of driving, if we just use the two moments of the data to calculate, it would appear larger error. Consequently, this paper uses i historic data points before current moment to calculate equations for the problem, which makes it becomes an overdetermined-transcendental equations problem solving, and matrix equations can be given as Equation(5):
In order to solve the overdetermined-transcendental equations, least squares method can be used, namely, a set of parameters of the ideal
According to the principle of least squares method, we need to search minimum for the optimization of target function Equation(7):
where,
The PSO method, a population-based optimization method, is based on simulating the social behaviors and self-adaptive characteristics of animals [13]. PSO has attracted increasing attention because it is highly efficient and can search for global optimal solutions in scientific and engineering domains [13–15]. Hence, in the paper, we choose the PSO algorithm to estimate the vehicle load and road grade. Many kinds of PSO algorithm, after years of development, have been proposed including basic PSO algorithm, PSO algorithm with compression factorsetc [16–19]. Furthermore, in order to find a suitable method for this work, 6 kinds of PSO algorithm were compared and the one with minimum estimation error was selected as the optimal PSO algorithm.
The principle and results of basic PSO algorithm
The basic PSO algorithm sees each individual as a particle, which has no volume and weight, and flies in the n-dimensional search space at a certain speed flight. The flying process is also a process to find optimal solution, and its flight speed is dynamically adjusted by individual experience and group experience.
To estimate the vehicle mass m and road grade α accurately the following assumptions are made.
Assumption 1: X
i
=(m
i
, α
i
) is current optimization value for the load and slope of the particle i; Assumption 2: V
i
=(v
im
, v
iα
) is updated speed for the load and slope of the particle i; Assumption 3: P
i
=(p
im
, p
iα
) is position of the best fit value for the load and the slope of the particle i.
By minimizing the objective function
Suppose the number of particles in the optimal population is s, and global best position for all particles is P g (t), then:
From the above, evolutionary equation of basic PSO swarm algorithm can be described as:
where, the subscript “m”and “α” represent dimension of particle’s load and slope, respectively, “i”denotes the particle i, t is the t-generation, c1 ∈ [0, 2], c2 ∈ [0, 2] are variable-speed constant, r1 ∼ U(0, 1), r2 ∼ U(0, 1) are mutually independent random functions.
Therefore, it can be seen that c1 can change the steps that particles can move to the best position of its own load and slope, while c2 can change the steps that particles can move to the best position of global load and slope.
In order to avoid the particles fly away from the search space, usually the limits of v im , v iα are made as follows:
The constraint function shows that the search space the load m and slope α of this problem is:
Therefore, it can be set as:
The initialization of basic PSO algorithm includes three steps. First of all, set the population size N. Then, m i and α i , obey uniform distribution, are generated for arbitrary particles i in search space [mmin, mmax] and [αmin, αmax]. And finally, v i m and v i α, also obey uniform distribution, are generated for arbitrary particles i in limited range [- vmmax, vmmax] and [- vαmax, vαmax].
For the study of adaptability of the basic PSO algorithm for identification of the driving condition, taking particle number is 30, and the maximum number of iterations is 500. Figure 2 is the speed curve recorded during the experiment, the driving force of the vehicle in the driving process can be calculated by the indirect torque of the motor. The experimental road slope is 0.0898rad(5.145°), and the total mass of the experimental vehicle is 1596Kg(load m l = 296Kg), while the number of crew is 5.
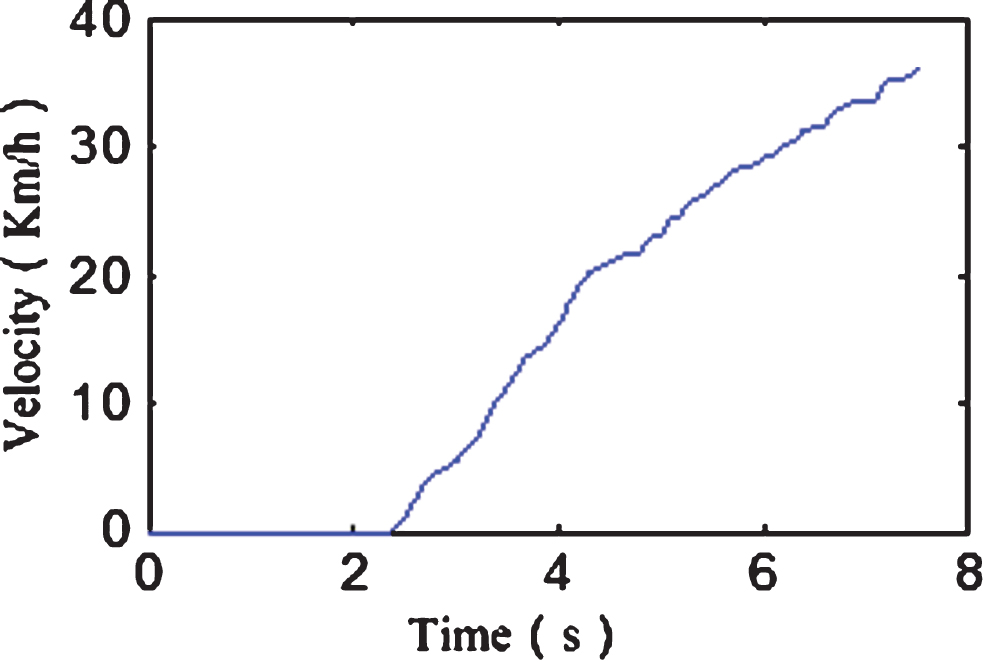
Speed curve of testing vehicle.
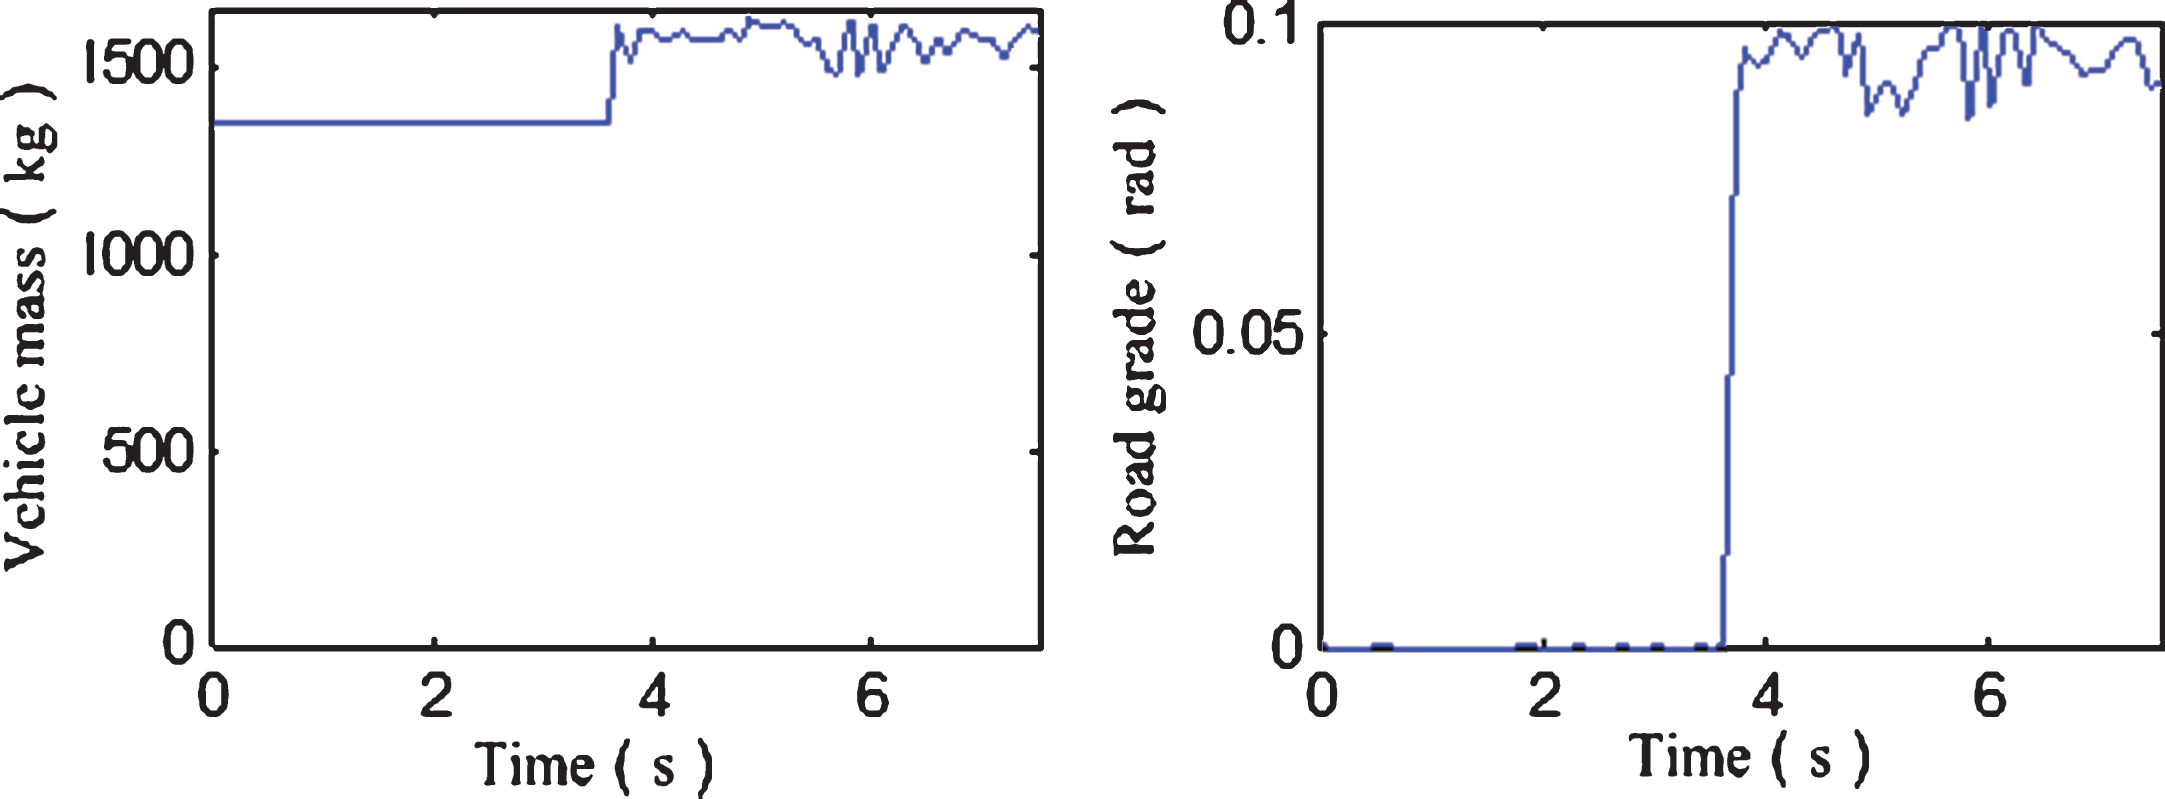
Figure 3 shows the recognition results the total mass of the experimental vehicle and the road slope using basic PSO algorithm, we can know the average error of vehicle’s total mass identification is 5.85%, while road slope is 3.71%.

Estimate results of basic PSO algorithm.
The degree of influence of particle trajectory by their own experience and group experience are determined by variable speed constant c1 and c2. The larger the c1 is, the more particle is hovering over a small area. The bigger the c2 is, the particle will be in the local minimum premature convergence. In order to balance the global search and the local detection, Clear applies the compression factor φ to the velocity update formula, as follows:
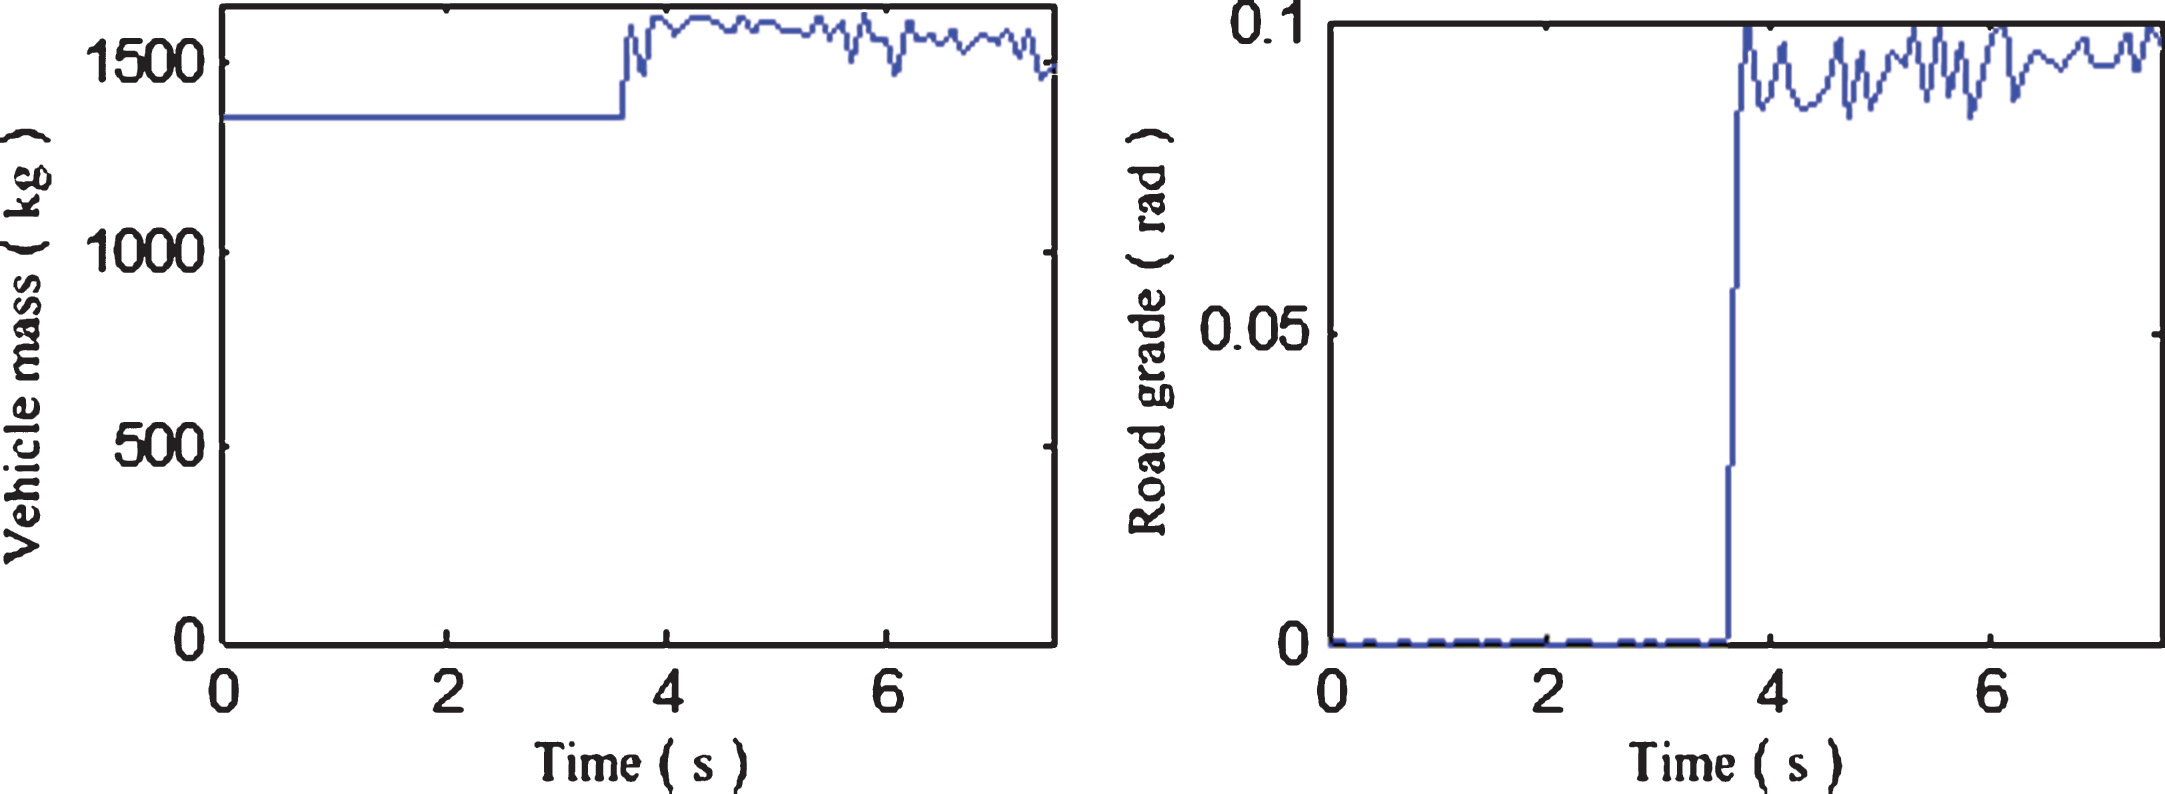
With the 3.1 conditions, Fig. 4 is the recognition results of the total mass and the road slope using the PSO algorithm with compression factor, the average error of the total mass identification of the vehicle is 5.88%, and the average error of the road slope identification is 3.67%.
Estimate results of PSO algorithm with compression factors.
To solve the problem that PSO algorithm is easy to premature in the early stage while in the latter is easy to oscillation, the inertia weight factor w can be set as the number of optimization iterations during the process of w decrease from the maximum wmax linear to the minimum value wmin, and it can be expressed as:
where, t is the number of iterations for the current iteration, tmax is the maximum number of iterations, usually taken wmax = 0.9, wmin = 0.4.
With the 3.1 conditions, Fig. 5 is the recognition results of the total mass and the road slope using the PSO algorithm with a linear decreasing method of weighting, the average error of the total mass identification of the vehicle is 5.82%, and the average error of the road slope identification is 3.56%.
Estimate results of PSO algorithm with a linear decreasing method of weighting.
PSO algorithm with linear decreasing of weighting can achieve a certain degree of balance between global optimization and local exploration, but it can’t be adjusted dynamically. On the contrary, PSO algorithm with adaptive weight approach use nonlinear dynamic adaptive method to change weight coefficient. Its essence is that when the target value of each particle is close, increase weight coefficient, contrary to reduce, and when the particle individual fitness value is higher than the average value, reduce the weight coefficient to protect it, whereas increase weight coefficient. The formula of weight coefficient w is:
where, I is the current fitness value for the particle, I avg and Imin is mean and minimum values for all current particle fitness respectively.
With the 3.1 conditions, Fig. 6 is the recognition results of the total mass and the road slope using the PSO algorithm with adaptive weight approach, the average error of the total mass identification of the vehicle is 5.93%, and the average error of the road slope identification is 3.48%.

Estimate results of PSO algorithm with adaptive weight approach.
To avoid the rejection phenomenon of the best points in the early stage and easy to fall into local optimum in the later stage of the PSO algorithm with a linear decreasing method of weighting, the inertia weight w can be set as random numbers obeying a rule, accordingly, increase the randomness, as follows:
where, N(0, 1) is the random number which follows the standard normal distribution, rand(0, 1) is a number generated randomly between(0, 1).
With the 3.1 conditions, Fig. 7 is the recognition results of the total mass and the road slope using the PSO algorithm with random weighting method, the average error of the total mass identification of the vehicle is 5.89%, and the average error of the road slope identification is 3.52%.
Estimate results of PSO algorithm with random weighting method.
To draw on the principle of survival of the fittest of GA(Genetic Algorithm), the hybrid idea can be introduced into the speed and position update formula of PSO algorithm, and select a certain amount of parental particles to hybridize pairwise randomly to forming a same number of offspring particles to replace the parent particles, where the offspring’s position can be obtained from parental position arithmetic crossover:
or
where, p is a random number between 0 and 1, the rate of the offspring is calculated by the formula(19):
or
With the 3.1 conditions, Fig. 8 is the recognition results of the total mass and the road slope using the hybrid PSO algorithm based on hybrid training algorithm, the average error of the total mass identification of the vehicle is 5.51%, and the average error of the road slope identification is 3.27%. Compared to the above methods, the results are the best, so the algorithm is the optimal solution for this problem.

Estimate results of hybrid PSO algorithm based on hybrid training algorithm.
In order to verify the validity of the road gradient and vehicle load identification method proposed, we take an experiment on driving condition recognition based on PSO algorithm.
Experimental installation
Experimental equipments include a series-parallel HEV, a special data flow testing instrument i.e. Intelligent Tester- II, a notebook computer, a special data processing software i.e., Intelligent Viewer, an axle load measurement experiment station and a road slope test digital total station instrument set. The special data flow test equipment Intelligent Tester- II, average sampling time is 35.5 ms, can collect the data, including all parts of the electronic control system, of test vehicle from CAN network via a OBD interface of vehicle during driving processes. The real vehicle test and data collecting conditions are shown in Fig. 9.
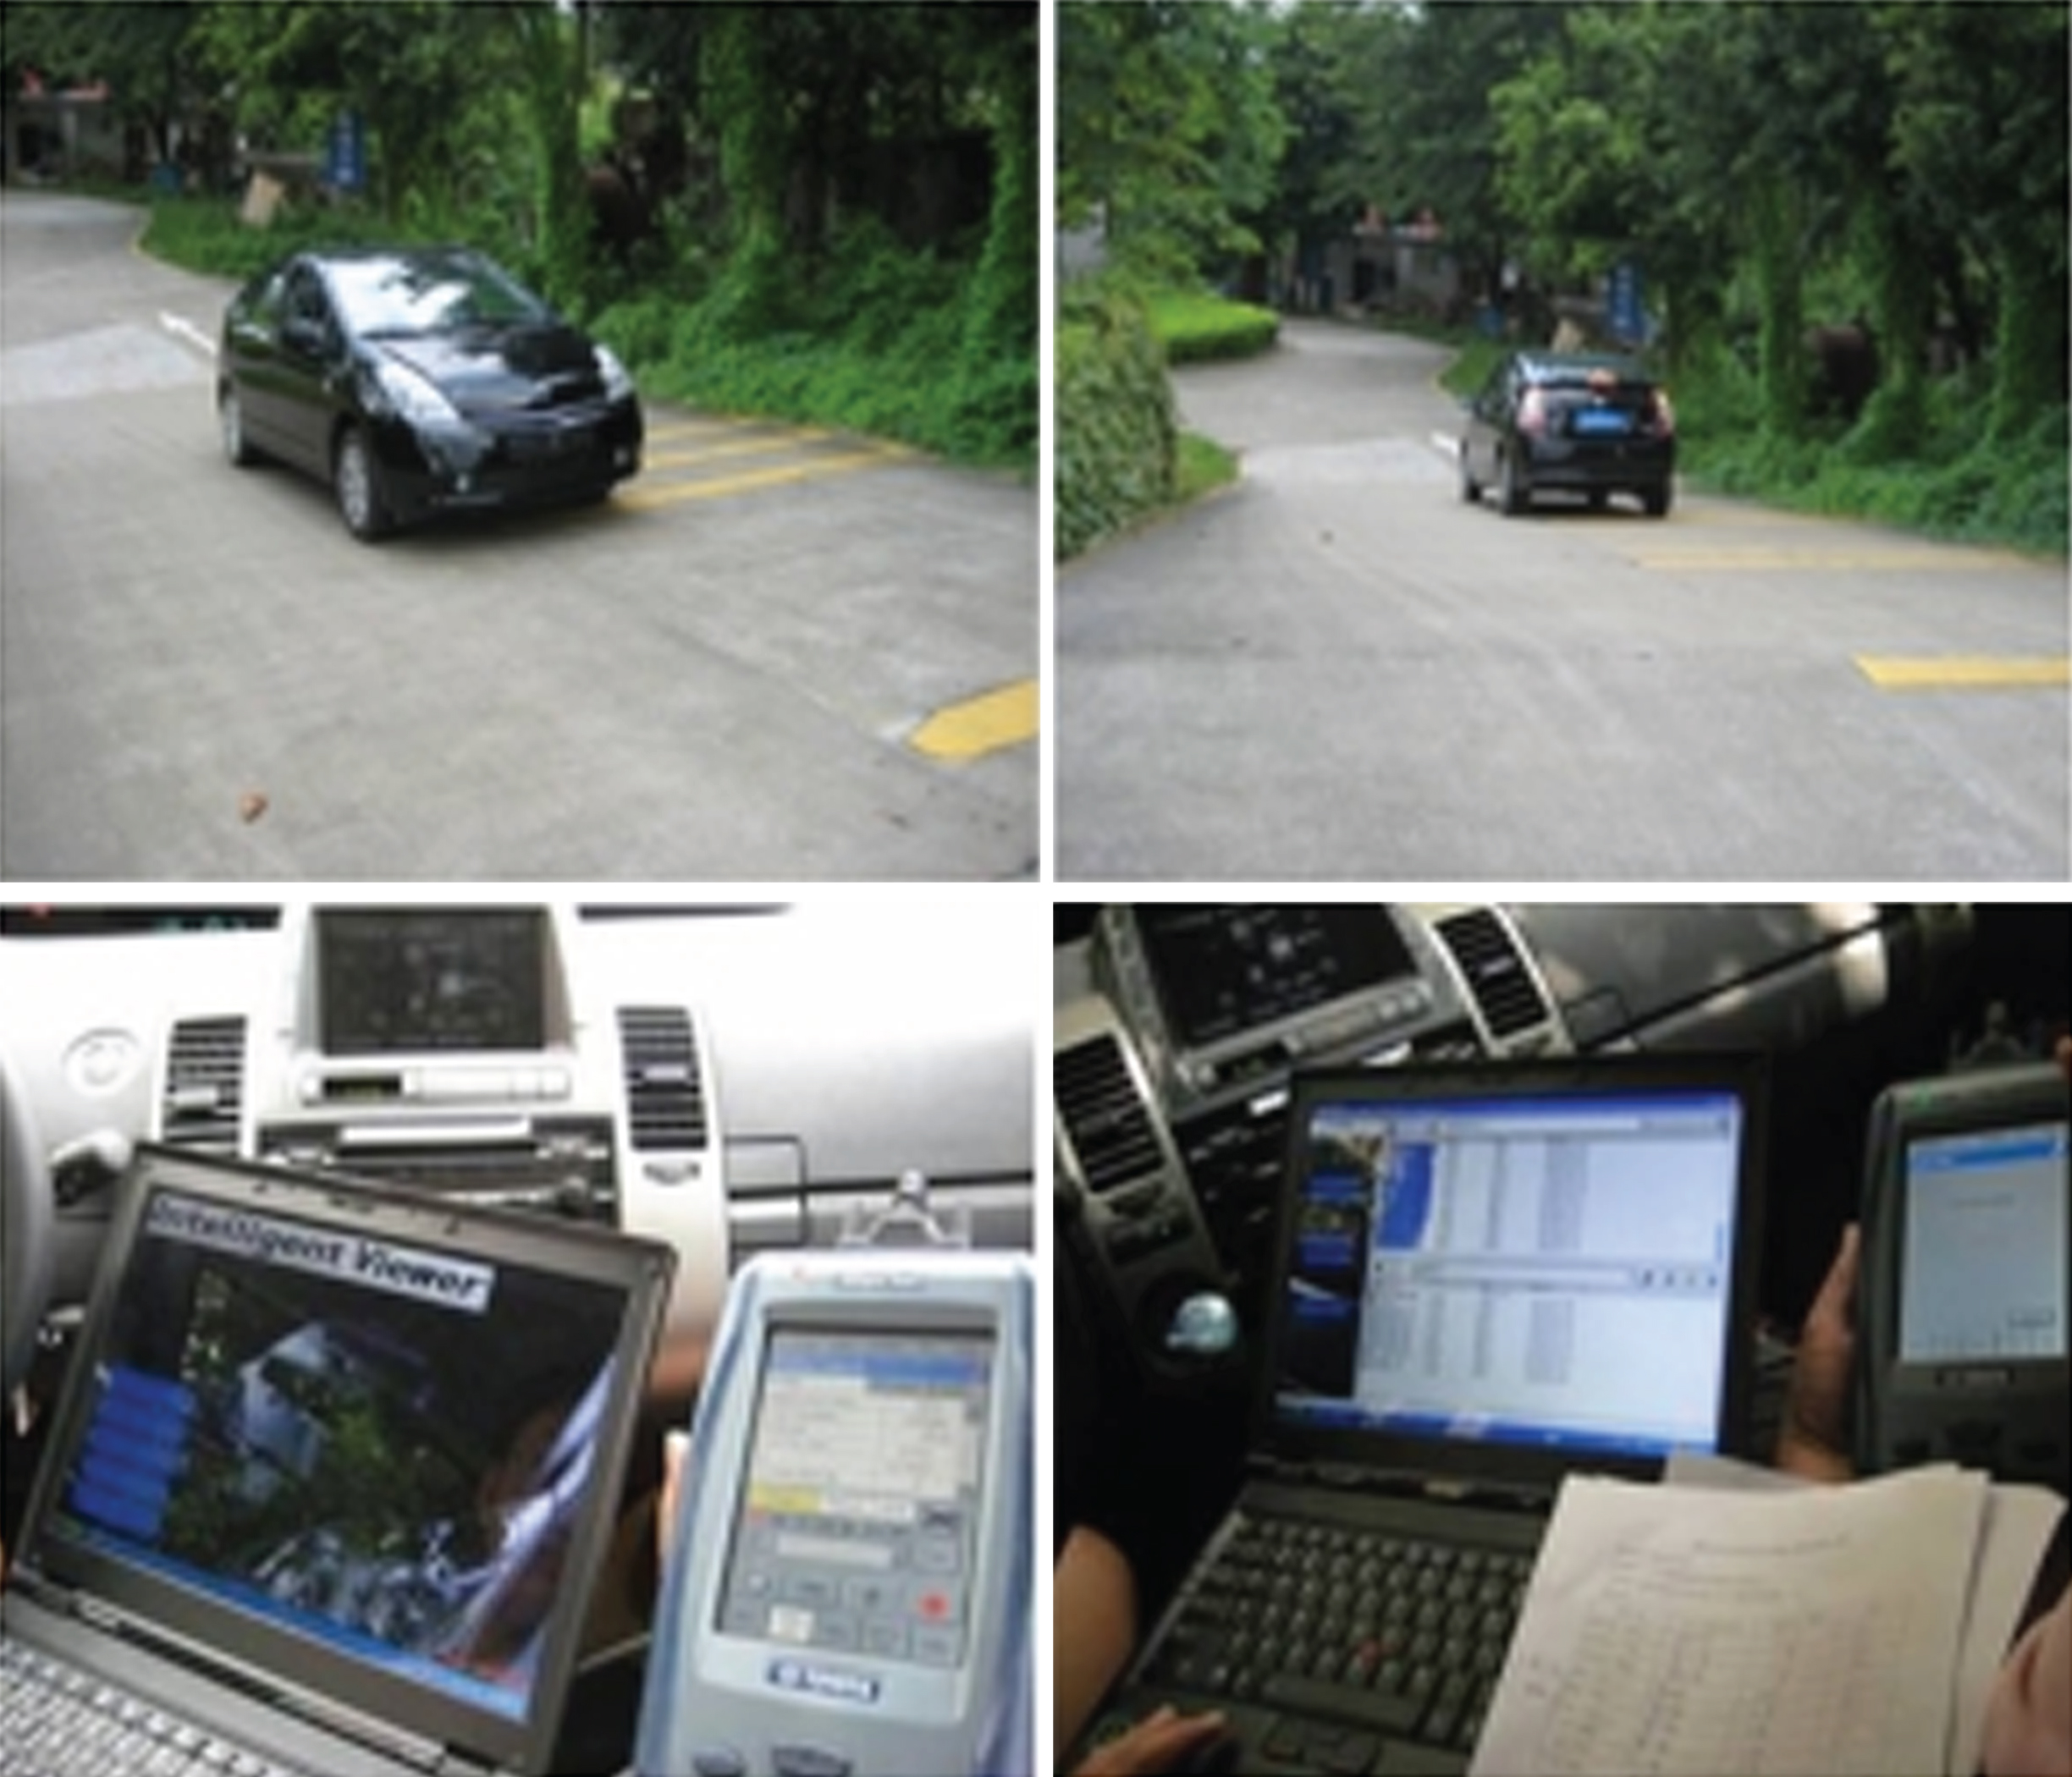
The real vehicle test and data collecting.
For the sake of check the effect of driving condition identification method using PSO algorithm, firstly, the mass of the experimental vehicle, the mass of the load and the slope of the road were measured in the experiment. And then, the experimental vehicle is driven on the experimental ramp with different loads and acceleration pedal stroke, and the experiment data are collected by the special equipment. Finally, the load of the experimental vehicle and the road slope are identified by using the identification method of the paper and data collected from the experiment. Thus, the effectiveness of the proposed method can be verified via comparing the recognition value and true value.
To fully verify the proposed recognition method, 18 groups of experimental conditions, as is shown in Table 2, are set and different experimental conditions are corresponding to different road grade(flat road or ramp road), different passenger quantity(representing load) and different accelerator pedal stroke(representing acceleration) of HEV in the experiment.
The driving condition identifying experiment
The driving condition identifying experiment
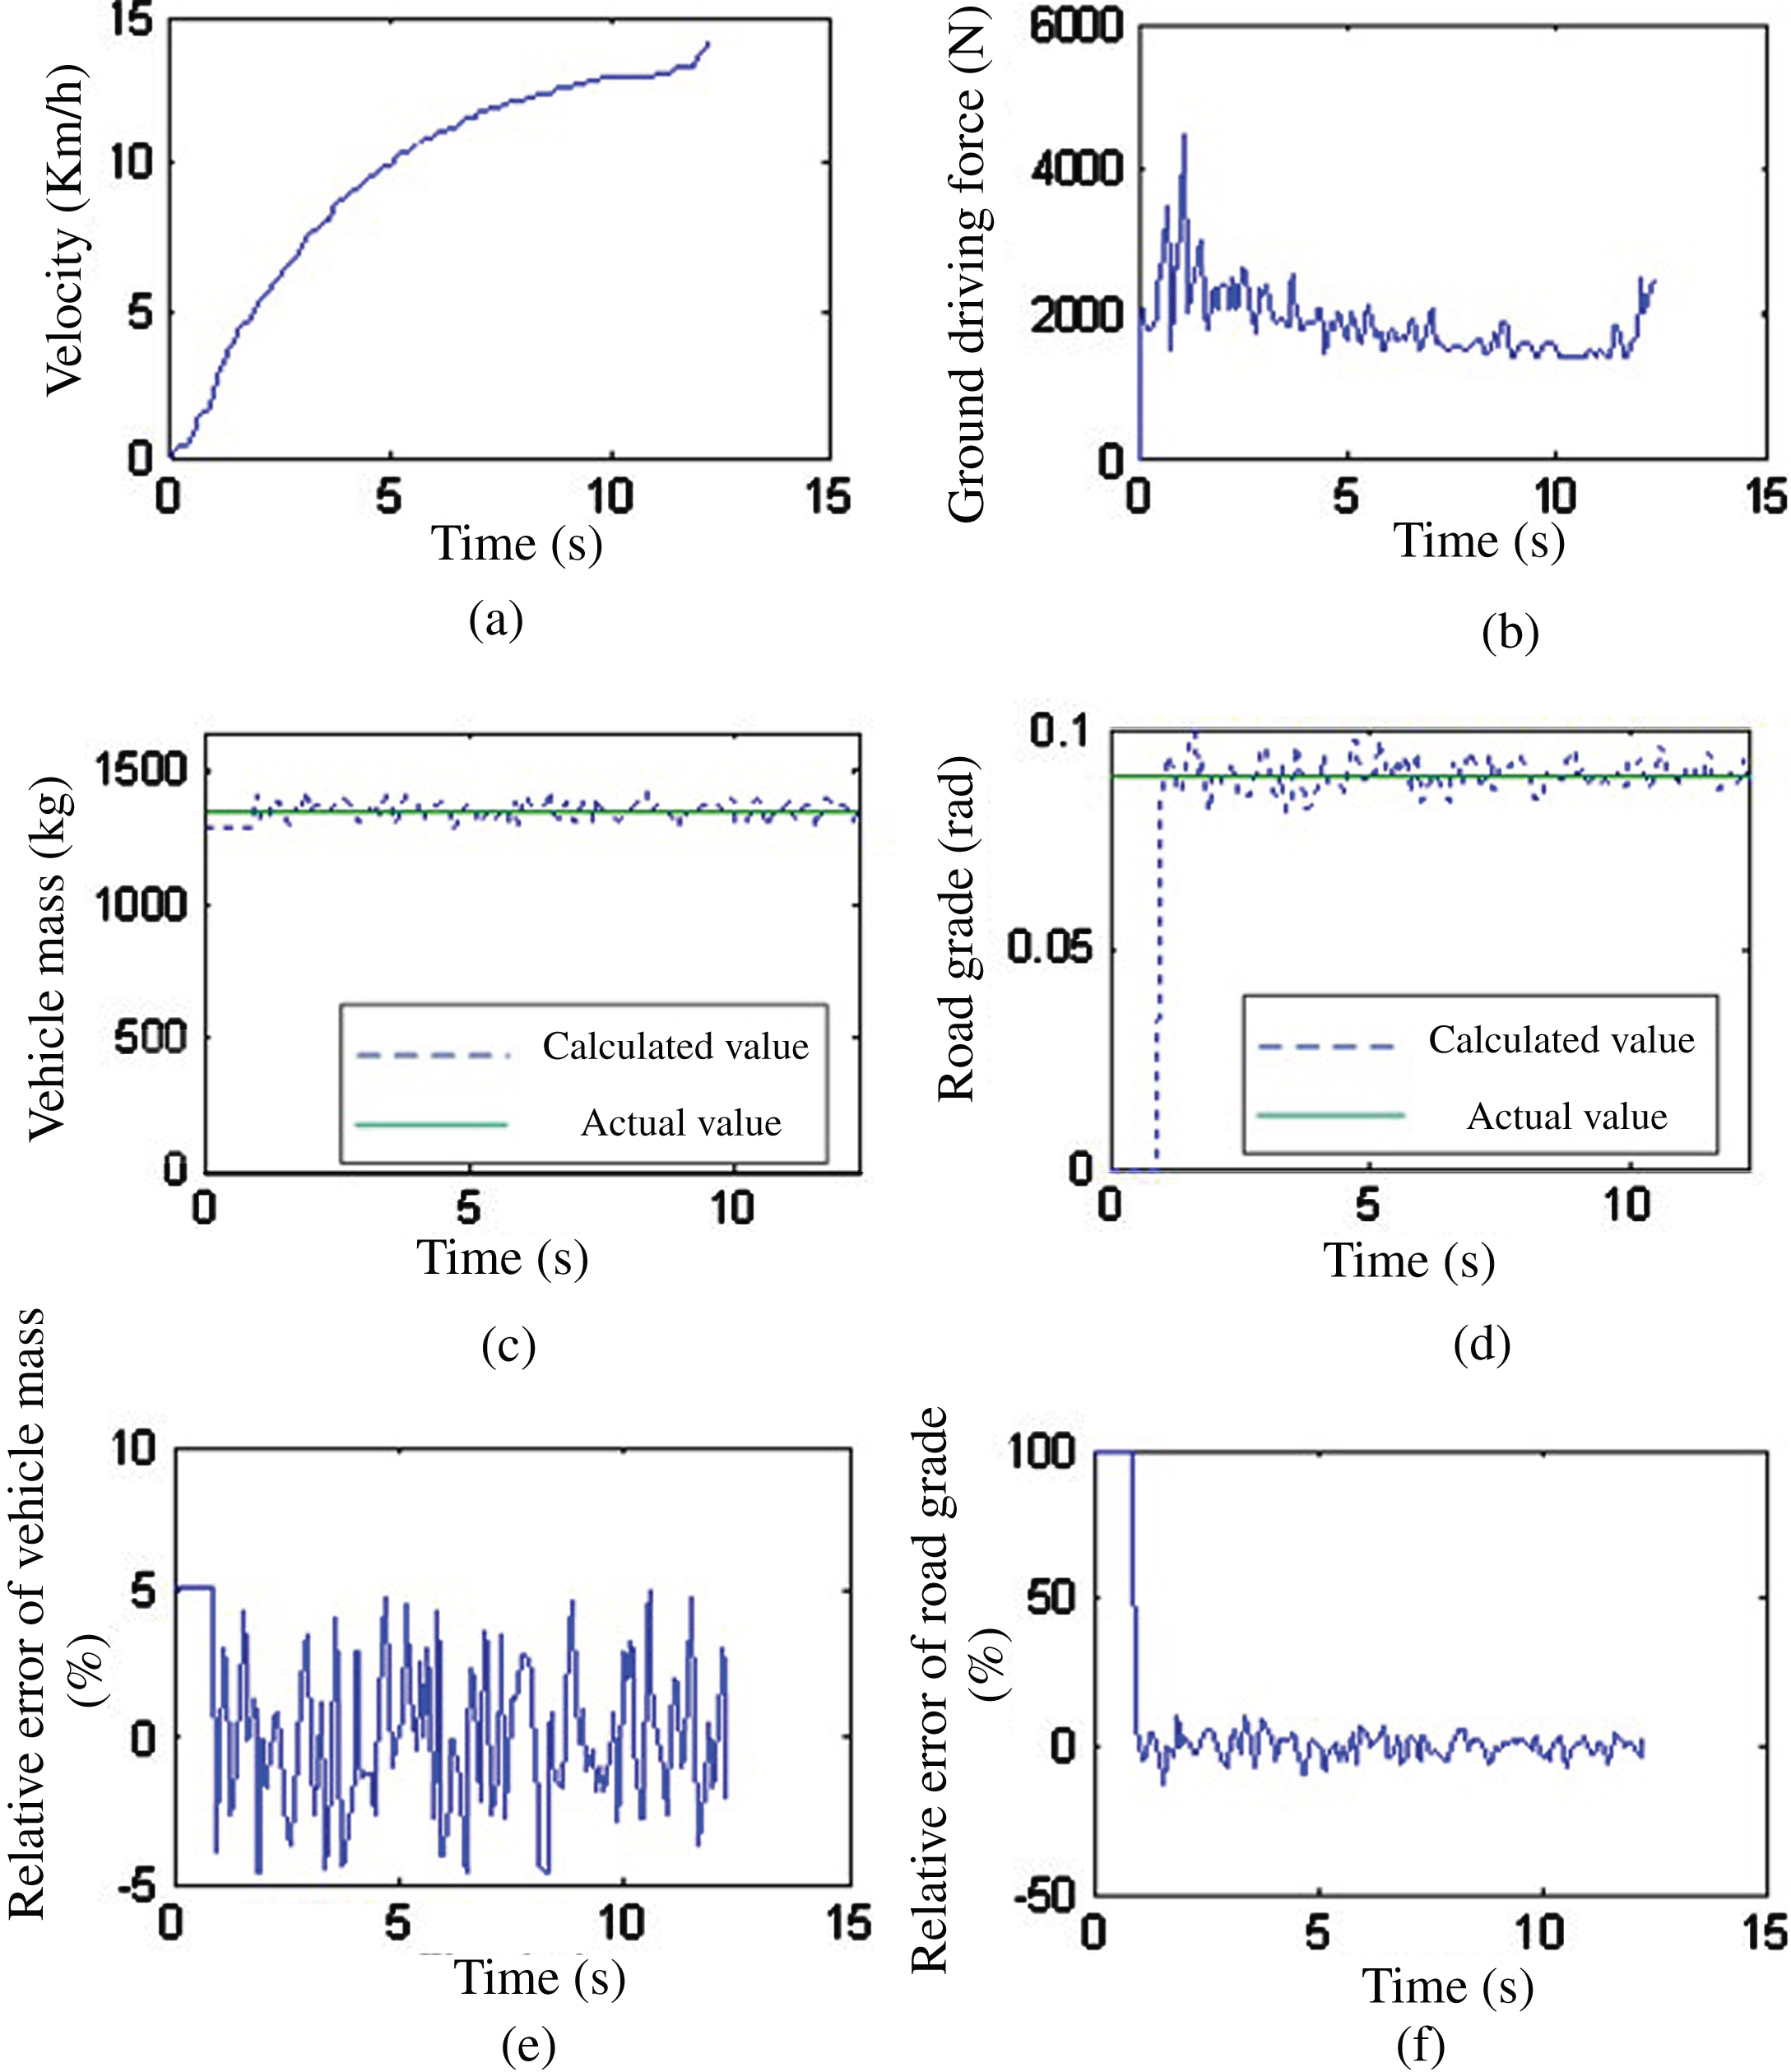
Experimental data were collected from 18 groups of experimental conditions, including the speed of vehicle under different experimental condition, the speed and torque of the HEV power system etc., then use the PSO algorithm to identify the vehicle load and the experimental road slope. On the basis of the experimental data acquisition and driving condition identification of 18 groups of experimental conditions, the results of the experiment condition 1 and 11 are analyzed. Figure 10 is the results for experimental condition 1 and Fig. 11 is results for the experimental conditions 11, where figure(a) is speed curve of experimental, figure(b) is drive force curve for the experiment, figure(c) is the comparison result of the actual value and recognize value for the total mass of vehicle(vehicle mass and load), figure(d) is comparison result for road slope actual value and recognition value, figure(e) and(f) is the relative error of the actual value and the recognition value of total vehicle mass and road grade respectively. Figure 10 shows that in the experimental conditions 1, the maximum relative error of vehicle total mass is 5.08%, the average absolute value of relative error is 2.31%, furthermore, as the road slope of condition 1 is 0°, so there is no road slope relative error.

Testing results of working conditions 1.
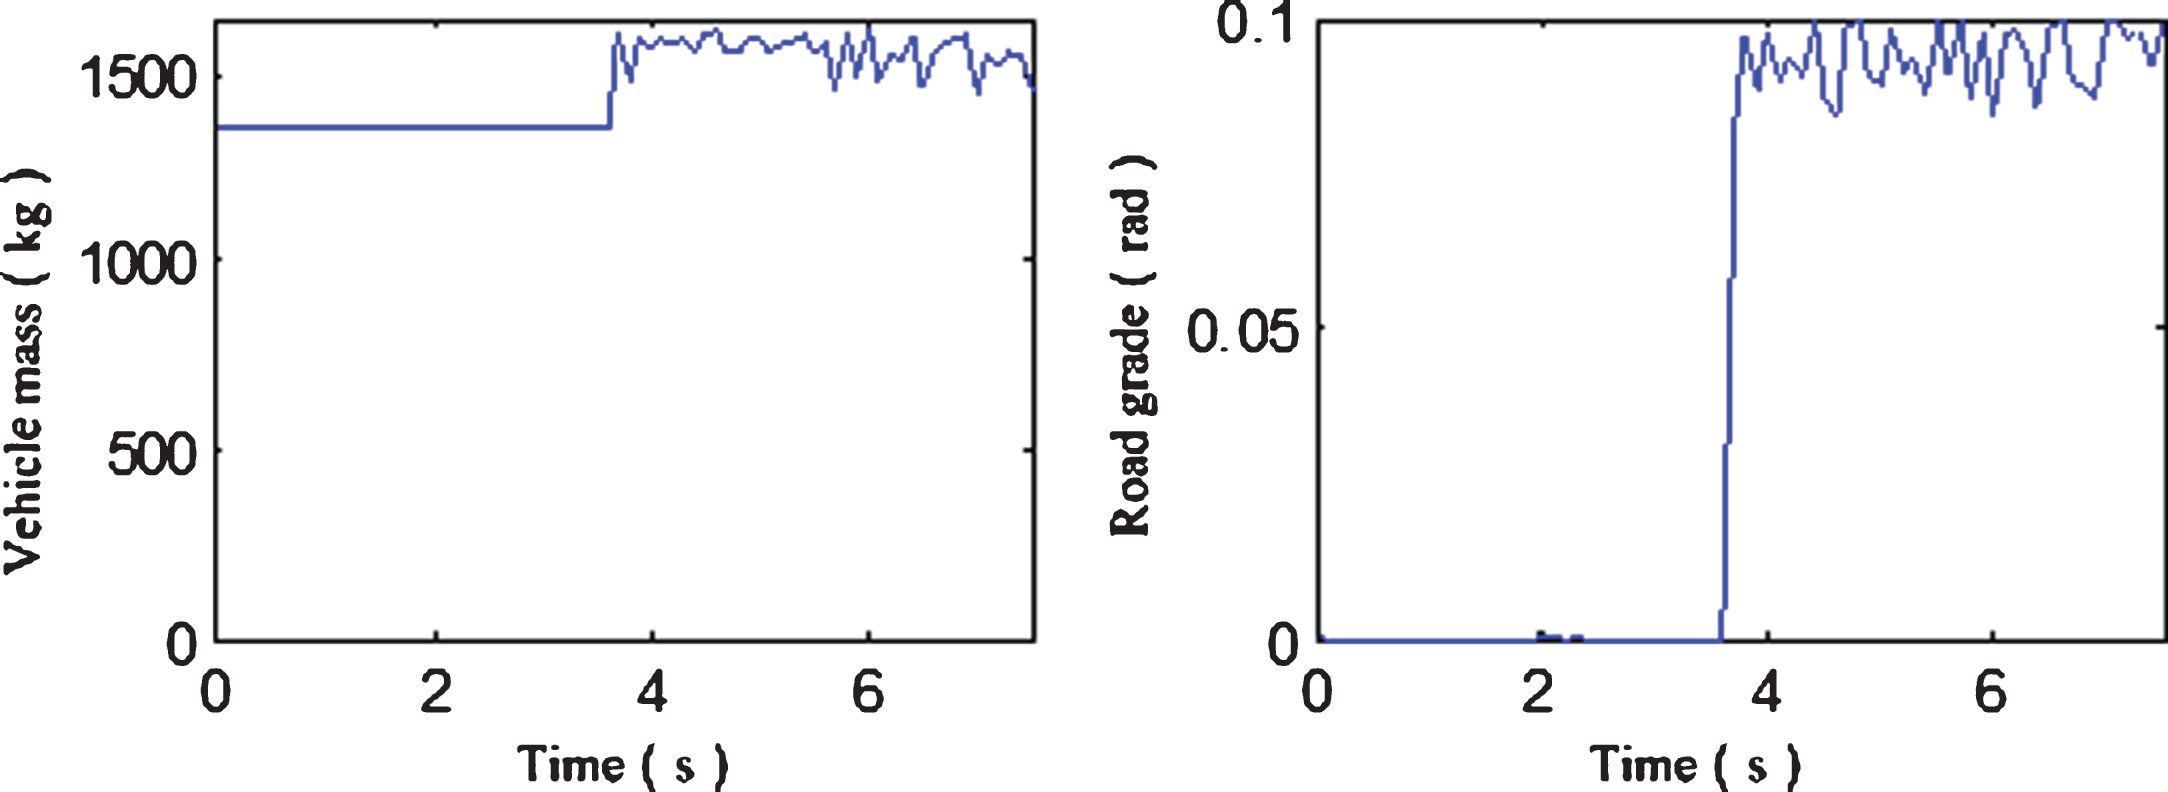
The meaning of graphs in Fig. 11 is the same as those in Fig. 10, so it can be seen from the Fig. 11, in the experimental conditions 11, maximum relative error value of vehicle total mass is 5.11%, the average absolute value of relative error is 2.12%, maximum relative error values of road slope is 8.89%, the average absolute value of relative error is 3.37%, and the result is effective.
Testing results of working conditions 11.
Figure 12 is a statistic diagram, shows the maximum value of relative error of experimental results for 18 groups of experimental conditions, and Fig. 13 shows the mean value of the relative error of them. Figures 12 and 13 can be used for statistical analysis identification error of vehicle load and road slope. The figures show that the maximum relative error of estimation value of the total mass of vehicle is 8.04%, the maximum relative error of estimation value of road slope is 13.78%, the absolute mean value of relative error of vehicle total mass is 4.13%, and the relative error is 5.54%. The results are satisfactory, which can be used in the research of HEV energy control strategy.

The maximum value of relative error of the experiment results.
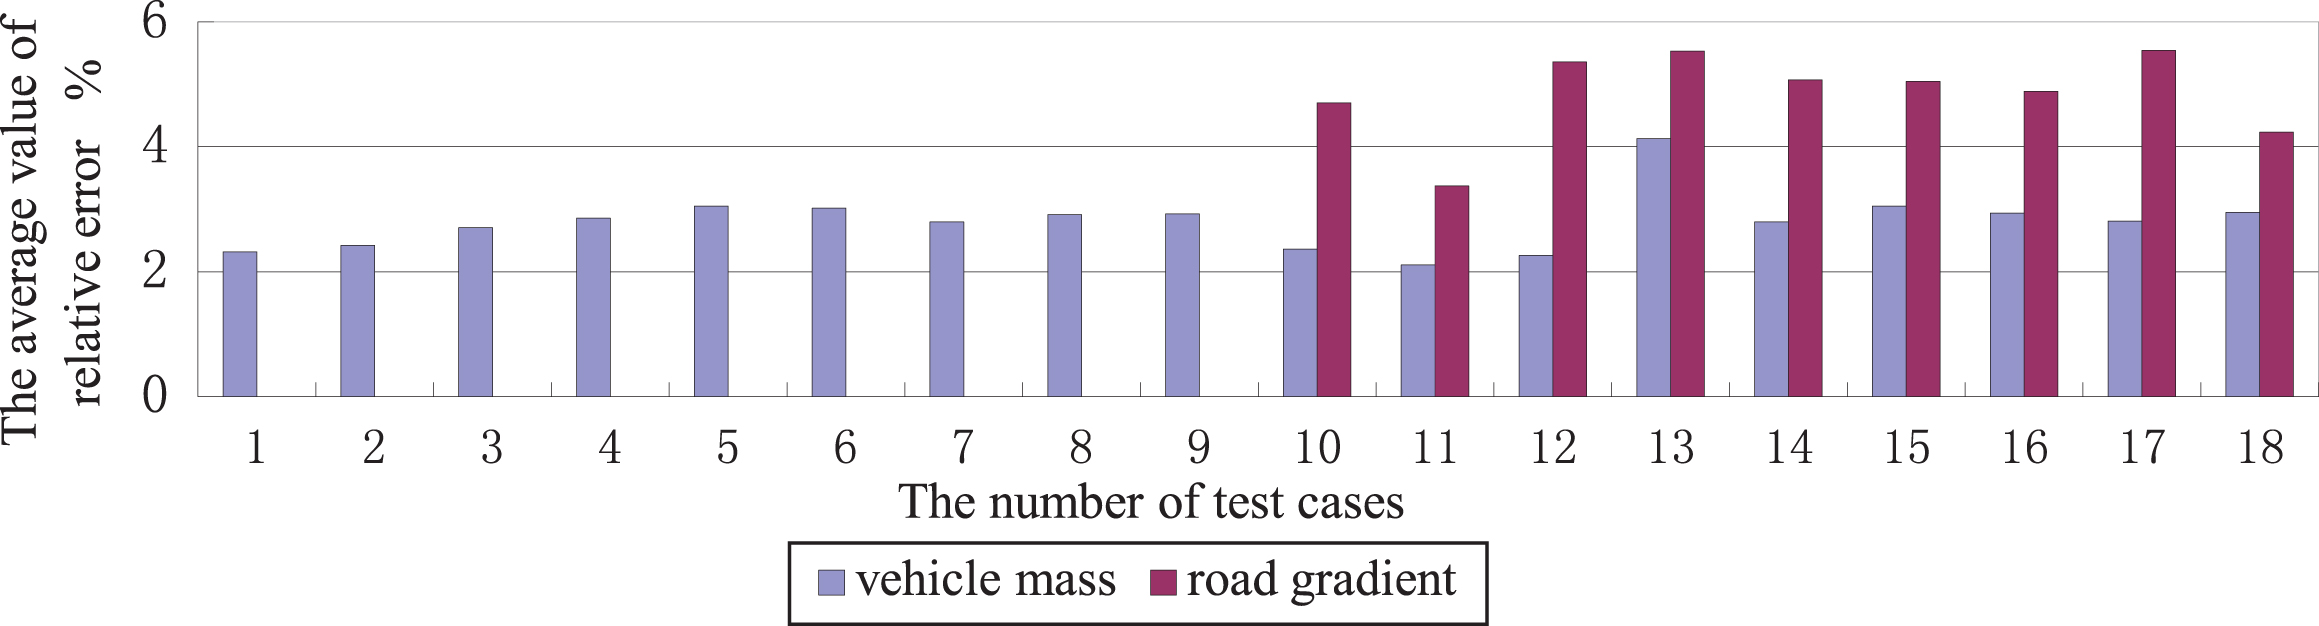
The average value of relative error of the experiment result.
In this paper, based on a series–parallel HEV as the research object, firstly, the vehicle’s driving condition identification model is established, and a set of overdetermined-transcendental equations are constructed on line using acquired real kinetic parameters of vehicle, meanwhile, the least square method is used to establish the driving force deviation minimum objective function for solving the equations. Then, six different kinds of PSO algorithm are used for automobile driving conditions recognition, results show that the PSO algorithm based on hybrid training algorithm, compared to other algorithms, has minimum error and better accuracy for the problem, which average error of the total mass recognition of vehicle is 5.51% and mean error of the identification of road grade is 3.27%. Finally, in order to verify the effectiveness of the proposed method, PSO algorithm identification experiment was carried out. The road slope and vehicle load were identified by the 18 sets of real vehicle data collected. The experimental results show that the maximum relative error value of total vehicle mass estimate is 8.04%, the maximum relative error value of road slope estimation value is 13.78%, the absolute average value of relative error of gross vehicle weight estimation is 4.13%, while road slope is 5.54%, and the results are better and satisfactory.