



Abstract
The current rise in the amount of data generated has necessitated the use of machine learning in the drug discovery process to increase productivity. It is therefore important to predict molecular compounds which are biologically active and capable of drug-target interaction. Various machine learning methods have been used in predicting bioactive molecular compounds in order to deal with the large volume of data being generated. This study investigates the Majority Voting ensemble method using different combinations of 5 commonly-used machine learning algorithms, including Support Vector Machine, Decision Tree, Naïve Bayes, k-Nearest Neighbor, and Random Forest on three chemical datasets DS1, DS2, and DS3 which consist of structurally heterogeneous and homogeneous molecules and are commonly used in other studies. The results show that Majority Voting has a better performance, based on all the evaluation metrics used, compared to each of the machine learning algorithms as individual classifiers. It also shows the Majority Voting ensemble method as effective in the prediction of both heterogeneous and homogeneous bioactive molecular compounds, using statistical evaluation.
Introduction
Drug discovery is an aspect of chemoinformatics whose importance cannot be over-emphasized. Chemoinformatics has become recognized as a distinct field over the years [8]. It is also known ascheminformatics, chembioinformatics, or chemical informatics [3]. It encompasses aspects like the Quantitative Structure Activity Relationship (QSAR), Quantitative Structure Property Relationship (QSPR), lead optimization, and drug target discovery, and in recent times it has been used with the aim of predicting the properties of biological molecules from their structural similarity [18]. In fact, it has been suggested that analysing and predicting bioactive molecules is the most popular task of chemoinformatics [7]. Chemoinformatics is the mixing of those information resources to transform data into information and information into knowledge for the intended purpose of making better decisions faster in the area of drug lead identification and organization” [9].
Various kno8wn and unknown human diseases keep springing up frequently and to combat these new, more effort is put into the discovery of drugs efficient enough to tackle the disease. Pharmaceutical companies spend a great deal of time and resources in producing a new drug and after production, but if it does not meet the target requirement or tackle the disease for which it was produced, the drug will be called off the market. According to [37], it cost about $1.8 billion to bring a New Molecular Entity (NME) to the market after spending over $50 billion on its discovery. Some of these NMEs end up not being endorsed by the US Food and Drug Administration (FDA), and results in wasted effort, time, and resources. It is therefore essential to take the necessary steps in drug discovery. One of these necessary steps is the identification and prediction of biologically active molecular compounds from diverse chemical compounds to detect a drug-target relationship.
Bioactive compounds are compounds which have an effect on living organism, tissues, or cells. These compounds can be found in both plant and animal products or can be produced synthetically. They are very important in reducing deteriorative processes and degenerative disease. It is therefore essential to preserve the beneficial characteristics of these compounds. Bioactive molecules are also important in drug discovery. It is therefore important to identify and predict the molecular compounds which are highly bioactive and can thus assist in drug-target interaction. The bioactivity of a molecular compound and the property of the activity are known as endogenous and exogenous features respectively [28]. Although various forms of research have been carried out and computational approaches have been developed for the prediction of biologically active compounds, the performance of each approach used in the prediction varies due to the variety of methods and datasets used; thus, there is aquest for new approaches to replace the existing methods in use, which can predict bioactive molecular compounds with high performance. Hence, this work aims to obtain a better performance using voting based methods in the bid to avoid the frustration that comes with wasted effort and resources in drug discovery.
Methods
Machine learning methods
The process of drug discovery takes a long time and effort, from the mapping of the target disease to the development of a drug which has the capability to handle it [22, 31]. Compounds are being screened in a search for molecules with a high level of hits. High Throughput Screening (HTS) is a method which has been used over the years by trying different process to reach a solution. This process is known as the trial and error method [38]. A remarkable development from this trial and error method is the process known as Virtual Screening (VS). Virtual screening is an improvement from traditional approaches such as High Throughput Screening to the use of machine learning methods due to the increasing size of data being generated by the chemical field and need proper computation [6].
It has been proven that machine learning, because of its high computational ability, has the inherent capability to make predictive analyses [48]. There has been a resurgent interest in machine learning which has increased the popularity of data mining for drug discovery [19]. The existing data are mainly considered as big data, since they possess the characteristics of volume, variety, velocity, and veracity, and this has made machine learning an important way to process these data [49]. The machine learning platform has been able to create cheaper and more powerful computational processing with ease, while giving room for affordable storage capacity for the voluminous data [5]. This makes it is possible and easy to produce models automatically and within a target time, which will be able to analyse huge, and, more complex data while delivering the results faster and more accurately, even on a very large scale [23].
Various machine learning algorithms have been used in predictive analysis both in chemoinformatics and outside the field. One of these algorithms is Support Vector Machine which is widely used in classification. It was introduced by [14] and is a supervised learning method used for classification and regression [50]. Its main concept is maximized marginalization and kernel function for non-linearly separable classes. It is also robust to accommodate high dimensional data. A review by [40] showed that Support Vector Machine performs better than most of the investigated classifiers, and the performance can be improved by adjusting its parameters, even though more work still needs to be done on it. Radial Basis Function Network (RBFN) is commonly used as kernel in SVM [33, 40]. SVM can be used as a filter between drug and non-drug compounds in the early stage of drug discovery [33], even though real life data for such scenarios might be unbalanced. Support Vector Machine can be optimized to handle parameter optimization and feature selection [50]. In an area similar to chemoinformatics, SVM was also used in screening of drugs for hepatocellular carcinoma [45], where the chemicals to be predicted were accurately identified with SVM.
Another classifier frequently used is k-Nearest Neighbour (k-NN). k-NN is a non-parametric lazy algorithm, which does not make generalizations based on the training data points. It has little or no training phase, which influences the decision to consider it as a lazy algorithm, but this makes the training phase fast. k-NN makes predictions based on the nearest training example in the feature space and it can also be used for regression [35]. It is simple but smart. k-NN can be used to model regression between bioactivity and molecular descriptors using manifold ranking [41]. Exploitation of similarity in structure helps in achieving a good predictive performance. It can be used in combination with docking-based intermolecular analysis to discover new inhibitors [29]. k-NN calculates the distance between each training set and test set in the dataset and gives the k closest sets. The time complexity is linear and it is guaranteed to find the needed and exact k nearest neighbours [16]. Other areas apart from chemoinformatics where k-NN has been utilized include classification of heart disease [15] and detection of Parkinson’s disease using fuzzy k-NN [11].
Naïve Bayes (NB), based on Bayes’ theorem, is a classifier which was specifically introduced for text retrieval [47] and is also another machine learning algorithm which has gained widespread use in chemoinformatics. It is a highly scalable classifier and it requires a number of measures which are linear to the number of attributes (features/variables) in a learning problem. Naïve Bayesian classifiers are frequently used in chemoinformatics either in combination with another classifier or compared with other classifiers. It has been generally used in predicting biological properties rather than physicochemical properties. In predicting the toxicity of a compound [46], Naïve Bayes classifier performed better than other classifiers which it was examined against. Naïve Bayes has also been used for predicting phospholipidosis mechanism [36]. The size and diversity of the class of a dataset can have an effect on the predictive ability of the model as shown by [34] where the developed method had better performance compared to Naïve Bayes using the same dataset due to the size and diversity of the class. Naïve Bayesian classifiers can also be used for regression, even though this case is rarely seen nor implemented in chemoinformatics [17].
The Decision Tree is commonly used for classification. Output values of targets are predicted using the various input attributes of each instance. As the name implies, it is a tree depicted as an inverted tree with the roots at the top while the leaves are below. The root is the most essential attribute and it divides further into branches which are also further divided into branches until it reaches the leaf. The leaf is a node and cannot be further divided, and the nodes from the branches are known as internal nodes. Each leaf node is assigned with a target property, and the internal nodes are assigned with a molecular descriptor which checks if an instance is satisfying a condition before branching it out, based on its characteristics. The decision tree is constructed from class-labelled training tuples [35]. It is basically of two types: classification, which predicts the class an item of data belongs to, and regression, where a real number can be predicted. This is mainly referred to as a Classification and Regression Tree (CART). A decision tree can be pruned, either pre-pruned or post-pruned, to avoid overfitting. It is used in chemoinformatics for the identification of substructures that distinguish activity from nonactivity in a given chemical compound library [32], and also for classification of chemical compounds into drugs and non-drugs [39]. Apart from chemoinformatics, it has also been used in cancer classification [12] and also fault diagnosis [30]. The Decision Tree has proven to be an effective classifier in all areas of application although it works best with categorical data.
Random Forest is a classifier which consist of ensembles of Classification and Regression Trees (CART). It is an ensemble of multiple decision trees where a bootstrap sample of the original data is utilized for growing each tree. However, the trees in random forest are not pruned, unlike decision tree, where there is a possibility of applying pre-pruning or post-pruning [27]. Two techniques, bagging and random feature selection are used by Random Forest, where majority vote is also implemented to make predictions. It uses weak learners to make predictions [42]. Weak learners are predictors with low bias and high variance, which are essential for good accuracy. This can be achieved by growing a tree to its maximum depth without pruning. According to [26], Random Forest is constructed using the following process:
Draw ntree bootstrap samples from the original data. ntree here represents the number of ensemble trees; Grow an unpruned CART for all the bootstrap samples, and randomly select mtry variables at each node of the tree for splitting. mtry here can be a positive integer; Make prediction using aggregation of information from the ntree using majority vote; Determine the error rate using data outside the bootstrap sample.
Random Forest has been effectively used for classification and prediction in chemoinformatics and it has shown some superiority when compared to other classifiers [25, 43] and also great ability to deal with class imbalance problems. It is a fast classifier and rarely predicts wrongly.
Each machine learning algorithm has shown good performance in various situations where it has been used, depending on the type of dataset or its dimensionality. Despite this, there is no approved standard for predicting bioactive molecular compounds, since no method can be said to be superior to the other. If each method is compared based on the performance, time and, computational cost, it can be easily concluded that no method can claim to be superior to the other [35]. It is however of great importance that high performance be obtained from these methods when predicting.
Voting based methods
Although single classifiers have been able to perform well at predicting, there is still the quest to improve the performance of models which are used for prediction, especially in the case of predicting bioactive molecules, due to their importance in drug discovery and the result of their neglect. Analyses by various researchers have shown that the combination of two or more classifiers might result in better performance than that of single classifiers. In the classification of a large dataset which contains more than 24,700 compounds whose Cytochrome P450 (CYP450) are known and five unique CYP isoforms: 1A2, 2C9, 2C19, 2D6, and 3A4, [13] used the combination of different classifiers which were combined by Back Propagation Artificial Neural Network (BP-ANN) and validation using 5-fold cross-validation and reported that the performance derived from the combined classifiers superseded that of the single classifiers. Bagging, Boosting, Stacking, and Voting are popular ensemble methods which can be used to improve prediction performance of a model. Extreme Gradient Boosting (Xgboost) [6], which is a variant of the boosting ensemble and an ensemble of Classification and Regression Trees (CART), was used in an experimental prediction of bioactive molecules, using seven different datasets; when compared against Random Forest, Lib Support Vector Machine (LibSVM), Radial Basis Function Network (RBFN), and Naïve Bayes, it had the best prediction accuracy overall.
Various explorations of ensemble methods have been made in chemoinformatics, but the voting-based ensemble which has been used in other areas has not yet been tapped into in this field. The voting-based method is an ensemble which consists of base classifiers and works to minimize misclassification. It improves the overall prediction based on the prediction of the base classifiers. It uses a combination rule on the prediction of the base classifiers. These rules are the product of probability, average of probability, majority voting, maximum probability and minimum probability, and they can either be weighted or not [10]. The voting-based method is effective in handling incomplete data without making assumptions about missing values. The voting method was used by [44] in Extreme Learning Machine (ELM) to handle incomplete data. ELMs are efficient learning algorithms for single-hidden layer feedforward neural network (SLFN). It was discovered that ELM cannot handle incomplete data, which are mostly common in data gathered from real life applications. The voting-based extreme learning machine uses the training set data to determine how important each item of data is, and trains using the ELM. Using weighted majority voting in predicting, the recorded performance is better than that of single classifiers. It also improves the computational efficiency of the neural network ensemble.
Moreover, in implementing voting ensemble methods in bioinformatics, [20] pointed out that partitioning of data during single voting is important to the detection of mislabelled data, and therefore introduced multiple voting, which consists of several single votes different from each other because of the random partitioning combinedwith majority voting to provide a solution to the neglect of data partitioning while classifying. Multiple voting is able to reduce the problem of dependency of mislabelled data on data partitioning. Since multiple voting is a conglomeration of single votes, multiple voting can be used on single voting to check the unreliability of single voting. The introduction of feature construction to the voting-based method made it more effective in addressing the analysis of financial distress in the real world and predicting the probability of a bank being involved in financial distress [21]. The method uses indecisive rules to construct good rules and make decisions. The performance of the algorithm was better than that of the other algorithms compared with it.
Experimental design
Datasets
The three datasets DS1, DS2 and DS3 used in the implementation of this research are found in the MDL Drug Data Report (MDDR) database and are already converted to Pipeline Pilot’s ECFC_4 fingerprint and folded into 1024 elements fingerprints. They are commonly used datasets and have been used for Ligand-based Virtual Screening (LBVS) [2, 24], and bioactive molecule prediction [1, 6]. The prediction was made based on the activity of the biological molecules. DS1 contains 8294 bioactive molecules and 11 classes, which comprise both structurally heterogeneous and homogeneous molecules. DS2 and DS3 contain 5083 and 8569 bioactive molecules respectively, with 10 classes of homogeneous molecules for DS2 and 10 classes of heterogeneous molecules for DS3. Tables 1, 2, and 3 show the activity class of the molecules, diversity of the class, number of molecules attributed to each class, and the average pairwise Tanimoto similarity index of the molecule pair of the class for datasets DS1, DS2, and DS3, respectively.
Activity Class for Dataset DS1
Activity Class for Dataset DS1
Activity Class for Dataset DS2
Activity Class for Dataset DS3
Five separate classifiers which are commonly used for bioactivity prediction were used as the base classifiers and combined differently to find the best combination. These classifiers first make predictions differently on the datasets and the predictions are validated with 10-fold cross validation. Majority voting gives the overall prediction based on the prediction of the base classifiers. For each instance in the dataset, majority voting assigns the instance to the class where the majority of the base classifiers classify it. This implementation was carried out using WEKA software. It should be noted that if more half of the base classifiers classify incorrectly for an instance, the overall prediction for majority voting will also be incorrect. It is important to select classifiers which have uncorrelated predictions. A good rule of thumb requires the selection of classifiers from tree, Bayesian, function, and lazy classifiers, in order to have classifiers with varied predictions. The process of majority voting is shown in Fig. 1.
Voting Mechanism.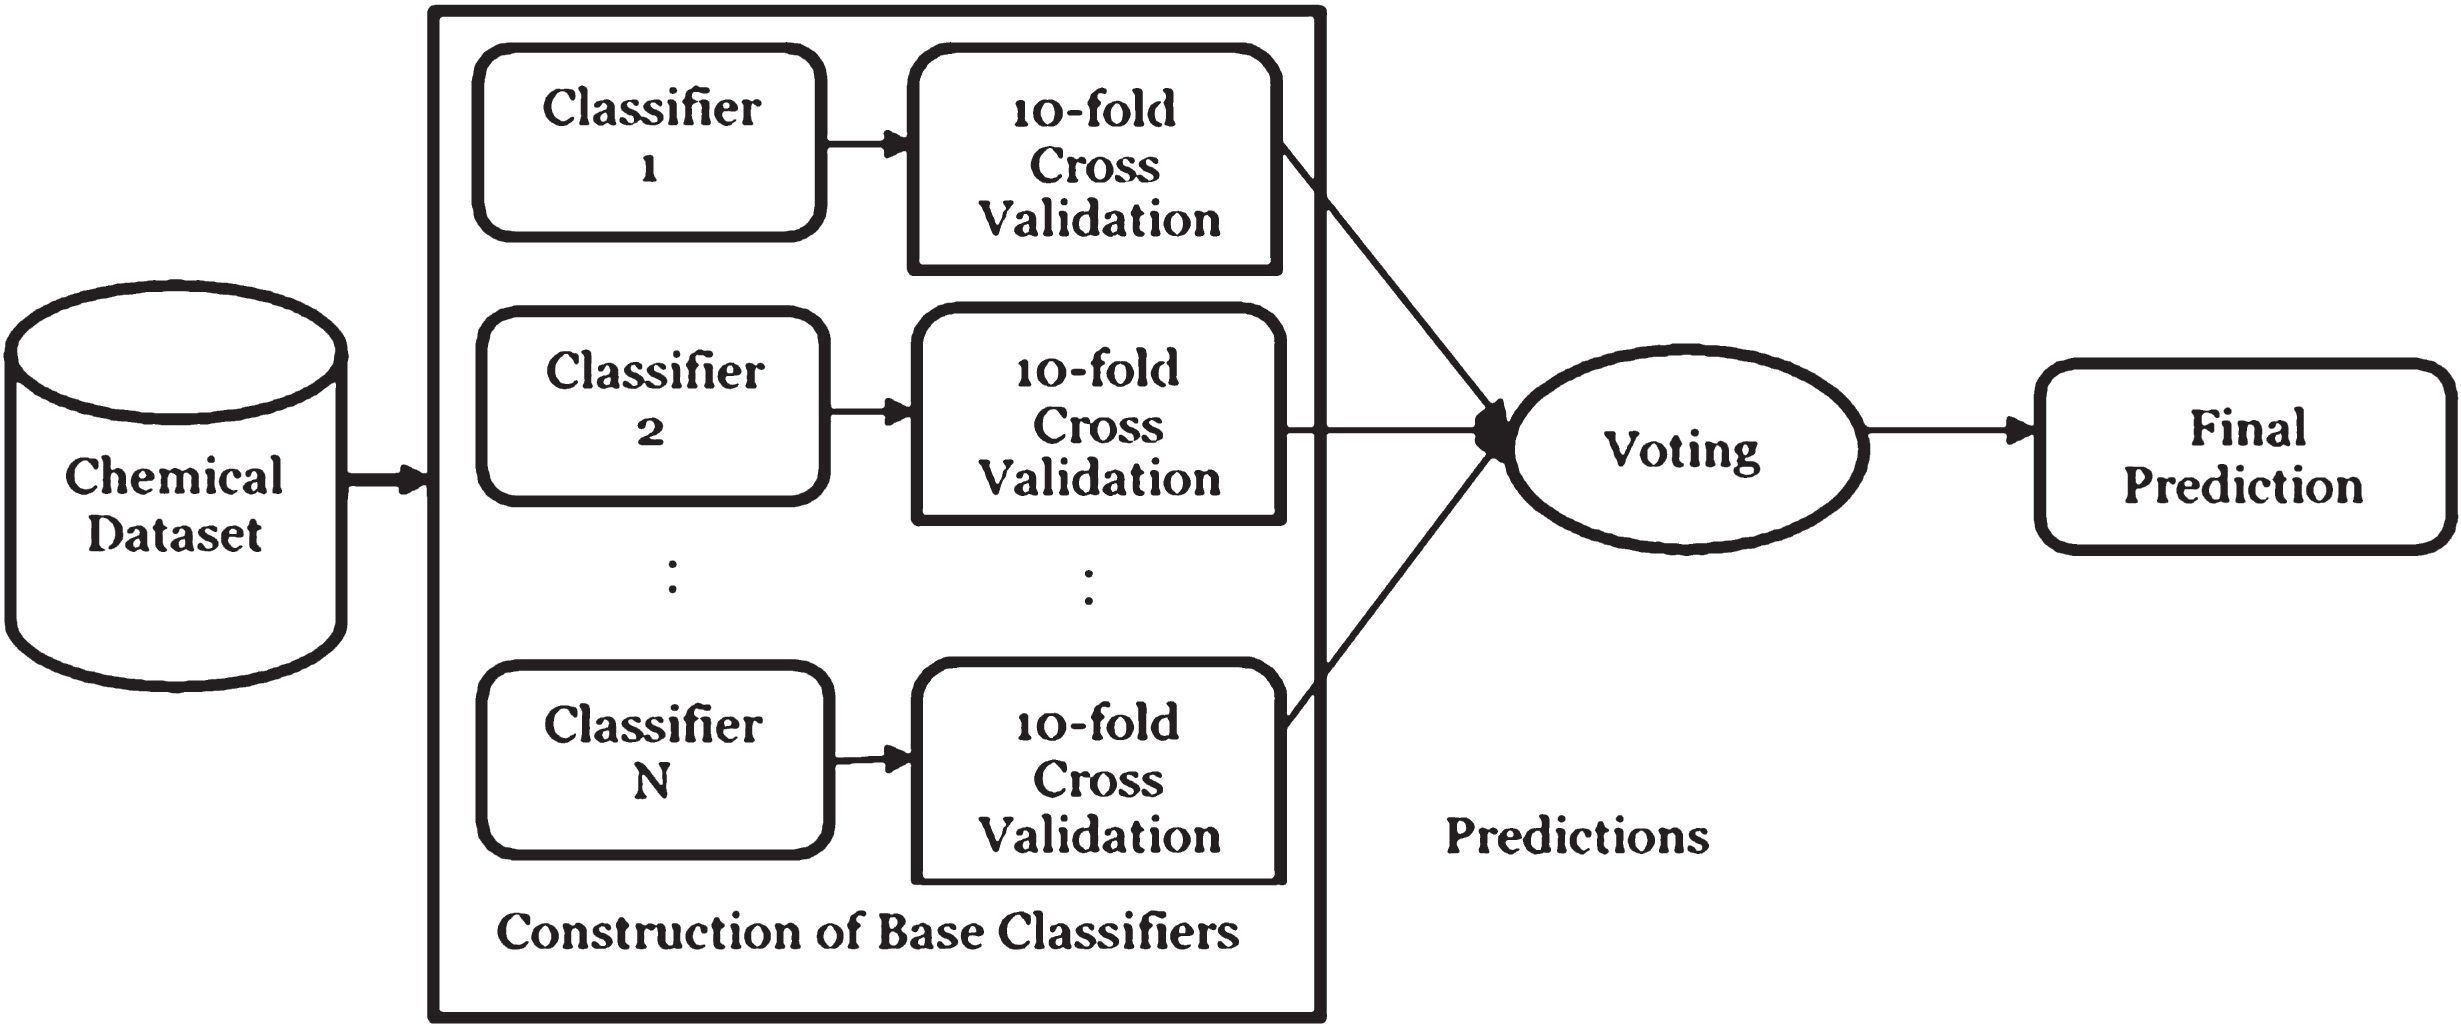
If the final computed class probability of an instance is given by LC
i
(X), the final prediction of the ensemble of classifiers is given as:
The classifiers were evaluated based on six different evaluation metrics. These metrics are generally used in evaluating the performance of a classifier. They are accuracy, sensitivity, specificity, precision, recall, and f-measure. Accuracy of a classifier is also known as the overall recognition rate of the classifier. It refers to the predictive abilities of the classifier. It is the percentage ratio of correctly classified instances. Sensitivity can be referred to as true positive recognition rate. It is the percentage ratio of positive instances which are correctly classified as positive or the measure of positives correctly identified as such. It depicts how much the classifier avoids false negatives. Specificity is known as true negative recognition rate. It is the percentage ratio of negative instances which are correctly identified as negative or the total measure of negatives correctly classified as such. It depicts how much the classifier avoids false positives. Precision is a measure of exactness. It shows the percentage ratio of instances which are classified as positive and are actually positive. It is based on relevance. That is, how relevant are the instances classified as being positive? Recall is a measure of exactness. It shows how many of the actual positives are predicted to be such. Recall and Precision are both combined into a single metric known as the F-measure. The F-measure is the harmonic mean of both recall and precision and the approximate average of both precision and recall. The F-measure is also known as F1, since recall and precision are evenly weighted. It can be a bias evaluation metric.
The performance of a classifier or built model cannot be determined based on the training data but on the test data, which have class-labelled instances that were not part of the training data. The 10-fold cross validation was used in this instance to validate the performance of the classifiers. The effectiveness of an evaluation metric is shown when the distribution of the class is relatively balanced. The general formula of the evaluation metrics of a classifier from the confusion matrix is given as:
Accuracy of Majority Voting with Different Base Classifier Combination for Dataset DS1
Accuracy of Majority Voting with Different Base Classifier Combination for Dataset DS2
Accuracy of Majority Voting with Different Base Classifier Combination for Dataset DS3
Tables 4 and 6 show that the combination of Support Vector Machine, Decision Tree, k-Nearest Neighbour, and Random Forest as the base classifiers gave the best accuracy of 97.1546% and 95.6816% for datasets DS1 and DS3 respectively, for the majority voting. In Table 5, which shows the results of dataset DS2, the combination of all the base classifiers, Support Vector Machine, Decision Tree, Naïve Bayes, k-Nearest Neighbour, and Random Forest gives the best accuracy of 98.3081% compared to all other combinations. Since majority voting makes the overall prediction based on the prediction of the base classifiers, the presence of a non-suitable individual result will affect its accuracy. Therefore, when building a model with the majority voting method, it is essential to choose base classifiers whose accuracy as individual classifiers is good, so that majority voting makes the overall accuracy better. The comparison between the selected individual/base classifiers and the majority voting combination with best accuracy is shown in Tables 7, 8, and 9, for datasets DS1, DS2, and DS3 respectively.
Performance Comparison Between Individual Classifiers and Majority Voting for DS1
Performance Comparison Between Individual Classifiers and Majority Voting for DS2
Performance Comparison Between Individual Classifiers and Majority Voting for DS3
Majority Voting had the best performance in accuracy, sensitivity, precision, recall, and f-measure in datasets DS1 and DS2, as shown in Tables 7 and 8, but in dataset DS3, as shown in Table 9, k-Nearest Neighbor had better specificity compared to Majority Voting. It is also noted that Naïve Bayes had low performance generally in all the datasets and combinations of base classifiers which included Naïve Bayes also had low performance. This shows the importance of selecting good base classifiers to aid better prediction with Majority Voting.
A statistical method, Kendall’s Coefficient of Concordance, also known as Kendall’s W test, was used to rank the classifiers using the evaluation metrics as the raters and the results for the three datasets are shown in Table 10. Kendall’s W gives the measurement of agreement, which shows how well the raters agreed on the ranking of the objects of consideration. Kendall’s W ranges from 0 to 1. When W is 0, it means there was no agreement between the raters, while 1 means there was perfect agreement between the raters.
Ranking of Methods for datasets DS1, DS2, and DS3 with Kendall’s W Test
The test ranked Majority Voting highest in all the datasets examined. Moreover, the W, which signifies the level of agreement between the raters, is between 0.953 and 0.984 for the three datasets. Thus, apart from the evaluation metrics used, statistically, Majority Voting also performed better than the other classifiers with a high level of W, which signifies an almost perfect agreement between the raters.
Drug discovery is an important aspect of chemoinformatics and bioactive molecule prediction is an integral step that needs to be undertaken to avoid resource wastage. Machine learning algorithms are introduced to handle the complex chemical data and several algorithms have been used, even though none can claim superiority over the other. Furthermore, the combinations of more than one classifier or an ensemble, have shown better accuracy than single classifiers. This research has utilized majority voting, which is frequently used in other areas but hardly ever for prediction in chemoinformatics. The results show that majority voting has better accuracy compared to single classifiers, provided the right base classifiers are chosen. The method is also suitable in handling high-dimensional datasets which are both homogeneous and heterogeneous. It is therefore recommended as a suitable method in drug discovery for bioactivity prediction, to avoid wastage of resources and accommodate both homogeneous and heterogeneous chemical datasets, however diverse these might be.
Footnotes
Acknowledgments
This work is supported by the Ministry of Higher Education (MOHE) and Research Management Centre (RMC) at the Universiti Teknologi Malaysia (UTM) under the Research University Grant Category (VOT Q. J130000.2528.16H74).