
Abstract
This paper focuses on the theoretical method which could analysis the punching shear strength and deformation capacity. Based on the crack image and load-deformation relationship of laboratory experiments and big data mining of gathered database, the bending-shearing critical crack method (BSCCM) is developed to give the mechanical explanation of punching shear phenomenon in interior slab-column connections without shear reinforcement. According to the tests, the BSCCM assumes that the punching shear force is resisted mainly by the shearing-compression zone of the critical crack section and requires the knowledge of the demand curve and capacity curve of load-deformation relationship of the critical crack, the intersection between the two curves are the punching shear strength and deformation capacity. The capacity curve is defined by layer model of shearing-compression zone based on the biaxial strength theory of concrete. The demand curve is defined by equilibrium of forces in slab sector. The BSCCM also includes flexure-shear crack propagation mechanism, an assumed curvature distribution and the judgment method of critical crack. For engineering practice, two modification factors involving in the size effect and dowel action are also introduced. In the last, an overall process and the global flow chart are demonstrated for illustrating the BSCCM.
Introduction
Reinforced concrete (RC) flat plate structure has proven to be the most appropriate ceiling system for structural and industrial engineering, because there are no visible beams, column capitals, nor drop panels, making the simplicity both for construction (less formwork, simple reinforcement) and use (easy placement of equipment and pipeline installation), meanwhile making the highly space utilization (decreasing storey height significantly, arranging partition freely). However, the flat plate structure is susceptible to punching shear failure at slab-column connection under bending-shearing composite forces. Once punching shear failure happened, it makes gravity redistribution, worse still, the structure may progressive collapse [6, 55], as shown in Fig. 1.
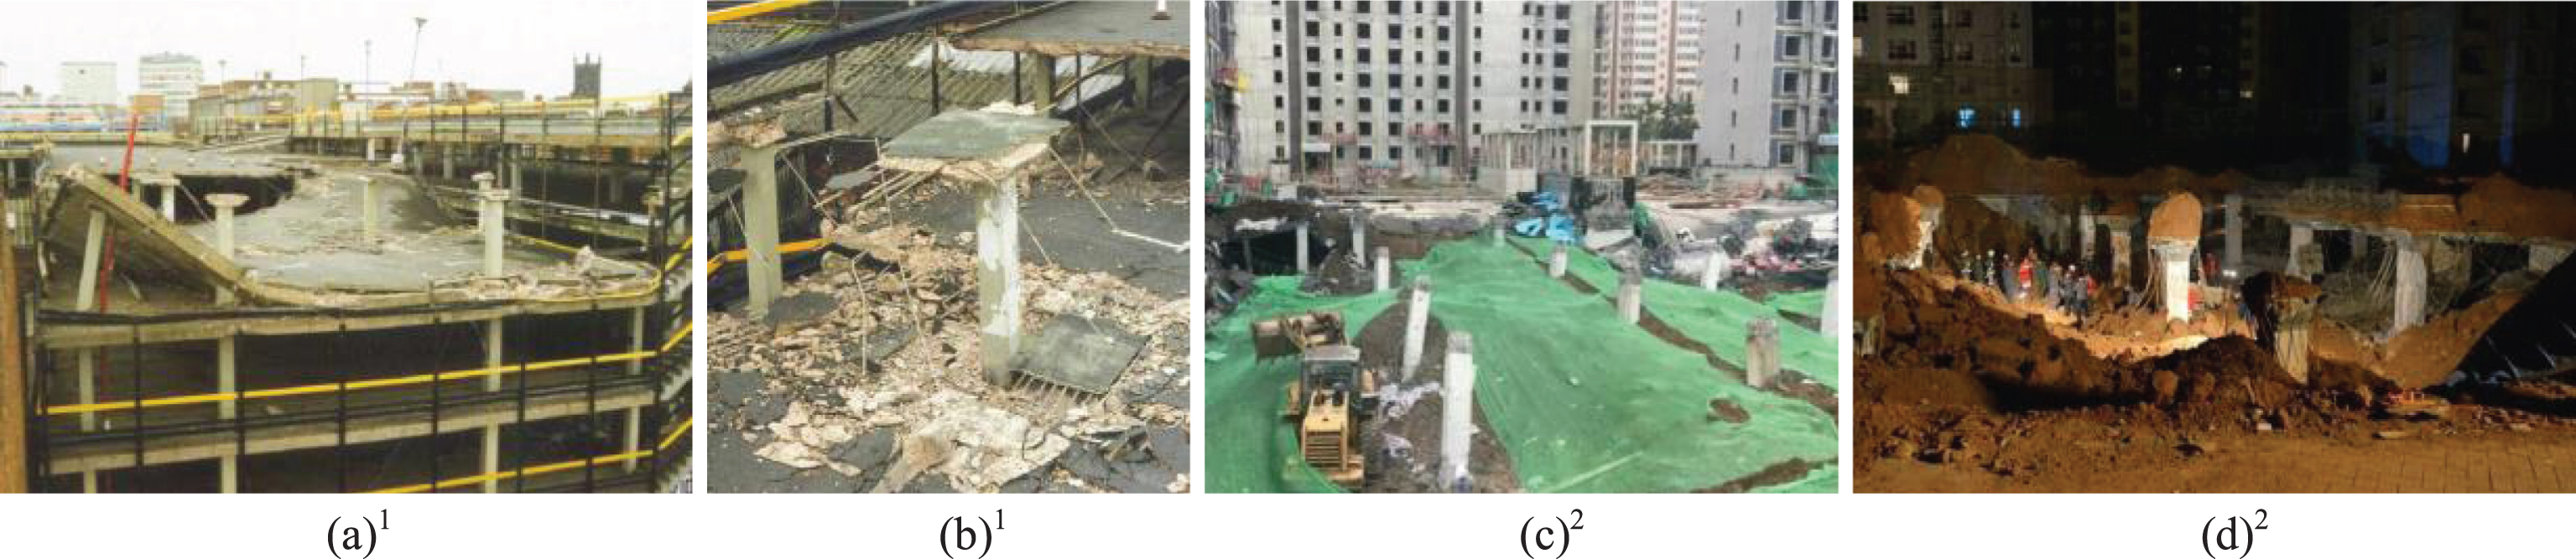
Punching failure and progressive collapse. 1Top storey collapse at public carpark in Wolverhampton (UK, 1997). 2Garage collapse in Beijing (2017) and Jinan (2014), respectively, the pictures obtained from China Emergency Service Platform.
In the late 1940’s, RC flat plate structures were initially developed in the U.S. Elstner and Hognestad [21] realized that the flat plate concept was rather daring because the design code provisions for the shear capacity were based on tests with thick column footings. Since then, more than five hundred laboratory experiments have been conducted to investigate the punching shear behavior of two-way RC slabs at interior supports [14]. In general, most researches distinguished the controlling factors of punching shear strength based on regression analysis of experimental data and elastic theory, and formulated all the controlling factors empirically to calculate the punching shear strength. Until now, most structural design codes judge punching shear failure by the nominal stress in the critical section. However, there are divergences in aspects of position of the critical section, shape of the critical section, calculation method of the nominal stress, value of the ultimate stress and other controlling factors [26, 30], as shown in Table 1 and Fig. 3.
Specifications of different Codes for punching shear strengtha
aThe units in Table 1 are MPa and mm; bWhen f cu < 25MPa, f cu = 25; and f cu ≤ 40MPa; cd x and d y are the effective height in two orthogonal directions; df t , , f ck , f cu are the axial tension strength, cylinder compressive strength, eigenvalue of compressive strength, cubic (150 mm×150 mm×150 mm) compressive strength, respectively; ec1 and c2 are the long side and short side of rectangular column, respectively, when c1/c2 < 2, c1/c2 = 2, and c1/c2 = 2 for the round column; the functions in Table 1: f1 = 0.4 + 1.2/(c1/c2); f2 = 0.5 + 0.25α s d/u; f3 = 0.166 + 0.332/(c1/c2); f4 = 0.166 + 0.083α s d/u; f5 = 1/[1.5 + 43.2r s f y /(16 + d g )/E s ]; f6 = (100ρ) 1/3; f7 = 0.19 + 0.38/(c1/c2); f8 = 0.19 + 0.1α s d/u; f9 = 1 +1/[1 + 0.5 (c1 + c2)/d]; where α s is 40 for interior columns, 30 for edge columns, 20 for corner columns; ρ is the reinforcement ratio; r s denotes the position where the radial bending moment is zero with respect to the support axis; f y is the yield strength of steel; d g is the maximum size of the aggregate; E s is the elastic modulus of steel.
The allowable stresses method is convenient for practice design but cannot give the mechanical explanation of the punching shear failure. More and more researchers have developed various theoretical models for predicting the punching shear strength of slab-column connections [39]. Hawkins and Corley [31], Rangan and Hall [60], Alexander and Simmonds [2], Luo and Durrani [46], Desay and Seshadri [18] developed and improved beam analogy model. Lim and Rangan [45], Sherif [62], Andra [5], Alexander and Simmonds [3] proposed a strut-and-tie model for slab-column connections which allow the clear distribution of forces for rotation-symmetric cases. Yankelevsky and Leibowitz [71], Nielsen [54] developed strength models based on the theory of plasticity. Johansen [34], Bazant and Cao [7] presented practice design equations based on the plastic yield line theory and fracture mechanics, respectively. Polak [58, 59], Hueste et al. [32], Kang et al. [36], Ying Tian et al. [66], Coronelli [17] and Ying Tian [65] performed nonlinear finite element analysis of punching shear failure of slab-column connections with different software and elements, and investigated the contribution of various factors to the punching shear strength. Although the models mentioned above were based on a theoretical background, the predictions do not agree well with the results of tests because the models did not properly consider the effects of all the major parameters.
On the other hand, with the development of disaster prevention and mitigation strategy, the cost-benefit criterion and performance-based seismic design require deformation and force demands for different seismic hazards, and also require deformation and force capacities for various performance levels. Thus, the deformation of slab-column connection should be analyzed and quantified. Even if in regions of high seismic risk where moment frames or shear walls are provided as the main lateral-force-resisting system, the deformation compatibility should be also required for slab-column connection. However, the models mentioned above cannot calculate the punching shear strength and deformation capacity simultaneously.
ASCE/SEI 41 (2007) [22] and FEMA 356 (2000) [25] are the latest in a series of documents developed to assist engineers with the seismic assessment and rehabilitation of existing buildings. ASCE/SEI 41 provides a performance-based engineering framework for flat plate structure. However, there are limited data available on the performance of existing components, and no reliable model applied in the development of the performance-based design, the documents including ACI 318(2014) [1] give different clause about the drift ratio (DR = story sideway/story height) of flat plate structure at punching failure, show as Fig. 2. Theory-based improvements are needed to promote more accurate assessment of load-deformation relationship of the slab-column connection and thereby to develop the performance-based design of flat plate structure.

Modeling parameter for reinforced concrete slab-column connection.

Position and shape of the critical section.
In the past few years, several load-deformation models of the slab-column connections have been promoted. Park et al. [56] introduced the Rankine’s failure criteria to consider the interaction between compressive normal stress and shear stress and improved the compressive force path concept (which presented by Kotsovos [40, 41]) to evaluate the punching shear strength of slab-column connections.
In 1960, Kinnunen and Nylander [38] introduced a landmark approach by studying the sector elements between the radial flexural cracks in the test specimens. The punching shear strength of a slab depends on the slab deformation and punching occurs, according to the sector model, when the tangential compression strain and the radial inclined compression stress in the slab near the column simultaneously reach critical values. Thus far, this proposal remains one of the best models for the phenomenon of punching. And later researchers have been devoted to expand the validity borders for their tests. In 2008, for the interior slab-column connections without shear reinforcement, Muttoni [52] proposed the Critical Shear Crack Theory (CSCT) for a rotation-symmetric case based on the achievements of Walraven [69], Reineck [61], Muttoni and Schwartz [53] and considered the angle of all the critical sections as 45°. He adopted the proportionality between the internal forces and the rotation angle (ψ) and proposed an empirical criterion validated by test results under the assumption of a relationship between the punching shear strength and the width of a critical shear crack (ψd).
In the present study, based on the concepts of compressive force path and sector model, the bending-shearing critical crack method (BSCCM) for punching issues of interior slab-column connections without shear reinforcement is presented. The BSCCM theoretically describes the development of flexure-shear crack, the relationship between the punching shear strength and punching deformation and a critical crack judgment method, and also, it accounts for size effect and dowel action.
Introduce the bending-shearing critical crack method
Carlos et al. [14] gathered more than 500 laboratory experiments of two-way RC slabs at interior supports without shear reinforcement. Although there are differences in the aspects of concrete strength, reinforcement ratio, reinforcement yield strength and structural member geometric among the tests, there are also some similarities among the load-deformation curves (Fig. 4) and the development of the cracks (Fig. 5). As shown in Fig. 4, stage I: start loading to initial cracking; stage II: initial cracking to yielding of the column edge steel; stage III: yielding of the column edge steel to yield-line arising; stage IV: yield-line arising to failure caused by excessive deformability or crack width exceed allowable value. It can be found that there exist three types of failure modes in the tests of RC slabs, i.e., flexural failure, flexural-punching failure and punching failure [44, 72].
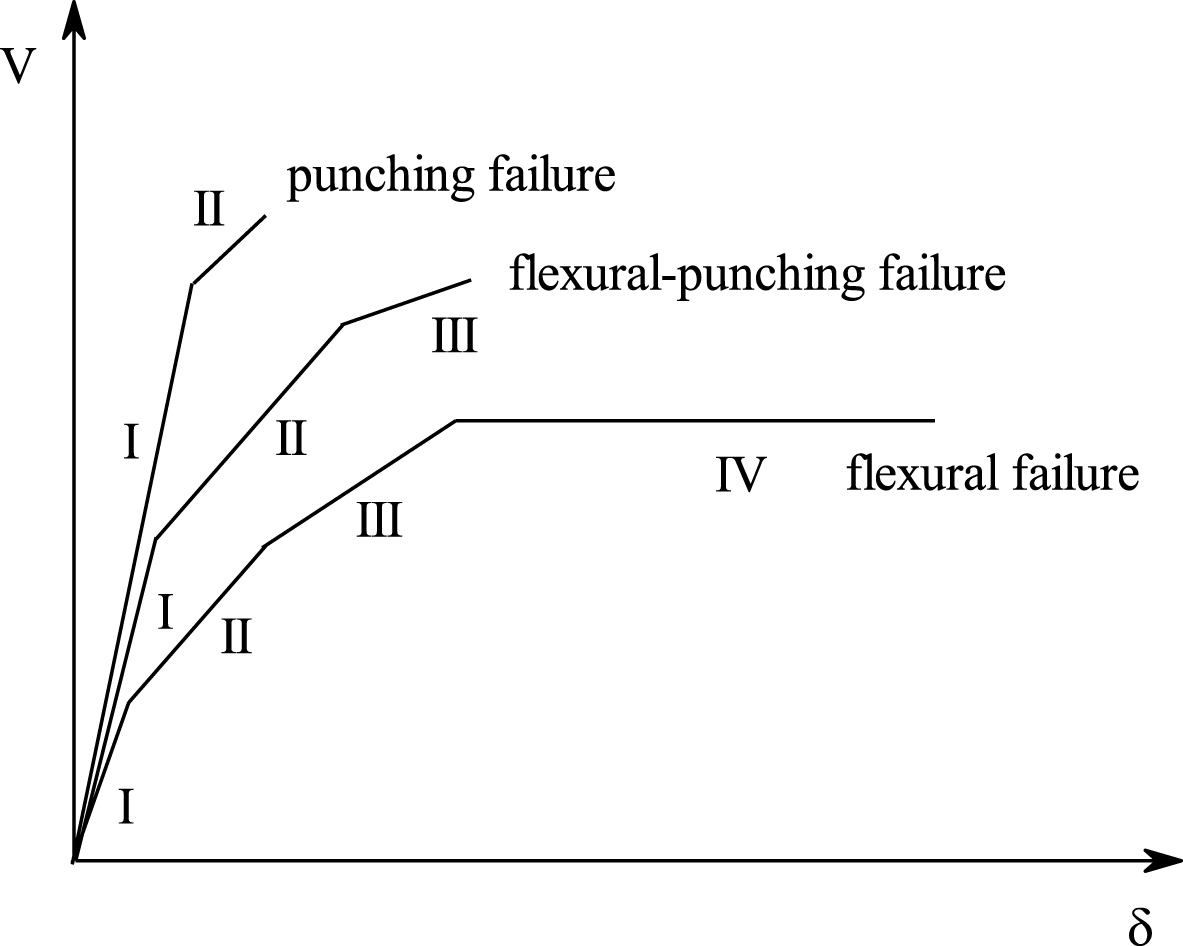
Failure modes and load-deformation curve.
For the punching failure, the punching shear strength can be determined from the shear strength of the shearing-compression zone, punching failure occurs before any yielding of the reinforcement and when a conical plug of concrete suddenly perforates the slab above the column and exhibits a sudden reduction of load-deformation curve (Fig. 4). As shown in Fig. 5(a), the slab has widespread surface cracks and the crack width remains small.
Flexural failure is due to the formation of a yield-line mechanism, the strength of slab-column connection is controlled by the compression strength of the concrete at column edge, with yielding of the entire flexural reinforcement the slab has undergone large deformation and had a long plateau region before punching (Fig. 4). The surface cracks are concentrated into the yield lines and the crack openings are large, as shown in Fig. 5(b).
For the ordinary range of reinforcement ratio, the failure type is flexural-punching failure, which between the punching failure and flexure failure. The failure occurs before yielding of the entire slab reinforcement, and the punching shear strength is controlled combinedly by the shear strength of the shearing-compression zone and the compression strength of the concrete at the column edge.
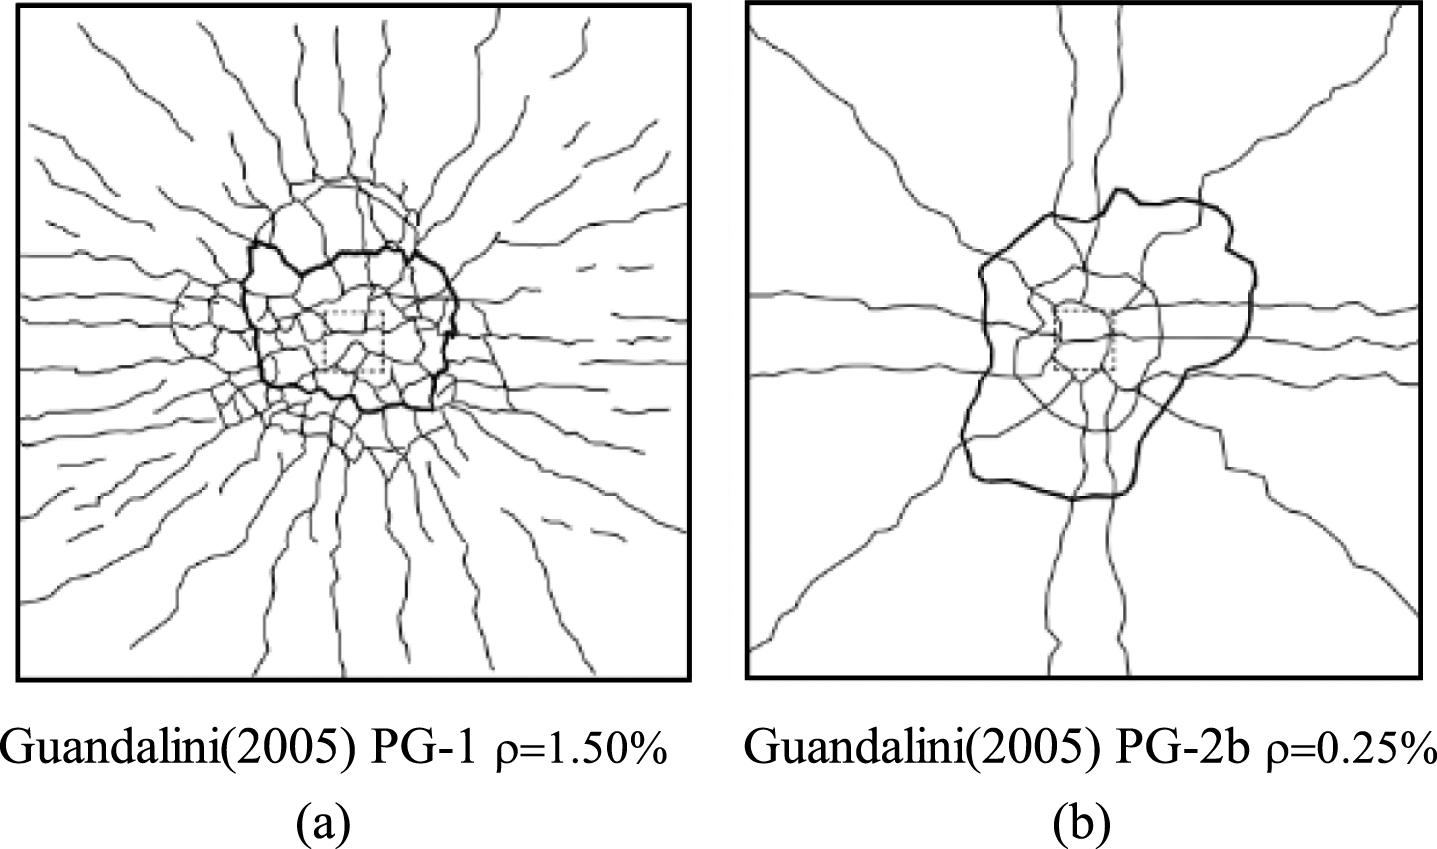
Typical crack of slab-column connection punching test.
From the test phenomenon, there are flexural cracks and deformation prior to the critical crack and punching failure. With the flexure crack penetrates into the slab, the shearing-compression zone and shear strength decrease and the slab deformation increases. That is, the punching shear issue is kind of the spatial shear issues which affected both by the flexure effect and shear effect [24, 56].
Therefore, in the present study, based on the biaxial strength theory of concrete, the BSCCM which refines the shearing-compression zone and establishes the analysis method for punching shear strength and deformation is applied to the punching behavior of slab-column connection. The proposed model is compatible with the fundamental concrete properties: a crack propagates in the direction of the maximum principal compressive stress and opens in the orthogonal direction [40, 42].
In a slab subjected to a concentrated load with the boundary supported, the flexure cracks will appear from the column edge to the support gradually. Each flexure crack corresponds to the specific shearing-compression zone and the specific shear strength and each flexure crack might become the critical crack. Figure 6 shows the solution of the BSCCM, the shear strength and deformation of each crack are determined at the intersection (1, 2, k ...) of the capacity curve (which decreases with the deformation) and the demand curve (which increases with the deformation). The flexure crack section where the shear strength is minimum is regard as the critical section. The punching shear strength and deformation of the slab-column connection are defined as the shear strength and deformation of the critical section, respectively. As shown in Fig. 6, the punching shear strength and deformation of the slab-column connection are controlled by section k which is the critical section.
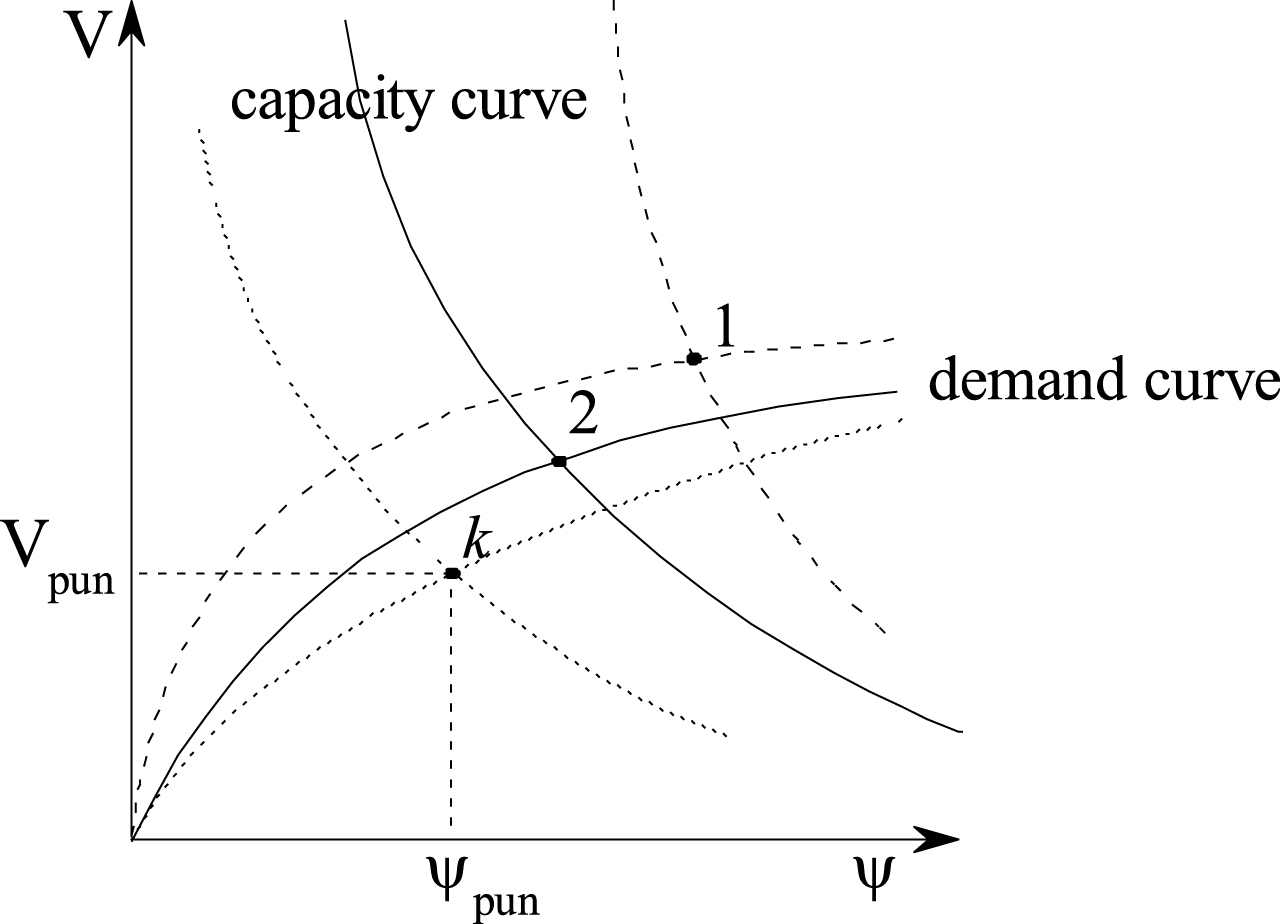
The capacity curve and demand curve of BSCCM.
In the present study, the biaxial strength criteria of concrete, the refined layer model of shearing-compression zone, the distribution of the curvature, the judgment of the critical section and the consideration of size effect and dowel action will be all described below, all these fundamental elements constitute the BSCCM.
In the present study, for the slabs without shear reinforcement, according to the tests phenomenon, the flexure crack will be prior to the punching failure, and once the flexural crack initiates, the inclined flexure crack rapidly propagates to the neutral axis of the cross section without a significant increase of the applied force [4, 47], the applied shear force is resisted mainly by the shearing-compression zone which is below the neutral axis.
The shearing-compression zone of a slab-column connection has a three-dimensional stress due to radial and tangential compression and the normal shearing (Fig. 7(a)). Although the interaction between the stress components must be considered to accurately evaluate the punching shear strength of the slab-column connection, according to Kupfer et al. [43], W F Chen [16] and Broms [10], the strength increase for a biaxially loaded specimen is only approximately 15 percent of that of a uniaxially loaded specimen and, the concrete tensile strength under biaxial compression-tension is not likely to be significantly different from that under uniaxial compression-tension [56]. For these reasons, in the BSCCM, it is assumed the biaxial compression-shear stresses is simplified as uniaxial compression-shear stresses (Fig. 7(b)).
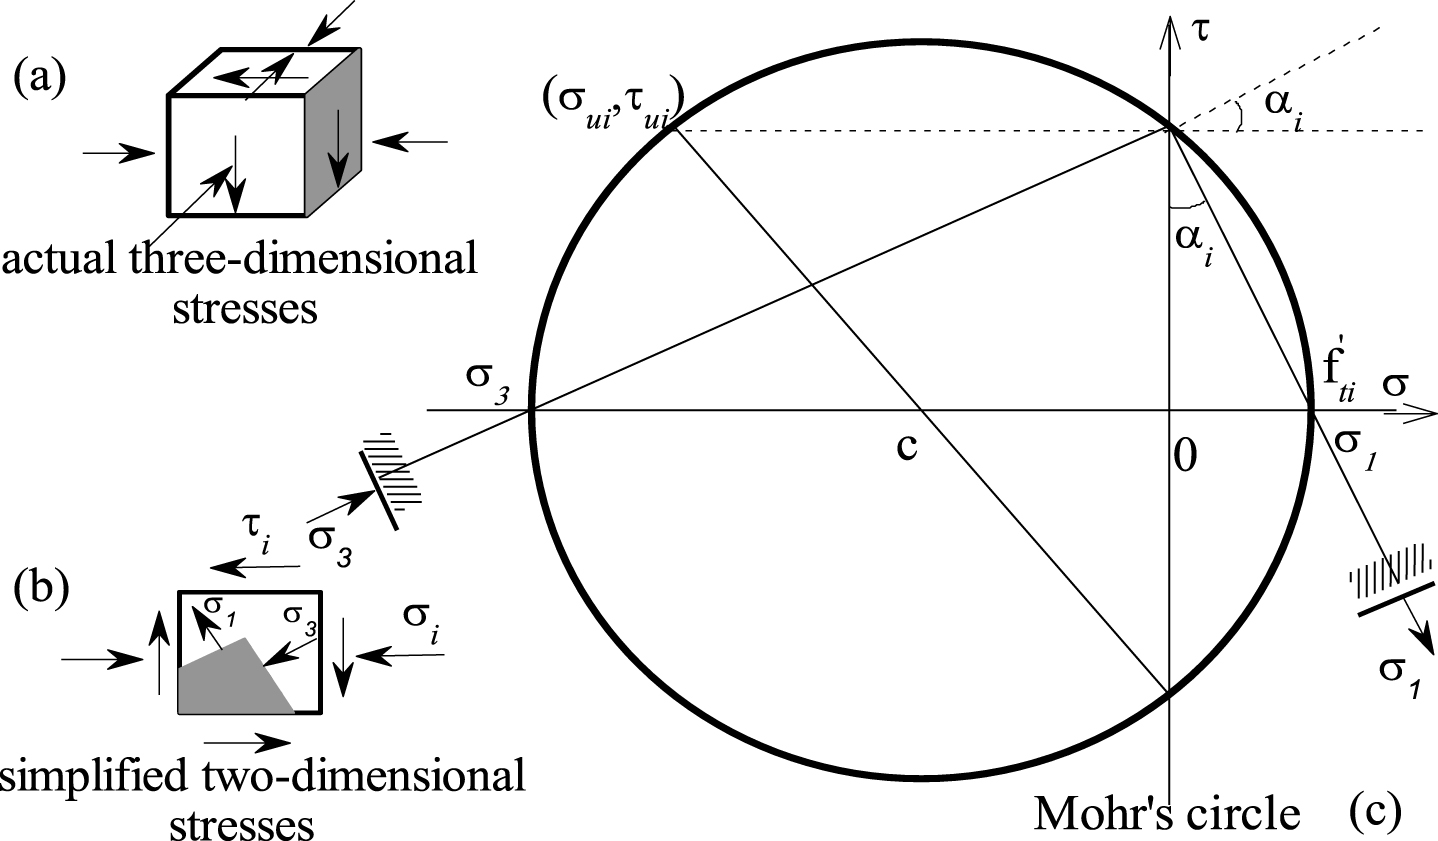
Failure criteria of concrete.
According to the assumption, to define the failure criteria of the shearing-compression zone which subjected to the combined compressive and shear stresses, the principal stress failure criteria in tension or compression [16] are used:
Where σ
i
and τ
i
are the compressive normal stress and the shear stress of arbitrary micro-unit i, respectively. And σ1 and σ3 are the principal tensile and compressive stresses, respectively. The positive of σ
i
means tension and the positive direction of τ
i
is shown in Fig. 7(b). According to the theory of plasticity [16], when or , the micro-unit concrete gets failure. Therefore, the maximum shear stress capacity τ
ui
for arbitrary micro-unit i under compressive normal stress σ
ui
can be defined as a function of σ
ui
:
Where
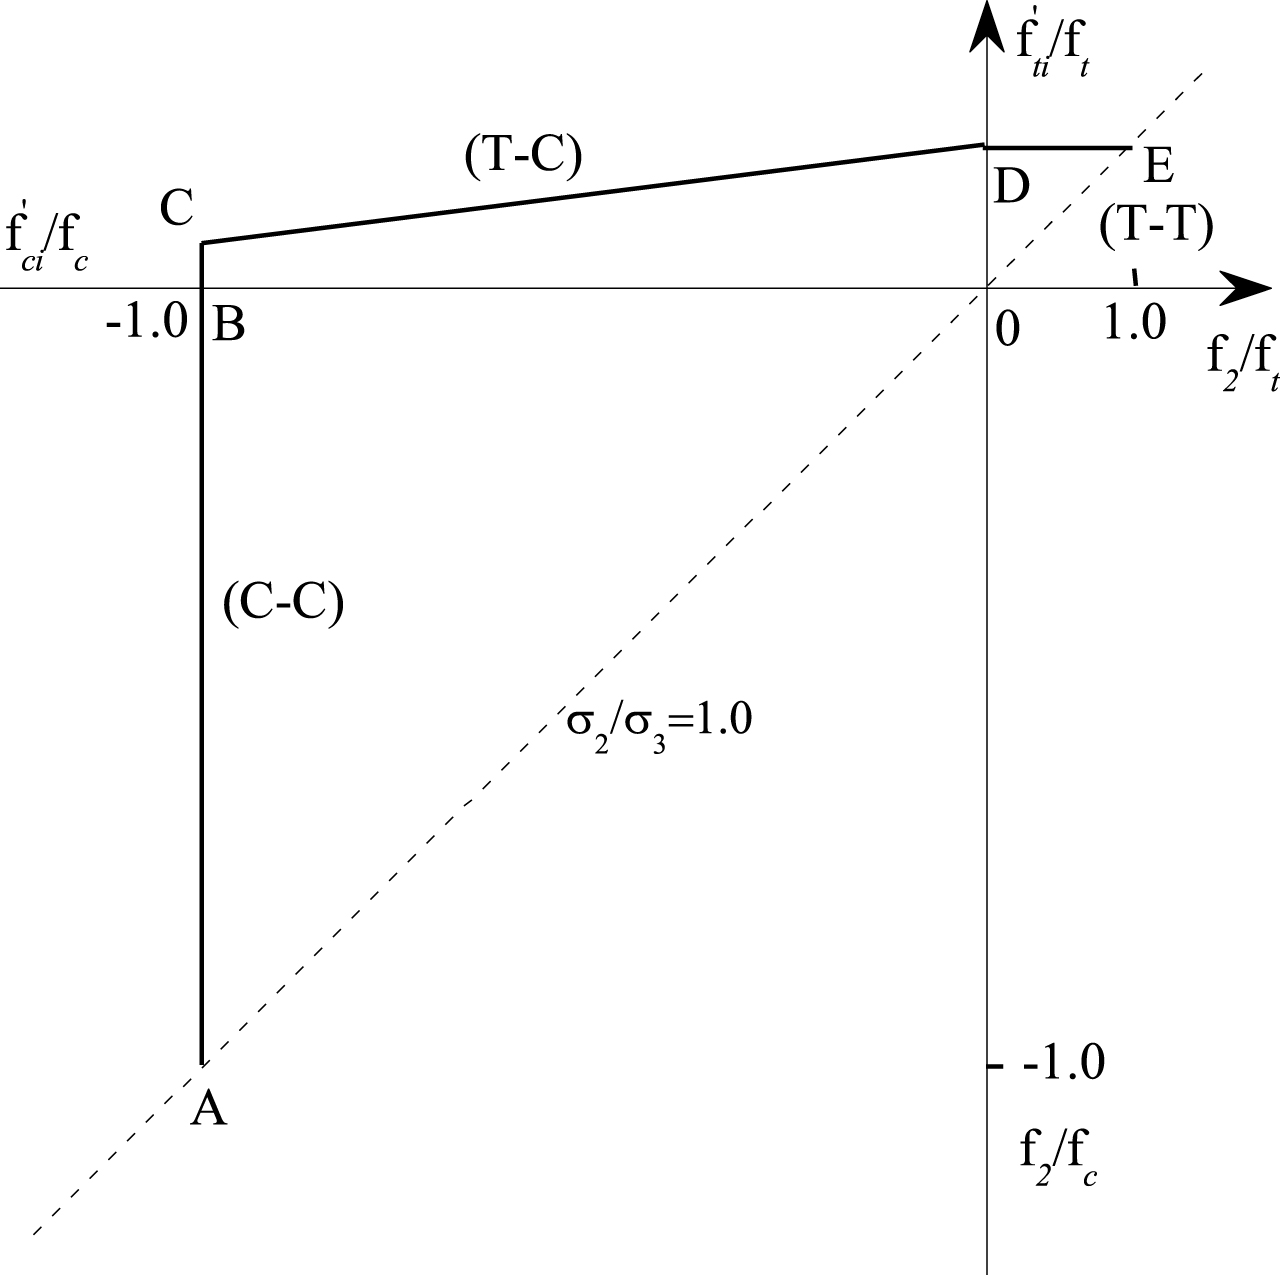
Plane stress failure criteria of concrete.
Where f c (<0) and f t (>0) are the nominal compressive and tensile strength of the concrete, respectively. Throughout this paper, compression and tension are defined with negative and positive signs, respectively. And σ1i and σ3i are the principal tensile and compressive stresses of arbitrary micro-unit i, respectively.
The present study focuses on the slab-column connections without shear reinforcement, there is no strong constraint with the concrete, therefore, the Hognestad model (Fig. 9(a)) is adopted as the concrete constitutive model:
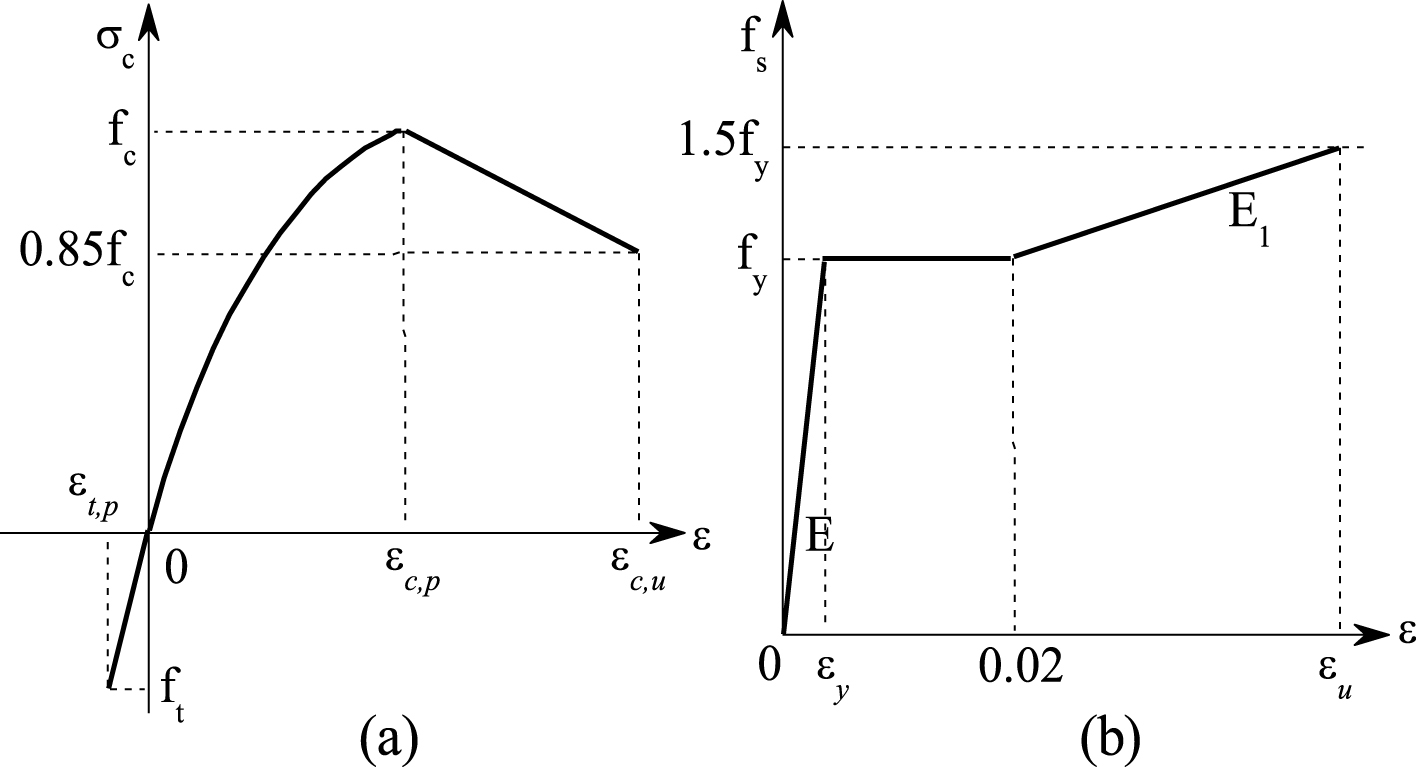
Constitutive model: (a) Hognestad model for concrete; (b) Trilinear model for steel.
Where ɛc,p, ɛc,u, ɛt,p are the peak compressive strain, the ultimate compressive strain and the peak tensile strain of the concrete, respectively. And f c is the concrete strength of the standard cylinder (φ150 × H300).
Considering the hardening stage, the reinforcement adopts the trilinear model (Fig. 9(b)):
Where ɛ u and ɛ y are the ultimate and yield strain of the steel, respectively. And E1 = 6.25f y , ɛ u = 0.1, ɛ y = f y /E, when there is no test data for elasticity modulus E, E = 200GPa.
Park et al. [57] developed an analytical method employing the layer model to predict the shear strength of prestressed concrete beams. In the present study, to define the failure mechanism of the shearing-compression zone subject to the combined stresses, the theory of plasticity is used and the refined layer model is proposed.
As show in Fig. 10(a), a flexure crack initiates at a location r = r k and propagates to the neutral axis (N.A) at D k , where the compressive normal stress is zero. Park et al. [56] defined the critical section approximately as the cross-section D k F k . While, as the crack penetrates into the shearing-compression zone, compressive normal stress increases and shear stress decreases. Based on the fundamental concrete properties that the crack opens in the direction orthogonal to the principal tensile stress axis, the bending-shearing crack becomes close to the longitudinal axis, as D k H k shown in Fig. 10(a). Therefore, the punching shear failure surface cannot be the section D k F k nor the D k B k (inclination of 45°).

Development of the punching crack: (a) Overview; (b) Layer model of the shearing-compression zone.
Figure 10(b) shows the refined layer model of shearing-compression zone D
k
F
k
BG, and the depth of the shearing-compression zone (d
k
) was divided into n layers with uniform thicknesses. In the propose refined layer model, considering the softening of concrete, once the compressive normal stress
As shown in Fig. 10(b), when the inclined bending-shearing crack (D
k
H
k
) reaches the column edge (H
k
, r = r
c
), the remainder of compression zone (vertical section H
k
B) must be failed in compression crushing, because the inclined cracking (D
k
H
k
) cannot propagate into a column region. Thus, the inclined cracking would propagate along the vertical direction H
k
B. And it is assumed τ
ui
can be determined by the shear capacity controlled by compression. Due to the column edge has a three-dimensional compressive stress, in the present study, not considering the concrete shear capacity reduction (i.e.
When the crack propagates in the slab, once get the compressive normal stress σ
ui
and shear capacity τ
ui
of point i, according to the Mohr’s circle (Fig. 7(c)), the orientation (α
i
) of the inclined bending-shearing crack at each layer is calculated as follows:
Where
As Fig. 10(b) shows, x
i
and d
i
are the distance from the crack point i to the column edge and to the slab bottom, respectively. To obtain the whole crack location, there should know the coordinate (x
i
, d
i
) of all points along the bending-shearing crack, that is:
Where Δh = d k /n is the layer thickness, x1 and d1 are the coordinate of the start point of the shearing-compression zone (i.e. D k in Fig. 10), r c is the radius of the column, v i is the shear strength capacity of each layer, thus the shear strength of the shearing-compression zone is V pun = ∑v i . Each flexure crack corresponds to the specific shearing-compression zone and specific crack path (as Fig. 10(b) shows, the bending-shearing crack might intersect with the column edge at H k or intersect with the slab bottom at H' k ).
To solve Equation (10), firstly, the compressive normal stress σ ui of each point i along the crack D k H k should be known, that is, the radial curvature of each section φi,r should be known; secondly, the coordinate (x1, d1) of start point (D k ) of the shearing-compression zone should be known (shown as in Fig. 10).
As mentioned, the distribution of radial curvature φ r and tangential curvature φ t should be determined. In this section, the data from laboratory test and finite element simulation will be used to clarify the curvature distribution, and in the last, the method to clarify the coordinate of the start point (D k ) of the shearing-compression zone will be proposed.
From the test results [28, 48] (Fig. 11) and nonlinear FEM results (Fig. 12), the radial curvature φ r is concentrated in the vicinity of the column. Outside a location (approximate at a distance d from the column edge, d is the effective thickness of the slab), the radial moment M r , and thus the radial curvature φ r , decreases rapidly. On the contrary, the tangential curvature φ t spreads widely, and thus the tangential moment M t is slow down gradually. Muttoni [52] proposed that the slab portion which is located outside d from the face of the column deforms following a conical shape with a constant slab rotation and in the region inside the radius d, the radial moment is considered constant.
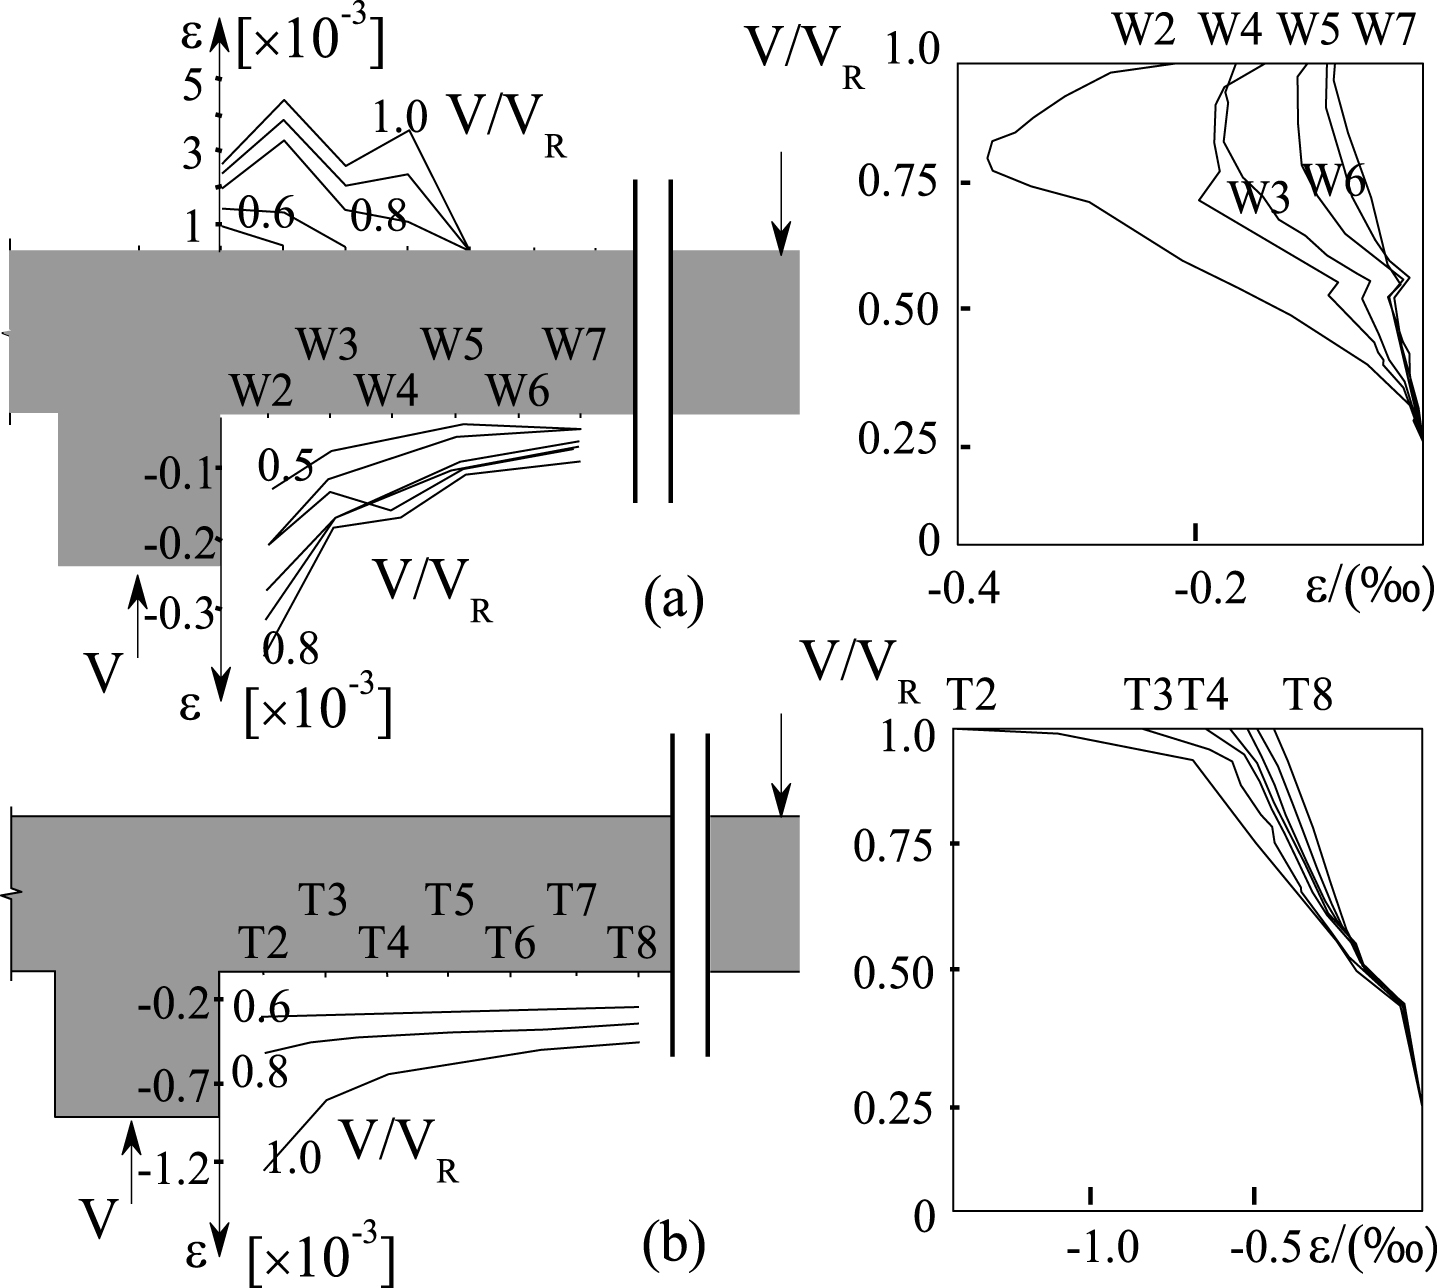

FEM simulation of the curvature distribution.
Based on the results of experiment and FEM, in the present study, when the column edge reinforcement do not yield (i.e. the column edge radial curvature φj,r is smaller than yield curvature φ y ), the distribution of radial curvature φr,r and tangential curvature φr,t are calculated by elastic shell theory [67] (Fig. 13(a)). While, when the column edge reinforcement yields (i.e. the column edge radial curvature φj,r is larger than yield curvature φ y ), it assumes that in the region of r ≤ r c + d, φr,r = φr,t = φj,r, and in the remainder region r > r c + d, φr,r is calculated by the elastic shell theory [67], φr,t = φj,r (r c + d)/r (r is the section radius), that is φr,t follows a hyperbolic distribution [28] (Fig. 13(b)).
Assumption of curvature distribution.
How to determine the start point (D k ) of bending-shearing zone? The bond strength between reinforcement and concrete controls the initiation of flexure cracks, as shown in Fig. 10(a), C1 … C i , Ci+1, C k … C e will appear from the column edge to support gradually. For each flexure crack, the shearing-compression zone is below the neutral axis and the shearing-tension zone is above the neutral axis. In the present study, for developing a practical analysis method, the straight line C k D k with inclination of 45° is adopted to replace the iteration curve C k D k which characterizes the shearing-tension crack. For the first crack that outside the column edge C1, the height of the neutral axis d1 can be calculated by the column edge radial curvature φj,r, and the vertical line C1D1 intersects with the neutral axis at D1 and D1 is the start point of shearing-compression zone. For the other crack C k (the radius is r k ), the height of the neutral axis d k can be calculated by the radial curvature at the radius r k - d/2, and the straight line C k D k with inclination of 45° intersect with neutral axis at D k and D k is the start point of shearing-compression zone.
The flexure cracks will appear from the column edge to support gradually. One of the cracks will become the critical crack which control the punching shear strength and deformation capacity of slab-column connection. The location and inclination of the critical section characterize the punching failure; thus, it has great value to determine the critical section (i.e. critical crack).
Throughout the researches in the past, nearly all the researchers and institutions adopted the critical crack as a straight section with a fixed inclination (as BC e in Fig. 10(a)). As shown in Table 1, the Codes adopted different inclination, from 26.6° (BS EN 1992-1-1:2004) to 63.4° (ACI318-14, GB50010-2010). The researchers adopted 26°(Li et al. [44]), 26.6°(Park et al. [56]), 25°(Broms [9]), 30°(Cai et al. [12], Theodorakopoulos et al. [64], Yu [72]), 34°(Menetrey [49]), 45°(Muttoni [52], Yang et al. [70]). However, by a series of punching tests which including 12 slabs, Menetrey [50] investigated the relationship between flexural and punching failure, and concluded that the transition between flexural and punching failure was controlled by the punching crack inclination. Guandalini [29] demonstrated the visible punching crack by cutting the slab after the tests (as shown in Fig. 14(b)), it was shown that the shape of the punching crack was rather different from one test to another, and the average slopes vary between 22 and 40° relative to a horizontal plane.
The fixed inclination cannot correctly characterize the critical section nor the failure type. This paper attempts to adopt the refined layer model (as described above) to analysis and determinate the critical punching section.
With the load increases, the moment-gradient will increase and the column edge section will appear flexure crack firstly (as C1 in Fig. 10(a)). And then, because of the bond failure between concrete and steel, the flexure cracks will appear from the column edge to support gradually. This process is similar to which in beam, Ding [19] proposed the average crack spacing (l
cr
) in flexure member based on large amount of beam tests data.
Where d s is steel diameter (mm), ρ is the reinforcement ratio and k s = 1.0 for plain bar, k s = 0.7 for ribbed bar. To study whether the Equation (11) is suitable for the slab-column connection, in the present study, five representative slab-column connections were selected (specimen R2, R3 from Matthys and Taerwe [48] and specimen PG-1, PG-4, PG-10 from Guandalini [29], as shown in Fig. 14). Among the specimens, the steel diameter belongs in 8∼25 mm, the concrete strength belongs in 27.6∼35.1 MPa, and the reinforcement ratio belongs in 0.25% ∼1.79%. As Fig. 14 shows, the calculated results by Equation (11) are in good agreement with the average crack spacing measured from tests. In the following, Equation (11) will be adopted to calculate the flexure crack spacing in slab-column connection. Although the flexure cracks will appear from the column edge to support gradually, from the tests results [29, 55] and elastic shell theory [67], the inclination of the critical section will not smaller than 20°, that is, the potential zone (shown as AC e in Fig. 10(a)) of critical section will not beyond d · ctg 20° from the column edge.
As Fig. 10(a) shows, supposing the first flexure crack appears at the column edge, and the last flexure crack will not beyond C e (AC e = d · ctg20°), the spacing of all the flexure crack is l cr from Equation (11). According to the proposed method above, for a given radial curvature of column edge φj,r, the distribution of radial curvature φr,r and tangential curvature φr,t will be known, and the punching capacity V jk of each flexure crack r k can be calculated. And repeat the process, the capacity curve and demand curve of each flexure crack can be drawn. As Fig. 6 shows, the shear strength and deformation of each crack is determined at the intersection (1, 2, k ...), the flexure crack section where the shear strength is minimum (point k) is regard as the critical section. The punching shear strength and deformation of the slab-column connection are defined as the shear strength and deformation of the critical section, respectively. What’s more, the average inclination α of the critical section will be the punching inclination, as shown in Fig. 16.
Many researchers have studied the affection of size effect to the punching behavior and have confirmed the necessity of considering the size effect [7, 63]. Although the methods which considered by the Codes for the size effect are different (as shown in Table 1), the equation k · (h/do) -1/2 is the more used version, where h is the actual size of the structure and d0 is a reference size. Birkle and Dilger [8] studied the influence of slab thickness on the punching shear strength of flat plates by tests and clearly demonstrated the significant effect of slab size on the shear stress resistance. Without regarding the reinforcement ratio (considered in refined layer model), the size factor can be approximately considered as:
In the present study, the size factor suggested by Birkle and Dilger [8] (i. e. Equation (12)) will be adopted, where mm is used in this equation.
Limited by the experimental design and research approaches, earlier researches did not reach an agreement on how the degrees and ways of steel participated in the dowel action. To avoid the conflict, many researchers did not consider the dowel action directly but with other indirection ways, Park et al. [56] multiplied the punching capacity with a coefficient which was more than 1; Muttoni [52] adopted larger friction between cracks to consider the dowel action; Broms [9] neglected the contribution of dowel action; Theodorakopoulos and Swamy [64] considered the dowel action by enlarging the critical section.
Then, after developed the literature review, Jelic et al. [33] realized that the viewpoints from former researchers about contribution of dowel action to shear strength were scattered and even contradictory, through a series of laboratory tests (the total amount of steel of each specimen was equal but with different diameter), it indicated that, area not diameter of steel influenced the punching capacity. In addition, it should be noticed that once the steel which intersect with crack yielded, the dowel action would be decreased, the phenomenon confirmed by experiment and many researchers, thus, the steel stress should be considered when computing the dowel action. The dowel mechanism fails due to horizontal or vertical longitudinal splitting cracks and yielding of the bar [68]. Based on the above conclusions, the yield strength and stress level of bar, tensile strength of concrete, area of bar should be considered when computing the dowel action. In the present study, approach proposed by CEB-FIP model code [15] and Menetrey [49] will be adopted:
Where A c is the area of the section crossing the punching crack, ς = σ s /f y , and σ s is the axial tensile stress in the reinforcing bar, f y is the yield strength, ρ is reinforcement ratio, α is the inclination of punching crack.
The theoretical analysis and computation details are elaborated above. The overall process of capacity curve and demand curve about load-deformation of slab-column connection will be described in this section, and in the last, the flow chart of BSCCM will be presented.
Capacity curve of load-deformation
The calculation steps of load (V
cap
) and rotation (ψ
cap
) of capacity curve are shown as follow: the distribution of radial curvature (φr,r) and tangential curvature (φr,t): according to the assumes presented in Section 2.4, the detail calculation steps are shown as follow (here, only the plastic stage process are discussed, the distribution in elastic stage can be calculated on the basis of theory of plates and shells [67]); the whole iteration begins with an arbitrary value of radial curvature at column edge (φj,r), and select the start point r
k
of an arbitrary flexure crack k (r
k
= l
cr
× k + r
c
, l
cr
from Equation 11); according to the plane cross-section assumption, the radial moment Mj,r corresponding to the radial curvature φj,r can be obtained, and the elastic punching load V
j
can be obtained from Equation (14) which originated from the theory of plates and shells [67].
Where μ is the Poisson ratio of concrete, k = r
q
/r
c
, R
j
= r/r
q
, r
q
and r
c
are the load radius and column radius respectively; according to V
j
and Equation (14), the elastic moment Mr,r in arbitrary location r where r > r
c
+ d can be obtained; according to Mr,r, the radial curvature φr,r at an arbitrary location r (r > r
c
+ d) can be obtained after section iteration within the elastic stage; while for the region r < r
c
+ d, φr,r = φj.r; for the region r < r
c
+ d, the tangential curvature φr,t = φj,r; for the region r > r
c
+ d, φr,t = φj,r · (r
c
+ d)/r; when the curvatures of an arbitrary location determined, according to the plane cross-section assumption, it is easy to obtain the normal stress σ
ui
with section iteration; according to the description in Section 2.4, the start point of flexure-shear zone can be determined; the rotation calculation: on the basis of step ding172, in the present paper, the deflection δ
j
of slab end with an arbitrary column edge radial curvature φj,r can be obtained by integrating φr,r twice, thus, the slab rotation ψ
j
of an arbitrary flexure-shear crack with column edge curvature φj,r is δ
j
/(r
q
- r
c
), where r
q
and r
c
are the load radius and column radius respectively.
In the present study, the proposed method developed based on the standard specimen, that is circular slab and circular column. Select the sector slab as isolation block when the slab-column connection bears the punching load. The distribution stresses of concrete and steel, the resultant force and the diagram of force balance are shown in Fig. 15(a-c), respectively. The central angle of sector block is Δφ, according to the force equilibrium in Fig. 15(c), the moment equilibrium is
Sector model: (a) Stress distribution; (b) Resultant force; (c) Force balance.
Where mr,r (r
k
) and mr,t (r) are the radial moment at the crack section (the radius is r
k
) and the tangential moment from r
k
to r
s
, respectively, and both mr,r (r
k
) and mr,t (r) can be obtained from moment-curvature curve once the radial and tangential curvature distribution curves are known. The demand load
According to the material property, specimen geometric dimension and the constitutive model selected in this study, the ultimate section curvature of φ u can be obtained easily by iterating, and once the column edge curvature φj,r reaches φ u , the whole iteration is over. As shown in Fig. 6, there are specific capacity curve and demand curve which corresponding to each flexure-shear crack r k , and the failure load and rotation (V k , ψ k ) can be obtained from the cross point of the two curves. Furthermore, the final punching load V pun of slab-column connection is the minimum punching value among all the flexure-shear cracks, and the final punching rotation ψ pun is the rotation which corresponding to the final punching load V pun . The flow chart of BSCCM was shown in Fig. 16.
Flow chart of bending-shearing critical crack method.
This paper focused on the theoretical method which could analysis the punching strength and deformation capacity simultaneously. Based on the phenomenon of punching shear tests, this paper presents the bending-shearing critical crack method (BSCCM) for interior slab-column connection without shear reinforcement, including a comprehensive analytical layer model, an assumed curvature distribution, the critical crack judgment method, the size effect and dowel action. In the last, the flow chart of BSCCM is presented. The main conclusions of this paper are: According to the multi-axis strength theory of concrete and the refined layer model, the failure of the RC slab-column connection is kind of the material failure, and the punching shear strength is strongly affected by the size of shearing-compression zone and the crack path; The BSCCM presented in this study could determine the punching strength and deformation capacity simultaneously, and the BSCCM could simulate the crack propagation and the location of critical crack; The punching strength and deformation capacity are considered to be a counter-balance paradox, to increase the shear strength makes decreasing the deformation capacity inevitably, or there should be shear reinforcement; All factors that could increase the depth of compression could increase the punching shear strength; The BSCCM could easily be expanded to eccentric loading condition. The column rotation will increase the rotation of the slab due to concentric gravity load at one half of the slab and decrease it at the opposite half. Punching failure occurs when the sum of the rotations reaches the ultimate rotation of the slab, which is associated with concentric punching failure and could be calculated by BSCCM. Thus, the BSCCM laid a foundation for the performance-based design of flat plate structure.
The verification of BSCCM and parameter analysis can be seen in the subsequent paper.
Footnotes
Acknowledgments
This research was financially supported by the Doctoral Program Foundation of Zunyi Normal College (BS [2015]17#), Youth Scientific Talents Project of Education Department of Guizhou Province of China (Qian Jiao He KY Zi [2016] 257), United Foundation of Science and Technology Department of Guizhou Province of China (Qian Ke He LH Zi [2017] 7083), Cooperative Education Project of Ministry of Education of China (No. 201701074015, No. 201701061006). The authors are grateful to the authorities for their support.