
Abstract
In mobile applications, user behavior clustering analysis divides users into different groups so that operators can provide personalized services, optimize page organization and functional design. On the basis of clickstream and custom event, this paper first proposed two collection schemes and formats of user behavior data, then a two-layer clustering algorithm and a fuzzy clustering algorithm are proposed respectively. The former first-layer clustering adopts an improved DBSCAN algorithm, which replacesthe neighborhood radius with a newly-designed user session similarity and has optimized the merge condition of clusters. While, the latter directly extracts feature vectors of user sessions and use an improved FCM algorithm, where an effective method is used to initialize membership matrix to accelerate the convergence speed and giving a weighted value to membership matrix solves the problem of local optimum. Experimental results show that both algorithms are effective and matches the advance assigned user test distributions, which proves that the two clustering methods are applied to different analysis scenarios, depending on the business requirement of developers.
Introduction
User behavior analysis is one of the most important means to understand users and improve user experience, which learns user’s habits and patterns through statistics and data mining. And these rules can reveal the current issues of apps in page organization, functional design, and marketing strategies so as to help further optimization, innovation and experiential improvement [1].
However, most of research on user behavior analysis still stays at the level of data statistical analysis such as new user volume, start-up times and retention rates. and more and more enterprises and research conduct deeper analysis of user behavior data, including user-page interest analysis, access behavior prediction, frequent sequence mining, conversion rate analysis and user clusteringanalysis.
This article focuses on user clustering analysis based on the historical behavior data, mining the user behavior patterns and interests, and dividing users into different groups so as to provide theoretic guidance for formulating personalized marketing strategies, enhance user stickiness, and finally increase profitability.
The main work of this paper are as follows: In the acquisition of user behavior data, clickstream-based method was used to obtain the page access records with coarse information granularity, and a method based on custom event was proposed to collect the custom functional usage records with finer information granularity. A two-layer clustering algorithm based on clickstream data has been proposed. The first layer was designed to obtain the session clusters, where the domain density radius was replacedwith user session similarity in the improved DBSCAN algorithm, and the merge condition of clusters was optimized to accelerate the convergence speed. User clusters was finally acquired through the second layer clustering using general K-means algorithm. A fuzzy clustering algorithm based on custom events has been proposed. A fast algorithm was used in the initialization of membership matrix to accelerate the convergence and ensure the consistency of optimal solutions. Besides, by assigning a weighted value to the membership matrix, the problem that the algorithm is sensitive to isolated points resulting in local optimum has been lessened.
Related work
Many studies have explored the field of user behavior analysis. At present, there are two main research directions on app-based user behavior analysis: Overall operation situation analysis based on the app indicators (active volume, the number of new users, retention, etc.) and clickstream-based data analysis of users’ usage rules and habits. The issue is the research of customizable user behavior clustering method is relatively less in the domain of mobile app.
There are a lot of research in association rules, sequence patterns, classification and recommendation system based on user access logs and clickstream data. J Yan, Y Qiao et al. [2] proposed and improved Apriori algorithm and applied Hidden Markov Model to predict mobile user behavior based on browsing interests and location. Combining user actions and topological structure, P Srilatha and R Manjula [3] proposed a link forecasting model to predict social network links. Todeal with constraint of services and generates an interesting behavior sequence of mobile users, an interesting user behavior sequence mining framework was presented in [4]. While in recommendation system, R Buettner [5] proposed a personality-based product recommender framework to predict a user’s personality and product preferences.
In terms of user clustering based on clickstream data, P Antonellis, C Makris et al. [6] proposed a three phase processing model for clustering to provide both short-term and long-term results in an online way, while the clickstream data was converted into feature vectors to simplify the calculation of similarity in [7] and a novel Gaussian based similarity measuring method was used in [8]. Different from clustering method, DA Adeniyi, Z Wei et al. [9] trained the KNN classification method to identify clickstream data to a particular user group. In an online learning environment, J Park, K Denaro [10] utilized statistical change detection techniques to investigate students’ online behaviors. In consideration of the time-related character of data, a biclustering framework was proposed with Markov models by V Melnykov [11], in contrast, R Gowri, R Rathipriya [12] proposed MapReduce based genetic algorithm for biclustering.
Considering the idea of hierarchical clustering, T Qin, X Guan et al. [13] developed a multi-level cluster mining framework to measure user’s behavior similarity. While S Alam et al. [14] analyzed the use of Particle Swarm Optimization (PSO) for data clustering in a hierarchical manner.
In respect of graph-based clustering, X Yu et al. [15] proposed an approach to determining favorite web pages by emerging patterns of generated simple page-linked graphs and a spectral clustering method was applied to group the internet traffic of campus networks in [16]. G Wang, X Zhang et al. [17, 18] identified clusters of similar users by partitioning a similarity graph (nodes are users; edges are weighted by clickstream similarity).
Following the principle that the visual interface should provide information at multiple levels of granularityin clickstream analysis: patterns, segments, sequences and events [19], two novel user behavior clustering method based on clickstream and custom event was presented in this paper respectively.
Methodology
This section introduces two data collection schemes and describes the two-layer clustering algorithm based on clickstream data and the fuzzy clustering algorithm based on custom event respectively.
Data collection
Different from web application, it requires different methods to collect app clickstream data according to different operating systems, mainly include android and iOS. While, the custom event data are collected by inserting extra monitoring points code in applications.
Clickstream data
A clickstream record is an overall sequence of multiple ordered web pages when a user visits a website [19]. Similarly, in mobile apps, a clickstream record is an overall user session sequence which consists of multiple ordered app pages when a user visits an app. Clickstream analysis needs to collect the user access information of each page in the session, such as page name, loading time and exit time, and the overall information of the session, such as browsing order of multiple pages.
Page name can be represented by the class name in the code, iOS system can apply the NSStringFromClass ([self class]) method to get the class name, while android system can employ java reflection mechanism to get the current class name. By using the aspect-oriented programming (AOP) method, the inserting code which gets the timestamp before the loading function of page can easily access the page loading time. Specifically, in android system, we can use the tangent and notification mechanism to dynamically change the activity loading process (the called function onCreate()) based on the AspectJ programming framework. While in iOSsystem, it isadvisable to modify the compiled code during program execution owing to the runtime feature of Objective-C. So page loading time can be achieved by replacing the loadView method (i.e., a function used to load page belonging to the UIViewController class) with a function that can get the page loading timestamp at run time. Finally, the user session records based on clickstream can be abstracted as:
Where P
i
represents page name, T
i
represents the loading time of page, null represents the end page name, and Tk+1 represents the moment user exits the app. It is clear that loading time can be converted into dwell time of page:
The overall sequence implies the user’s habit andbehavior pattern, while the dwell time of page reflects the user’s interest in each page.
Custom event data
A custom event is defined as a string that identifies a custom user operation with certain rules, according to the business requirements of developers [20]. A custom operation can be the trigger of a button, a click area or a prompt, and even whether some specific codes are executed, a number of custom events constitute a user’s overall access process.
In practice, the API for collecting custom events is provided to the app operator. Developers can insert a few lines of monitoring code (i.e., plug-in points) into the business process according to the requirements of the configuration document in a certain data format. The user session records based on custom event, similar to clickstream data, can be abstracted as:
Where E
i
represents the name of a custom event, and it may bea blank meaningless event so as to make overall session sequence complete. T
i
represents the loading time of the corresponding custom event, and the last custom event is marked with a null to identify whether user has exited the application. Likewise, loading time can be converted to dwell time of custom event as follows:
The two data collection schemes have certain differences in some respects. Click stream data takes app page as the collection unit with coarse information granularity, which locally reflect the degree of user being interested in pages and imply a user’s browsing habit as a whole, but it’s not customizable and can’t help developers to analysis user behavior patterns for page controls or features. However, custom event data with finer information granularity are highly customizable, and can captureuser’s specific operation on pages so as to dig out user behavior patterns for specific features in pages, finally achieving the purpose of improving the performance and adjusting the organization of page controls.
In addition, clickstream data are saved in the form of sequence with time dimension rather than feature vector, resulting in commonly calculation method of similarity (like Euclidean distance, cosine similarity, etc.) are disabled and the classical clustering algorithms with good effect to feature vector can’t be directly used. However, custom event data are not time dependent, so they can be integrated and processed into feature vectors.
Two-layer clustering algorithm based on clickstream
Similarity of user sessions
Given the discussion from section 3.1.1, it could naturally be assumed that two session sequences of user A, B are as follows:
Putting aside the dwell time attribute, the session is equivalent to the access sequence of pages. Measuring similarity of two sequences is essentially to calculate the similarity of two strings, which can be measured by the longest common subsequence (LCS) utilizing dynamic programming method. Assuming that and Session
B
have a longest common subsequence called Seq
c
=< Pc1, Pc2, …,
P
ck >, the dwell time sequences are and
And then, by adding the importance factor of Seq
c
in the whole session, the similarity of the two user sessions can be illustrated as follows:
Where S
c
represents the similarity of user A, B in the sequence Seq
c
, T
a
and T
b
represent the total access time of Session
A
and Session
B
,
The main purpose of this layer clustering is to divide the session records into different session clusters through an improved DBSCAN algorithm with the help of Equation (1). In traditional DBSCAN algorithm, ɛ-neighborhood of object refers to an object space formed by taking oas the center and ɛ (ɛ > 0) as the radius. MinPts is the threshold of object quantity in the ɛ-neighborhood of object o. If the number of objects in the ɛ-neighborhood of object o is not less than MinPts, then the object ois called Core Object.
The traditional DBSCAN algorithm has two main problems: The similarity of user sessions can’t be measured by the traditional distance-based calculation method; Besides, one session may be simultaneously assigned into different session clusters. So two main improvements are presented as follows: Replace ɛ-neighborhood with r-neighborhood, where r (0 < r < 1) is the session similarity threshold, r-neighborhood refers to an object space, where the similarity between any object and center object o is no more than r, which is calculated through Equation (1). Make the merge condition of two clusters satisfied only when the number of their common objects exceeds λ (0 < r < 1) times the number of objects in their r-neighborhood. Therefore, when λ = 0.5, the cluster formed by the object O and the cluster formed by the object P can’t be merged as shown in Fig. 1(a), which is opposite in Fig. 1(b). So when the situation is shown in Fig. 1(a), the same session will be assigned into multiple different clusters at the same time.
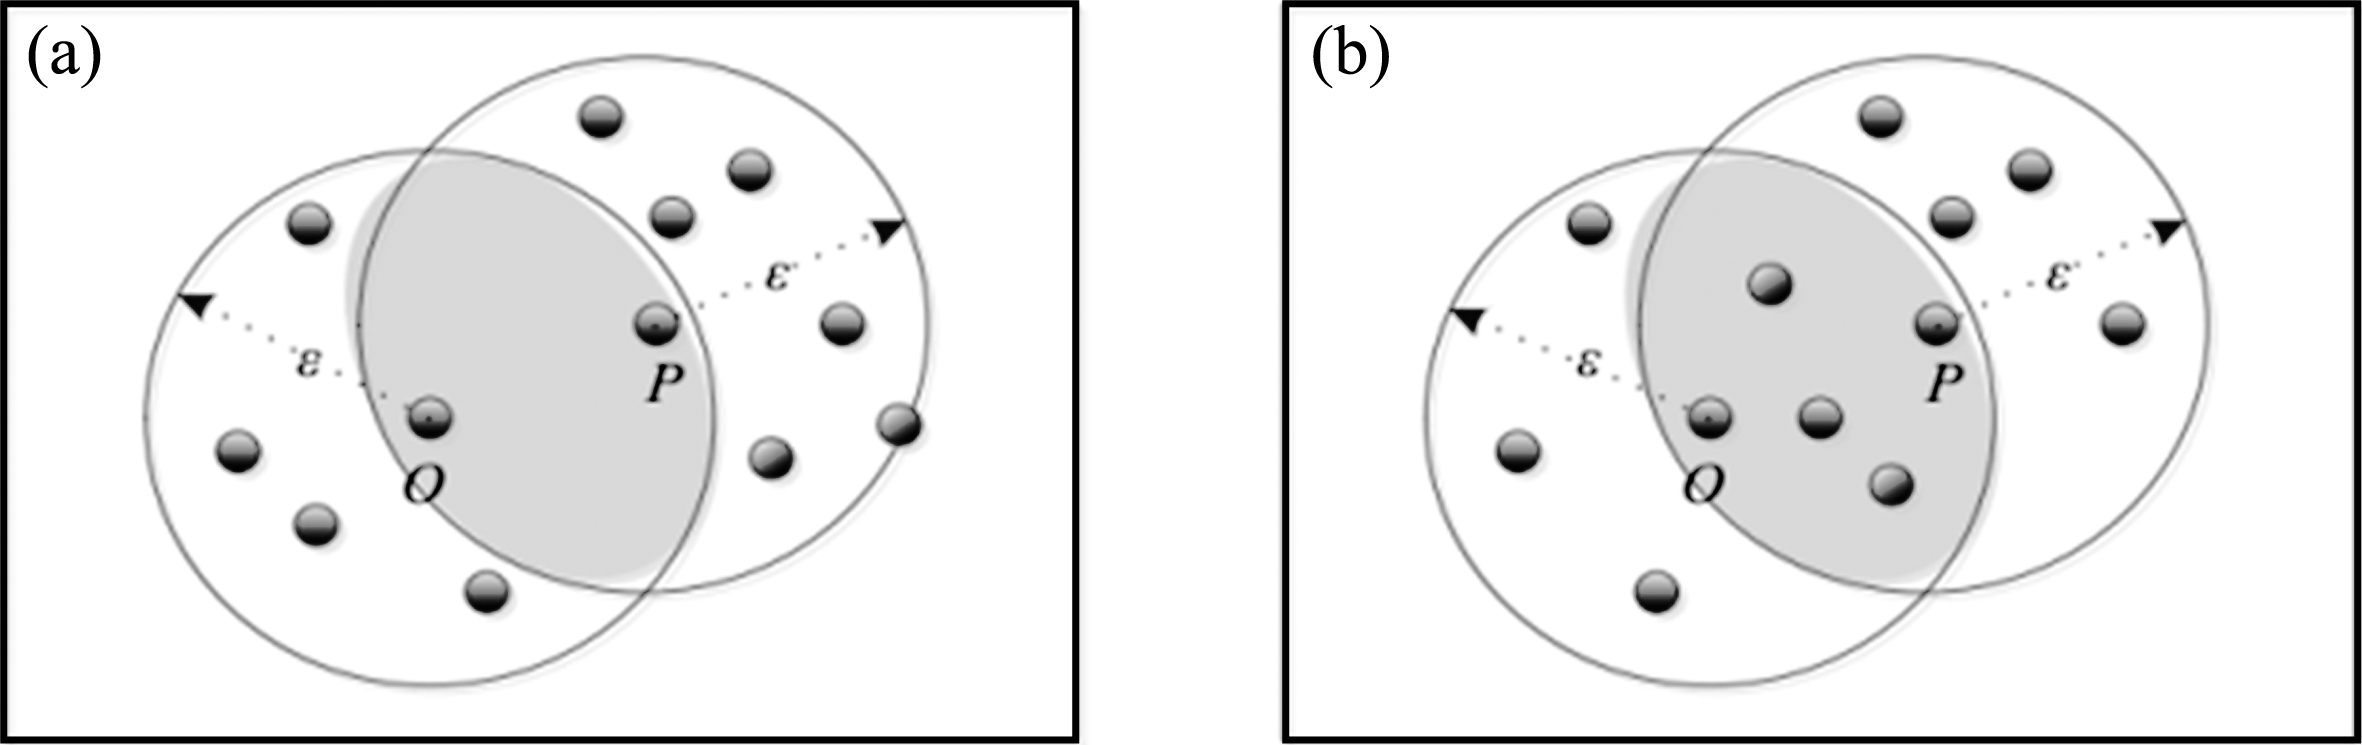
The merge process of DBSCA.
Then, the pseudocode of improved DBSCAN algorithm can be presented as follows:
(1) D: a dataset containing n objects.
(2) r: session similarity threshold.
(3) MinPts: neighborhood density threshold.
(4) DFλ: merging threshold.
(1) Mark all objects in D as unvisited. Define S as the set of clusters and initialize S into empty.
(2)
(3) Mark p as visited.
(4)
(5) Create a new clusterC i , add p, the object in N intoC i , and addC i into S.
(6)
(7)
(8)
(9) MergeC i andC j into a new cluster called C and add C into S.
(10)
(11)
(12) Output S.
Therefore, the improved DBSCAN algorithm can be described in detail: Firstly, all the objects in original dataset are marked as “unvisited”. Then each “unvisited” object are added in the first loop: the object is firstly signed as “visited” and will be determined whether is the core object, all the objects in the r-neighborhood will be added into a newly created cluster, multiple clusters will be obtained until the first loop ends. In the second loop, any two different clusters acquired in the first loop will be merged into new cluster when the number of their common elements is at most times of their own quantity respectively, or they will be independent. Finally, we will get a set of user session clusters.
The users and sessions records are in a one-to-many relationship in the database. All the sessions generated by the same user may be distributed across multiple session clusters obtained in the first layer clustering at the same time. So the feature vectors for users are equivalent to the distribution ratio of their sessions in each session cluster, which can be presented as follows:
Where n represents the quantity of session clusters obtained by the first layer clustering. Therefore, it is efficient to apply K-means algorithm to users clustering since the similarity of two users can be measured using the traditional distance-based similarity calculation method.
So far, the two-layer clustering algorithm based on clickstream data is designed according to the user’s habits and interests to the app pages.
Fuzzy clustering algorithm based on custom event
Extraction of feature vectors
Assuming that all the custom events constitute the set E = {E1, E2, …, E
n
, on the basis of the illustration in section 3.1.2, the integrated session sequence for a user can be processed as follows:
Where C i indicates the overall access times for custom event E i , and t i represents the overall dwell time for custom event E i .
And then the proportion of overall access times and dwell time for, in overall access times and dwell time can be calculated as follows:
Finally, the feature vector of user session calculated by the integrated session sequence is composed by the interest degree of user for E
i
, which is represented by ω
i
:
FCM algorithm is a fuzzy C-means algorithm based on the objective function, the degree of the sample point belonging to a cluster is called the membership of the sample point to the cluster. The objective function j and constraint condition based on the traditional FCM algorithm are presented as follows:
And the iterative formula of C i and u ij can be presented as follows:
Where u ij represents the membership of the sample with subscript j to the cluster with subscript i, mis validity index, k represents the quantity of clusters, X j = 1, 2, …, n represents the feature vector of the sample obtained by Equation (2), C i , i = 1, 2, …, k are defined as the feature vector of cluster center point.
The improved FCM algorithm has two main improvements: Optimize the initialization of u
ij
. X
j
is divided into the cluster Index + 1 by using the formula Index = J % k, then the feature vector of the cluster center point is Make a little revision for the membership u
ij
. There may be some outliers in the user behaviors. The membership of the outliers to any cluster is 1/k, which may lead to a deviation of clustering results. So it is essential to make a little revision for the membership u
ij
as follows:
The first improvement is effective to accelerate the convergence of algorithm and ensure the consistency of optimal solutions. Meanwhile, it is obvious that the second revision further weaken the contribution to the cluster center for those outliers, so the problem that the algorithm is sensitive to isolated points resulting in local optimum has been lessened. Furthermore, the new iterative formula of cluster center point can be presented as follows:
Given the discussion and improvements above, the implementation flow of improved FCM clustering algorithm is shown as Fig. 2.
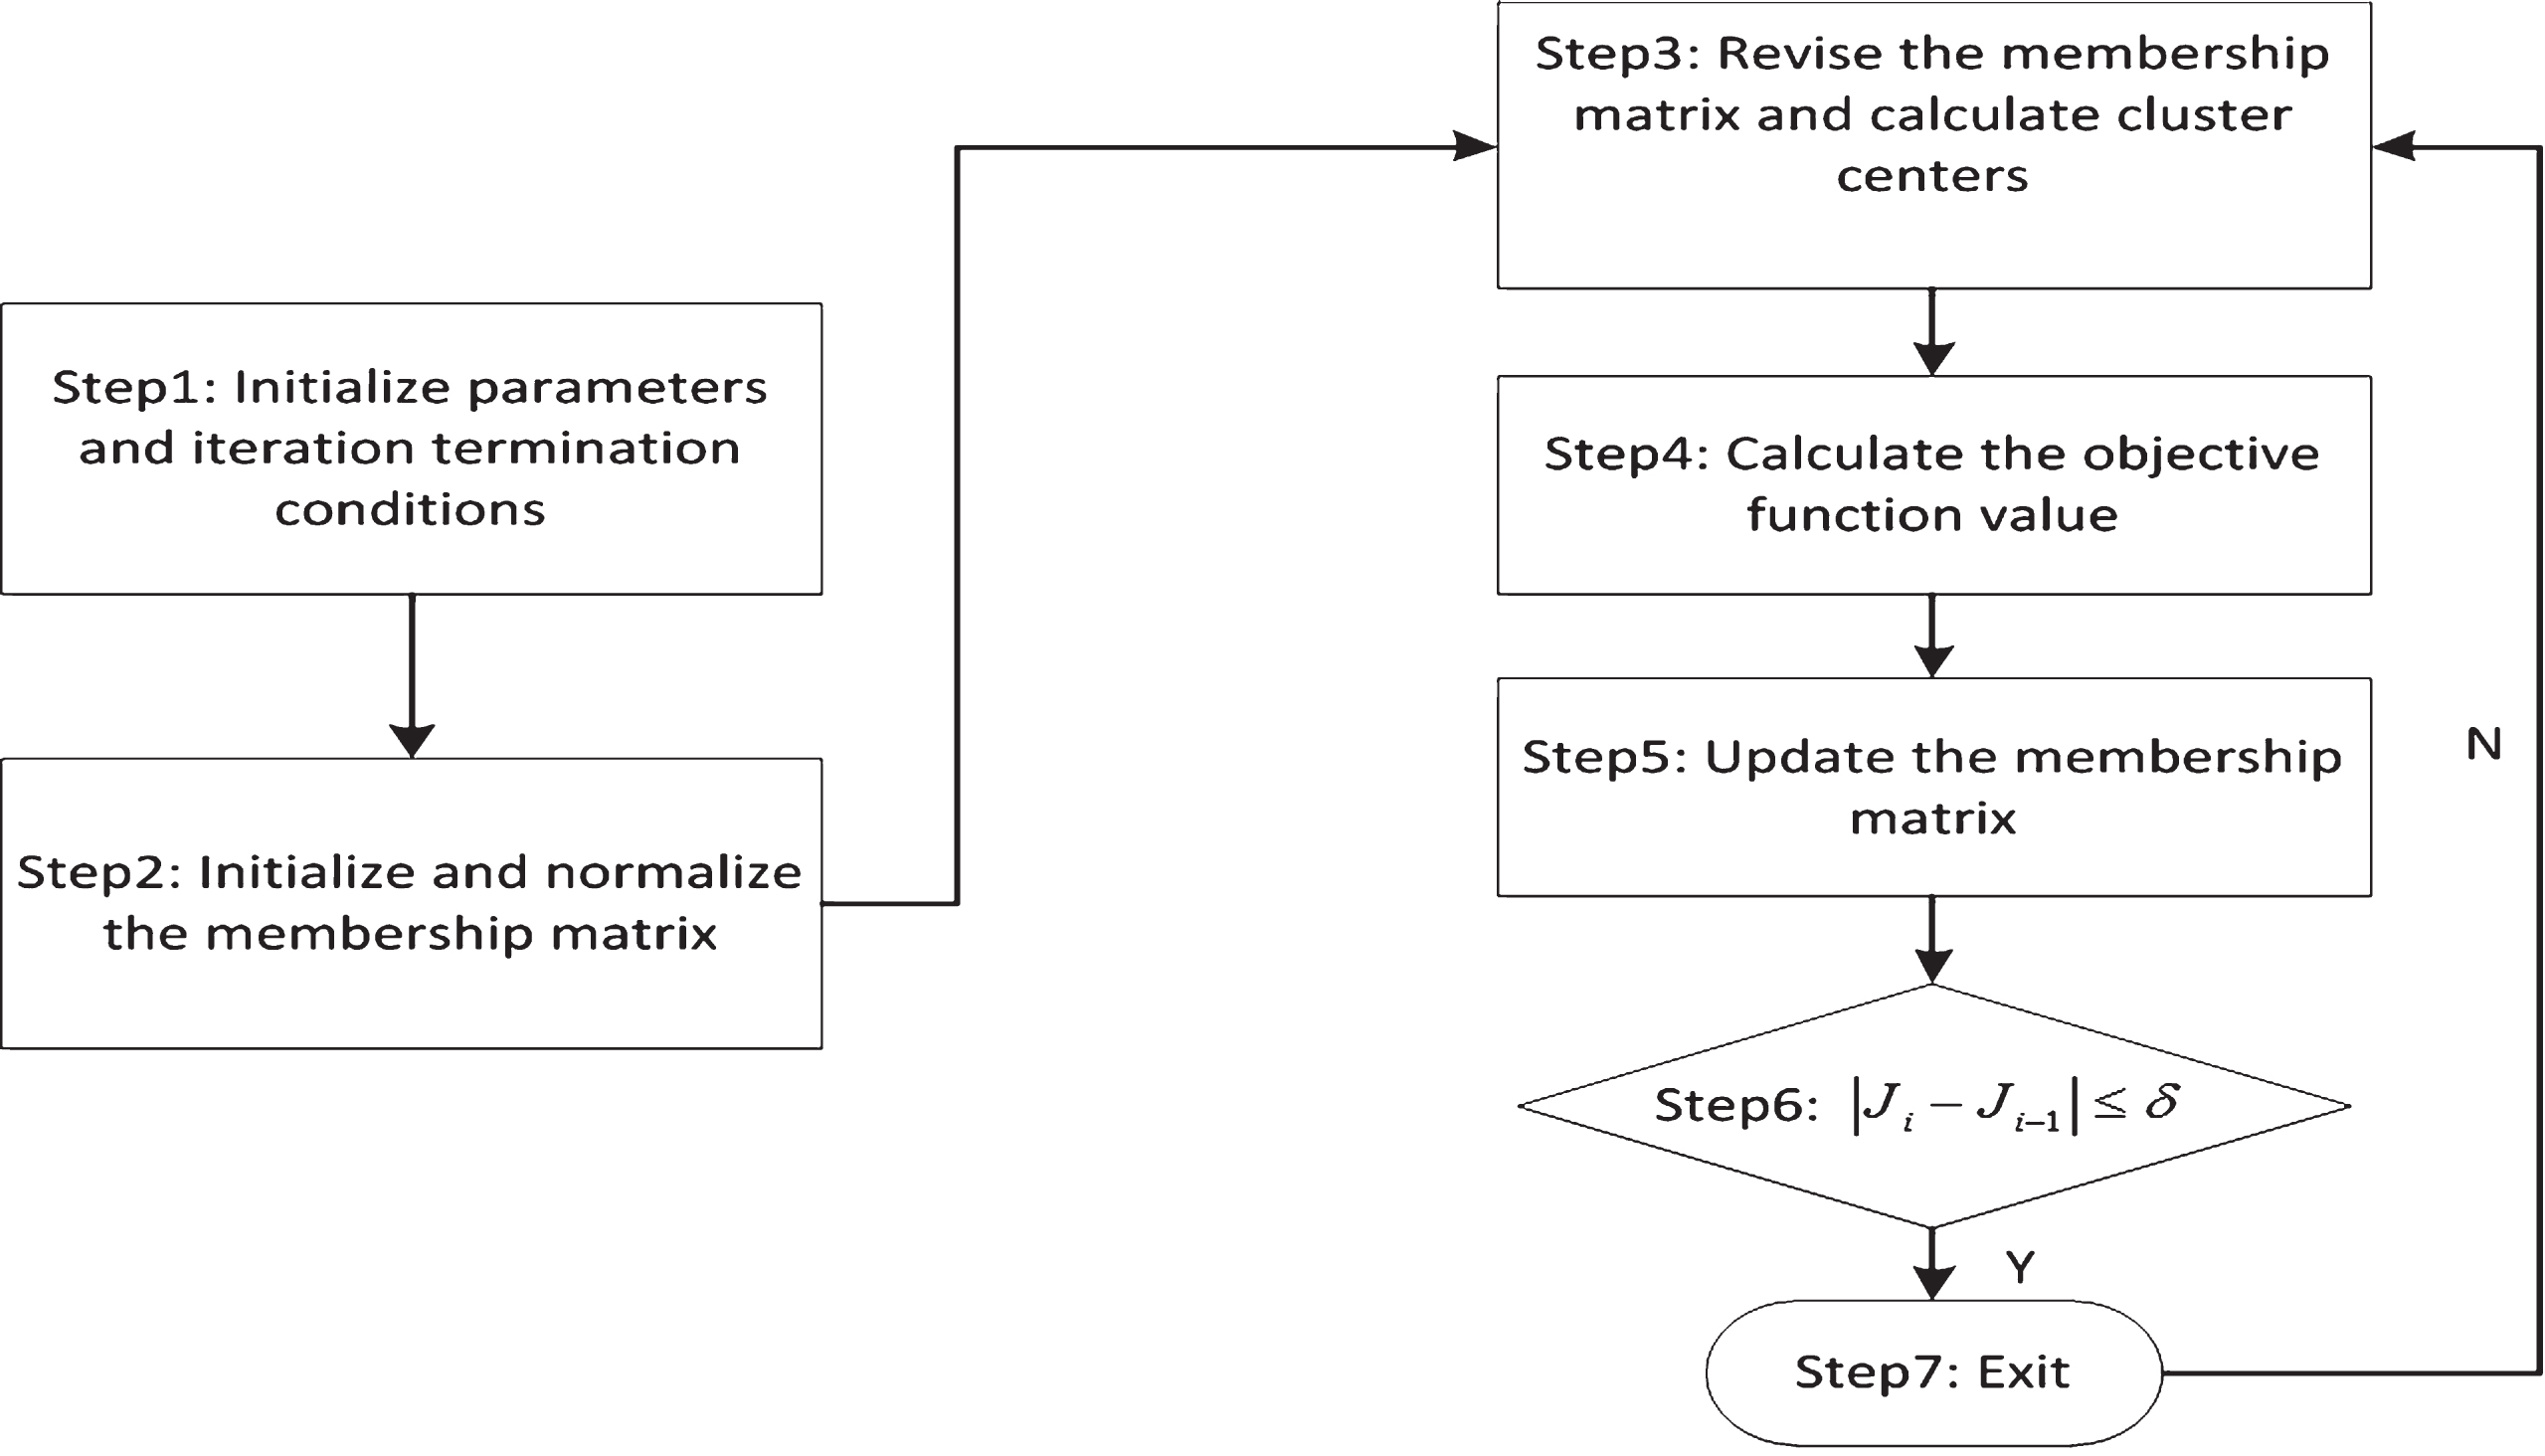
Implementation flow of improved FCM clustering algorithm.
The details of the algorithm are shown below:
Experiments configuration
In order to verify the effectiveness of the two-layer clustering algorithm based on clickstream, an e-commerce app (88 App) is chosen as test application. The function of data collection is configured in the source code, which recompiled and installed on 20 test device, and 20 users are distributed to test business modules of the application. The 88 App can be divided into four modules: shopping, services, communications and personal center based on the function of pages, so the test distributions of the 20 user are arranged as shown in Table 1. It is essential to note that some users may simultaneously test multiple modules.
User test distributions based on clickstream
User test distributions based on clickstream
Similarly, anothere-commerce app (Ego app) is chosen to verify the effectiveness of fuzzy clustering algorithm based on custom event. 20 users are arranged to test the application according to four types of user access behavior as shown in Table 2. It should be noted that the 11 custom events are: “Search for goods”, “Browse goods”, “View goods details”, “Add to Shopping Cart”, “Submit Order”, “Check Order”, “Online Payment”, “Personal center”, “Discount red envelope”, “My collection”, “Change username”.
User test distributions based on custom event
In the two-layer clustering algorithm, the quantity of user clusters is set to 4, the neighborhood density threshold is set to 3, the similarity threshold is set to 0.7, and the merging threshold is set to 1/2. While in the fuzzy clustering algorithm, the number of user clusters is set to 4 and the validity index is set to 2.
The visualized results are shown in Figs. 3 and 4. The Tables 3 and 4 show the clusters in detail. It can be seen from Fig. 3 and Table 3 that there are 4, 5, 8, 3 users in cluster 1, 2, 3, 4 respectively. In the tab “Details of clusters”, Clicking on the dot will display the detailed information of the user, including cluster index, user ID and the number of user sessions. We can know that N, O, P and Q who only test the communication module belong to cluster 1; I, J, K, L and M who only test service module belong to cluster 2; A, B, C, D, E, F, G, H who all test the shopping module belong to cluster 3; R, S, T who only test the personal center module belong to cluster 4.
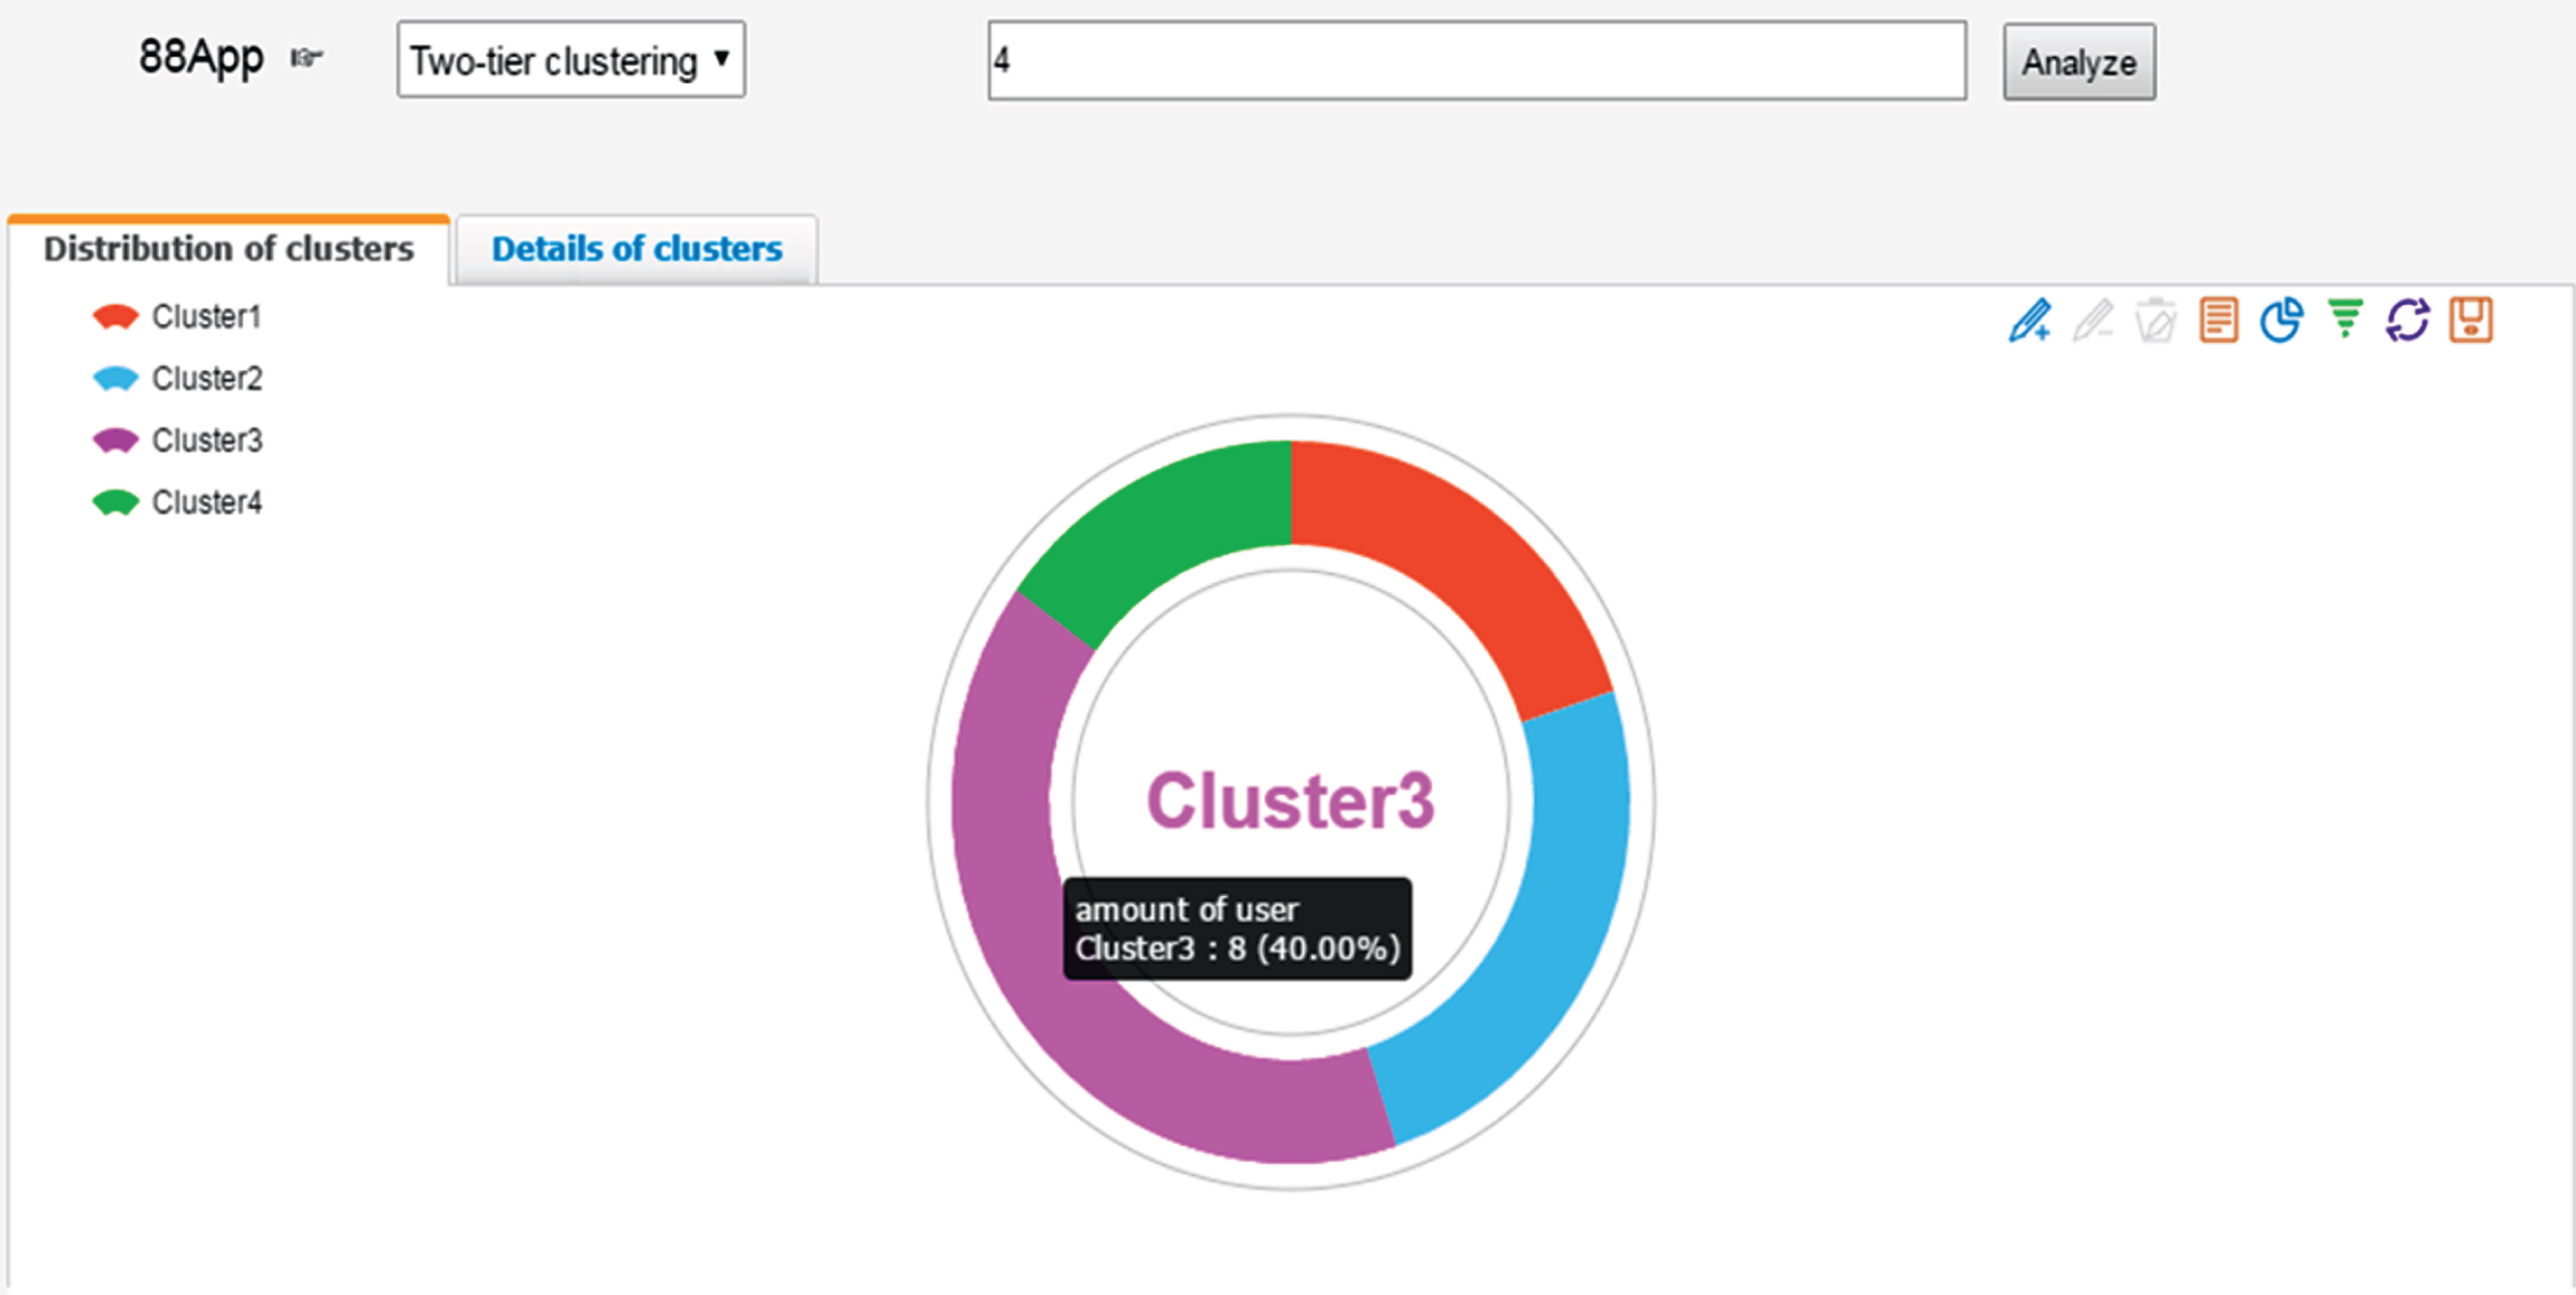
Distributions and details of clusters based on two-layer clustering.
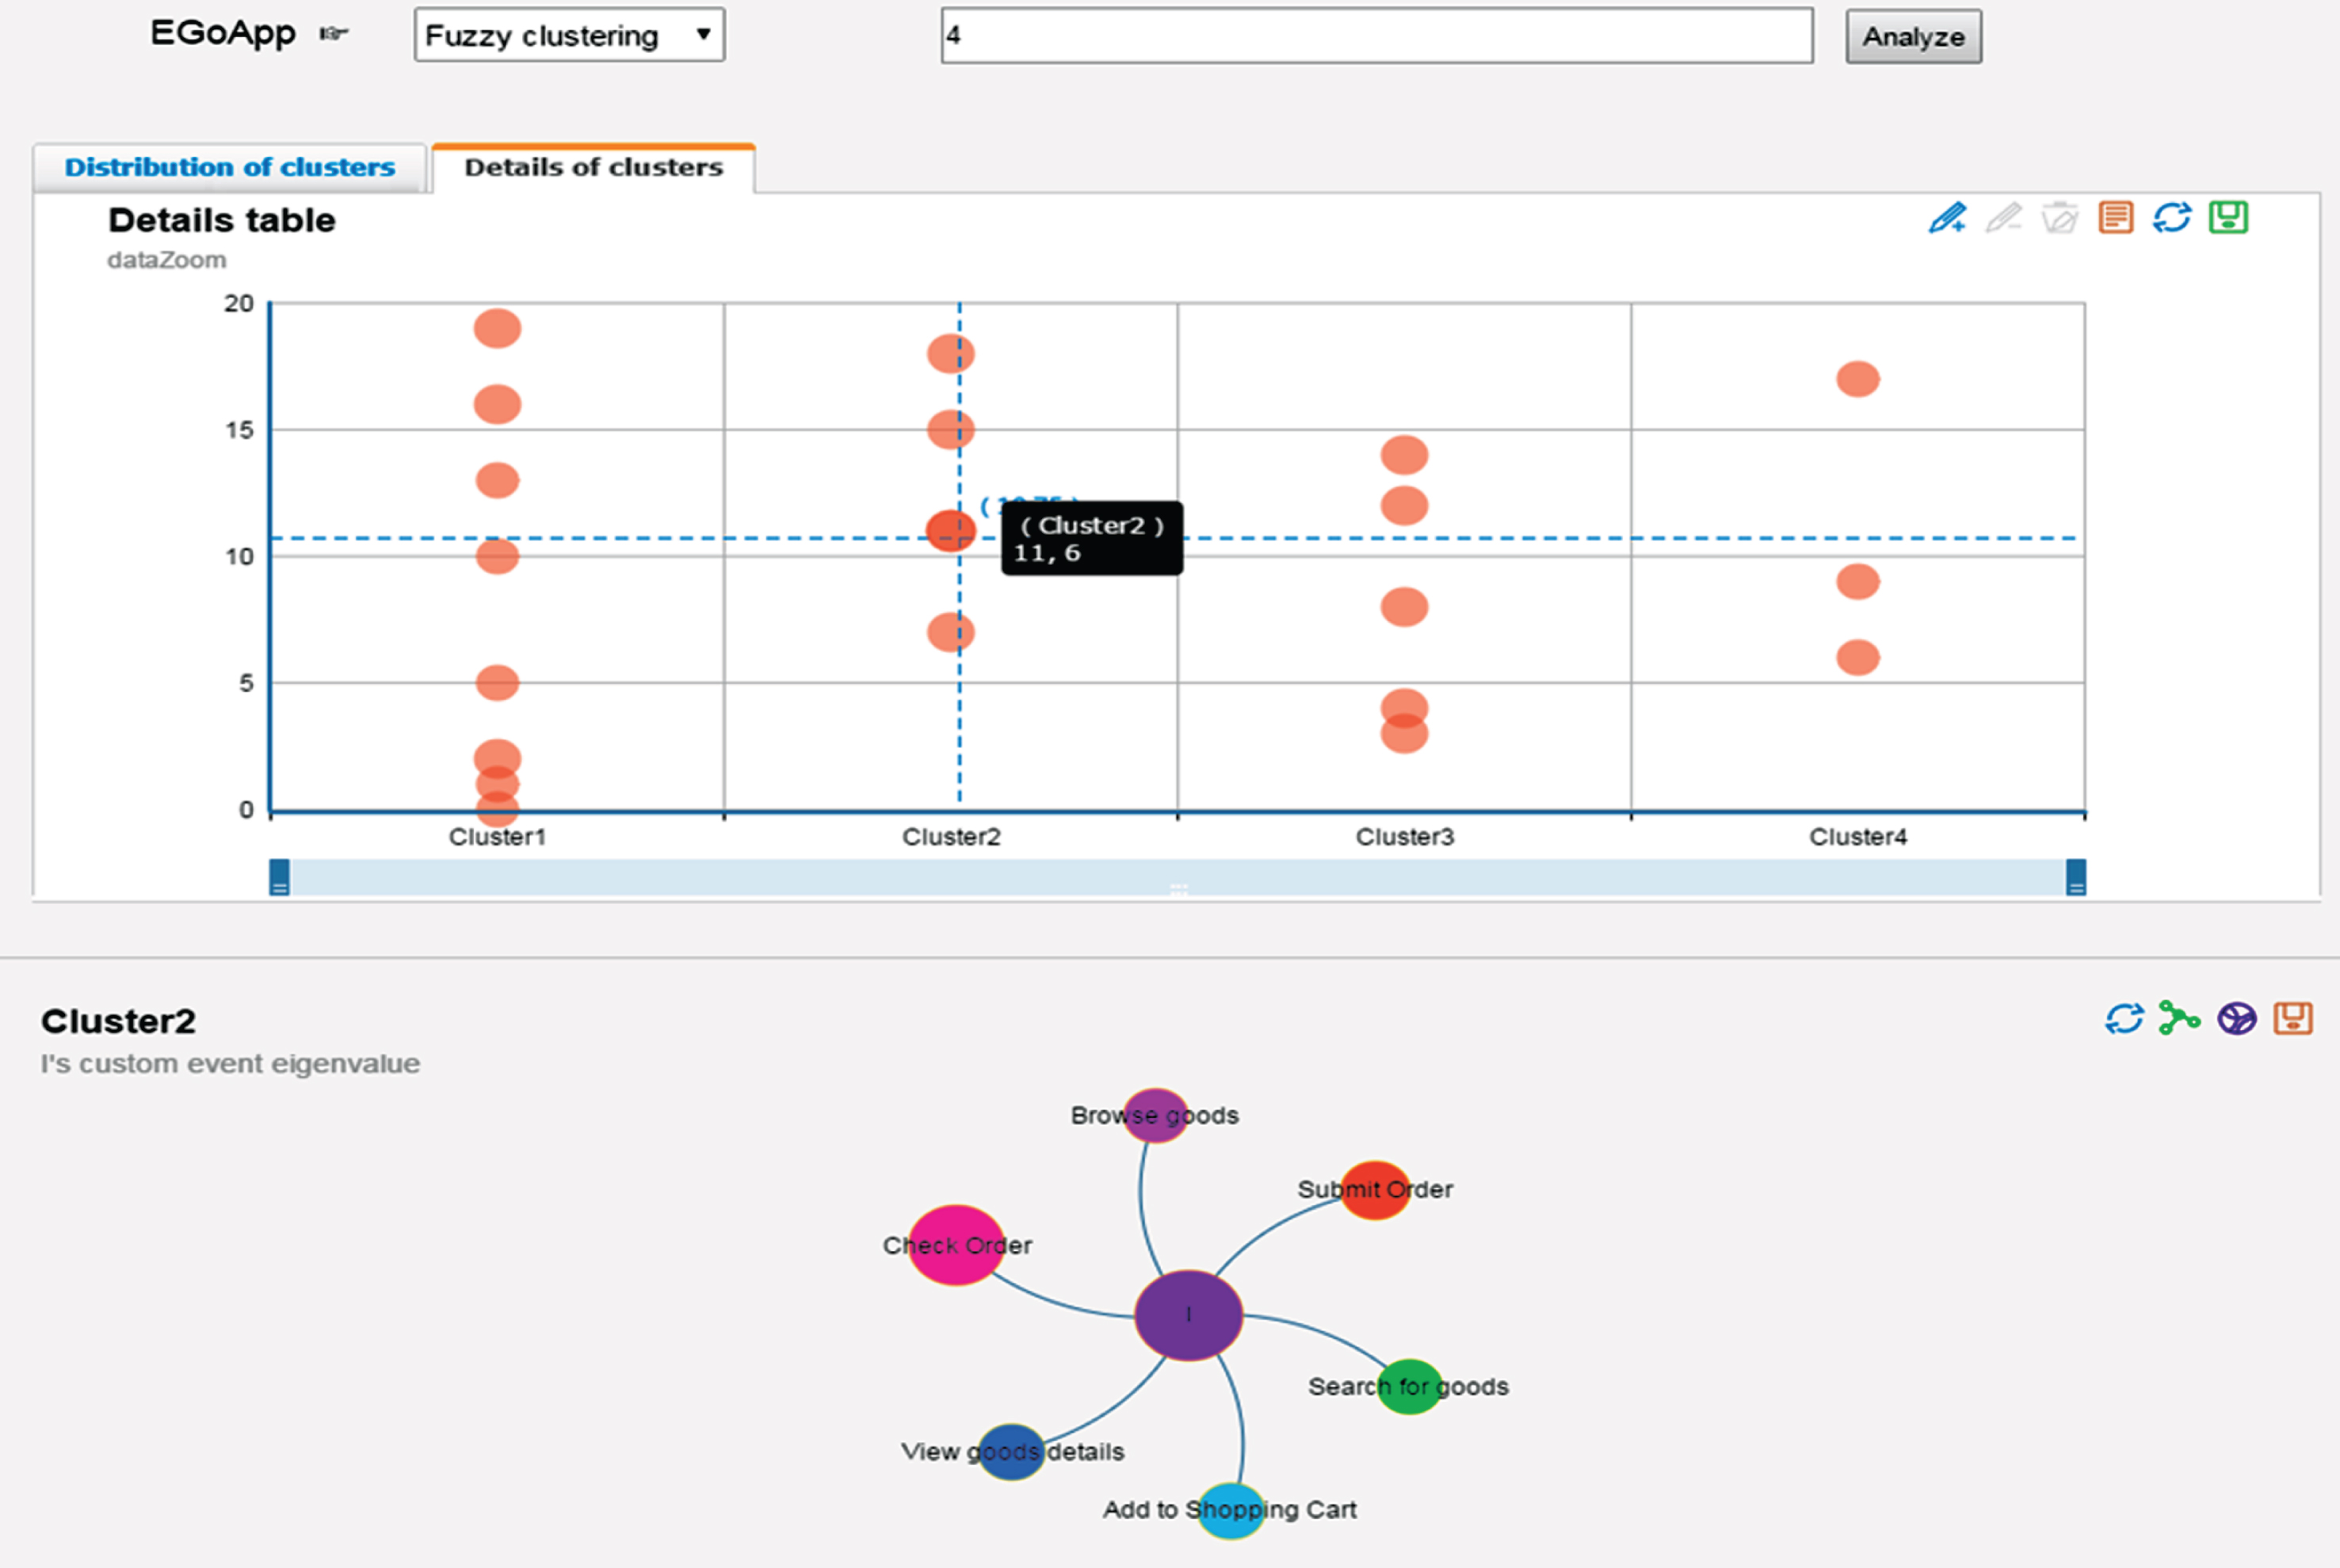
Distributions and details of cluster based on fuzzy clustering.
The results of two-layer clustering algorithm
Also, it can be seen from Fig. 4 and Table 4 that there are 8, 4, 5, 3 users in cluster 1, 2, 3, 4. Likewise, the details of clusters show that users J, K, L, M, N, O, P, Q belong to the cluster 1, who basically focused on “Browse goods”, “Search for goods”, “Add to Shopping Cart”; Users F, G, H, I belong to cluster 2 who are more focused on “Submit order”, “Check Order”; Users A, B, C, D, E belong to the cluster 3, they all have finished the entire shopping process that includes online payment; Users R, S, T belong to the cluster 4, their custom events are concentrated on “Personal center”, “Discount red envelopes”, “My collection” and “Change username”.
The results of fuzzy clustering algorithm
Therefore, when the number of clusters is set to 4, the clustering results of two clustering algorithm are consistent with the advance user test distributions in Tables 3, 4.
Obviously, combining the discussion from section 3.1, the clustering algorithm based on clickstream can infer a group of users being interested in a certain page function module as a whole. It is convenient to analyze all the pages of app and don’t need to configure extra complex collection codes, but it’s not customizable and can’t help developers to analysis user behavior patterns for page controls or features at a local level. However, by the clustering algorithm based on custom event, it is easy to know which group of users are biased interested in a specific operational event in an app page. So developers can define multiple different custom events to meet the business requirement. In summary, the two clustering methods are applied to different analysis scenarios, depending on the needs of developers.
This paper presented two user behavior clustering algorithm based on clickstream and custom event. The custom event data has a finer information granularity than the clickstream, and it’s more customizable and flexible for app developers to dig out user behavior patterns for specific features in app. The proposed method of measuring the similarity between user sessions makes a powerful contribution to the DBSCAN algorithm, and the problem that one session may be simultaneously assigned into different clusters was solved by modifying the merge condition of clusters. On the other hand, an effective trick used in the initialization of membership matrix could help to accelerate the convergence of FCM algorithm as well as ensure the consistency of optimal solution. Also, the problem of trapping in the local optimum has been lessened by giving a weight to the updating of membership matrix. At last, both clustering algorithm are practiced in the real mobile user test environment, and the experimental results have proved their adaptability and effectiveness.
Future experiments will consider more extensive test in term of the overall quantity of app pages and custom event to meet the real user environment. Besides, the current work has fixed the parameters of algorithms, more valuable attempts needs to be excavated.
Footnotes
Acknowledgments
This paper is supported by the National Nature Science Foundation of China (No. 61370103), Guangdong Province Application Major Fund (2015B010131013) and Zhongshan Produce & Research Fund (2016A1038).