
Abstract
With the accelerated process of agricultural modernization, the accurate acquisition of agricultural environmental information has become a major trend. A field microclimate monitoring system based on wireless sensor network is constructed based on the latest concept model of the Internet of things and fuzzy control theory; it mainly composed of data acquisition system, data storage system and visualization platform for big data analysis. The data acquisition system is highly integrated with data acquisition and data transmission to obtain real-time data of farmland environment in different terrain areas, including meteorology, hydrology, soil, growth etc. Wireless transmission will transmit real-time data through the GPRS network to the big data analysis platform. The big data analysis platform presents the site data information and analyzes the rule of historical data through visualization technology, realizes the meteorological disaster early warning and forecast, and provides effective decision-making service information based on the agricultural fuzzy theory. Finally, we analyze all kinds of hardware interference problems and software defects encountered in the debugging process, and propose new solutions through the experimental data obtained from actual production applications. It has been proved that the field microclimate monitoring system runs steadily and meets the demand of agricultural monitoring.
Introduction
The microclimate in farmland refers to the small climate environment formed by the interaction of the physical process and biological process between the soil layer, the soil layer and the crop population [1]. It is often expressed in terms of radiation, air temperature and humidity, wind, carbon dioxide and soil temperature and humidity. It is an important environmental condition that affects the growth and development of crops and the formation of yield.
The traditional way of information acquisition is mainly by manual experience or hand held instruments. The collection efficiency is low and a lot of manpower and material resources are consumed, which has become the bottleneck of information acquisition. The development of information technology provides technical means for modern agricultural information collection. specially with the application of wireless sensor network, agricultural information collection is gradually changing from single manual acquisition to information technology centered automatic acquisition mode. A great deal of research on the application of wireless sensor networks in agriculture has been done abroad [2–7]. Senrodio has developed a distributed wireless data acquisition and control system for the management of greenhouse crops [8, 9]. In the early twentieth Century, a field observation test station for soil wind erosion based on wireless sensor networks was first established in Texas, USA. In 2002, Intel established a vineyard agricultural wireless sensor network system in Oregon [10]. Mizunuma use WLAN to form agricultural wireless sensor network to monitor the growth of crops and realize remote control [11]. Digital sun has developed an automated wireless sensor network that can detect water in the soil and control irrigation [12].
The research of agricultural wireless sensor network in China started late, but it developed rapidly. Zhou Guoxiang proposed a remote agricultural monitoring scheme using GSM [13]. Liu Bian used JN5121 wireless microprocessors as the core to build a agricultural wireless sensor network based ZigBee [14]. Si Minshan designed a wireless sensor network monitoring system in greenhouse by using MSP430 MCU and low power network transmission chip nRF24L01 [15]. In 2012, Shengping and Guo Yangyang designed the facility agricultural intelligent measurement and control system based on ZigBee and 3G Technology [16]. Deng Xiaolei and Li Min Zan have designed the soil moisture movement monitoring system integrated with GPRS, GPS and ZigBee [17]. Su Meijuan designed intelligent monitoring system based on ZigBee and GPRS wireless network, and realized data monitoring, collection and processing functions of soil moisture information such as temperature, humidity, light intensity and rainfall [18].
Generally speaking, foreign products are relatively mature, but the price is relatively high, and the extension is poor. Most of the domestic agricultural information collection systems are at the stage of research and development. The key products are of low maturity, and the scalability and usability of the system, especially the adaptability, accuracy and reliability of the acquisition system need to be further improved. Based on the full investigation and analysis of the characteristics of the existing system, this paper adopts the latest standard architecture of the Internet of things, and develops a field monitoring system with advanced technology, economy and practicality, and stable and reliable performance. The automatic monitoring and intelligent management of farmland comprehensive information can be realized, and the solution is provided for the digitalization, information, visualization and standardization of farmland production.
Requirement analysis
A complete farmland microclimate monitoring system needs to consider various natural factors such as geography, biology, hydrology and meteorology. And it also needs basic data acquisition, transmission and processing and visualization functions [19, 20], and has specific performance optimization.
Functional requirements
Highly integrated
The microclimate of farmland involves many factors. The system needs to detect such as temperature, humidity, wind direction, wind speed, air pressure, rainfall and solar radiation and other factors, so it needs integrated temperature sensor, humidity sensor, wind speed sensor, rainfall sensor, in order to achieve the physical world and the virtual world between mapping.
Early warning decision
The system can predict the disasters which may lead to the reduction of crop production by analysing and processing the real-time meteorological information, it can notify farmers in time through the form of websites and websites, so as to collect effective measures in time.
Automatic adjustment of network topology
Considering the failure of some sensor nodes due to energy exhaustion or other factors, the system may also add new detection nodes at any time, which will lead to the change of network topology. It requires that sensor networks have automatic adjustment function of network topology.
Efficiently storage and query of data
When users query data, the system should be able to provide real-time data and historical information quickly, which requires that the system has a large number of data storage functions and efficient data query function.
Performance requirements
Strong environmental adaptability
Most of the systems are deployed in the harsh field environment, the system must have the ability to bear all kinds of bad environment, the system also need to have a variety of wireless transmission functions, in order to facilitate the real-time transmission of information collection. The power supply of the system needs to ensure that the system is running for enough time.
Extensibility
Besides the basic meteorological factors of the direct measurement, the system is also necessary to select and measure other relevant factors according to the needs of the users, and the system structure should be easily expanded.
Accuracy and reliability
Accuracy requires that the data collected by the sensor must be able to truly reflect the actual situation of the site. Reliability requires that the device can accomplish data collection steadily, continuously and smoothly in its life cycle, and ensure the stability of wireless transmission.
In general, the target system needs to meet the needs of integrated acquisition, wireless transmission and intelligent processing, and it also needs reliability, versatility, extensibility, dynamism, security and adaptability.
System architecture
Architecture design of internet of things
The system design is designed to make full use of the idea of the Internet of things design, and refer to the latest architecture of the Internet of things, and it designs a system architecture, as shown in Fig. 1, on the basis of the domestic and foreign Internet of things results [21–27], and the actual needs of the field microclimate detection.
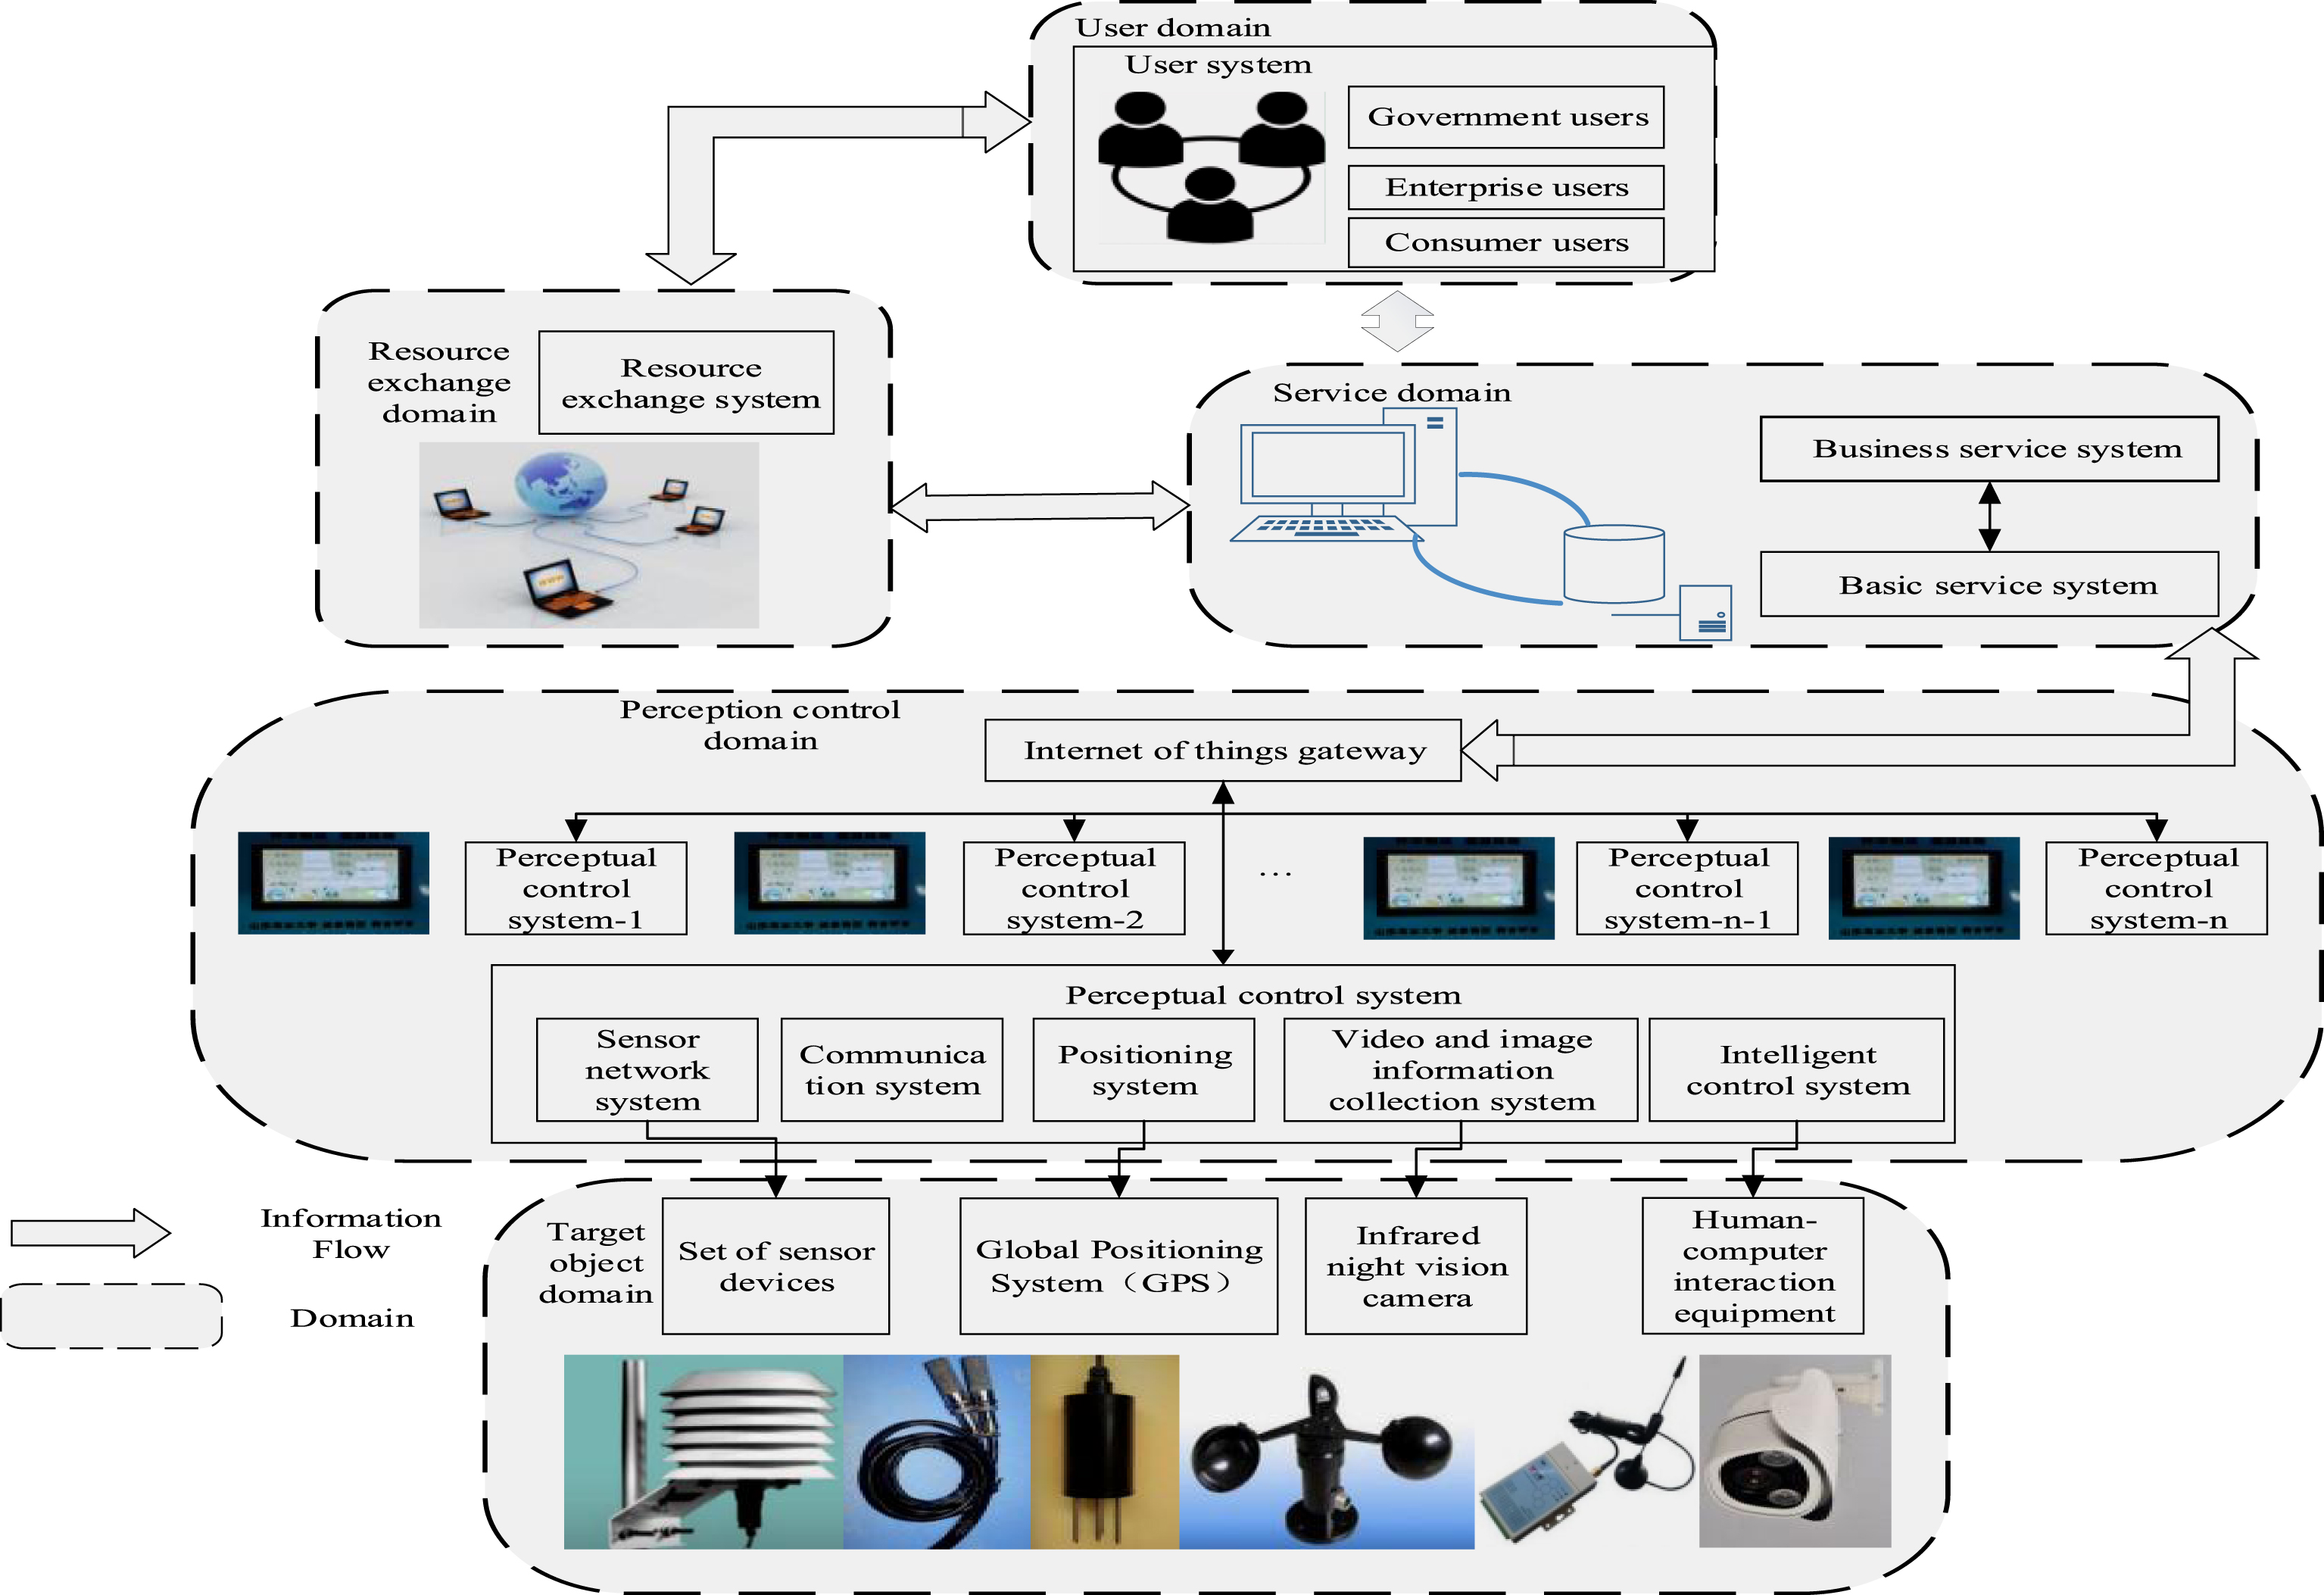
Architecture of the Internet of Things.
As can be seen from the diagram, the system architecture consists of the user domain, the target object domain, the perceived control domain, the service domain and the resource exchange domain. The target users of the system are personnel, departments and organizations related to agricultural production. The Internet of things users can obtain the perception and manipulation services of the physical world objects through the user system and its domain name entity. The sensing object of the system is the small climate environment in the farmland, and the control object is automatic irrigation equipment. The perception and control domain refers to the wireless sensor network that perceiving and releasing the microclimate of farmland, and the service interface [28, 29] providing remote management for other fields. The service providing field of the system can realize the processing and coordination of perception data, control data and service related data, and provide interfaces for users of Internet of things to perceive and control physical world object [30]. In the field of resource exchange, we can get the external information resources needed for network services, and also provide the information resources of the Internet of things needed for the external system, and provide guarantee for information flow, business flow and information exchange.
Wireless sensor networks usually include sensor nodes (terminal devices), converging nodes (routers) and management nodes (coordinators). A large number of sensor nodes are randomly deployed in the monitoring area and can form a network topology by self organization [31, 32]. Data monitored by sensor nodes can be transmitted by hop to hop through sensor nodes. After multi hop, it can be routed to the sink node, and finally arrive at the management node through Internet or satellite. Users configure and manage sensor networks by managing nodes, collecting monitoring data and issuing instructions.
Sensor nodes
From the perspective of network functions, each sensor node not only performs local information collection and data processing, temporarily stores, manages and integrates data transmitted by other nodes, but also collaborate with other nodes to accomplish some specific tasks.
Convergence node
The convergence node is the gateway connecting the sensor network with the Internet and the external network. It is the key to realize the conversion between the two protocols. At the same time, it releases monitoring tasks from the management node to the sensor node and transmits the data collected by the WSN to the external network.
Management node
Management nodes are used to dynamically manage the entire wireless sensor network. The owner of the sensor network can access the resources of the wireless sensor network through the management node.
The wireless sensor network protocol stack adopts five layers of protocol: application layer, transmission layer, network layer, MAC layer and physical layer [33]. In addition, the protocol stack should also include energy manager, topology manager and task manager. These managers enable sensor nodes to work together in a highly energy-efficient way, and they transmit data in node mobile sensor networks to achieve multitasking and resource sharing. The functions of each layer protocol and the manager are as follows:
Some of the events between the converging nodes need to be modulated or demodulated, such as the physical parameters of the communication, the frequency band and the signal in WSN. The physical layer provides simple but powerful signal modulation and wireless transceiver technology. MAC layer implements the initialization of each node. It completes the network definition by sending and receiving the request and request correlation, and it also defines the debugging strategy of the MAC frame. And the data link layer is responsible for data frame, frame detection, media access and error control. The network layer completes logical routing information collection. The network packets that are sent and received can use the optimal path to reach the target node according to the different strategies. The transport layer provides the reliability of the packet transmission, and it provides information to the application layer. The transmission layer is responsible for the transmission control of the data flow, which is an important part of the quality of communication services. The application layer ultimately meets the different computing requirements [34] by integrating the collected information of the nodes. It consists of a series of application layer software based on monitoring tasks.
System design
Overall framework
The farmland climate monitoring system based on wireless sensor network is mainly composed of three parts: data acquisition system, data storage system and visualization platform for big data analysis. The system collects microclimate related factor information through sensor nodes, such as temperature, humidity, rainfall, wind speed, wind direction, soil temperature and humidity, light intensity, soil salinity, soil pH value and so on.
The sensor node has the function of ZigBee wireless communication, and can transmit the data to the data gathering node through the ZigBee wireless communication. The sink node transmissions the collected data to the remote data storage system through the GPRS. The service providing domain stores, analyzes and processes data, and provides various services through data visualization. Figure 2 is a system structure map of a field microclimate monitoring system based on wireless sensor networks.

Architecture of the Wireless Sensor Network.
The data acquisition system is realized through the wireless sensor network, and the data acquisition node is the basic function unit of the wireless sensor network. The data acquisition node is usually composed of sensor module, processor module, wireless communication module and power module. The structure is shown in Fig. 4. First, the information collection and preprocessing is completed, and the collected data are sent to the adjacent nodes. Finally, the collected information is forwarded to the sink node through node hopping.
The sensor module is composed of meteorological and soil sensors, including air temperature sensor, air humidity sensor, wind speed sensor, wind direction sensor, illuminance sensor, soil temperature sensor, soil humidity sensor, soil pH sensor, water level sensor and so on. The MSP430F5438 microprocessor is used as the terminal microprocessor and the XBee Pro 60 mW ZigBee is selected as the wireless data transmission module. The H7210-GPRS-RS485 GPRS communication module is selected as the remote information transmission module. At the same time, the wind power generation, solar power generation and battery provide the power [35, 36] for the system. The acquisition terminal structure is shown in the lower part of Fig. 2, the composition of the intelligent control module is shown in Fig. 3.

The composition of the intelligent control module.
The schematic diagram of the hardware circuit is as Fig. 4.
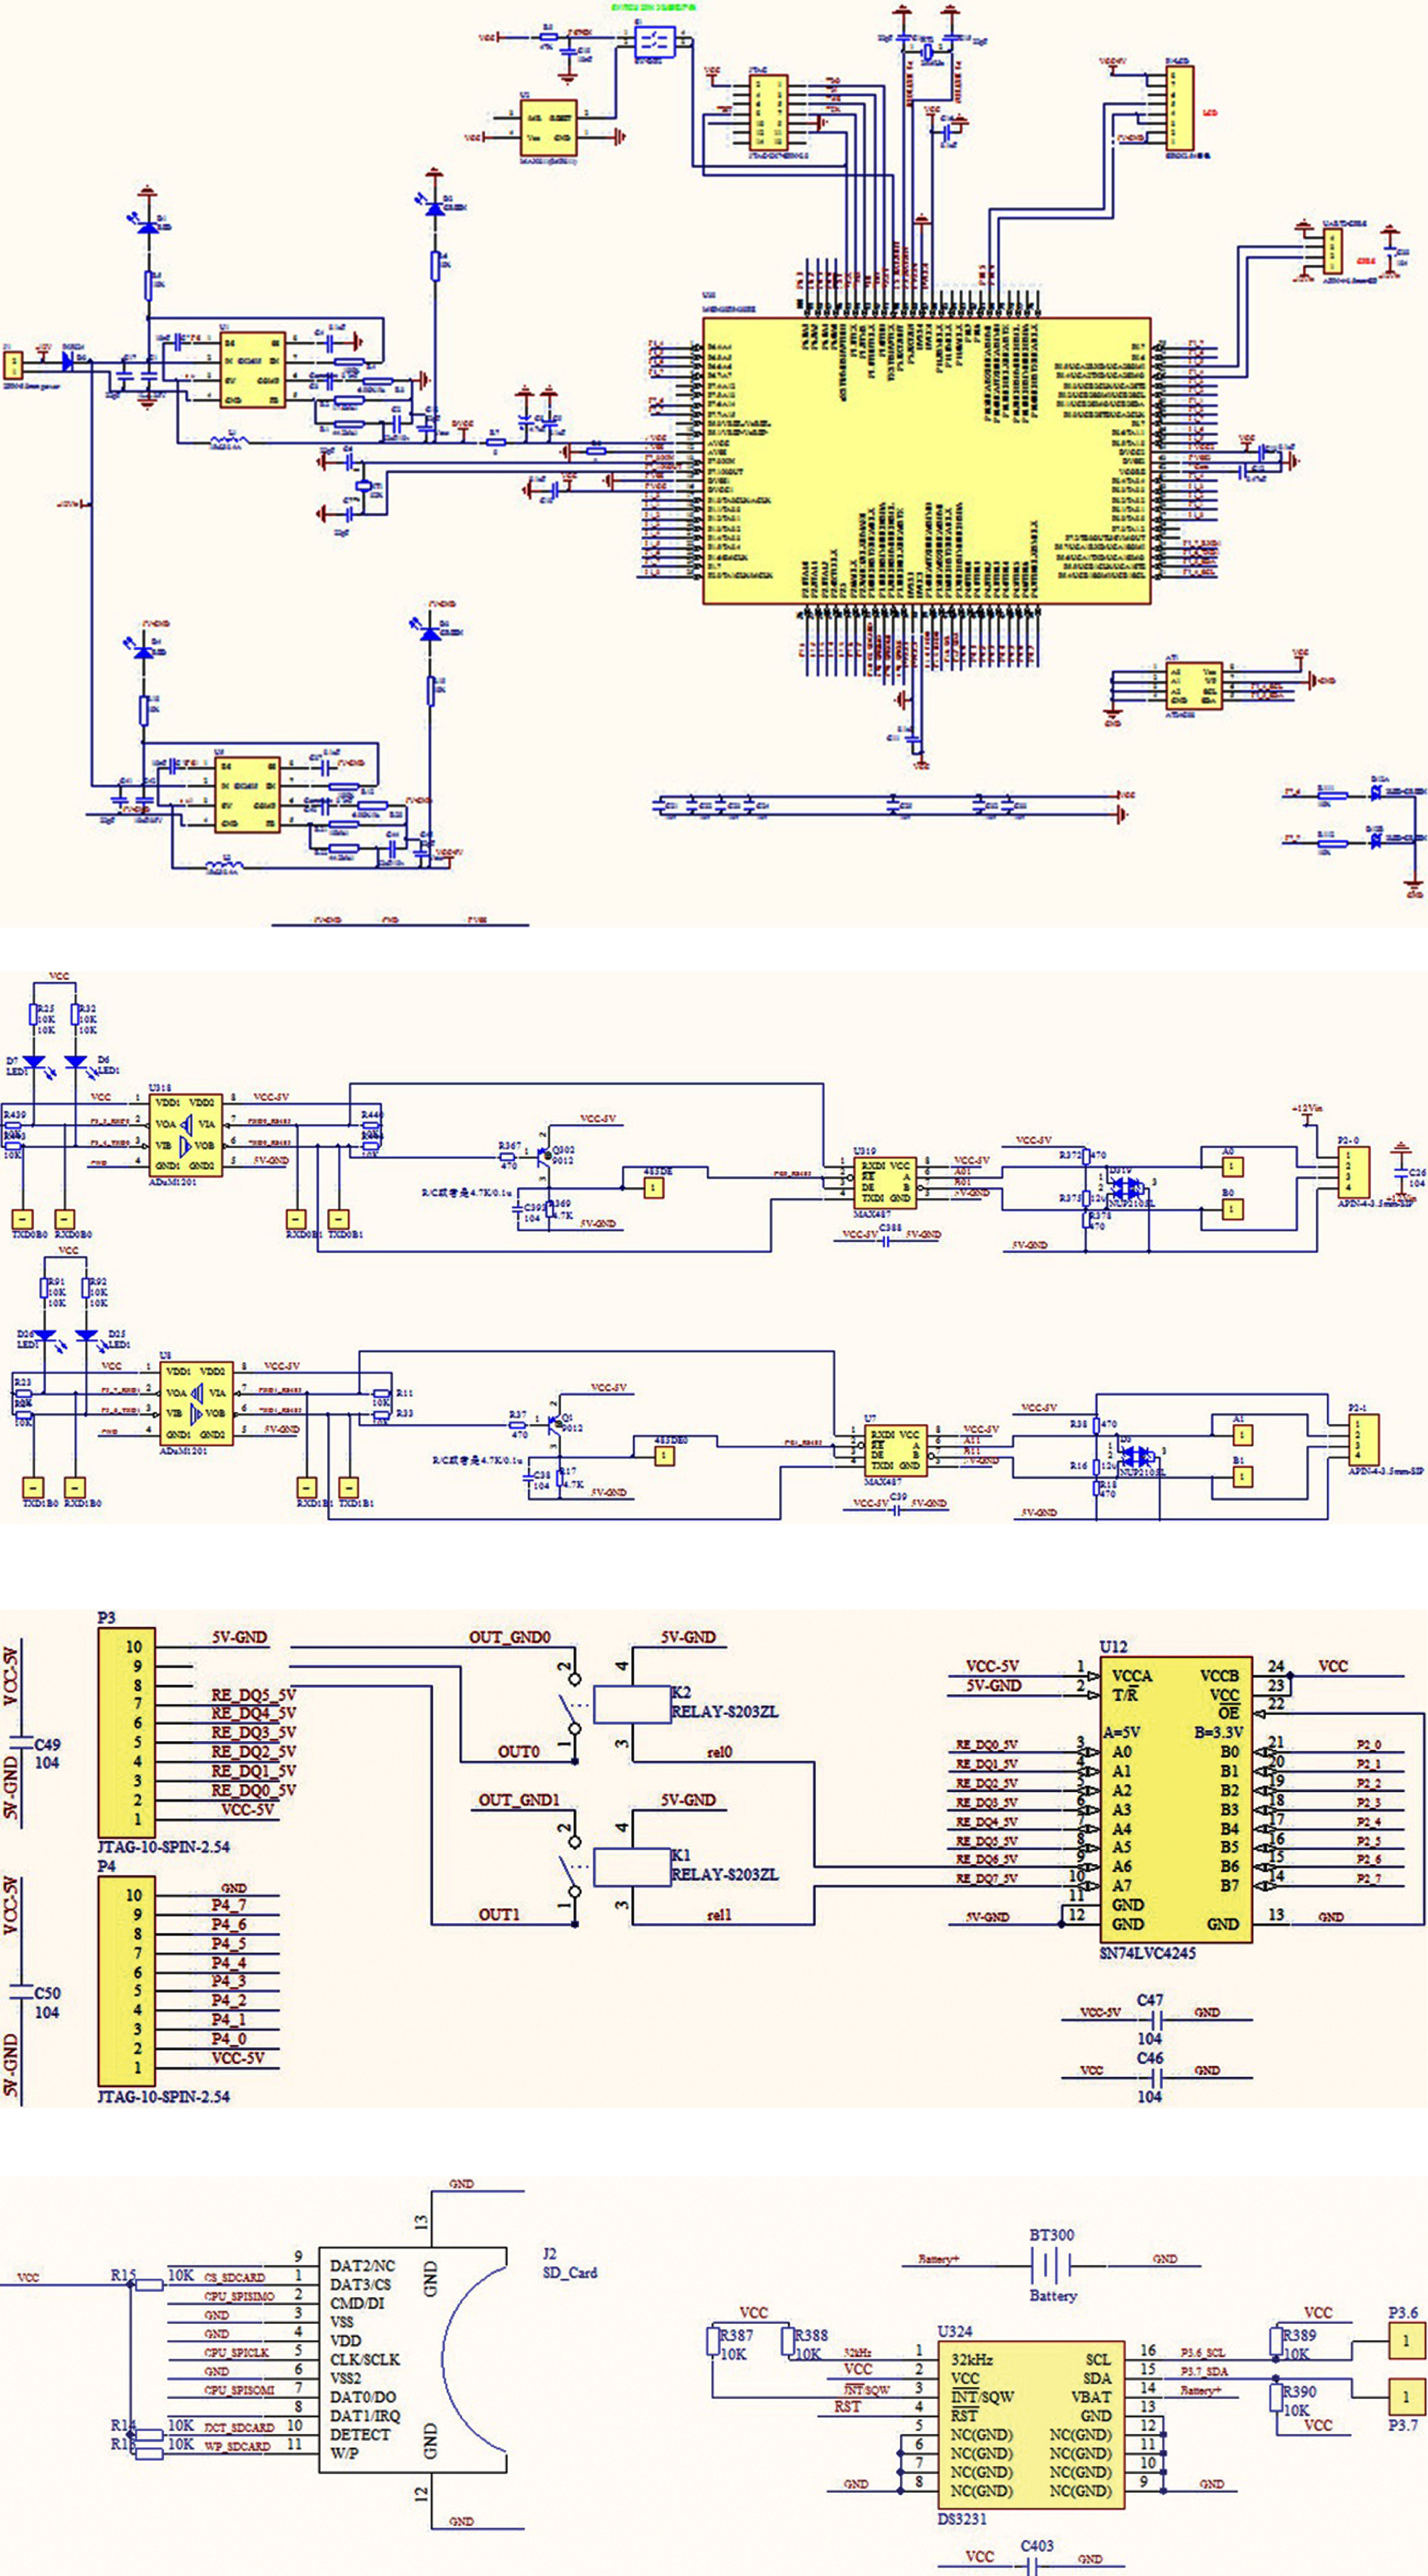
Collection terminal circuit diagram.
Data storage program
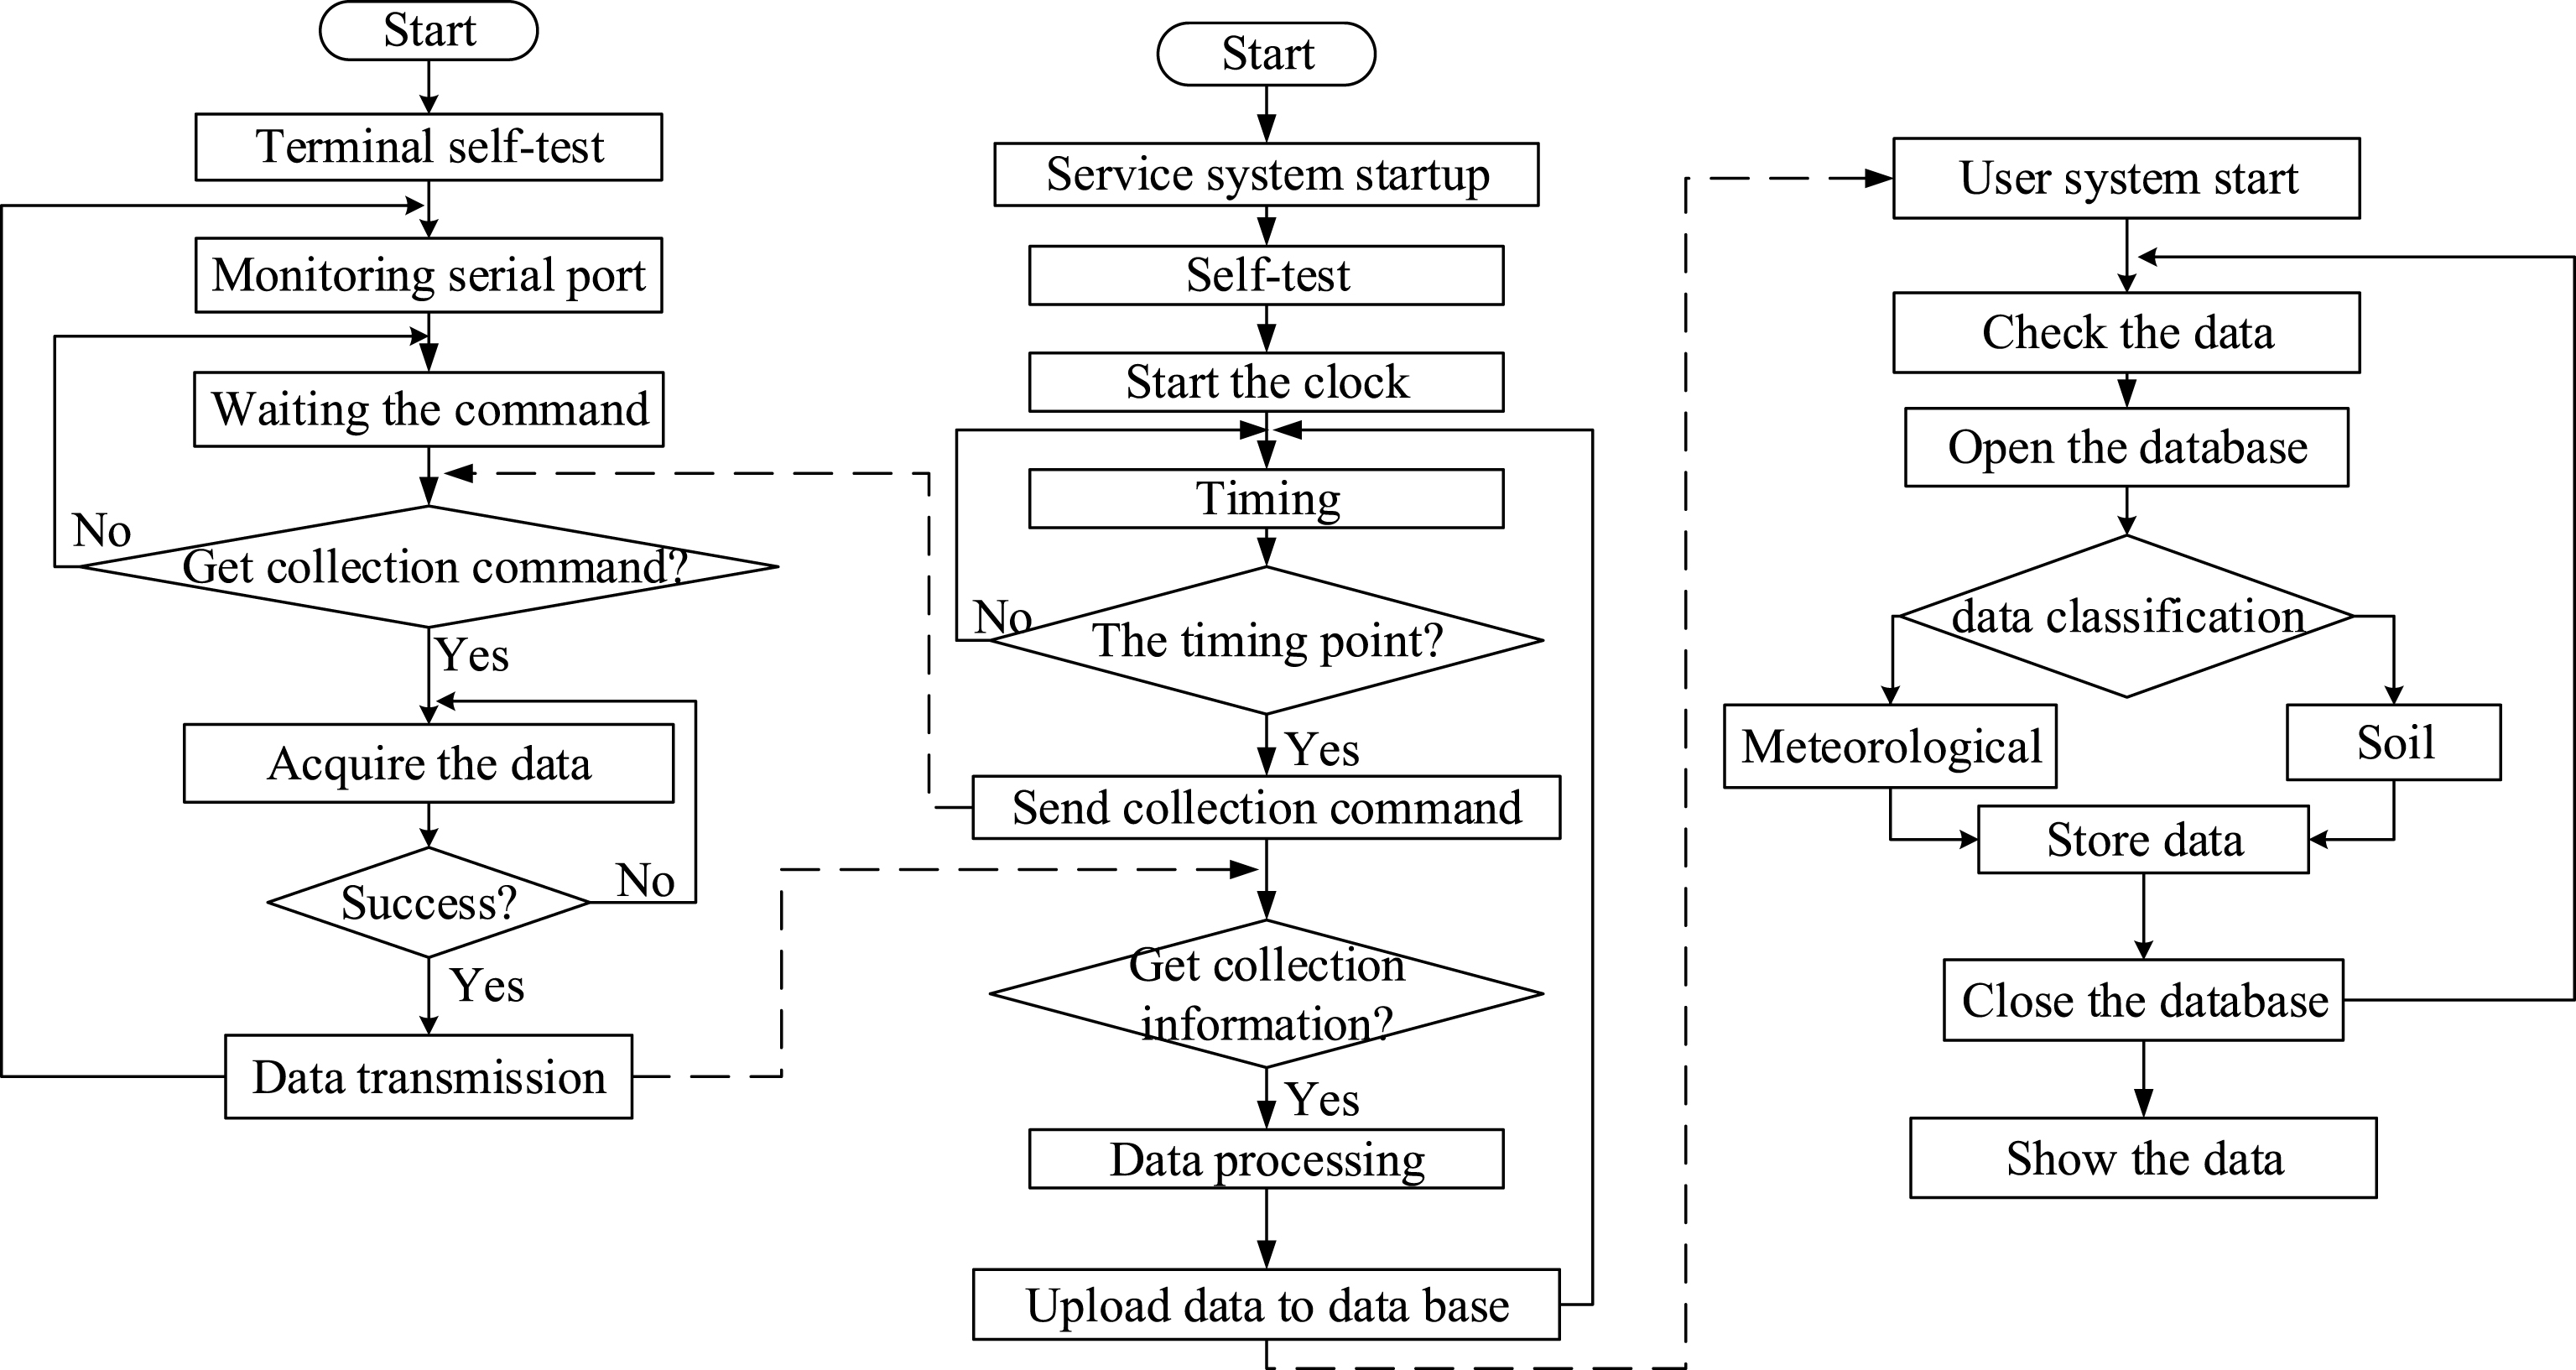
The data storage program consists of three parts: the monitoring program, the data transmission program and the data receiving program. The listener in the monitor program is deployed in the sensor terminal node. When the listener starts, it initializes the serial port first, and monitors whether or not to receive the collection instruction. After receiving the collection instruction, it opens the port to get data and calls the data transmission program, as shown in Fig. 5.

Monitoring process.
The main function of the data transfer program is to transmit the data to a remote server through the GPRS module. The specific process is shown in Fig. 6. First, start the program, initialize the GPRS module, set the transmission target address, send the connection instruction to the data receiving program, establish the connection, then send the data to the server side through the GPRS network protocol. After setting up a database connection on the server side, the data is classified in the weather and soil database. The site number and time of collection are the only signs that mark each record, the record is added to the corresponding table, and then the database connection is closed.
Data transmission flow chart.
The big data visualization analysis platform is a Web service system based on the advanced programming language. Users can query historical data based on acquisition time and collection point, and use visualization technology to analyze the temporal and spatial changes of data to provide early warning and forecasting services for dry hot wind and freezing, drought and flood disasters.
The system is divided into four levels: presentation layer, business logic layer, data persistence layer and domain module level. The SSH2 framework is used to help developers build Web applications with clear structure and short term maintenance. The basic business process is: in the presentation layer, the request (Request) and the transmission response (Response) are received first through the JSP page interface. At the business level, Spring IoC container management service module is responsible for providing services for Action model (Model) data processing module and cooperative object (DAO) component, so as to complete business logic and provide transaction processing. Container components improve system performance and ensure data integrity. In the persistent layer, it relies on the Hibernate’s object mapping and database interaction to process the data requested by the DAO component and return the processing results.
System implementation
Functional implementation of the terminal
Wireless sensor network acquisition system
The wireless sensor network acquisition system is highly integrated with data acquisition and data transmission. The different types of sensors are installed in different areas of the equipment mounting bracket, and their structure distribution features are shown in Fig. 7. The highest level is meteorology sensors, such as carbon dioxide concentration sensors, wind speed sensors, wind direction sensors and illuminance sensors. In addition, wind power plants and solar panels are added to a specific environment to assist in power supply. The middle layer is equipped with an air temperature humidity sensor and an image video collector. The lower layer soil sensors include soil temperature and humidity sensors, soil nutrient sensors and soil pH sensors.
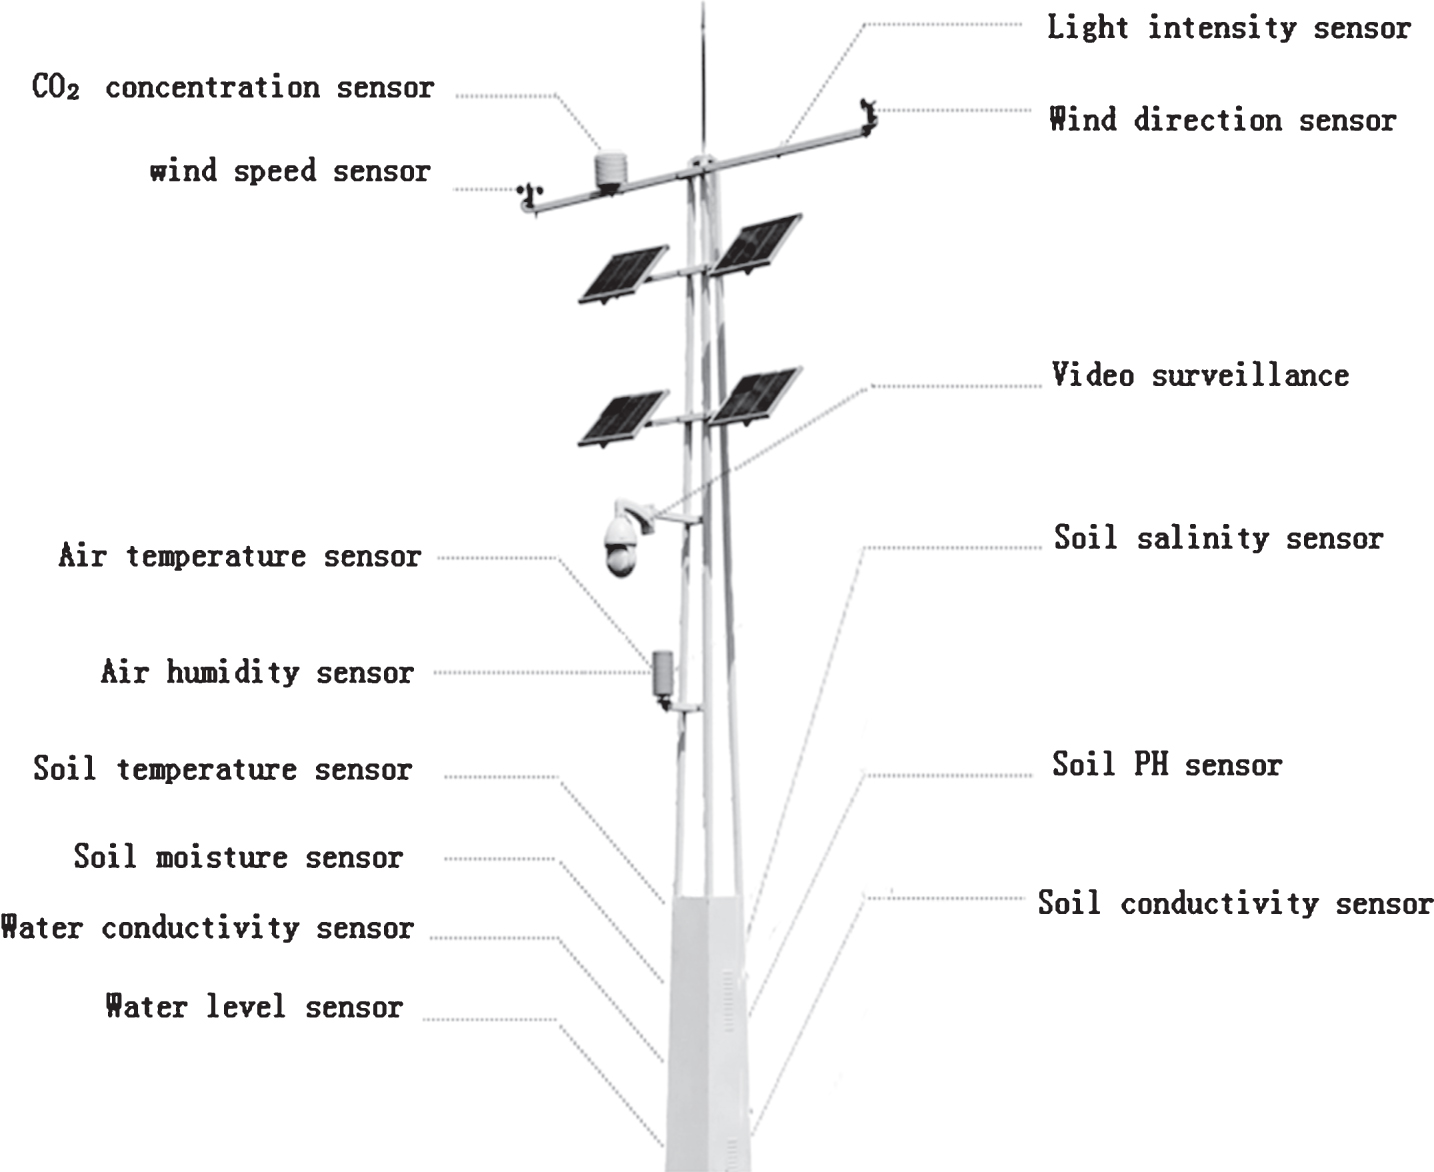
A framework for agricultural microclimate acquisition equipment.
In the process of setting up the scene, the program needs to be debugged at the site, and the initialization of the system power and program should be completed. In addition, the hardware circuit board is integrated in the convergence node, as shown in Fig. 8.

Acquisition terminal circuit board.
The problems of the hardware acquisition system are generally divided into three types: sensor failure, data packet loss, and data acquisition anomaly. Sensor failures are mainly expressed as the value of the uploaded data or the initial value, which is usually caused by the abnormal power of the sensor or the sensor fault. It is necessary to check the circuit or replace the new sensor in the actual environment. Another solution is to deploy redundant sensors to ensure at least one normal working sensor.
There are three data packet dropout cases:
All nodes lose data collectively at the same time
This problem is mainly caused by the network interruption of the server or the interruption of the server power. The solution usually sends instructions to the acquisition node after the network or power recovery, and the collection node sends the data stored in SD card to the server again.
Long time packet loss for individual nodes
This is usually caused by the network interruption or the interruption of power supply system at the location of the location, which requires solving the problem by restoring the network problem or checking the replacement of the power supply system equipment.
Random packet loss of individual sites
This kind of abnormal data mainly for sensor readings too big or too small, the data beyond the normal range, the main way to solve the above problem is to use redundancy method, to ensure that at least one sensor can work normally, if an exception occurs, the need to consider replacing the more reliable sensor is more durable.
Data storage
After the system works normally, the acquisition card converts the voltage or current signal of the sensor to the digital signal. The data monitoring program will periodically acquire serial data and trigger the data transmission program, and it will send the data packet to the remote server. The data receiving program stores the data into the MySQL database, as shown in Fig. 9.
Data receiving program interface.
The data record is numbered according to the time and place of the upload, and it is used as the form key for designing the database. The data collection table is shown in Fig. 10.

Agricultural microclimate database tables.
The platform system mainly includes three modules: mining analysis, monitoring and warning and decision-making service. Among them, mining analysis module integrates big data and agricultural science analysis technology, mining related historical data and real-time data, and applies visualization technology to render processing analysis results dynamically. Using hotspots to analyze the temporal and spatial changes of data, the maximum and minimum of statistical data are dynamically calculated by broken line graph. Users can automatically query the results of mining analysis, as shown in Fig. 11. By means of visualization, we can visually see the regular characteristics of the long-term changes of various variables.

Visual analysis of air temperature data.
For example, we can find out the distribution of high temperature or low temperature in a period of time by analyzing the hotspots of air temperature or soil temperature, and determine whether there is dry hot weather or meteorological disasters or freeze injury. In the same way, we can also determine whether there is a flood or drought in the area by analyzing the time series of soil moisture. Provide accurate and intelligent data support for our scientific decision-making.
The monitoring and warning module is based on real-time data collection and data mining analysis, it implements early warning according to the suitable growth threshold of crops, and provides early warning information for early prevention and scientific disposal of diseases and pests in agricultural production. For example, dry hot air and other agro meteorological disaster monitoring and early warning is an essential part. By comparing real-time data with the set dry hot wind threshold, we can determine the possibility and severity of dry hot wind on the scene, as shown in Fig. 12.

Meteorological disaster warning of dry hot wind.
The decision service module puts forward technical measures such as soil improvement, crop planting, pest and disease control through comprehensive analysis of historical and real-time data. It provides scientific basis for government, enterprises and farmers’ production management and decision-making.
The agricultural microclimate monitoring system has been applied to China coastal and desert areas, covering Ulanbuh, Kubuqi Desert, the Taklimakan, alpine area and Tibetan plateau, the area is dry and hot, few people tread. The system has been running for one year (2016.8-2017.12), and a total of more than 100 thousand microclimate records have been collected. The site installation is shown in Fig. 13.

Field microclimate collection equipment.
Aiming at the status quo of agricultural IoT applications, the functions and performance requirements of the farmland microclimate automatic monitoring system were comprehensively analyzed. With reference to the latest IoT architecture, the microclimate monitoring system for farmland was designed based on six aspects: user domain, target object domain, sensing control domain, service provision domain, operation and maintenance maintenance control domain and resource exchange domain. The system is highly integrated with wireless communication technology, wireless sensor network technology and data mining technology, and has a high degree of practicality. The farmland climate monitoring system based on wireless sensor network is mainly composed of three parts: data acquisition system, data storage system and big data visualization analysis platform. The wireless sensor network acquisition system is highly integrated with data acquisition and data transmission capabilities. It collects microclimate factors such as temperature, humidity, rainfall, wind speed and direction, soil temperature and humidity, light intensity, soil salinity, and soil pH in real time. At the same time, the big data visualization analysis platform provides users with real-time online mining analysis, monitoring, early warning and decision support services. It supports for the early warning of agricultural environmental disasters and provides a scientific theoretical basis for analyzing the microclimate law of farmland. Finally, through practical application, the problems arising from system debugging are classified, analyzed and solved from the perspective of network interference and software debugging, which ensures the stability and reliability of data transmission. The system has been successfully applied to coastal and desert areas in China.
To some extent, the system has solved the problem of monitoring the microclimate. In the next step, we need to make full use of the data and combine the intelligent control of agricultural machinery to realize the remote farming land management. Considering the future of the actual production process, we explore the optimal decision-making problem under different environments and maximize the use of modern technology to liberate people from heavy agricultural labor and improve the quality and production of agricultural products to the maximum extent.
Footnotes
Acknowledgments
This work was financially supported by Shandong independent innovation and achievements transformation project (2014ZZCX07106).