
Abstract
Sea squirts are cultivated mainly in Korea, Japan, and China. Sea squirt sorting during the harvesting process is labor-intensive and time-consuming as there is no automatic sorting technology for sea squirts. In this study, we developed and evaluated an automatic sea squirt sorting algorithm based on sea squirt color information analyzed using the hue-saturation-value (HSV) color model and the regression equation of the projected area and weight of the sea squirt. The developed algorithm recognizes sea squirts during the sorting process based on the threshold range of sea squirt color values and their weight based on measurements of the projected area. In 100 repeated experiments conducted with mixed products containing sea squirts, mussels, and Styela clava, the average sea squirt recognition rate of the developed algorithm was 98.5%, and the sorting performance based on animal weight and grade was ≥95.5% at an average speed of 1,050 kg/h.
Introduction
Sea squirts are harvested through separation, sorting, washing, and shipment. These tasks are predominantly performed manually.
In South Korea, the manpower required for the sea squirt harvesting process is 10–14 persons per crew, depending on the size of the aquafarm. Approximately 50% of the manpower is deployed for sorting, which has a high work volume and intensity. Sea squirt sorting, which involves filtering byproducts such as mussels, Styela clava, and starfish and classifying sea squirts with high product value as large or small, is currently performed by visual inspection, which depends on the empirical judgment of the sorter. Because the sorting criteria are highly subjective according to individual experience, this method not only lowers the reliability of the sea squirt quality and the added value, but also makes it difficult to anticipate smooth production during seasons with high sea squirt yields. Consequently, sea squirt aquafarms require technological advances to improve the efficiency of sea squirt sorting and to increase the income of fishery households. However, because sea squirts are primarily produced in Korea, Japan, and China, the demand for technology development is low, and there are technical limits to grading sea squirts while filtering byproducts at the same time. Thus, sea squirt sorting technology has not been developed, even though automatic sorting technologies are being developed for other types of fish with large production levels.
Much research has been conducted on the development of automatic sorting technology for fish. Research has been focused on classifying fish types and sizes by introducing image processing technology to automatically measure fish features [1, 2]. Technology based on image processing has also been developed to measure the volumes and weight of abalone and sea cucumber [3, 4] and to grade salmon quality [5]. Lee et al. [6] developed a method to automatically vaccinate fish using a Cartesian robot after the characteristics of the fish are measured. Thus, image processing technology, which has been applied to manufacturing and production processes for standardized products, is now rapidly spreading to other industries, including the sorting and quality inspection of farming and livestock products [7–9].
In the area of agriculture, Miller and Delwiche [10] used image processing technology to grade peaches by measuring the distribution of pink or red colors on the peach surface. Sarkar and Wolfe [11, 12] used the same technology to grade tomatoes according to size, shape, color, and surface damage. Studies have also been conducted in which the color and size of strawberries, apples, and lemons are measured to determine their quality and for sorting [13–16].
In the livestock industry, image processing technology has been used to grade beef by its marbling [17, 18] and inspect poultry for fecal contaminants in real time [19].
In this study, an algorithm was developed that automatically sorts sea squirts by weight through color information analyzed with the hue-saturation-value (HSV) color model and a regression equation of the projected area and weight of the sea squirts. The performance of this algorithm was evaluated by utilizing it in an automatic sea squirt sorting system fabricated in this study.
Materials and methods
Experimental sample
In this study, 2443 sea squirts were selected as experimental samples to analyze their color values and the developed algorithm. The weight range of the sea squirts was between 5.4 g and 210 g, and they were harvested over the period February to June 2017.
Analysis of the sea squirt color and measurement of the projected area
During the sea squirt harvesting process, byproducts such as mussels and S. clava are also produced. In order to design an algorithm that distinguishes sea squirts and automatically sorts them by estimating their weights through image processing technology, the colors of the sea squirts were analyzed using the HSV color model, and the projected areas and weights of the experimental samples measured.
Sample images with the background colors removed were first created for each experimental sample. Then, the H, S, and V components were extracted and threshold values derived. Next, the ratio of the area in which the sea squirt color information was distributed (CA: color area) in the sea squirt projected area (PA: projected area) was examined, as shown in Fig. 1 and Equation (1), under the specified threshold condition. The area with the sea squirt color information distribution was binarized into white for the area that met the HSV threshold and black for the other areas. Then, the number of white pixels was multiplied by the unit pixel area.

Projected image of sea squirts from CCD camera: (a) Original image; (b) sea squirt color area selected from the projected area under the HSV threshold setting.
The projected area of the sea squirt was measured and its weight estimated by analyzing the correlation between its projected area and weight based on the least squares method [20]. This correlation can be expressed as the following regression equation in exponential form:
where a and b are regression coefficients and PA is the projected area of the sea squirt.
The automatic sea squirt sorting algorithm was designed to analyze the sea squirt color information by using the HSV color model, selectively recognize sea squirts based on the analysis results, and automatically sort them into three grades, large, medium, and small, as outlined in Fig. 2. Furthermore, sea squirt and product lumps beyond the capacity of the automatic sea squirt sorting system were assumed to be sufficiently handled on the belt conveyor manually. Four workers manually separated sea squirt lumps and filtered large products such as mussel lumps.
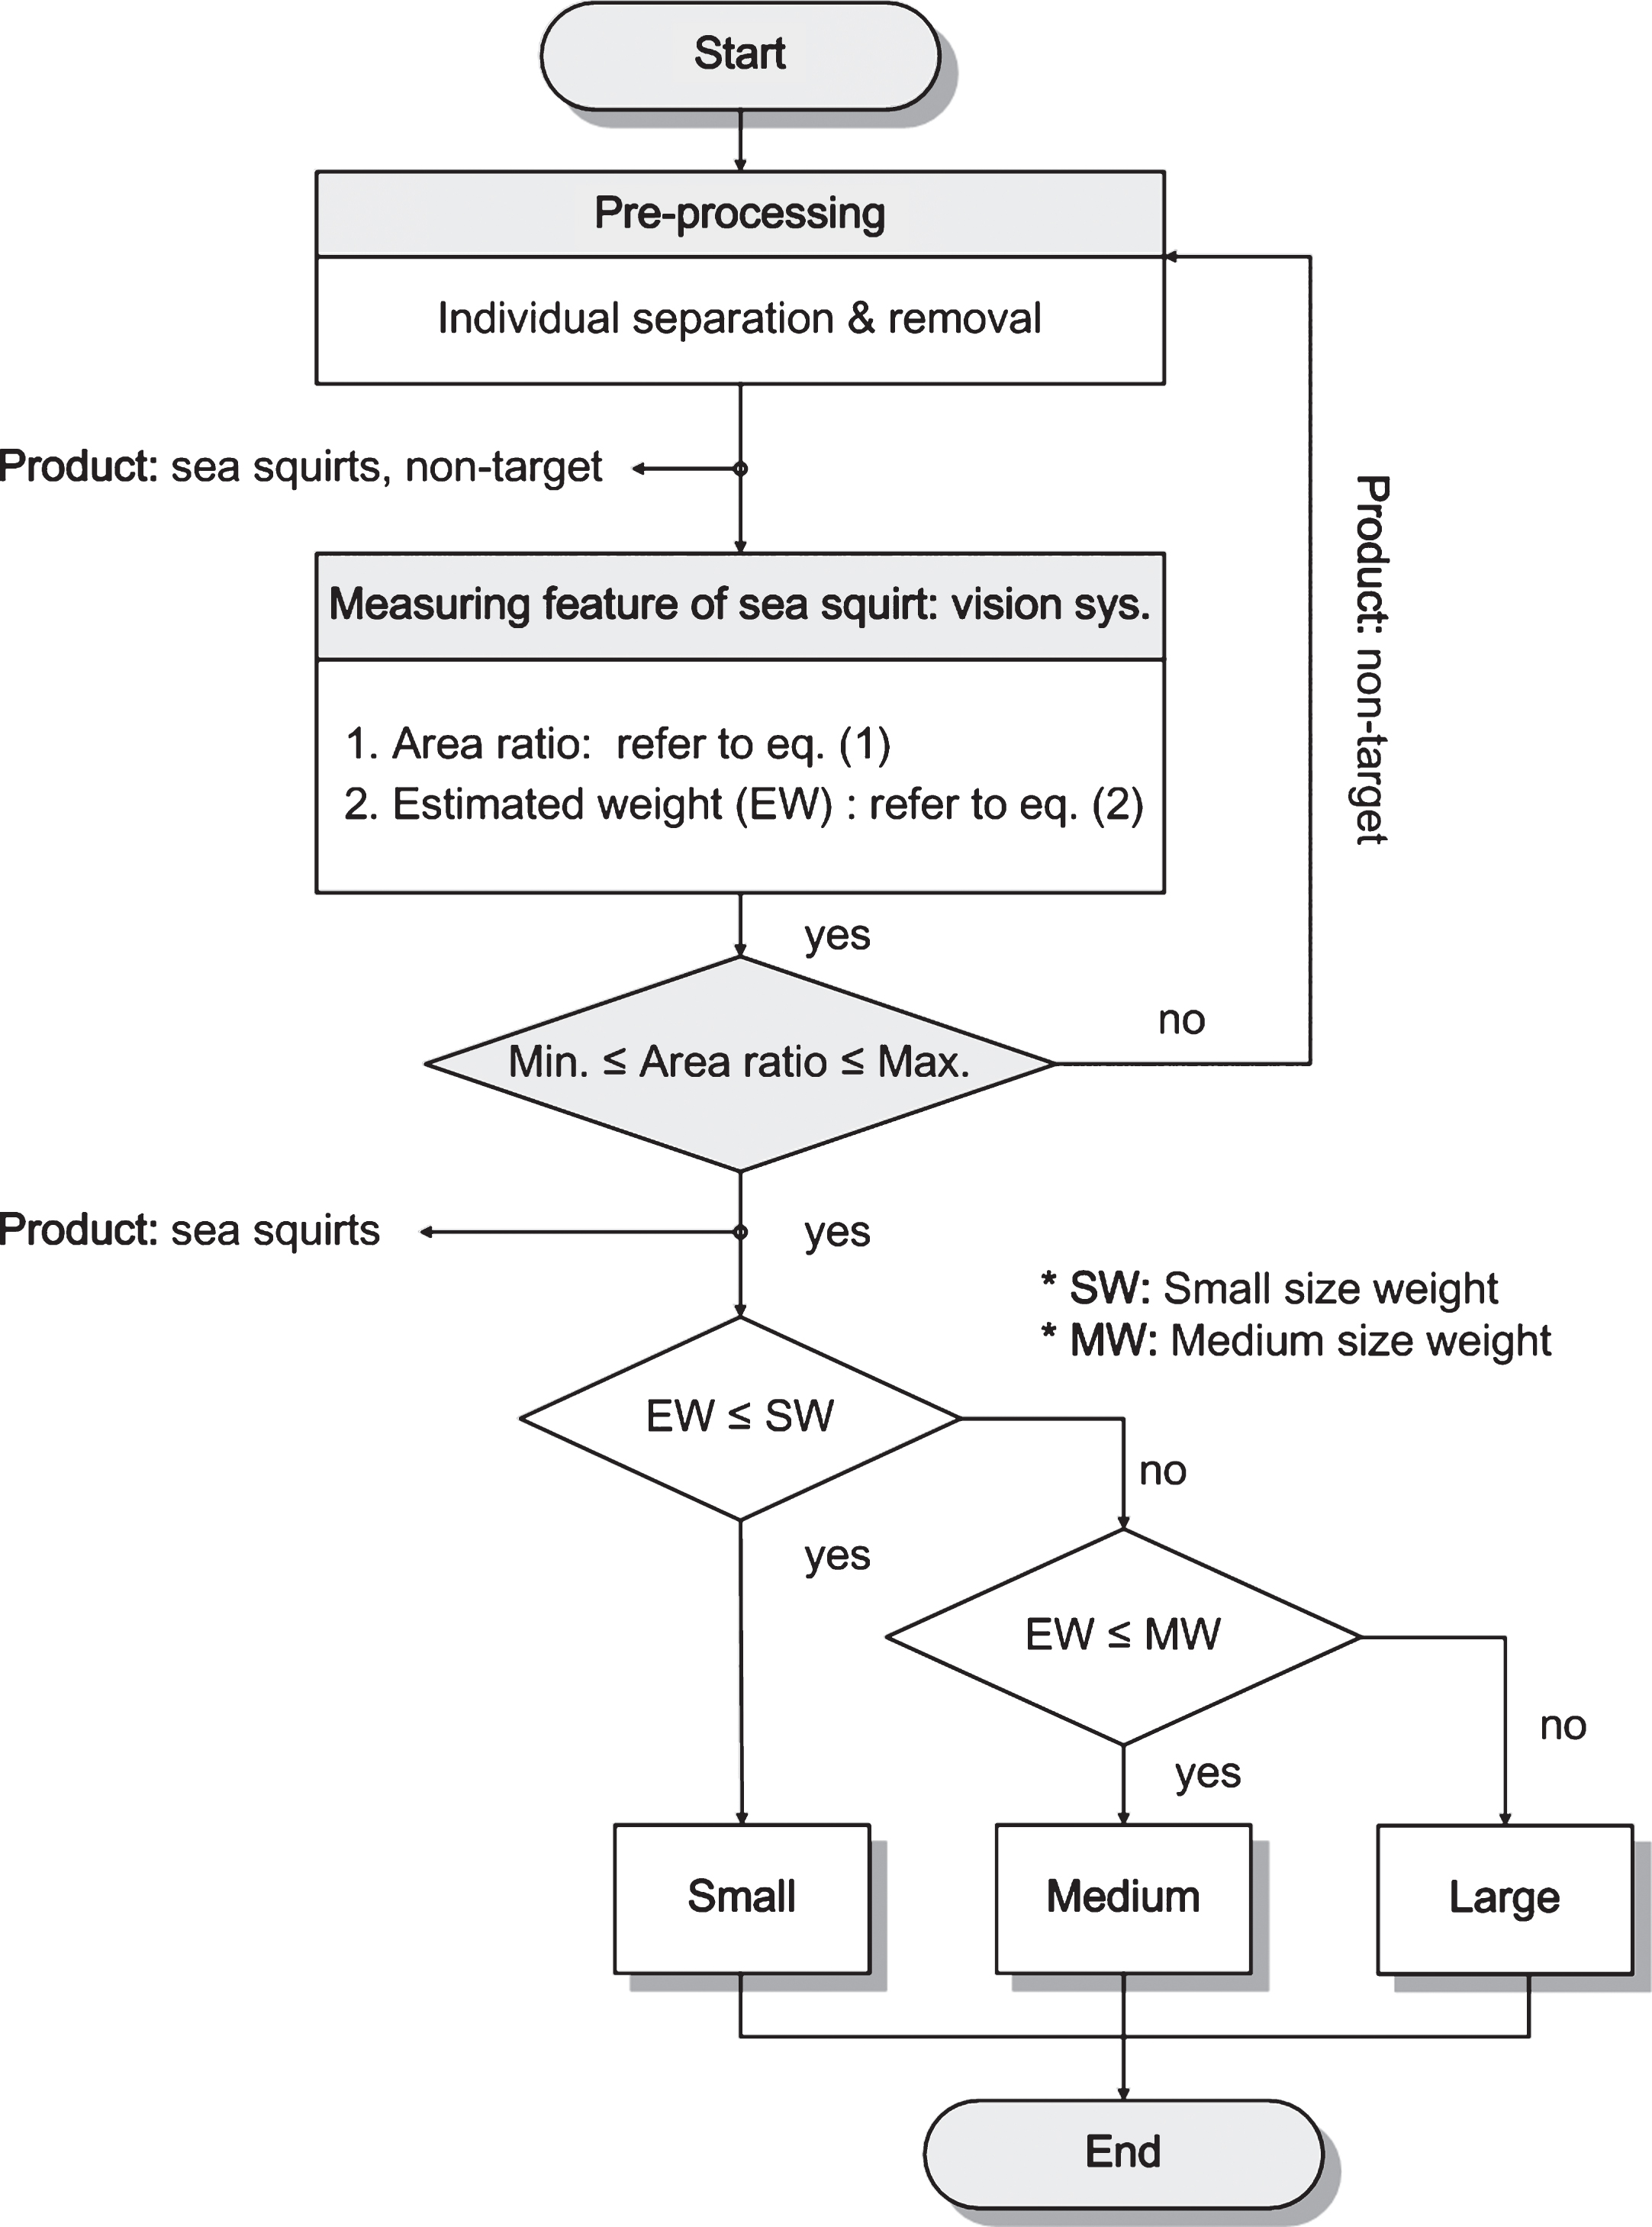
Flowchart of the automatic sea squirt sorting algorithm.
The automatic sea squirt sorting algorithm is designed to distinguish sea squirts from a mixture of sea squirts and other products based on the threshold set for the ratio of the distribution area of the sea squirt color information to the projected area of a sea squirt. After the weight of a recognized sea squirt is estimated with Equation (2) according to the measured projected area, it is automatically sorted by weight into one of three grades: large, medium, or small. Subsequently, the unremoved products and sea squirts unsorted because of recognition error are transported to the belt conveyor for manual processing and sent to the feedback belt conveyor to be reprocessed.
The automatic sea squirt sorting system is composed of a machine unit for transporting, sorting, and discharging sea squirts; an inspection unit for recognizing sea squirts and other products; and a control unit for the inspection and machine units.
Figure 3 is a schematic diagram of the automatic sea squirt sorting system. The machine unit comprises a conveyor belt, a line-up device, a washing device, and actuators to sort and discharge sea squirts into large, medium, and small grades. The inspection unit comprises a charge-coupled device (CCD) color camera (Omron Corp., FH-SC), controller (Omron Corp., FH-1050), a display monitor, and a LED backlight. The CCD camera and a 30W LED backlight are installed in the illumination chamber, which is tunnel-shaped to avoid the effect of non-uniform illumination by external light.
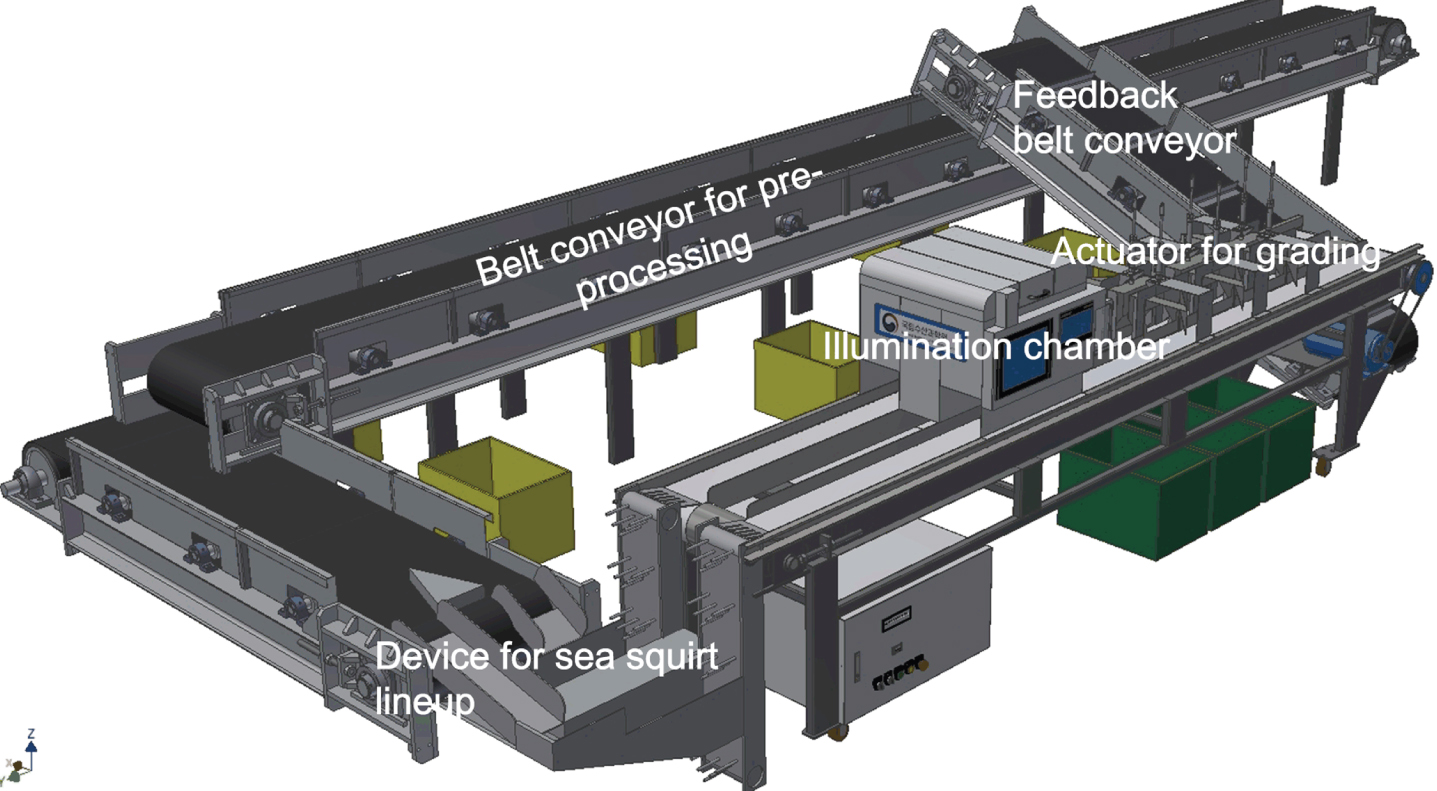
Prototype of the automatic sea squirt sorting system.
Table 1 lists the specifications of the CCD camera and inspection conditions.
CCD camera specifications and inspection conditions
The control unit comprises a programmable logic controller (PLC) to handle sea squirt image capture trigger signals and discharge signals by the sorting section and a touchscreen for controlling the conveyor belt speed and setting the sea squirt discharge signal times.
Based on the sea squirt color analysis results, the automatic sorting algorithm was designed according to the threshold derived for the ratio of the sea squirt projected area to the sea squirt color distribution area and the regression equation for the projected area and weight. An experiment was conducted to evaluate the performance of the algorithm.
As presented in Table 2, the sea squirt recognition and automatic sorting performances were evaluated with the experimental samples.
Experimental samples for automatic sea squirt sorting performance tests (unit: number of individual)
Experimental samples for automatic sea squirt sorting performance tests (unit: number of individual)
*The sea squirts were sorted by weight using the following criteria: Small(S) ≤ 55 g, 56 g ≤ Medium(M) <70 g, Large(L) <71 g.
The sea squirt recognition performance was evaluated by analyzing the sea squirt recognition rate after a mixture of sea squirts and other products including mussels and S. clava was supplied to the automatic sea squirt sorting system. The sea squirt recognition rate can be represented as the percentage of the number of actual sea squirts (T
n
) to the number of samples (R
n
) recognized as sea squirts by the automatic sea squirt sorting algorithm:
The automatic sea squirt sorting performance can be represented as the percentage of the number of samples (S
p
) corresponding to the sorted grade to the number of samples (S
g
) sorted to each grade by the automatic sea squirt sorting system after the weight criteria are set (small ≤ 55 g, 56 g <medium ≤ 70 g, 71 g <large):
The sea squirt recognition performance and automatic sea squirt sorting analysis experiment was performed 100 times.
Results of sea squirt color analysis and projected area measurement
For the sea squirt color analysis, the white balance was adjusted in the vision system for accurate color reproduction. Then, the histograms for extracting the H, S, and V components of each sea squirt sample image were averaged, as shown in Fig. 4.
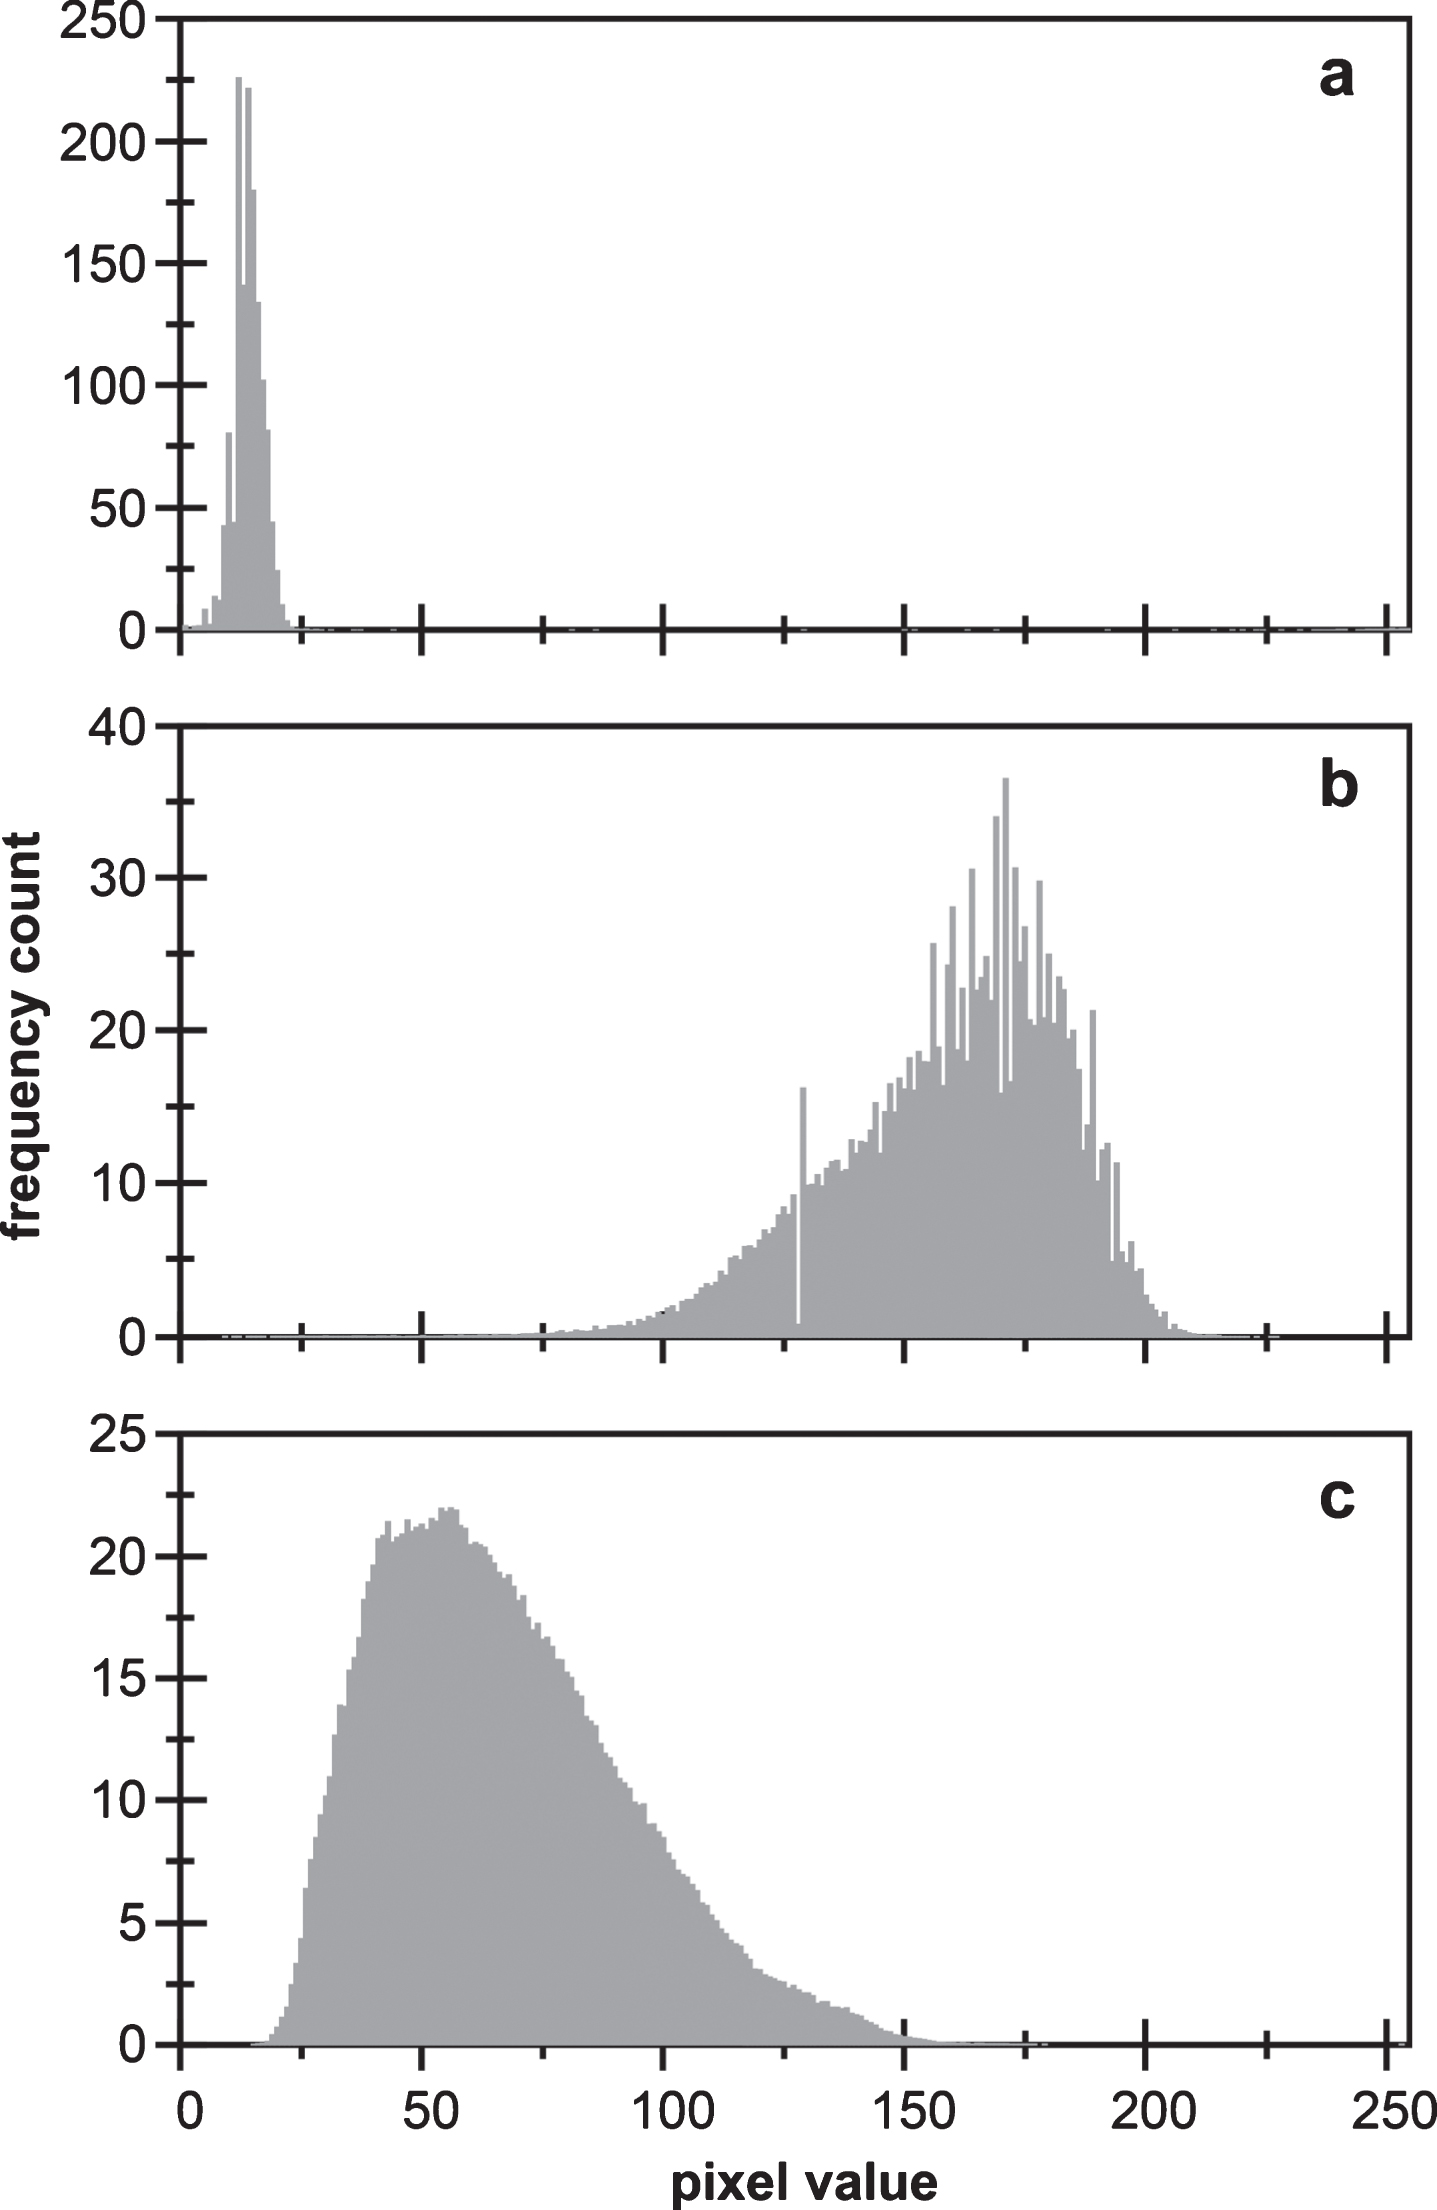
Sea squirt color analysis using the HSV color model: (a) hue; (b) saturation; (c) value.
According to the sea squirt color analysis, the H value (i.e., color) ranged from a minimum of zero to a maximum of 27 and showed a red color on average. The S value (i.e., saturation) had a wide range with a minimum of 65 to a maximum of 210. The V value (i.e., brightness) ranged from a minimum of 18 to a maximum of 156. The mode was near to the pixel value of 56, and the brightness was slightly low. The HSV color analysis results showed that most sea squirts have very similar color information. This factor clearly distinguishes sea squirts from other products such as mussels, S. clava, and starfish. This played a critical role in the construction of the sorting algorithm.
Figure 5 shows a histogram of the ratio of the sea squirt color distribution area to the projected area, as given in Equation (1), after the thresholds were set for the H, S, and V components. The experimental results show that the area ratio ranges from 0.90 to 0.99. The average and standard deviations were 0.945 and 0.011, respectively. The mode was 0.947. The minimum, median, and maximum values were 0.901, 0.945, and 0.986, respectively. The experimental results confirmed that most of the sea squirt color information analyzed with the HSV color model is included in the projected area. Some parts of the projected area did not include the sea squirt color information because of the completely different colors from the sea squirt due to clay on the roots or adhering shellfish. Therefore, a sufficient washing process is required to selectively distinguish sea squirts and other products accurately. These experimental results based on sea squirt color analysis can also be utilized to determine the freshness of sea squirts or sort damaged objects or objects with no product value.
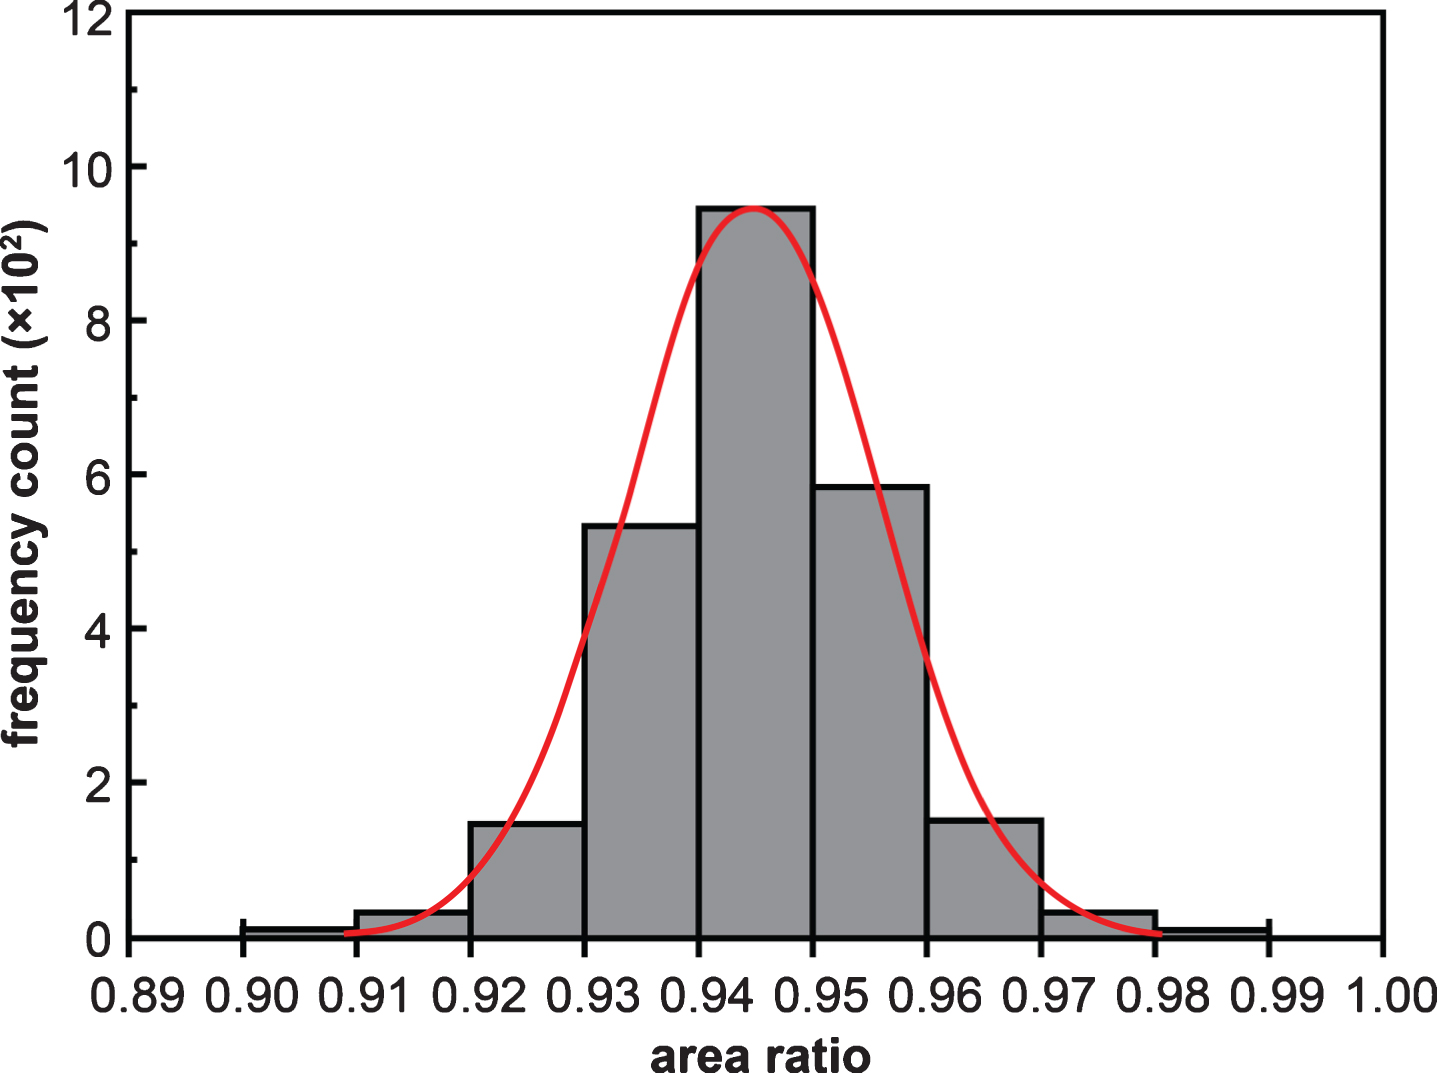
Histogram for the ratio of the sea squirt color distribution area in the projected area.
To estimate the sea squirt weight, the projected area and weight of the sea squirts were measured, and their correlation analyzed with the regression equation defined in Equation (2) and using the Origin Pro 9.0 software (USA), as shown in Fig. 6. The scattered black dots represent the weight by the projected area of sea squirts. The red curve was obtained via regression analysis. The regression coefficients a and b were determined to be 2.95× 10⁻⁴ and 1.51, respectively, and the correlation coefficient (R2) was determined to be 0.95.
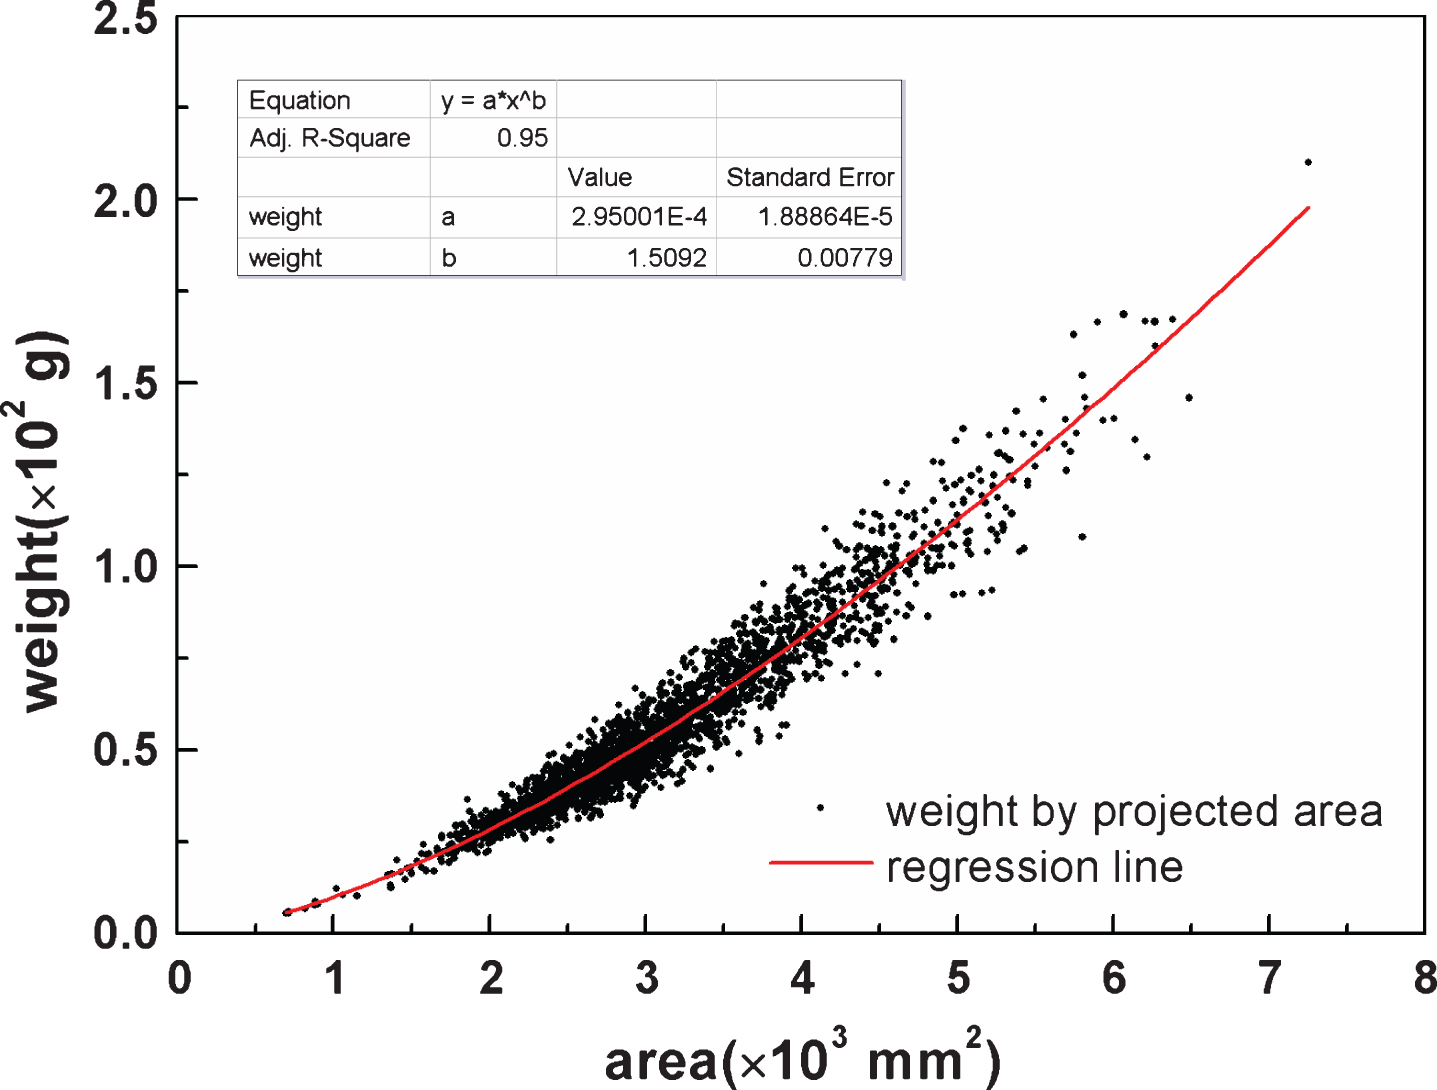
Regression analysis for the projected area and weight of sea squirts.
This method of estimating the weight through measurement of the projected area has been used for fish by many researchers. In a previous study for Alaska Pollack, R2 values for estimated weight based on the projected area were between 0.985 and 0.993 depending on the type of regression used. In this research, the R2 value, 0.95, is slightly lower than that of the Alaska Pollack study [20]. This is because the shapes of sea squirts are not fixed; their projected area varies according to their position on the conveyor belt even for the same sea squirt. Further, living sea squirts have different weight measurements even with the same projected area because they hold water in their body. One solution to this problem is to estimate the weight by analyzing the correlation between the projected area and the measured weight according to possible positions of a sea squirt on the conveyor belt. Another method is to estimate the weight by measuring the volume of the sea squirt through three-dimensional measurement methods using laser and image processing techniques [21]. This method is very accurate, but construction of the measurement system is complex, and the calibration method is difficult. Moreover, a complex process is required to collect the tomography image data and reconstruct the surface.
The sea squirt recognition and automatic sorting performances were analyzed by setting a threshold range (0.90–0.99) for the ratio of the color distribution area to the projected area of the sea squirt based on regression analysis of the projected area and weight of sea squirts.
Table 2 lists the results of 100 repeated experiments with the experimental samples. The average and standard deviation for the sea squirt recognition rate were 98.5% and 0.72, respectively (see Fig. 7). The mode was 98.5%, and the minimum, median, and maximum values were 97.1%, 98.5%, and 99.2%, respectively.

Sea squirt recognition rate based on the ratio of the area of the sea squirt color distribution area in the projected area of the sea squirts.
The automatic sea squirt sorting performance was represented as a percentage for each sea squirt grade after the projected area value was set. The sorting experiment was performed according to the weights specified as large, medium, and small grades. The results of the sea squirt sorting experiment by grade revealed an accuracy of least 95.5%. No significant difference in the sorting performance was observed by grade, but a slightly higher sorting performance was observed for small sea squirts than large ones. This result appears to be because the small sea squirts generally had uniform shapes compared to the large sea squirts, and the increase in weight diverged from the increase in external size as the sea squirts grew. The sea squirt sorting speed was approximately 1050 kg/h, which is an improvement of approximately 31% compared to the conventional sorting speed by hand (800 kg/h). Whereas the current sorting process requires at least 10 workers, the new prototype system only needs eight workers. This indicates that the manpower can be reduced by 20% compared to the current system.
An automatic sea squirt sorting system was developed by using image processing technology, and the sea squirt recognition and sorting performances were evaluated for sea squirts and byproducts.
The color, projected area, and weight of sea squirts were measured to distinguish between sea squirts and byproducts and to estimate the weight of sea squirts. The HSV color model was used to measure the sea squirt color, and the thresholds of the components were derived. Sea squirts and byproducts were distinguished by setting a threshold (0.90–0.99) for the ratio of the sea squirt color distribution area to the projected area, which was selected from the thresholds set for the H, S, and V components.
The sea squirts were sorted by weight, which was estimated by analyzing the correlation between the projected area and weight and deriving a regression equation. In experiments, the average sea squirt recognition rate and sorting accuracy were 98.5% and 95.5%, respectively. The automatic sea squirt sorting speed was 1050 kg/h, which is a 31% improvement compared to the conventional sorting speed.
The successful experiment with the prototype automatic sea squirt sorting system confirms that the proposed process can reduce the required manpower by around 20% compared to the conventional system. Thus, the results of this study showed that image processing technology can be useful for the automatic sorting of sea squirts. These results can be used to improve the poor work environment by automating the sea squirt harvesting and sorting work, which is currently done completely by hand. In addition, the proposed system can increase the added value of sea squirt production by inspecting quality while sorting sea squirts and other marine products based on the measured shapes and colors.
Footnotes
Acknowledgment
This work was supported by a grant from the National Institute of Fisheries Science (R2018041) in Korea and was also a part of the project titled ‘Development of automated harvest and grading system for sea squirt’, funded by the Ministry of Oceans and Fisheries, Korea.